Page 1
Chapter 2
Methodology, Simulation and Prediction
2.1 Methodology
As a pre requisite the problems of the station were identified and cause-effect
relationship was established to reach to the solution. Manipulative experiments were
particularly useful in demonstrating cause and effect of chemical contamination (Stark et
al., 2003a; Thompson et al., 2007). In this regard following basic steps were selected to
define methodology;
▪ Identification of sources of the problem
Selection of the parameter to evaluate and quantify the pollution indicators
• Designing of the sample points and cycle of collection
• Establishment of Environmental Laboratory at Maitri
.11. Selection of standard methods and procedure for analysis
Ai Application of the tertiary treatment at Maitri station
• Laboratory-scale experiment opting tertiary treatment
• Prediction of wastewater impact by mathematical modelling software
• Designing of ancillary treatment units for "Maitri"
Suggestions for advance treatment units
2.2 Approach to Identify Problems
Being cold climatic conditions at Maitri in Antarctica, biological wastewater treatment
40
Page 2
system (Rotating Biological Contactor) has to be assessed frequently for its efficacy while
it operates for long, so that effective decision can be taken if improvisation is required. At
Maitri station the drinking water source is Priyadarshini Lake (Zub Ozero) which remains
in melted form only for around two months and rest of the year it freezes. However,
below three meters of ice water remains unfreezed at lower layer so it caters the water
requirement of the station throughout the year. It is also interconnected with glacial lakes
and intermixing of gray water through chain contamination has to be considered. In this
regard water quality of lakes is required to be assessed.
2.3 Assessment of Water Abundance at Priyadarshini Lake
Priyadarshini Lake covers an area of 0.29 Km 2 and forms the major source of water
supply to the Maitri station (Ingole and Parulekar, 1990). The lake is situated about 150
m away from the Indian permanent research station "Maitri" towards north. The volume
of the water fluctuates between 1.7 m 3/day, in winter and 5.7 m 3/day, in summer. The
consumption of water at Maitri is relatively more in austral summer compared to the rest
of the year. The number of consumers is more during summer as total strength reaches
to around 65-75 in a day (Tiwari and Nayak, 2007). It is during the austral summer that
most of the scientific activities are carried out.
2.3.1 Area Measurement
Ingole and Parulekar (1990) estimated the area of the Priyadarshini Lake as 0.297 km 2 .
In January 2000' Global Positioning System (GPS) of make Corvallis Microtechnology
Inc. version 2.4 was used as a mapping tool without differential correction (MC-GPS,
1996) to mark the boundary of the lake. The accuracy of this instrument was quoted 10-
30 meters. In the last week of January when the ambient temperature was around -4 to -
2 °C and there was no inflow of water, instrument (GPS) was calibrated with necessary
inputs and it was set to record the position of the point for every five second. Holding
the GPS handheld positions of the points were recorded moving on foot close to edge of
the water around the lake keeping the instrument vertically above the water except few
points where easy approach was not possible. After getting all the coordinates it was
converted into graphical data and with the application of GPS and SURFER total area
41
Page 3
was computed.
2.3.2 Depth Measurement and Volume of Lake
Before feeding of glacial melt water the depth of water at various places were recorded
using the marked string with around 2 kg weights which was attached at bottom to keep
the string vertically over the point. Using the inflatable boat and GPS wherever depth
was measured, coordinates were recorded above those points at 55 locations within the
lake. Care was taken to lower the string gradually into water so as to avoid penetration
into algal mats which was present at the bottom of the lake. As soon as the string was
slack the depth was recorded. Maximum depth recorded was 7.2 m at middle of the
lake.
2.3.3 Additional Feed Water Measurement
The volume of water of Priyadarshini lake never remains the same because of the
Schirmacher glacier which is around 1200 m away from the lake and melts when
ambient temperature reach as to +1 to +5 °C for couple of days. This melted water
joins glacial lakes formed adjacent to glacier and from these lakes ultimately it joins
Priyadarshini Lake. After reaching certain level, the water outflows from Priyadarshini
Lake into adjacent lake. To measure the inflow into the lake two iron rods at the bank of
the lake were fixed at two feet distance. A cotton string was tightened in between the
iron rods and leveled with the help of spirit level, keeping in view that it just touches to
the water surface level when there was no inflow into the lake when the ambient
temperature recorded was -2 °C. After a few days when temperature starts raising the
glacier starts melting and the melt water starts feeding into Priyadarshini Lake through
connecting glacial lake, daily at the evening increment in height of water level of the lake
water was measured over the string using a scale.
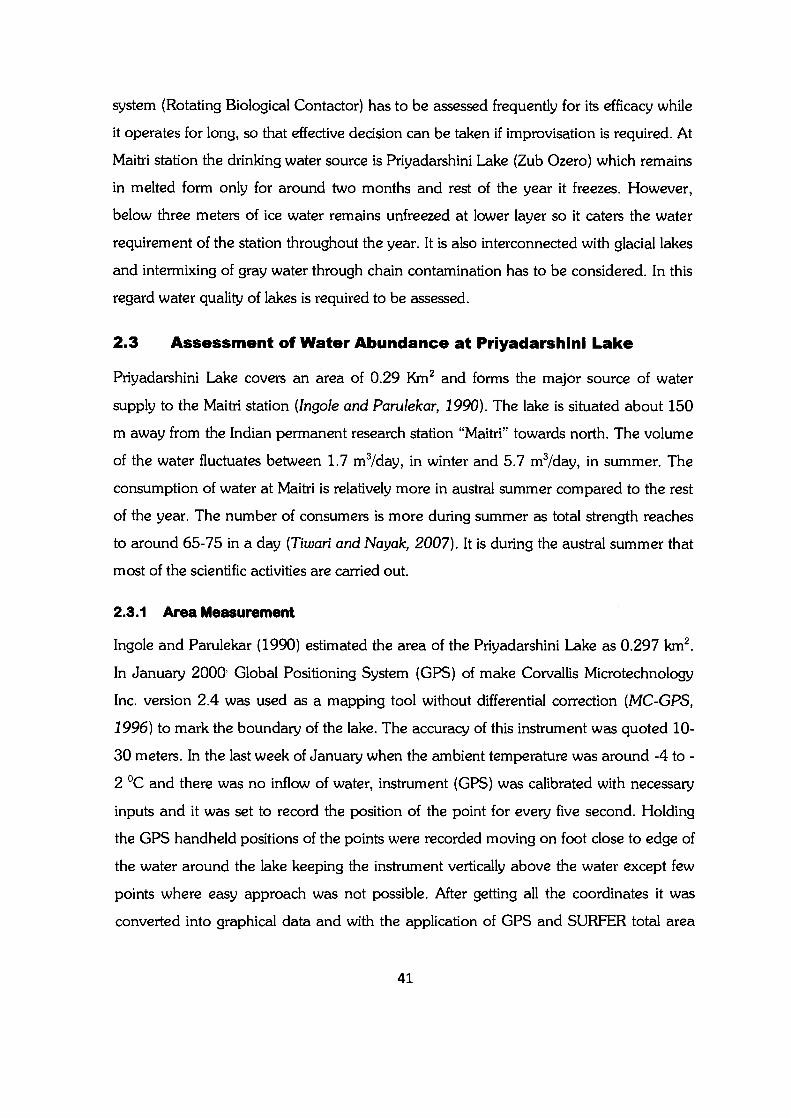
From 2t January to 29 th January 2000 (Figure 2.1) the water level recorded
continuously showed an increase in water level till 21st January, there after that it
slightly increased till 27t h January and remained constant for 3 days . It was noted that
the excess water started diverting to a connecting lake situated downward side of the
Priyadarshini Lake and after three days temperature went down and glacier melting
42
Page 4
stopped which barrier feeding of water into the lake. Maximum air temperature recorded
on 9th and 20th January, was +4.4 °C. This lake has also got an outlet through which
access water passes to a channel and ultimately joins other lake at lower level, this
happens when water level raises close to 23 cm.
Figure - 2. 1 : Daily water increment in Priyadarshini Lake
E E c . _ 7) 2 IA.
i
25
20
15
io
5
0
`I'cs l'cs `I'cs 4' SI'cs l'cs `I'cs `I'cs
Day
`I'cs I'cs "cs ''cs "cs 1'cs
2.4 Waste Generation
2.4.1 Sources of Gray Water in Maitri
The Indian research station Maitri is situated at higher elevation (117 m above msl) in
comparison to the Priyadarshini Lake (113 m above msl), which is drinking water source
for Maitri (Ghosh and Ramteke, 1997; Tiwari et al., 2006). This is the only source of
drinking water which can cater the water requirement throughout the year, even in the
winter condition. This water is used at various utilities of station i.e. boilers, drinking
purpose, bathroom, washbasin, sink, kitchen, laboratory etc. which ultimately generates
gray water. There is no black water generated as wet toilets are not in use at Maitri.
2.4.2 Liquid Waste Disposal and it's Consequences
Liquid waste obtained from bathroom, laundry room, washbasin, urinal and kitchen is
sent into two different Rotating Biological contactors (RBC), made in UK by Klargester
43
Page 5
Company, popularly known in Maitri as Klargester (Kee, 2004). These two RBC's are
kept separately outside Maitri in a closed wooden chamber. Effluent obtained from these
RBC's is discharged into a collection pond, dug adjacent to these chambers. Effluent
disposal pipes are enclosed with heat tracing element to avoid freezing during subzero
temperature. The fate of liquid discharge is summarized below;
Treated waste from the pond is disposed and discharged on open land around 320 m
away from the pond. Further down to discharge point, lakes are situated and they get
inter-connected during summer once the glacier melted water feed these glacial lakes,
they overflow and join each other. There is a probability of contamination of
Priyadarshini Lake through this chain.
Priyadarshini Lake is situated 150 m away in front of wastewater collection pond at
lower level. During summer period when frozen effluent melts it seeps from pond and
joins Priyadarshini Lake.
4, Therefore, final discharge point of the effluent is not fulfilling the criterion of the
environmental protocol
2.4.3 Solid Waste Contamination in Lake
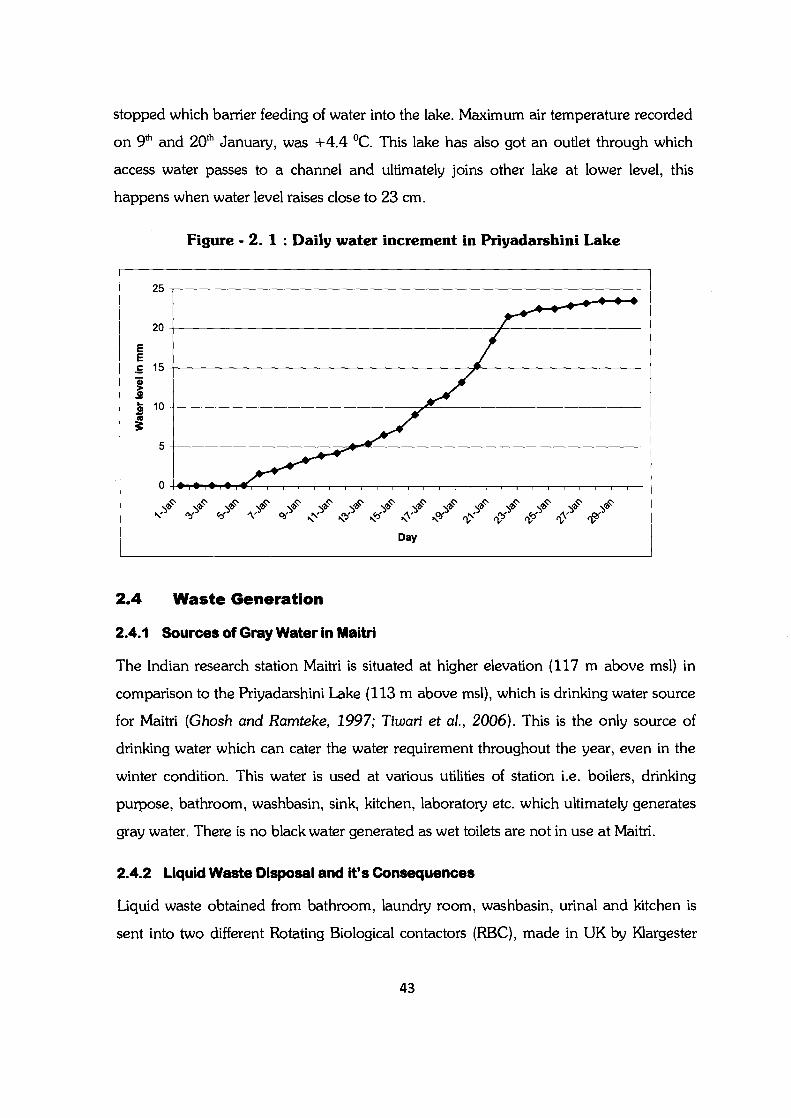
During summer period around 60-70 persons stay at Maitri and in the adjoining summer
huts (Figure 2.2) which are built in front of the Maitri, and during winter round 25
people live in Maitri station. Solid waste mainly generates from the kitchen waste which
is semi solid food waste and organic in character. Other sources include packing material
in the form of wood, cartoons tetra packs etc. Fuel operated incinerator based toilet
modules are used to burn excreta, which are used during summer camps and placed
around 150m away in northern side of the station and few are placed at western side
of the main building. Incineration process emits particulate matters and gases.
Sometimes it is noticed that excreta is not burnt properly and during ash collection and
disposal it creates threat to mix (suspended particles) with lake water due to high wind.
Similarly, packing material not kept in closed area, are threats to disperse around Maitri
in a large area as well as submerging into surrounding lake water (Ghosh et al., 1997).
44
Page 6
Figure - 2. 2 : summer Huts at Maitri
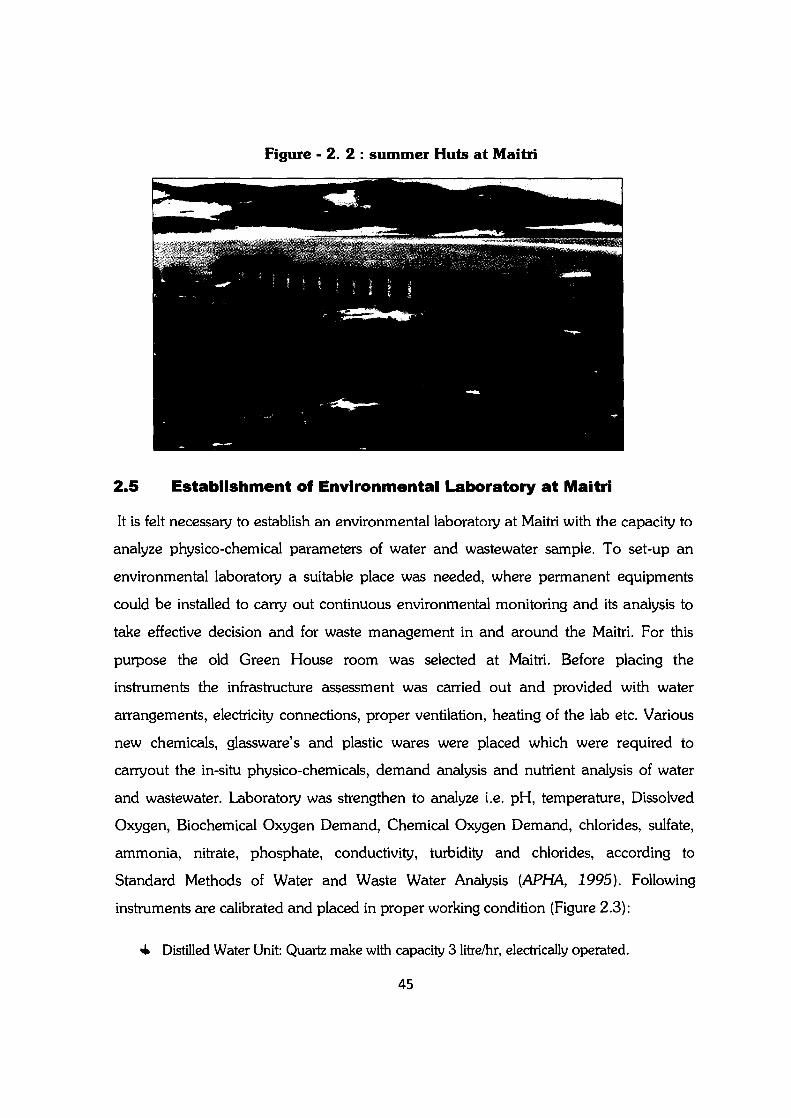
2.5 Establishment of Environmental Laboratory at Maitri
It is felt necessary to establish an environmental laboratory at Maitri with the capacity to
analyze physico-chemical parameters of water and wastewater sample. To set-up an
environmental laboratory a suitable place was needed, where permanent equipments
could be installed to carry out continuous environmental monitoring and its analysis to
take effective decision and for waste management in and around the Maitri. For this
purpose the old Green House room was selected at Maitri. Before placing the
instruments the infrastructure assessment was carried out and provided with water
arrangements, electricity connections, proper ventilation, heating of the lab etc. Various
new chemicals, glassware's and plastic wares were placed which were required to
carryout the in-situ physico-chemicals, demand analysis and nutrient analysis of water
and wastewater. Laboratory was strengthen to analyze i.e. pH, temperature, Dissolved
Oxygen, Biochemical Oxygen Demand, Chemical Oxygen Demand, chlorides, sulfate,
ammonia, nitrate, phosphate, conductivity, turbidity and chlorides, according to
Standard Methods of Water and Waste Water Analysis (APHA, 1995). Following
instruments are calibrated and placed in proper working condition (Figure 2.3):
♦ Distilled Water Unit: Quartz make with capacity 3 litre/hr, electrically operated.
45
Page 7
• Soxlet Extraction Mantle with Digestion Unit: Six mantel type (100 °C).
• B.O.D. Incubator: Digitally controlled, with temperature range 5 °C to 60°C and accuracy
+ 0.5°C.
4 Hot air Oven: Range 5 °C to 450°C, digitally Controlled.
• Muffle furnace: Digitally Controlled, maximum temperature 1150°C.
4 Magnetic Stirrer with Hot Plate: 2 litre capacity with energy regulator.
‘11. Turbidity Meter: Range 0 to 100 NTU with 0.1 NTU resolutions and with tungsten lamp.
NI. Conductivity Meter: Digital display with automatic temperature compensation.
• pH Meter : Range 0 to 14, digital display with automatic temperature compensation.
4 Digital Spectrophotometer: Range 340 — 960 nm, with resolution 1 nm.
4 Analytical Balance: Sartorius make maximum capacity 200 grams, 4 digits auto calibrate
with 1 mg accuracy.
• Heating Mantle: Maximum surface temperature of 450° C, controlled by a built - in
energy regulator.
Figure - 2. 3: Environmental Laboratory at Maitri
46
Page 8
2.6 Sample collection Locations
2.6.1 Water Sample
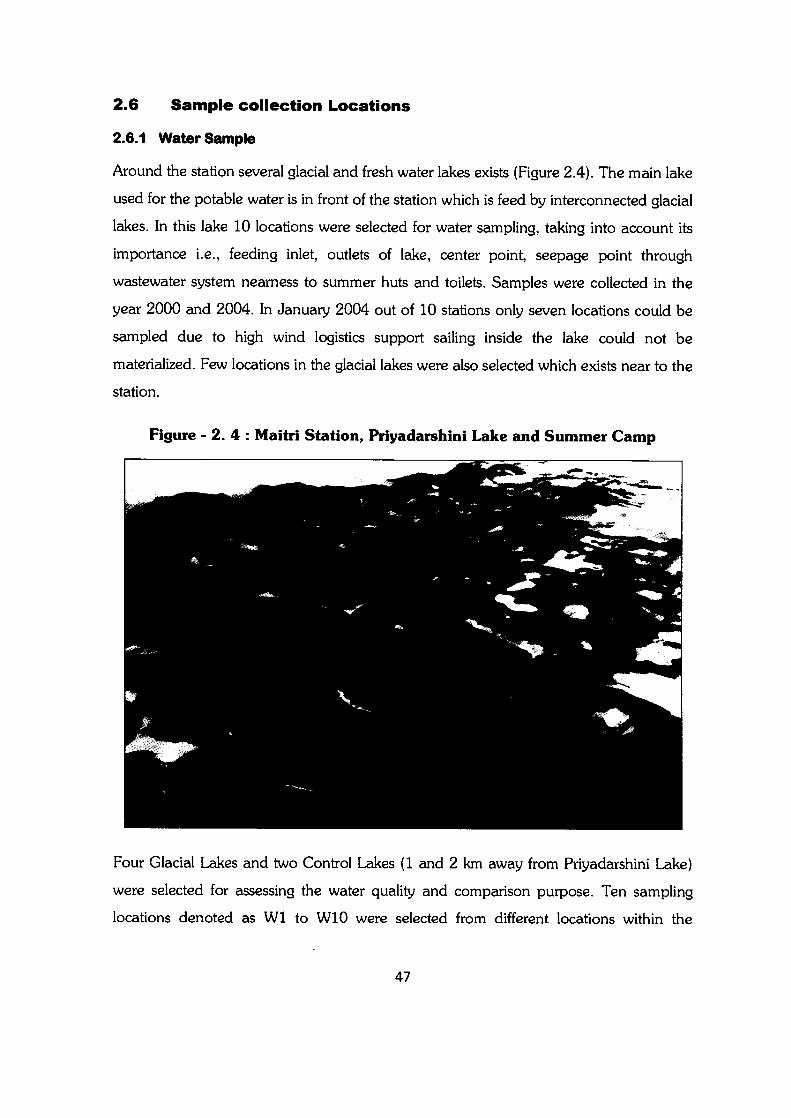
Around the station several glacial and fresh water lakes exists (Figure 2.4). The main lake
used for the potable water is in front of the station which is feed by interconnected glacial
lakes. In this lake 10 locations were selected for water sampling, taking into account its
importance i.e., feeding inlet, outlets of lake, center point, seepage point through
wastewater system nearness to summer huts and toilets. Samples were collected in the
year 2000 and 2004. In January 2004 out of 10 stations only seven locations could be
sampled due to high wind logistics support sailing inside the lake could not be
materialized. Few locations in the glacial lakes were also selected which exists near to the
station.
Figure - 2. 4 : Maitri Station, Priyadarshini Lake and Summer Camp
Four Glacial Lakes and two Control Lakes (1 and 2 km away from Priyadarshini Lake)
were selected for assessing the water quality and comparison purpose. Ten sampling
locations denoted as W1 to W10 were selected from different locations within the
47
Page 9
Priyadarshini Lake for a proper assessment of its water quality. Six locations denoted as
GL1a, GL1b, GL2, GL3, GL4a and GL4b were identified in the four glacial lakes
located on the western side of the station. Three additional locations denoted as CL1a,
CL1b and CL2 included two freshwater lakes and are referred as Control Lakes (Figure
2.5). These samples from Control Lakes were used to obtain the background
concentrations since the lakes were situated some distance away from the Maitri station
and assumed to be not affected by the prevailing activities.
Figure - 2. 5: Schematic diagram of Maitri Station and Sampling Location
2.6.2 Wastewater Sample Points at RBC
RBC's installed at Maitri are made of Glass fiber Reinforced Polyester (GRP) which is
extremely robust and easy for transport and install. The RBC units are located in
separate rooms that are not exposed to sunlight to prevent the growth of algae, which
could intervene with microbial attachment (Ayoub and Saikaly, 2004) and at times
overburden the discs with extra mass. B1 RBC treat waste obtained from kitchen and B3
48
Page 10
RBC treat the waste obtained from bathroom, washbasins, laundry and urinal.
Treatment systems are installed and operate to filter and convert organic matter into
stabilized unharmed material and gases. For the present study all the places where waste
generates and further process takes place, efforts are made to collect the samples i.e.
inlet points, primary and secondary settling tank and biozone. However few locations
were also identified to collect samples i.e. collection pond„ final discharge point and
from connecting lakes to Priyadarshini.
2.7 Water Balance at Maitri
Efficacy of wastewater depends upon the designed load and surrounding environmental
conditions of wastewater that feed into the system. To assess the actual average quantity
of wastewater generated and fed into RBC's, water balance of station is developed
through water intake assessment and its distribution, losses and conversion into
wastewater. Water is supplied to Maitri through a submersible pump from Priyadarshini
Lake which is collected in two tanks of 5 m 3 volume, inside the station. In the month of
January 2000 and 2003, on a particular day when the strength in the station was
noticed maximum, 24 hourly assessments of wastewater generation and measurement
was carried out to derive water balance (Tiwari and Kulkarni, 2005).
Water was collected in a main tank where from it is distributed into kitchen, boiler,
bathroom, and washbasin and summer huts. Daily total water consumption was
measured through the changes in water level of main tank, before and after pumping.
Boiler was used at Maitri to circulate heated water through radiators, in each room. An
expansion tank was placed to make up evaporated water, lost during circulation through
boiler. Water loss was measured through change in the water level in 24 hours.
However, variation in water demand is noticed during winter and summer months.
The inlet quantity of wastewater to B1 was measured from inside kitchen through a
closet which joins to kitchen RBC. Water was collected in bucket before releasing into
RBC and volume was measured every hour. At the outlet of RBC 220 litres capacity
barrels were kept to collect the treated wastewater before releasing into pond.
49
Page 11
Wastewater generated at laundry was assessed through daily consumption of water that
was required by the washing machines based on number of persons using it.
Inlet measurement of B3 RBC which mainly receives waste water from laundry, urinal,
washbasin and bathroom is assessed through back calculation because all the pipe line
were concealed and no suitable place was found to measure the flow. Effluent quantity
flow was measured by collecting effluent in 220 litre barrel for 24 hours. At summer huts
water was collected in a tank where from it is distributed to other places like tea room
(Annapurna hut), and bathrooms. The level of water on filling and after consumption
was measured to calculate water consumption in summer huts.
2.8 Sample collection and Preservation
Samples (water and wastewater) were collected in the month of January-February,
2000, 2001 and 2004. Pre acid washed Nalgene; High Density Poly Ethylene (HDPE)
bottles were used for water and wastewater sample collection. The bottles were soaked
with 10% HCL for 24 hours and then thoroughly cleaned and rinsed with distilled water.
All the borosilicate glass bottles and polyethylene container were rinsed with chromic
acid solution followed with tap and distilled water and then inverted them to dry. Trace
metal analysis container were rinsed with 20% HNO 3 followed by distilled water. The
above procedure was followed at Maitri as well as for RBC model analysis.
In the years 1994 and 1995 samples were collected from the influent and effluent of both
B1 and B3 RBC. These four sets of sample were considered as reference analysis to
pursue further study. During the study period in the year 2000, composite samples were
collected from influent as well as effluent of B1 and B3 RBC. Samples were also
analysed for tertiary treatment. For this effluents collected after alum dose and further
passing through activated carbon were analysed. Eight sets of samples were collected
and analysed for performance study. In the year 2004 six sets of samples were collected
and analysed from influent, effluent and bio-disk chambers of B1 and B3 RBC.
Additional set of sample were collected from the wastewater collection pond in the year
2004.
50
Page 12
Water sampling in lakes was carried out with the help of Niskin water sampler from
different depths. Each sample was collected in one litre bottle for nutrient, oil and grease,
physico-chemical parameters and half litre bottles were used for sample collection for
trace metal analysis. A part of water, from collected sample was used to analyze the
essential parameters in Environmental laboratory at Maitri. Utmost care was taken to
bring the samples collected from the Lakes to laboratory within an hour to measure the
essential parameters. Ambient temperature during sample collection varied from -5 °C to
+3 °C and water temperature from -2 °C to +1 °C.
An inflatable boat was used to collect the samples from middle of the Priyadarshini Lake.
In each of the heavy metal bottles one ml of HNO 3 was added to acidify the sample. Oil
and Grease and nutrient samples were preserved with H 2SO4 by mixing one ml of acid
and making pH to 2. All the samples were preserved in near temperature range of +4
°C, for further analysis at the laboratory in Maitri and in India.
2.9 Performance Evaluation and Tertiary Treatment at Maitri in
Lab Scale
Wastewater treatment system should 'work at design load and give desired effluent
quality. To evaluate the performance of RBC's 24 hourly composite samples were
collected at various points, during summer period in the year 2000, and 2003.
Composite samples were collected from inlets, primary settling chamber, biozone and
secondary settling chambers of both the RBC's. Sample was also collected from effluent
collection pond. Having assessed the performance of RBC which gave its running
efficiency at 25-60%, it was decided to seek the option to understand the effect of
tertiary treatment at laboratory-scale/bench-scale (Banerjee, 1997a; Laopaiboon et al.,
2002) at environmental laboratory of Maitri.
An attempt was made at the laboratory to observe the effect of tertiary treatment on the
effluents of RBC. In this regard the effluent was primarily treated through the optimum
dose of alum (Malhotra and Lee, 1964) which is widely used as a coagulant (Chu, 1999)
and then treated through granular activated carbon. The influent waste from both the
RBC's and effluent after optimum dosing of alum and effluent from the activated carbon
51
Page 13
column was further analyzed for physico chemical parameters viz. pH, turbidity, total
suspended solids (TSS), total dissolved solids (TDS), conductivity, total alkalinity,
chlorides, sulfate, temperature, COD, BOD, ammonia, total phosphates, oil and grease,
hydrocarbons, nitrogen nitrite, nitrogen nitrate, phenol and heavy metals viz. nickel,
cadmium, chromium (Ayub et al., 2003), copper, lead, iron, manganese, zinc, cobalt.
2.9.1 Tuning of RBC
While through performance evaluation it was assessed that the RBC's are not working at
designed efficacy, both the systems were tuned for its disc rotational speed (RPM) and
biozone temperature to develop the bacterial growth properly and DO transfer and then
its performance evaluation was done again collecting the sample and analyzing at
environmental laboratory at Maitri.
2.10 Transportation of Samples
All the samples were kept in plastic crate and transported from Maitri to Ship by
helicopter and kept in +4 °C containers in the ship and after reaching Cape Town it was
transported by flight keeping in icebox with dry ice to maintain the temperature and
brought to the laboratory at NCAOR for further analysis.
2.11 Lab Scale Modelling
At Polar environmental Laboratory of NCAOR two RBC's simulating to the RBC's of
Maitri were designed keeping the physical aspect ratio 1: 200. The resident time of waste
was kept similar to RBC at Maitri, rest of the parameters were designed according to
dimensional analysis of RBC at Maitri and working model of RBC. These model were
kept running for about four months and during this period various experiments were
conducted at ambient temperature 25-30 °C taking into consideration that RBC at Maitri
will perform in the same temperature. The performance evaluation is carried out on the
working model i.e.
Considering both the RBC running separately with independent waste load
Ili Kitchen RBC (B1) effluent diverted into influent of laundry, urinal RBC (B3)
52
Page 14
41. Tertiary treatment implying alum dose and activated carbon treatment
This laboratory-scale model may be particularly useful in predicting the organic loading
rate. Such information is very useful in the scale-up process of constructing a treatment
plant, as a pilot plant of intermediate size (Palma et al., 2003).
2.11.1 Collection and Analysis of Wastewater Samples from RBC Model
Composite samples were collected at influent, effluent and biozone and were analyzed
for physico chemical parameters viz. suspended solids (SS), volatile suspended solids
(VSS), volatile dissolved solids (VDS), pH, conductivity, turbidity, total suspended solids
(TDS), dissolved solids, BOD, COD, nitrate, ammonia, phosphate, sodium, potassium,
calcium and trace metals (chromium, manganese, cobalt, nickel, copper, zinc, cadmium,
lead and iron), using, Inductively Coupled Plasma Mass Spectrophotometer (IC-PMS) of
Thermo make.
All analytical procedures were performed according to Standard Methods (APHA,
2000). Chemical oxygen demand (COD) was measured by the closed reflux method
using Hach DRB 200 COD reactor; biochemical oxygen demand (BOD5) was measured
by the 5-d BOD test using Orion 810 and Thermo electron DO meter; temperature was
measured through Cole Parmer thermo couple digital thermometer; sodium, potassium
and calcium were measured through Elico CL 361 make flame photometer; nitrate,
ammonia and phosphate were measured by colorimetric method using Then-no Genesys
20 spectrometer; conductivity, pH, and TDS were measured through Oakton pH/Con
510 Series make bench top meter; total suspended solids (TSS), dissolved solids,
volatile dissolved and suspended solids were measured by the gravimetric method and
for filtration a PALL make filtration unit and Nalgene filter paper 0.45 urn were used. For
all the analysis purpose in India Millipore type II water from Elix 3 was used and
chemical balance Sartorius CP 224 S was used for general weighing purpose. Trace
metal analysis, was carried out after filtering the sample through 0.45 urn membrane
filter on Thermo make ICP-MS.
53
Page 15
2.12 Analysis of Samples in Laboratory
Basic parameters of water and wastewater i.e. pH, temperature, conductivity, turbidity,
DO, BOD, COD, alkalinity acidity, TDS, ammonia, nitrite and nitrate were analysed in
Environmental laboratory at Maitri. The preserved samples were sealed properly and
brought to India for further analysis in the laboratory. Samples were filtered before
analysis with 0.45 atm Whatman filter papers. All the samples were analyzed using
standard methods of water and waste water analysis (APHA, 2000) for, total hardness,
calcium hardness, sulfate, sodium, potassium, oil and grease, hydrocarbons, phenol and
heavy metals (nickel, cadmium, chromium, copper, lead, iron, manganese, zinc, and
cobalt). The samples were analyzed through following the standard method of water and
wastewater analysis as follows.
Turbidity by Nephelometric method, acidity by titrametric method, alkalinity by
titrimetric method, hardness by EDTA titrametric method, conductivity by conductivity
meter, solids by gravimetric and oven dried method, sulfate by turbiditric method,
temperature by mercury filled certified Celsius thermometer and thermocouple, metals
by atomic absorption spectrometry, chlorides by argentometric method, fluoride by
SPADNS method, pH by electrometric method, nitrogen (ammonia, nitrate and nitrite)
by colorimetric method, phosphorus by colorimetric method, BOD by 5 day BOD test,
COD by closed reflux colorimetric and open reflux titrimetric (at Maitri) method, oil and
grease by partition gravimetric method.
2.12.1.1 Turbidity
Turbidity of the sample was measured by digital turbidity meter with range of 1000 NTU
and 0.1 NTU resolution. Stock hydrazine sulfate and hexamethylenetetramine solution
was prepared to make standard turbidity suspension and instrument was calibrated using
different dilution solution from the standard solution.
2.12.1.2 Oil and Grease
To assess the concentration of oil and grease, Trichlorotrifluroethane-soluble floatable oil
and grease method is used. For the extraction, dry filter (1 atm Pall) was used. After 30
54
Page 16
minutes settling time, soluble floatable oil and grease were estimated for the samples.
2.12.1.3 Total Dissolved and Volatile Solids
Total solids were estimated evaporating the known volume of sample at 105°C, in silica
glass. The initial and final weight difference of known volume of sample produced the
total solids. For total suspended solids a known volume of the sample was filtered
through the glass fiber filter paper which was dried at 105° C. The weight difference of
initial and final reading corresponding to known volume of sample which passes though
the filter paper (1 ,u,m Pall) gave the amount of total suspended solids. The filtrate was
evaporated to dryness in a weighted dish at 180°C, thus increase in weight of the dish
represents the total dissolved solids. A sample volume 100 ml was filtered in all solid
determination using Nalgene filtration unit and PALL filtration pump. The residue of the
total solids, suspended solids and dissolved solids was ignited at 550 °C in muffle furnace
and weight loss of the known weight and volume of the sample represented fixed total
volatile, suspended volatile solids and dissolved volatile solids respectively.
2.12.1.4 Dissolved Oxygen (DO)
At Maitri DO was measured through Winkler method. Sample collected from the source,
was soon put into 300 ml BOD bottle. DO was fixed with reagents at the site and then
precipitated sample was titrated in the laboratory with standard sodium thiosulphate
solution (0.025 N) putting starch as indicator. While experimented on RBC model, DO
was measured through Thermo Orion 810', DO meter which was calibrated against zero
and saturated DO.
2.12.1.5 Biochemical Oxygen Demand (BOD)
At Maitri BOD was estimated by measurement of initial and final DO of the sample by
Winkler method which was kept for 5 days in BOD incubator at 20 °C. Dilution of water
samples were prepared depending on the need and strength of sample. The lake water
samples were kept for test with 25% dilution water without addition of seed. Initial and
final DO of diluted water samples was measured after 5 days of incubation and average
BOD estimated based on these two measurements. The waste water samples were
55
Page 17
diluted to, 0.5%, 1%, 3% and 5%, with dilution water, according to the expected
strength of wastewater sample, and kept for incubation for 5 days and initial and final
DO measurement of sample as well as dilution water used, in preparation of sample
were recorded. Accordingly using formulae BOD was estimated.
2.12.1.6 Chemical Oxygen Demand (COD)
The COD analysis is carried out at Maitri by open reflux method. Samples digested in
500 ml flask using 0.25 N potassium dichromate and sulfuric acid was then titrated with
0.1 ferrous ammonium sulfate solution. The samples of model experiment were analyzed
by closed reflux colorimetric method using Hack DRB 200 COD reactor and setting
Thermo Genesis 20 spectrometer at 600 nm. The value of COD is then estimated
through calibration curve of COD prepared with standard solutions. The samples were
diluted to measure the strength in line with calibration curve.
2.12.1.7 Ammonia
Ammonia was estimated by colorimetric method (Ramteke and Moghe, 1988). The pH
of the filtered sample (0.45 um) is maintained by adding ZnSO 4, then mixing with
Rochelle salt solution, and nessler reagent then absorbance was measured at 410 nm.
Calibration curve was drawn through standard ammonium solution.
2.12.1.8 Nitrate
Nitrate in the samples (filtered through 0.45 um membrane filter) were measured
through phenol disulfonic acid (PDA) method (Ramteke and Moghe, 1988). Evaporated
sample to dryness by water bath was mixed with phenol disulfonic acid regent and then
NaOH was added. Color developed solution was then put for absorbance in the
spectrometer at 410 nm. Calibration curve was developed using standard nitrate
solution.
2.12.1.9 Total Phosphate
To determine the total phosphate, colorimetric method was used, adding
phenolphthalein indicator and sulfuric acid solution and then color was developed
56
Page 18
through adding hydroxide after boiling the sample for 90 minutes. Further, mixing the
reagents, absorbance was measured in spectrometer at 690 nm. Calibration curve was
prepared by phosphate standard solution and its absorbance.
2.12.1.10 Acidity
In the water sample acidity was measured by titration using standard sodium hydroxide
0.02 N solution and phenolphthalein and methyl orange indicator
2.12.1.11 Alkalinity
Alkalinity in the water sample was determined by volumetric analysis using Standard
sulfuric acid 0.02 N as titrate and phenolphthalein and methyl orange indicator.
2.12.1.12 Hardness
Total hardness in water sample was determined by mixing sample with buffer solution
followed by Erichrome black T and titration with standard EDTA. Further calcium
hardness was measured by titrating sample with EDTA after adding NaOH and
murexide indicator. Magnesium hardness was obtained by deducting calcium hardness
from total hardness.
2.12.1.13 Chloride
Chloride in the water samples was estimated by titrating it with standard silver nitrate
solution 0.0141 N. Silver nitrate was also standardize against NaCl solution.
2.12.1.14 Sulfate
In the water sample sulfate was measured by colorimetric method. Samples were mixed
with conditioning reagent and BaC12 and the absorbance was measured at 420 nm.
Standard calibration curve was drawn using standard sulfate solution.
2.12.1.15 Trace Metal Analysis
Trace metal analysis of water as well as wastewater sample was determined using GBC —
57
Page 19
AAS (F) and also by Thermo 100 -ICP-MS.
2.13 Alternative Selection for Waste Disposal
The present method of disposal of treated wastewater at Maitri is being followed as to
discharge treated effluent on open ground around 320 m away from the collection pond,
which seeps further and join the glacial lake and joins another lake as these lakes are
interconnected and ultimately joins the Priyadarshini lake. This leads to threat of chain
contamination of the lakes. An alternate solution suggested is the treated wastewater
may be further treated with tertiary treatment units and thereafter Reverse Osmosis (RO)
can be implemented to further filter the impurities and trace metals. The effluent from
RO can be either evaporated or sprinkled over the open land.
2.14 Application of WASP7
The Water Quality Analysis Simulation Program (WASP7), an enhancement of the
original WASP (Di Toro et al., 1983; Connolly and Winfield, 1984; Ambrose, 1988) is
proposed. This model helps users to interpret and predict water quality responses to
natural phenomena and manmade pollution for various pollution management
decisions. WASP is a dynamic compartment-modelling program for aquatic systems,
including both the water column and the underlying benthos. WASP allows the user to
investigate 1, 2, and 3 dimensional systems, and a variety of pollutant types. The time
varying processes of advection, dispersion, point and diffuse mass loading and boundary
exchange are represented in the model. WASP also can be linked with hydrodynamic
and sediment transport models that can provide flows, depths velocities, temperature,
salinity and sediment fluxes. This water quality prediction model was employed to assess
the effect of wastewater seepage from the collection pond to Priyadarshini Lake in terms
of pollution and eutrofication.
58


![IS 12608 (1989): rock joints-direct shear strength ...IS 12608 (1989): rock joints-direct shear strength-laboratory method of determination [CED 48: Rock Mechanics] METHODFOR ... 3.1.1](https://static.documents.pub/doc/80x56/5e6de58548a3964b42128b08/is-12608-1989-rock-joints-direct-shear-strength-is-12608-1989-rock-joints-direct.jpg)


