Page 1
8/8/2019 MHC Diversity in Bottleneck Ed Populations-A Simulation Model
http://slidepdf.com/reader/full/mhc-diversity-in-bottleneck-ed-populations-a-simulation-model 1/9
R E S E A R C H A R T I C L E
MHC diversity in bottlenecked populations: a simulation model
Maciej Jan Ejsmond•
Jacek Radwan
Received: 3 February 2009/ Accepted: 25 September 2009
Ó Springer Science+Business Media B.V. 2009
Abstract The depletion of variation at MHC loci, which
play a crucial role in pathogen recognition, has been pos-tulated to be one of important extinction risk factors for
endangered populations. Thus, it is important to understand
how selection affects the level of polymorphism in these
genes when populations undergo a reduction in size. We
followed MHC diversity in computer simulations of pop-
ulation bottlenecks. The fates of MHC alleles in the
simulations were determined either by drift, or by balanc-
ing selection resulting from host–parasite coevolution. We
found that the impact of selection on MHC polymorphism
in bottlenecked populations was dependent upon the
timescales involved. Initially, selection maintained lower
number of alleles than drift, but after *40 generations of
hosts selection maintained higher MHC diversity, as
compared to drift. The adverse effects of decreased MHC
polymorphism on population viability may be, to some
extent, compensated for if selection helps to retain MHC
alleles which show high functional diversity, which should
allow protection against a broader range of pathogens. Our
simulation shows, however, that the mean divergence of
alleles retained under selection in bottlenecked populations
is not, on average, significantly higher than the divergence
due to drift.
Keywords Major histocompatibility complex Á
Balancing selectionÁ
ConservationÁ
ExtinctionÁ
Bottleneck
Introduction
The MHC genes code for peptides that present antigens to
lymphocytes, thus initiating the adaptive immune response.
This function seems to be the reason that the MHC genes
are the most polymorphic vertebrate genes (Garrigan and
Hedrick 2003; Sommer 2005; Piertney and Oliver 2006).
Quickly evolving parasites may adapt to the most common
host genotypes and escape detection of their antigens by the
adaptive immune system of the host. Rare allelic variants of
MHC genes, to which parasites are unlikely to adapt, should
thus be favoured by negative frequency-dependent selection
(Snell 1968; Borghans et al. 2004). Indeed, there is some
evidence that rare alleles may confer resistance to parasites
(de Campos-Lima et al. 1997; Westerdahl et al. 2004).
Additionally, heterozygote advantage in resistance to para-
sites can contribute to polymorphism at MHC loci, as MHC
heterozygosity allows a broader range of antigens to be
presented (Doherty and Zinkernagel 1975), a theory which
has also gained some empirical support (McClelland et al.
2003; Froeschke and Sommer 2005).
In bottlenecked species, MHC variation is often severely
reduced (e.g. Ellegren et al. 1993; Radwan et al. 2007; Siddle
et al. 2007). O’Brien and Evermann (1988) and Hughes
(1991) have argued that species in which MHC variation
becomes depleted are more susceptible to disease and thus
more prone to extinction. Therefore, understanding the role
of selection in maintaining MHC variation in bottlenecked
populations has implications for the conservation of endan-
gered species (see Radwan et al. 2009 for recent review).
M. J. Ejsmond (&)
Institute of Environmental Sciences, Jagiellonian University,
Krakow, Poland
e-mail: [email protected]
J. Radwan
Institute of Nature Conservation, Polish Academy of Sciences,
Krakow, Poland
123
Conserv Genet
DOI 10.1007/s10592-009-9998-6
Page 2
8/8/2019 MHC Diversity in Bottleneck Ed Populations-A Simulation Model
http://slidepdf.com/reader/full/mhc-diversity-in-bottleneck-ed-populations-a-simulation-model 2/9
The higher number of MHC alleles, as compared to
neutral markers (Aguilar et al. 2004), and the high dis-
similarity between MHC allele sequences (Hedrick 2003)
have been interpreted as evidence for the role of balancing
selection in maintaining MHC diversity in bottlenecked
populations. However, the ability of balancing selection to
maintain polymorphism may depend on equilibrium allele
frequencies (Robertson 1962) and population size (Hedrick 1972). Here we investigate the role of selection in main-
taining MHC polymorphism in simulated bottlenecked
populations, allowing for the simultaneous action of het-
erozygote advantage and frequency-dependent selection.
We also investigate whether selection can be expected to
maintain more divergence between alleles than drift. Based
on observations of several endangered species, Hedrick
(2003) argued that this may often happen, as heterozygote
advantage would be more pronounced if alleles substan-
tially differ in the range of antigens they bind. Under such a
scenario, an endangered species might be able to cope with
pathogen assault better than could be expected based on thenumber of alleles retained in the population.
Methods
Deriving host populations before bottleneck
To derive source host populations evolving in the presence
of pathogens prior a bottleneck, we adopted a modification
of the simulation model proposed by Borghans et al.
(2004).The model simulates diploid hosts, with a constant
population size, coevolving with populations of 25 haploid
pathogen species. To investigate the effect of the number
of pathogen species on MHC polymorphism we also run a
few exploratory simulations of coevolution with 12 path-
ogen species. The scenario of coevolution between hosts
and parasites we simulated included both frequency-
dependence and heterozygote advantage, as fitness of a
heterozygote bearing an allele capable of pathogen recog-
nition was set to be equal to that of a homozygote bearing
the same allele. The heterozygote was thus twice as likely
to respond to a random parasite. In our simulations, we
represented each of the two host MHC molecules being
carried by a diploid host as binary strings of 16 bits. Each
bit may be thought of as a representation of an amino acid
crucial for binding the antigens (e.g., those forming pockets
implicated in the specificity of binding; Stern et al. 1994)
that subsequently get presented to T-cell receptors. We
assumed that each haploid pathogen can produce 20 anti-
gens, each 16-bits long. As in Borghans et al. (2004), we
assume that a random MHC molecule has a probability
equal to 0.043 of presenting one randomly generated
antigen. Thus, the probability that a randomly generated
pathogen with 20 antigens will be immuno-dominantly
presented by a heterozygous host with a particular pair of
MHC molecules is 0.88. Such parameters have been shown
to maintain realistic levels of polymorphism in simulated
populations (Borghans et al. 2004). If at least seven bits of
the antigen sequences matched a MHC molecule, the
pathogen was immunodominantly presented. The number
of antigens presented simultaneously was assumed to haveno effect on the strength of immune response or on host
fitness.
In our simulations, hosts interacted with 25 species of
haploid pathogens, for 10 pathogen generations per one
host generation, with all pathogens species having the same
mutation rate. All 25 pathogen species had population sizes
equal to the sizes of host populations. Each new generation
of pathogens was created with haplotype frequencies pro-
portional to the fitness gained by each haplotype in the
parental generation. The fitness of a particular pathogen
haplotype was proportional to the number of hosts it
infected. During each generation, each host was exposed toall parasite species. Each host was attacked by one parasite
of each species. Parasite haplotypes attacking individual
host, were drawn at random in each pathogen generation,
with a probability equal to their proportion in the popula-
tion. As in Borghans et al. (2004), the fitness of hosts was
calculated as the square of the proportion of recognized
pathogens during a given generation. Consequently, hosts
that presented the same number of pathogens from differ-
ent species had the same fitness.
After every 10 pathogen generations, a new generation
of hosts was recruited, based on host fitness. During host
recruitment, each descendant inherited one MHC haplotype
from each of two different individuals drawn at random
from the parental generation with the probability propor-
tional to the fitness of an individual. Mutations in host
MHC molecules were simulated by generating new bit
strings to account for the fact that MHC variation often
arises by micro-recombination rather than by point muta-
tion. In our simulations, we assume a rate of 10-5 muta-
tions per allele, per host generation.
Haploid pathogens reproduce asexually, such that the
genotypes of the offspring and parents are identical, except
for mutations. We simulated mutations stochastically,
where each bit of the antigen could change to the reverse.
Based on the work of Borghans et al. (2004), we assumed
the mutation rates for parasites are generally higher than
they are for hosts, to allow for a higher rate of evolution of
parasites. These somewhat oversimplified assumptions
about mutational processes in parasites and hosts appear
not to influence general features of the derived populations
(Borghans et al. 2004).
We originally derived populations under four different
mutation rates: 10-2, 5 9 10-3, 2 9 10-3, or 10-3 per
Conserv Genet
123
Page 3
8/8/2019 MHC Diversity in Bottleneck Ed Populations-A Simulation Model
http://slidepdf.com/reader/full/mhc-diversity-in-bottleneck-ed-populations-a-simulation-model 3/9
antigen, per pathogen generation. However, 10-2 proved
too high a mutation rate, effectively precluding adaptation
of parasites to host genotypes by disrupting coevolved
haplotypes of parasites. This was evident by the very high
host fitness compared to other mutation rates (not shown)
and little variance in fitness between hosts, similar to what
occurs under drift (Fig. 3). Consequently, this mutation
rate was not considered below in most of analyses. We alsovaried the pre-bottleneck host population size (1,000, 3,000
and 5,000).
Coevolution was started at the point at which a popu-
lation of hosts was randomly generated, such that host
polymorphism was maximal at the outset, and then evolved
to the level set by natural selection. This method shortened
the time necessary to derive host populations and gave the
same results as evolution starting from two host alleles.
Hosts and parasites were allowed to co-evolve for 2,000
host generations, i.e. 20,000 pathogen generations, which
was enough for the number of MHC alleles to stabilize for
all mutation rates studied (Fig. 1). We derived 15 replicatehost populations for each combination of parameters.
MHC polymorphism under a bottleneck
The populations to be bottlenecked were derived under four
pathogen mutation rates: 10-2, 5 9 10-3, 2 9 10-3,or10-3
and three pre-bottleneck host population sizes (1,000, 3,000,
5,000). For each set of parameters, 15 populations were
independently derived. Each such population was
bottlenecked to five different population sizes, as described
below, and followed under the same pathogen mutation rates
as before bottleneck. We compared two scenarios: coevo-
lution between host and pathogens (including simultaneous
action of frequency dependence and heterozygote advan-
tage) and genetic drift of host alleles. Additionally, for a
limited set of parameters, we estimated effects of frequency
dependence and heterozygote advantage separately.To simulate the effect of a prolonged bottleneck, a small
number of hosts (12, 25, 50, 100, 200) was randomly
chosen from a large population derived under host–parasite
coevolution as described above. Simultaneously, each
pathogen species suffered the same reduction in population
size as host population. After this step, for the next 100
host generations we analyzed MHC polymorphism, fre-
quency and fitness of all alleles under two scenarios—
coevolution and genetic drift. In the coevolution scenario,
fitness functions of hosts and parasites were constructed as
described above for populations before bottleneck. In the
drift scenario, hosts that passed to the next generation weredrawn at random. Population size was constant in time.
For each of 15 independently derived source populations
for a given set of parameters, we simulated 20 independent
bottleneck events, consisting of an appropriate number of
randomly chosen host genotypes. Each of 20 events was
treated as a replicate nested in one derived population and
run 20 times to assess the mean trajectory of the studied
parameters under coevolution and under drift. In this way
we derived 400 replicates (20 9 20) for each indepen-
dently originated pre-bottleneck population (which gives
15 9 400 = 6,000 runs for each scenario studied). We
then calculated the averages of those mean trajectories over
each of the 400 replicates for each of 15 independently
derived source populations.
In order to investigate separately effects on MHC
polymorphism in bottlenecked populations of each of the
two forms of balancing selection studied: heterozygote
advantage and frequency-dependence, we run simulations
where only one form was operating following the bottle-
neck. Excluding frequency-dependence was achieved by
drawing parasites to the next generation at random, such
that they could not adapt to the most common host geno-
types. In simulations where frequency-dependence was
retained, but heterozygote advantage eliminated, the hosts
were set as haploids. This eliminates heterozygote advan-
tage (Borghans et al. 2004), but causes a decrease in the
number of gene copies segregating in a population.
Therefore, we additionally simulated haploid hosts with
population sizes twice as high as those of diploid hosts. We
used population sizes of 50 and 100 individuals and path-
ogen mutation rates 5 9 10-3 and 2 9 10-3. Because all
sets of parameters yielded similar conclusions, below we
only present a scenario with 2 9 10-3 mutation rate.
0 200 400 600 800 1000 1200 1400 1600 1800 20000
20
40
60
80
100
120
140
Time [generations]
N u m b e r o f a l l e l e s
0.010
0.005
0.005
0.002
0.001
Fig. 1 The mean number of alleles during coevolution in source host
populations of 3,000 individuals, at different pathogen mutation rates
(shown above each trajectory). Solid lines indicate mean trajectories
of coevolution with 25 pathogen species (as used in all subsequent
simulations); a dotted line indicates coevolution with 12 pathogen
species. Error bars indicate standard deviation calculated for 15
replicates
Conserv Genet
123
Page 4
8/8/2019 MHC Diversity in Bottleneck Ed Populations-A Simulation Model
http://slidepdf.com/reader/full/mhc-diversity-in-bottleneck-ed-populations-a-simulation-model 4/9
Sequence divergence
We also studied the divergence of the alleles which were
retained in a population. The level of divergence between a
particular pair of alleles was assessed in two ways. First,
we computed the similarity between bit sequences, by
calculating the number of identical bits in a pair of alleles.
Second, we considered the differences between retainedalleles with respect to the pathogen genotypes they bind to.
To this end, we generated all 65,535 possible 16-bit path-
ogen antigens. For each pair of alleles we calculated the
number of antigens that could potentially be presented by
both alleles, where the higher this number, the higher the
functional similarity between alleles. The mean similarity
for all pairs of retained alleles was used as a measure of
sequence/functional divergence within a population. To
estimate the significance of the differences in sequence
resemblance and functional divergence between drift and
coevolution scenarios, we computed bootstrapped 95%
confidence intervals using 15 mean trajectories (i.e., aver-aged trajectories for 15 derived populations). Using means
guarantees the independence of measurements taken into
account during bootstrapping, as replicates derived from
the same pre-bottlenecked host population are nor inde-
pendent. The effects of a bottleneck on MHC polymor-
phism, and on allele divergence under coevolution, were
investigated using three different per antigen mutation
rates: 5 9 10-3, 2 9 10-3 and 10-3 and three different
pre-bottlenecked population sizes (1,000, 3,000 and 5,000).
Incidental bottleneck
We also investigated the effects of an incidental bottleneck
on the polymorphism anddivergence of MHCalleles. To this
end, a source population ( N = 3,000) of coevolving hosts
and each pathogen species was reduced to 50 individuals, as
during permanent bottleneck, but such a low population size
was maintained for only 10 host generations. After the bot-
tleneck, the population size was increased to the original
number ( N = 3,000), with genotype frequencies propor-
tional to their fitness,bothpathogens and hosts. As wedid for
the prolonged bottleneck, we compared the outcomes of
coevolution and genetic drift with three pathogen mutation
rates, same as in prolonged bottleneck scenario. For 1,000
host generations after the bottleneck, we traced MHC poly-
morphism and the divergence of alleles retained in the host
population, in the same manner as in the prolonged bottle-
neck simulation. The mean trajectory for the number and
divergence of alleles in the host population was a result of
averaging three replicates for each of 15 derived populations.
Confidence intervals for mean sequence resemblance and
functional divergence of alleles were computed, as in the
previous case, using 15 mean trajectories.
All of our simulations and analyses were performed in
MATLAB 7.5. (MathWorks).
Results
As in Borghans et al. (2004), the level MHC polymorphism
in our derived populations depended mainly on the path-ogen mutation rates, and on host and pathogen population
sizes (Fig. 2). Decreased parasite number resulted in a
lower level of polymorphism maintained. Variation in
fitness between host genotypes, which reflects selection
pressures exerted by pathogens, was the highest for the
lowest pathogen mutation rate we simulated (Fig. 3).
The initial number of alleles after a reduction in popu-
lation size (permanent bottleneck) depended on the number
present in the pre-bottleneck population, but this impact
decayed with time, both under drift (not shown) and under
coevolution (Fig. 4). The rate of the decrease in the number
of alleles was proportional to bottleneck severity, bothunder drift (not shown) and under coevolution (Fig. 5). The
levels of polymorphism for different parasite mutation
rates in bottlenecked populations under the coevolution
scenario, relative to the genetic drift scenario, are shown in
Fig. 6. The relative level of polymorphism initially
decreased, reaching a maximum of *20% fewer alleles
compared to drift. However, after 20–40 host generations
the level of polymorphism under coevolution exceeded that
maintained under drift and the excess continued to
increase, such that at generation 100 it was about 70%
higher than under the drift scenario. This was the case for
all post-bottleneck population sizes (Fig. 7), although the
0.001 0.002 0.005 0.010
20
40
60
80
100
Pathogen mutation rate
N u m b e r o f a l l e l e s
N = 5000
N = 3000
N = 1000
Fig. 2 The mean number of MHC alleles in host populations of three
different sizes. Error bars indicate standard deviation calculated
across 4,000 generations after allele number stabilized
Conserv Genet
123
Page 5
8/8/2019 MHC Diversity in Bottleneck Ed Populations-A Simulation Model
http://slidepdf.com/reader/full/mhc-diversity-in-bottleneck-ed-populations-a-simulation-model 5/9
deficiency in the number of alleles initially maintained
under coevolution was more pronounced in more severely
bottlenecked populations. The propensity of coevolution
to maintain lower numbers of alleles, compared to drift, in
the initial phase of the bottleneck was the strongest for the
largest pre-bottleneck population size (Fig. 8). The same
pattern was observed when either heterozygote advantage
or frequency-dependence could not operate, although the
trajectories differed between these two forms of balancing
selection (Fig. 9). Interestingly, average host fitness
increased after bottleneck, but than decreased compared to
pre-bottleneck level (Fig. 10).
Although the average similarity between sequences was
usually lower under coevolution, the confidence intervals
calculated from 15 averaged trajectories for each set of
parameters overlapped with those calculated for drift (see
Fig. 11 for examples). We also found no significant dif-
ferences in functional similarity (Fig. 12). Both results
were robust for all tested parameters: mutation rate, size of
the source population and severity of the bottleneck.
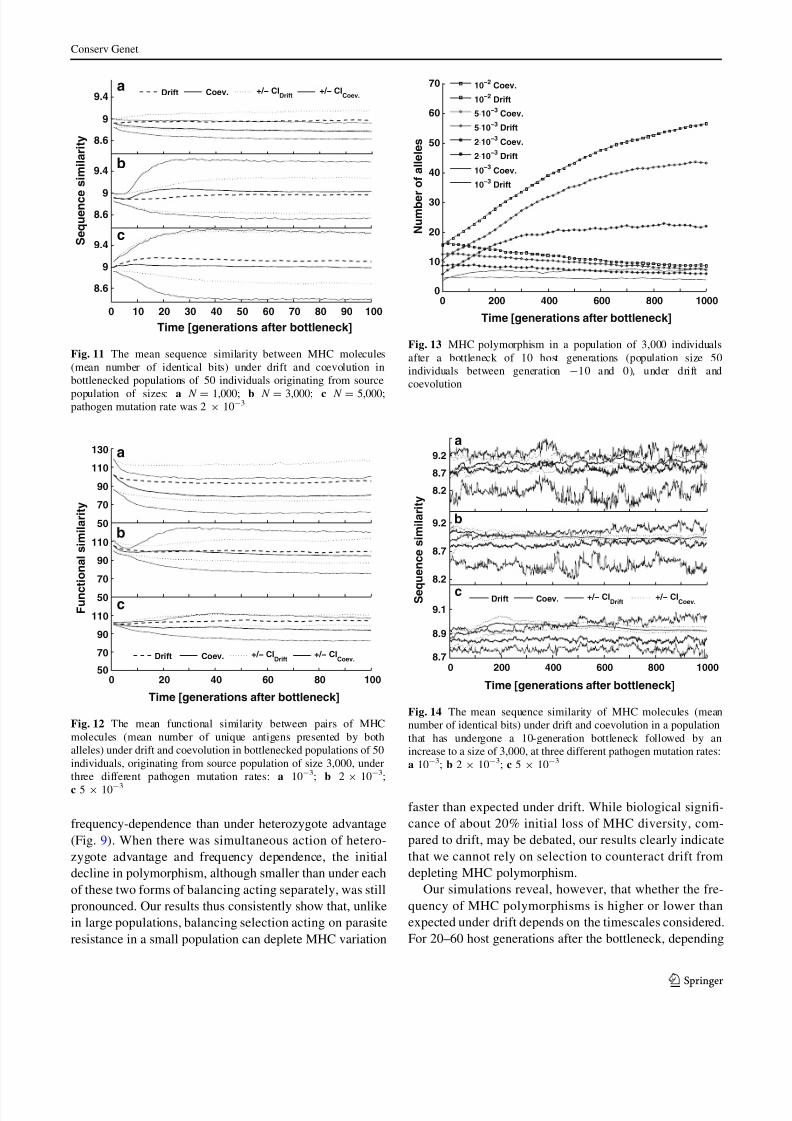
In simulations of a short-term bottleneck, the number of
alleles increased under coevolution for all pathogen
mutation rates studied, and decreased under genetic drift
(Fig. 13). As for the prolonged bottleneck, however, there
were no significant differences between coevolution and
drift when divergence, in sequence or functional similarity
1900 1920 1940 1960 1980 20000
1
2
3
4
5
Time [generations]
C V
i n
f i t n e s s
10−2 5⋅10
−32⋅10
−310
−3 Drift 2⋅10−3
Fig. 3 Example trajectories, showing the variation in host fitness
during coevolution and drift in populations of 3,000 individuals
before a bottleneck (numbers in the legend denote pathogen mutation
rates, CV denotes coefficient of variation)
20 40 60 80 1000
10
20
30
40
50
Time [generations after bottleneck]
N u m b e r o f a l l e l s
10−2
5⋅10−3
2⋅10−3
10−3
Fig. 4 Host polymorphism (mean trajectories) under coevolution,
after a bottleneck to 50 individuals at generation 0. The source
population size of hosts was 3,000 individuals for all four trajectories.
The post-bottleneck population size was maintained at 50 individuals
0 10 20 30 40 50 60 70 80 90 1000
2
4
6
8
10
12
14
16
18
20
Time [generations after bottleneck]
N u m b e
r o f a l l e l e s
Nbot
= 12
Nbot
= 25
Nbot
= 50
Nbot
= 100
Nbot
= 200
Fig. 5 Host polymorphism under coevolution with a pathogen
mutation rate of 2 9 10-3 (mean trajectories). The source population
of hosts was 3,000 individuals for all five trajectories shown
0.001
0.002
0.005
0.01
−0.6
−0.4
−0.2
0
0.2
T i m e [ g e n e r
a t i o n s a f t e r b o t t l e n e c
k ]
P a t h o g e n m u t a t i o n r a t e
( d r i f t − c o e v o l u t i o n ) / d r i f t 020
4060
10080
Fig. 6 The relative difference in MHC allele number between
coevolution and drift for permanently bottlenecked populations, for
a gradient of pathogen mutation rates. Size of the host source
population was 3,000, and the bottlenecked population size was 50
Conserv Genet
123
Page 6
8/8/2019 MHC Diversity in Bottleneck Ed Populations-A Simulation Model
http://slidepdf.com/reader/full/mhc-diversity-in-bottleneck-ed-populations-a-simulation-model 6/9
was compared between retained alleles (Figs. 14, 15 for
examples).
Discussion
While heterozygote advantage, and especially frequency
dependence resulting from host–parasite interaction have
been shown to be capable of maintaining high level of
MHC polymorphism in large populations (Borghans et al.
2004), their effect on MHC diversity in bottlenecked
population is underexplored. Here, we show that
heterozygote advantage and frequency dependence acting
alone or jointly in bottlenecked populations initially
deplete MHC polymorphism at a faster rate than drift. In
our simulations the initial negative effect of selection on
the level of MHC polymorphism was stronger under
12
25
50
100
200
−0.4
−0.3
−0.2
−0.1
0
0.1
0.2
0.3
Time [genera tions a f ter bo t tle
neck ]
S i z e o f b o t t l e n e c k e d
p o p u l a t i o n
( d r i f t
− c o e v o l u t i o n ) / d r i f t
20
80 60 40100
0
Fig. 7 The relative difference in MHC allele number between
coevolution and drift for permanently bottlenecked populations, for
a gradient of bottleneck severity. Size of the host source population
was 3,000 and the pathogen mutation rate was 2 9 10-3
0 10 20 30 40 50 60 70 80 90 100
−0.6
−0.5
−0.4
−0.3
−0.2
−0.1
0
0.1
0.2
0.3
Time [generations after bottleneck]
( d r i f t − c o e v o l u t i o n ) / d r i f t
N = 5000
N = 3000
N = 1000
Fig. 8 The relative difference in the number of MHC alleles between
coevolution and drift for permanently bottlenecked populations
originating from populations derived under three different sizes.
The bottlenecked population size was 50 individuals and the pathogen
mutation rate was 2 9 10-3
0 10 20 30 40 50 60 70 80 90 100
−0.4
−0.2
0
0.2
0.4
0.6
Time [generations after bottleneck]
( d r i f t − s c e n a r i o ) / d r i f t
coevolution Nbot
= 50
drifting pathogenes Nbot
= 50
haploids Nbot
= 50
haploids Nbot
= 100
Fig. 9 The relative difference in the number of MHC alleles between
drift and different forms of balancing selection operating in perma-
nently bottlenecked populations. The pre-bottleneck population was
derived from 3,000 individuals coevolving with pathogens under
pathogen mutation rate equal to 2 9 10-3
. The thick solid line shows
scenario with both forms of balancing selection operating; thin solid
line—heterozygote advantage enabled, frequency dependence dis-
abled; dotted and dashed lines—frequency dependence enabled,
heterozygote advantage disabled, under two post-bottleneck popula-
tion sizes (given in the legend)
0 20 40 60 80 100
0,004
0,008
0,012
0,016
0,02
Time [generations after bottleneck]
H o s t f i t n e s s
10−3
10−3
5⋅10−3
5⋅10−3
Fig. 10 The mean host fitness (calculated as the square of the
proportion of recognized pathogens, see ‘‘Methods’’) after the
bottleneck, compared to host fitness prior to bottleneck (straight
lines, calculated as means from 15 independent simulations). Thebottlenecked population size was 50 individuals and the pre-
bottleneck population was derived from 3,000 individuals coevolving
with pathogens under two pathogen mutation rates (given in the
legend)
Conserv Genet
123
Page 7
8/8/2019 MHC Diversity in Bottleneck Ed Populations-A Simulation Model
http://slidepdf.com/reader/full/mhc-diversity-in-bottleneck-ed-populations-a-simulation-model 7/9
frequency-dependence than under heterozygote advantage
(Fig. 9). When there was simultaneous action of hetero-
zygote advantage and frequency dependence, the initial
decline in polymorphism, although smaller than under each
of these two forms of balancing acting separately, was still
pronounced. Our results thus consistently show that, unlike
in large populations, balancing selection acting on parasite
resistance in a small population can deplete MHC variation
faster than expected under drift. While biological signifi-
cance of about 20% initial loss of MHC diversity, com-
pared to drift, may be debated, our results clearly indicate
that we cannot rely on selection to counteract drift from
depleting MHC polymorphism.
Our simulations reveal, however, that whether the fre-
quency of MHC polymorphisms is higher or lower than
expected under drift depends on the timescales considered.
For 20–60 host generations after the bottleneck, depending
8.6
9
9.4
S e q u e n c e
s i m i l a r i t y
8.6
9
9.4
0 10 20 30 40 50 60 70 80 90 100
8.6
9
9.4
Time [generations after bottleneck]
Drift Coev. +/− CIDrift
+/− CICoev.
a
b
c
Fig. 11 The mean sequence similarity between MHC molecules
(mean number of identical bits) under drift and coevolution in
bottlenecked populations of 50 individuals originating from source
population of sizes: a N = 1,000; b N = 3,000; c N = 5,000;pathogen mutation rate was 2 9 10-3
50
70
90
110
130
50
70
90
110
0 20 40 60 80 10050
70
90
110
Time [generations after bottleneck]
F u n c t i o n a l s i m i l a r i t y
Drift Coev. +/− CIDrift
+/− CICoev.
a
b
c
Fig. 12 The mean functional similarity between pairs of MHC
molecules (mean number of unique antigens presented by both
alleles) under drift and coevolution in bottlenecked populations of 50
individuals, originating from source population of size 3,000, under
three different pathogen mutation rates: a 10-3
; b 2 9 10-3
;
c 5 9 10-3
0 200 400 600 800 10000
10
20
30
40
50
60
70
Time [generations after bottleneck]
N u m b e r o f a l l e l e s
10−2
Coev.
10−2
Drift
5⋅10−3
Coev.
5⋅10−3
Drift
2⋅10−3
Coev.
2⋅10−3
Drift
10−3
Coev.
10−3
Drift
Fig. 13 MHC polymorphism in a population of 3,000 individuals
after a bottleneck of 10 host generations (population size 50
individuals between generation -10 and 0), under drift and
coevolution
8.2
8.7
9.2
8.2
8.7
9.2
0 200 400 600 800 10008.7
8.9
9.1
Time [generations after bottleneck]
S e q
u e n c e s i m i l a r i t y
Drift Coev. +/− CIDrift
+/− CICoev.
b
c
a
Fig. 14 The mean sequence similarity of MHC molecules (mean
number of identical bits) under drift and coevolution in a population
that has undergone a 10-generation bottleneck followed by an
increase to a size of 3,000, at three different pathogen mutation rates:
a 10-3
; b 2 9 10-3
; c 5 9 10-3
Conserv Genet
123
Page 8
8/8/2019 MHC Diversity in Bottleneck Ed Populations-A Simulation Model
http://slidepdf.com/reader/full/mhc-diversity-in-bottleneck-ed-populations-a-simulation-model 8/9
on simulation parameters (compare Figs. 6–8), MHC
polymorphism was lower under selection than under drift,
the difference being most pronounced around the 10th–
20th host generation after the reduction in population size.
The disadvantageous effect of selection on MHC diversity
was the largest under the most severe bottleneck. Our
results suggest that a common observation of reduced
MHC variation in populations subject to recent population
bottlenecks (e.g. Babik et al. 2005; Hansson and Richard-
son 2005; Bollmer et al. 2007; Mainguy et al. 2007; Rad-
wan et al. 2007; Zhu et al. 2007; Biedrzycka and Radwan2008, but see Aguilar et al. 2004 for an exception) does not
need to imply that selection on MHC variation in these
populations is weak or non-existent. Indeed, our results
suggest a resolution of the apparent discrepancy between
the widespread evidence for historical positive selection
acting on MHC and inability of the same selection to
maintain MHC diversity during population bottlenecks
(reviewed in Radwan et al. 2009). Our simulations indicate
that even under joint action of heterozygote advantage and
negative-frequency dependence, selection in small popu-
lations should not be expected to maintain more MHC
variation than drift.
Incidental bottlenecks can severely reduce MHC poly-
morphism, but as the population size increases, selection
and mutation restores variation to pre-bottleneck levels
(Fig. 13). Recovery of MHC diversity via mutation has
been documented in American moose, a species that
underwent a population bottleneck during the Pleistocene
glaciations (Mikko and Andersson 1995).
The initial higher rate of decline of MHC polymor-
phism, relative to drift, is likely to result from the fact that
while selection still affects allele frequencies in small
populations, frequency-dependence and heterozygote
advantage are becoming less effective in protecting poly-
morphism (Hedrick 1972). The increase in the frequency of
alleles conferring resistance to current parasites in small
populations would facilitate the loss of rare alleles due to
drift. In large populations, these rare alleles would have
been retained, and many of them can be temporarily (undercurrent composition of parasite genotypes) disadvanta-
geous, decreasing average population fitness. Thus, when
such rare disadvantageous alleles are lost due to drift,
population fitness should increase. Indeed, this is what we
observed (Fig. 10). However, as MHC alleles are lost and
parasites keep evolving, average fitness of hosts declines
below the pre-bottleneck level (Fig. 10), as the host
mutation is not effective enough in restoring the most
resistant alleles. This process is likely to make antigen-
binding abilities of alternative alleles more even, prevent-
ing extreme changes in allele frequencies and leaving
balancing selection more time to counteract allele loss dueto drift. This could explain the increased efficiency of
balancing selection in maintaining polymorphism we
observed in the late phase of the bottleneck.
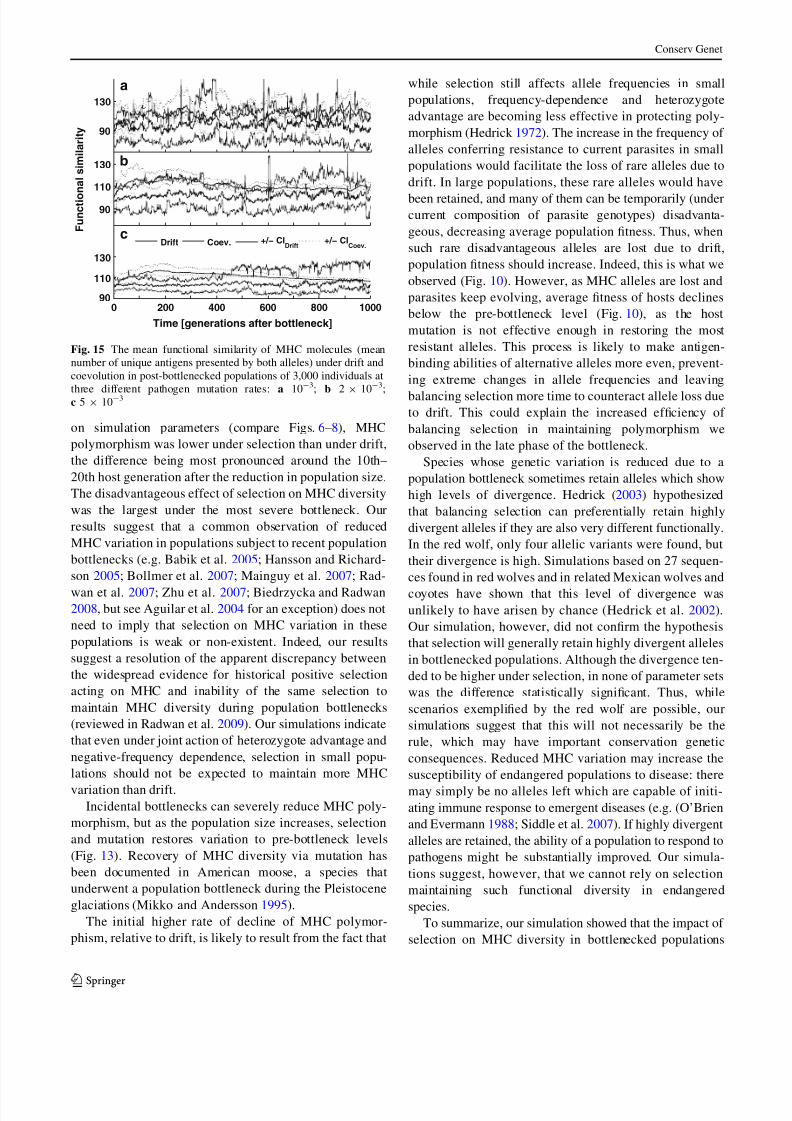
Species whose genetic variation is reduced due to a
population bottleneck sometimes retain alleles which show
high levels of divergence. Hedrick (2003) hypothesized
that balancing selection can preferentially retain highly
divergent alleles if they are also very different functionally.
In the red wolf, only four allelic variants were found, but
their divergence is high. Simulations based on 27 sequen-
ces found in red wolves and in related Mexican wolves and
coyotes have shown that this level of divergence was
unlikely to have arisen by chance (Hedrick et al. 2002).
Our simulation, however, did not confirm the hypothesis
that selection will generally retain highly divergent alleles
in bottlenecked populations. Although the divergence ten-
ded to be higher under selection, in none of parameter sets
was the difference statistically significant. Thus, while
scenarios exemplified by the red wolf are possible, our
simulations suggest that this will not necessarily be the
rule, which may have important conservation genetic
consequences. Reduced MHC variation may increase the
susceptibility of endangered populations to disease: there
may simply be no alleles left which are capable of initi-
ating immune response to emergent diseases (e.g. (O’Brien
and Evermann 1988; Siddle et al. 2007). If highly divergent
alleles are retained, the ability of a population to respond to
pathogens might be substantially improved. Our simula-
tions suggest, however, that we cannot rely on selection
maintaining such functional diversity in endangered
species.
To summarize, our simulation showed that the impact of
selection on MHC diversity in bottlenecked populations
90
130
90
110
130
0 200 400 600 800 100090
110
130
Time [generations after bottleneck]
F u n c t i o
n a l s i m i l a r i t y
Drift Coev. +/− CIDrift
+/− CICoev.
a
b
c
Fig. 15 The mean functional similarity of MHC molecules (mean
number of unique antigens presented by both alleles) under drift and
coevolution in post-bottlenecked populations of 3,000 individuals at
three different pathogen mutation rates: a 10
-3
; b 29
10
-3
;c 5 9 10-
3
Conserv Genet
123
Page 9
8/8/2019 MHC Diversity in Bottleneck Ed Populations-A Simulation Model
http://slidepdf.com/reader/full/mhc-diversity-in-bottleneck-ed-populations-a-simulation-model 9/9
depends on the timescales involved, but during the initial
stage of the bottleneck, selection should not be expected to
maintain higher levels of polymorphism than drift. On the
contrary, it may speed up its depletion. Furthermore,
selection does not tend to maintain appreciably higher
diversity of MHC alleles, and is thus unlikely to facilitate a
response by endangered populations to assaults form
emergent pathogens. However, if appropriate conservationmeasures are taken fast enough, a quick rebound in popu-
lation size may allow selection to maintain or restore MHC
variation.
Acknowledgements We thank Maciej Danko and Filip Kapustka
for advice, Wiesiek Babik for reading earlier version of the manu-
script, and Referees for their helpful comments.
References
Aguilar A, Roemer G, Debenham S, Binns M, Garcelon D, Wayne
RK (2004) High MHC diversity maintained by balancingselection in an otherwise genetically monomorphic mammal.
Proc Natl Acad Sci USA 101:3490–3494
Babik W, Durka W, Radwan J (2005) Sequence diversity of the MHC
DRB gene in the Eurasian beaver (Castor fiber ). Mol Ecol
14:4249–4257
Biedrzycka A, Radwan J (2008) Population fragmentation and major
histocompatibility complex variation in the spotted suslik,
Spermophilus suslicus. Mol Ecol 17:4801–4811
Bollmer JL, Vargas FH, Parker PG (2007) Low MHC variation in the
endangered Galapagos penguin (Spheniscus mendiculus). Immu-
nogenetics 59:593–602
Borghans JAM, Beltman JB, De Boer RJ (2004) MHC polymorphism
under host-pathogen coevolution. Immunogenetics 55:732–739
de Campos-Lima PO, Levitsky V, Imreh MP, Gavioli R, Masucci MG
(1997) Epitope-dependent selection of highly restricted ordiverse T cell receptor repertoires in response to persistent
infection by Epstein-Barr virus. J Exp Med 186:83–89
Doherty PC, Zinkernagel RM (1975) Enhanced immunological
surveillance in mice heterosytous at H-2 gene complex. Nature
256:50–52
Ellegren H, Hartman G, Johansson M, Andersson L (1993) Major
histocompatibility complex monomorphism and low-levels of
DNA-fingerprinting variability in a reintroduced and rapidly
expanding population of beavers. Proc Natl Acad Sci USA
90:8150–8153
Froeschke G, Sommer S (2005) MHC class II DRB variability and
parasite load in the striped mouse ( Rhabdomys pumilio) in the
southern Kalahari. Mol Biol Evol 22:1254–1259
Garrigan D, Hedrick PW (2003) Detecting adaptive molecular
polymorphism, lessons from the MHC. Evolution 57:1707–1722Hansson B, Richardson DS (2005) Genetic variation in two endan-
gered Acrocephalus species compared to a widespread congener:
estimates based on functional and random loci. Anim Conserv
8:83–90
Hedrick P (1972) Maintenance of genetic variation with a frequency-
dependent selection as compared to overdominance model.
Genetics 72:771–775
Hedrick P (2003) The major histocompatibility complex (MHC) in
declining populations: an example of adaptive variation. In: Holt
WV, Pickard AR, Rodger JC, Wildt DE (eds) Reproduction
science and integrated conservation. Cambridge University
Press, Cambridge, pp 97–113
Hedrick PW, Lee RN, Garrigan D (2002) Major histocompatibility
complex variation in red wolves: evidence for common ancestry
with coyotes and balancing selection. Mol Ecol 11:1905–1913
Hughes AL (1991) MHC polymorphism and the design of captive
breeding programs. Conserv Biol 5:249–251
Mainguy J, Worley K, Cote SD, Coltman DW (2007) Low MHC
DRB class II diversity in the mountain goat: past bottlenecks and
possible role of pathogens and parasites. Conserv Genet 8:885–
891
McClelland EE, Penn DJ, Potts WK (2003) Major histocompatibility
complex heterozygote superiority during coinfection. Infect
Immun 71:2079–2086
Mikko S, Andersson L (1995) Low major histocompatibility complex
class-II diversity in European and North-American moose. Proc
Natl Acad Sci USA 92:4259–4263
O’Brien S, Evermann F (1988) Interactive influence of infectious
disease and genetic diversity in natural populations. Trends Ecol
Evol 3:254–259
Piertney SB, Oliver MK (2006) The evolutionary ecology of the
major histocompatibility complex. Heredity 96:7–21
Radwan J, Kawalko A, Wojcik JM, Babik W (2007) MHC-DRB3
variation in a free-living population of the European bison, Bison
bonasus. Mol Ecol 16:531–540
Radwan J, Biedrzycka A, Babik W (2009) Does reduced MHC
diversity decrease viability of vertebrate populations? Biol
Conserv. doi:10.1016/j.biocon.2009.07.026
Robertson A (1962) Selection for heterozygotes in small populations.
Genetics 47:1291–1300
Siddle HV, Kreiss A, Eldridge MDB, Noonan E, Clarke CJ, Pyecroft
S, Woods GM, Belov K (2007) Transmission of a fatal clonal
tumor by biting occurs due to depleted MHC diversity in a
threatened carnivorous marsupial. Proc Natl Acad Sci USA
104:16221–16226
Snell J (1968) The H-2 locus of the mouse: observational and
speculations concerning its comparative genetics and its poly-
morphism. Folia Biol 14:335–338
Sommer S (2005) The importance of immune gene variability (MHC)
in evolutionary ecology and conservation. Front Zool 12:16
Stern LJ, Brown JH, Jardetzky TS, Gorga JC, Urban RG, Strominger
JL, Wiley DC (1994) Crystal structure of the human class II
MHC protein HLA-DR1 complexed with an influenza virus
peptide. Nature 368:215–221
Westerdahl H, Hansson B, Bensch S, Hasselquist D (2004) Between-
year variation of MHC allele frequencies in great reed warblers:
selection or drift? J Evol Biol 17:485–492
Zhu L, Ruan XD, Ge YF, Wan QH, Fang SG (2007) Low majorhistocompatibility complex class II DQA diversity in the Giant
Panda ( Ailuropoda melanoleuca). BMC Genet 8:29
Conserv Genet
123


![MANUAL DE USUARIO MÁQUINAS DE HIELO...MANUAL DE USUARIO [AUTOCONTENIDAS Y REMOTAS ] MHC-230/506MA - MHC-235/517MA - MHC-280/625MA - MHC-320/706MA MHC-500/1109MAR - MHC-680/1466MAR](https://static.documents.pub/doc/80x56/5e93db5530a5a625c35ecff2/manual-de-usuario-mquinas-de-hielo-manual-de-usuario-autocontenidas-y-remotas.jpg)


