76
FINANCIAL SECTION For the Year Ended March 31, 2021 MHI REPORT 2021
FINANCIAL SECTIONFor the Year Ended March 31, 2021
MHI REPORT
2021

20212020
240
120
0
–120
–240
2020
5,000
4,000
3,000
2,000
1,000
0 2021
SEGMENT INFORMATIONMitsubishi Heavy Industries, Ltd. and Consolidated Subsidiaries Fiscal years ended March 31, 2020 and 2021
Billions of yen
REVENUE
Millions of yen Thousands of U.S. dollars
REPORTING SEGMENT 2020 2021 2021
Energy Systems ¥1,590,293 ¥1,546,003 $13,964,438
Plants & Infrastructure Systems 792,925 637,258 5,756,101
Logistics, Thermal & Drive Systems 990,105 860,307 7,770,815
Aircraft, Defense & Space 704,985 702,109 6,341,875
Subtotal 4,078,310 3,745,679 33,833,249
Adjustments (36,934) (45,732) (413,079)
Total ¥4,041,376 ¥3,699,946 $33,420,160
DEPRECIATION AND AMORTIZATION
Millions of yen Thousands of U.S. dollars
REPORTING SEGMENT 2020 2021 2021
Energy Systems ¥ 47,085 ¥ 44,172 $ 398,988
Plants & Infrastructure Systems 13,265 12,047 108,815
Logistics, Thermal & Drive Systems 43,749 43,325 391,337
Aircraft, Defense & Space 27,082 26,987 243,762
Subtotal 131,184 126,532 1,142,913
Adjustments 13,455 12,709 114,795
Total ¥144,639 ¥139,242 $1,257,718
Logistics, Thermal & Drive Systems
Plants & Infrastructure Systems
Energy Systems
Billions of yen
PROFIT (LOSS) FROM BUSINESS ACTIVITIES
Millions of yen Thousands of U.S. dollars
REPORTING SEGMENT 2020 2021 2021
Energy Systems ¥144,383 ¥127,699 $1,153,454
Plants & Infrastructure Systems 25,534 (10,222) (92,331)
Logistics, Thermal & Drive Systems 29,348 15,613 141,026
Aircraft, Defense & Space (208,792) (94,841) (856,661)
Subtotal (9,524) 38,249 345,488
Adjustments (20,014) 15,832 143,004
Total ¥(29,538) ¥ 54,081 $ 488,492
Logistics, Thermal & Drive Systems
Plants & Infrastructure Systems
Energy Systems
Aircraft, Defense & Space
Adjustments
Aircraft, Defense & Space
Adjustments
MHI REPORT 2021 FINANCIAL SECTION1
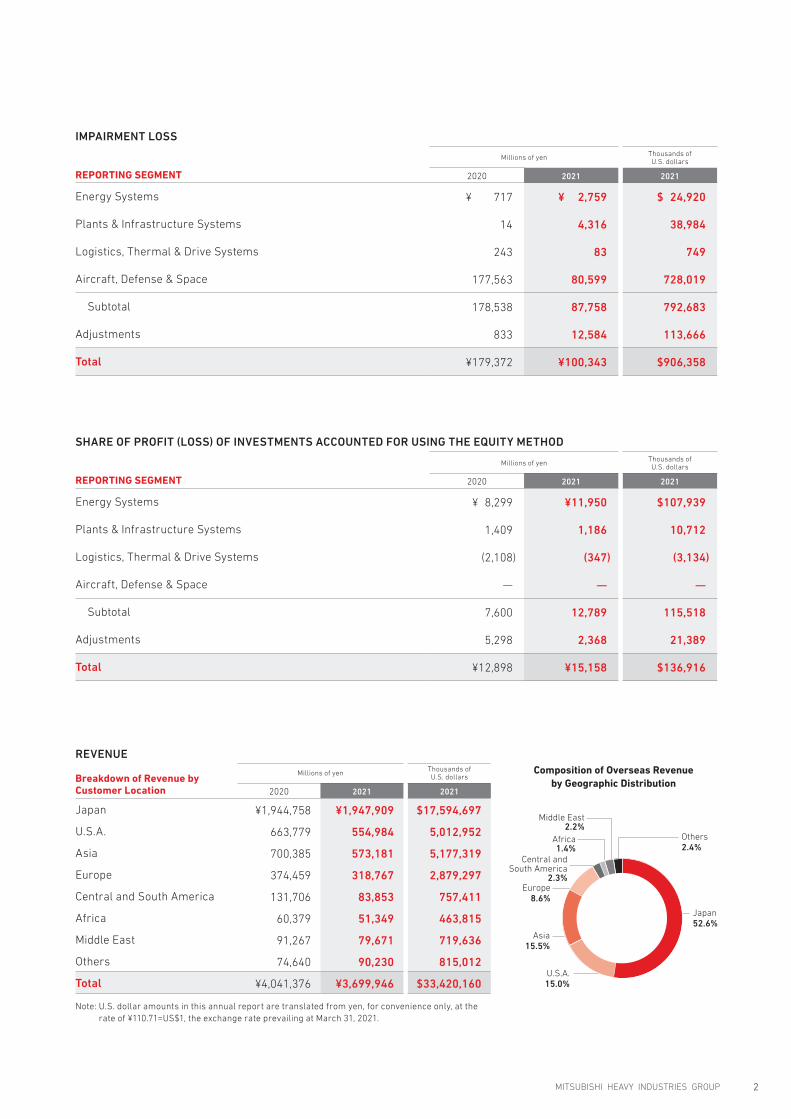
IMPAIRMENT LOSS
Millions of yen Thousands of U.S. dollars
REPORTING SEGMENT 2020 2021 2021
Energy Systems ¥ 717 ¥ 2,759 $ 24,920
Plants & Infrastructure Systems 14 4,316 38,984
Logistics, Thermal & Drive Systems 243 83 749
Aircraft, Defense & Space 177,563 80,599 728,019
Subtotal 178,538 87,758 792,683
Adjustments 833 12,584 113,666
Total ¥179,372 ¥100,343 $906,358
SHARE OF PROFIT (LOSS) OF INVESTMENTS ACCOUNTED FOR USING THE EQUITY METHOD
Millions of yen Thousands of U.S. dollars
REPORTING SEGMENT 2020 2021 2021
Energy Systems ¥ 8,299 ¥11,950 $107,939
Plants & Infrastructure Systems 1,409 1,186 10,712
Logistics, Thermal & Drive Systems (2,108) (347) (3,134)
Aircraft, Defense & Space — — —
Subtotal 7,600 12,789 115,518
Adjustments 5,298 2,368 21,389
Total ¥12,898 ¥15,158 $136,916
REVENUE
Breakdown of Revenue by Customer Location
Millions of yen Thousands of U.S. dollars
2020 2021 2021
Japan ¥1,944,758 ¥1,947,909 $17,594,697
U.S.A. 663,779 554,984 5,012,952
Asia 700,385 573,181 5,177,319
Europe 374,459 318,767 2,879,297
Central and South America 131,706 83,853 757,411
Africa 60,379 51,349 463,815
Middle East 91,267 79,671 719,636
Others 74,640 90,230 815,012
Total ¥4,041,376 ¥3,699,946 $33,420,160
Note: U.S. dollar amounts in this annual report are translated from yen, for convenience only, at the rate of ¥110.71=US$1, the exchange rate prevailing at March 31, 2021.
Composition of Overseas Revenue by Geographic Distribution
Others2.4%
U.S.A.15.0%
Japan52.6%
Middle East2.2%
Central andSouth America
2.3%
Africa1.4%
Europe8.6%
Asia15.5%
MITSUBISHI HEAVY INDUSTRIES GROUP 2

¥324.2 billion from the end of the previous fiscal year due to
the above-mentioned transfer of MHPS shares to the Company
based on the settlement agreement with Hitachi resulted in a
decrease in bonds, borrowings and other financial liabilities.
Due to the increase in profit attributable to owners of the
parent and other factors, total equity increased by ¥149.3 billion
from the end of the previous fiscal year, to ¥1,439.3 billion.
As a result of the above, the ratio of equity attributable to
owners of the parent at the end of the fiscal year ended March
31, 2021 was 28.4%, an increase of 4.0 percentage points over
the 24.4% recorded at the end of the previous fiscal year.
» SOURCE OF FUNDS AND LIQUIDITY
Cash Flow Analysis
Net cash used in operating activities came to ¥94.9 billion,
¥547.5 billion less than the net cash provided by operating
activities of ¥452.5 billion in the previous fiscal year. This was
due to the partial recovery of the indemnification assets for
South African projects in the previous fiscal year, as well as
an increase in trade receivables and a larger reduction in
contract liabilities in the fiscal year ended March 31, 2021,
which combined with other factors caused a shift towards
increased demand for working capital.
Net cash used in investing activities of ¥182.2 billion, ¥57.3
billion less than in the previous fiscal year. While payments
were made for acquisition of businesses, there were reduc-
tion in cash used for purchases of property, plant and
equipment and intangible assets, and in payments for acquisi-
tion of subsidiaries.
MANAGEMENT’S DISCUSSION AND ANALYSIS
» ANALYSIS OF OPERATING RESULTS
Consolidated revenue decreased by ¥341.4 billion or 8.4% year
on year, to ¥3,699.9 billion.
Profit from business activities decreases in the Plants &
Infrastructure Systems segment, Energy Systems segment,
and Logistics, Thermal & Drive Systems segment, but Aircraft,
Defense & Space segment posted an increase, resulting in an
overall improvement of ¥83.6 billion year on year to ¥54.0
billion, while profit before income taxes rose by ¥82.0 billion
year on year to ¥49.3 billion.
Meanwhile, profit attributable to owners of the parent
came to ¥40.6 billion, ¥46.4 billion or 53.4% lower than in the
previous fiscal year. This was because deferred tax assets in
relation to losses posted in previous fiscal years were recog-
nized in the previous fiscal year.
» ANALYSIS OF FINANCIAL POSITION
Total assets as of March 31, 2021, were ¥4,810.7 billion, down
by ¥174.9 billion from the end of the previous fiscal year due to
the following factors. We transferred all shares in our offshore
wind turbine joint venture with Danish company, Vestas Wind
Systems A/S (“Vestas”) to Vestas, while acquiring new shares
in Vestas itself, which led to an increase in other financial
assets. However, based on the settlement agreement with
Hitachi, Ltd. (“Hitachi”), the shares in Mitsubishi Hitachi Power
Systems, Ltd. (“MHPS”) held by Hitachi were acquired by the
Company, resulting in indemnification assets for South African
projects being recovered in their entirety and reduced to zero.
Total liabilities of ¥3,371.3 billion as of March 31, 2021, down by
CONSOLIDATED STATEMENT OF FINANCIAL POSITION
Cash andcash
equivalents
281.6
Other assets
4,704.0
Interest-bearingliabilities
598.2
Other liabilities
3,097.3
Equity attributableto owners of theparent
1,218.3
Non-controllinginterests
71.7
FY2019Equity ratio ������������������������������������������������������������������������������������������������������������������������������������ 24.4%
D/E ratio ����������������������������������������������������������������������������������������������������������������������������������������� 46.38%
ROE ��������������������������������������������������������������������������������������������������������������������������������������������������������������������� 6.6%
FY2020Equity ratio ������������������������������������������������������������������������������������������������������������������������������������ 28.4%
D/E ratio ����������������������������������������������������������������������������������������������������������������������������������������� 62.92%
ROE ��������������������������������������������������������������������������������������������������������������������������������������������������������������������� 3.1%
In billions of yenTotal assets
4,985.6Total assets
4,810.7Cash and
cashequivalents
245.4
Equity attributableto owners of theparent
1,366.3
Other liabilities
2,465.7
Non-controllinginterests
73.0
Interest-bearingliabilities
905.6
Other assets
4,565.3
MHI REPORT 2021 FINANCIAL SECTION3

Net cash from financing activities came to ¥221.7 billion,
¥426.1 billion more than the ¥204.4 billion used in the preced-
ing fiscal year. Key sources of cash were proceeds from
long-term borrowings and the issuance of bonds.
Primary Funding Requirements
MHI Group primarily requires funds in operating activities for
working capital for manufacturing activities (materials, out-
sourcing, and personnel costs), business development
expenses and other selling expenses related to winning new
orders, and R&D expenses that enhance the competitiveness
of its products, strengthen manufacturing capabilities and
enable the launch of new businesses. In investing activities,
funds are required for capital investments to grow busi-
nesses, raise productivity, and enable the launch of new
businesses as well as for the purchase of investment securi-
ties related to the execution of business strategies.
In growth areas, MHI Group is planning to purchase invest-
ment securities and execute necessary capital investments
and R&D investments. As a whole, the Group plans to stream-
line its assets and selectively concentrate on core investment
schemes, while anticipating funding requirements in future
growth fields and closely monitoring the latest market envi-
ronments and order trends.
Breakdown of Interest-Bearing Debt and its Applications
The breakdown of interest-bearing debt as of March 31, 2021,
was as follows:In billions of yen
Total Due within one year
Due after one year
Short-term borrowings 50.5 50.5 —
Commercial paper 196 196 —
Long-term borrowings 464 31.2 432.8
Bonds 195 45 150
Total 905.6 322.7 582.8
MHI Group is involved in various projects with compara-
tively long construction periods. It also owns numerous
manufacturing facilities that employ large-scale machinery.
Consequently, MHI Group must secure a stable level of work-
ing capital and funds for capital investments. The Group has
worked consistently to streamline assets and to repay bor-
rowings as they mature. However, in the order-made products
business there has been a trend towards payments for proj-
ects for which advance payments have been received in
previous years being disbursed in accordance with progress
made, and there have also been increases in receivables and
inventories caused by the impact of COVID-19 on the
Commercial Aircraft business. As a result, total interest-
bearing debt at the end of the fiscal 2020 was ¥905.6 billion,
consisting of ¥322.7 billion due within one year, and ¥582.8
billion with maturities of more than one year.
The interest-bearing debt mentioned above is utilized as
working capital and for capital investments required for busi-
ness activities. MHI Group plans to use these funds mainly in
key growth fields that are expected to require funds, including
thermal power systems, and mass and medium-lot manufac-
tured products, including material handling equipment and
air-conditioning & refrigeration systems.
Financial Policy
MHI Group funds its working capital and capital investments
from its operating cash flows. Any additional requirements
can be met with interest-bearing debt.
In appropriately determining the amounts and methods of
procuring long-term funds mainly through long-term borrow-
ings, bonds, MHI Group takes into account the funding
requirements of its business plans, interest rate trends in the
procurement environment, and the repayment schedule for
its existing debt.
Additionally, in its efforts to reduce interest-bearing debt,
MHI Group strives to efficiently utilize surplus funds within the
Group using a cash management system. At the same time,
MHI Group is working to improve asset efficiency by reducing
trade receivables and inventories and by raising the utilization
rate of its property, plant and equipment.
MHI Group considers the repurchase of treasury stock by
taking a number of factors into consideration, including the
state of progress on business plans, the Company’s perfor-
mance outlook, its financial condition, stock price trends, and
the financial market environment.
» DIVIDEND POLICY
Under the 2018 Medium-Term Business Plan, the Group for-
mulated a basic policy of providing returns to shareholders at
a dividend payout ratio of around 30%, while giving consider-
ation to the balance between business growth and financial
stability. This basic policy remains unchanged in the 2021
Medium-term Business Plan.
As decided in MHI’s Articles of Incorporation, the Company
pays dividends from retained earnings to shareholders twice
a year. These payments consist of an interim dividend with a
record date of September 30 and a year-end dividend with a
record date of March 31.
Taking into consideration factors such as the Group’s oper-
ating performance during the fiscal year and its financial
position, the year-end dividend was set at ¥75 per share.
Because the Company elected to forgo paying an interim
dividend for the fiscal year, the annual dividend was also ¥75
per share.
Internal reserves will be utilized to further strengthen the
Group’s corporate structure and enhance the Group’s busi-
ness development going forward.
MITSUBISHI HEAVY INDUSTRIES GROUP 4

OPERATIONAL RISKS
Management acknowledges certain key risks, as described in
(3) below, that have the potential to significantly influence our
financial position, operating results, and cash flow status
(hereinafter referred to collectively as “operating results”) of
the MHI Group.
Although MHI Group works to prepare countermeasures to
these key risks and others in advance, complete avoidance is
not feasible. The Group seeks to advance its business activi-
ties in accordance with the Medium-Term Business Plan while
maintaining an awareness of these risks, and striving to mini-
mize their impact in the event that they materialize.
In the medium to long term, these key risks could bring
about further changes to the business environment in which
the Group operates, as well as to the structure of society. The
Group acknowledges the need for foresight and for proactive
measures to enable us to adapt to such future developments.
Items relating to the future are based on the judgment of
the Group as of the end of fiscal 2020.
(1) Process for considering key risksMHI Group has formulated a management process for identi-
fying and discussing risks encountered during the execution
of business, based on which a list of risks is created. When
identifying risks, we may use expertise from outside the
Company to assist in creating an exhaustive list of those that
are relevant to MHI Group. Based on this list, we work to
unearth specific risks that may materialize over a period of
roughly 10 years. We then consider the probability of these
risks materializing and the impact in the event that they do
materialize, taking into account the effects of the counter-
measures we have prepared. For quantifiable risks that are
identified as having a potentially material impact on the busi-
ness of the Group, we conduct a risk mapping exercise as
follows. We also identify qualitative risks that are impractical
to quantify using the exhaustive list mentioned above.
(2) MHI Group risk countermeasuresThe Group has implemented systems designed to manage
each type of risk and responsibilities are clearly defined
to ensure the appropriate management of risk. Risk is peri-
odically evaluated and analyzed and necessary avoidance
or mitigating measures are taken. The effectiveness and
appropriateness of these measures are audited through
internal audits and reported to the Board of Directors and
the Audit and Supervisory Committee in a timely manner. In
preparation for situations in which significant risk material-
izes, MHI has put in place measures to ensure that the
information required to respond accurately and promptly to
an emergency is communicated to top-level management
without delay. Risk management supervisors are assigned
to each business division.
Risk management in MHI Group is practiced in accordance
with the scope and requirements clarified in the Business
Risk Management Charter. The Business Risk Management
Committee shares information on significant risks and dis-
cusses policy responses by top-level management, with the
aim of clarifying the system and the roles of management,
business segments, and corporate departments. With the
Business Risk Management Department acting as the respon-
sible department, MHI Group engages in business risk
management activities that bring together management,
business segments, and corporate departments.
In point (1) of each of items 1 to 7 in “(3) Key risks” below are
presented specific examples of the countermeasures prepared
by MHI Group for the item in question. However, not only are we
implementing initiatives to avoid and mitigate risks in accor-
dance with the type and nature of each, including those that
are not key risks, but we are also working to minimize the
impact described in “(2) Potential Impact on Operating Results”
of items 1 to 7 in the event that such a risk materializes.
(3) Key risksa) THE SPREAD OF THE COVID-19 PANDEMIC(i) Global Pandemic and its Impact on Economic Activity
Since the end of 2019, COVID-19 has developed into a global
pandemic. A gradual resumption of economic activity is cur-
rently underway, and signs of recovery have become visible in
both the Japanese and the wider global economy. Nevertheless,
since it is still unable to forecast with any certainty when the
spread of COVID-19 will end and when demand will recover to
previous levels in some industries, caution remains necessary
in relation to the impact of COVID-19.
In terms of specific steps taken to mitigate these impacts,
MHI Group is strengthening profitability by investing in areas
where the market is expected to expand, reinforcing sales
networks and implementing initiatives to shift towards ser-
vice businesses. In addition, we have taken action on staffing
and other measures to reduce fixed costs, temporarily fur-
loughed parts of our workforce, revised plant operating rates,
reduced output, cut down on external expenditure, revised
investment plans, made more effective use of surplus
resources, and made use of subsidy programs available in
various countries. We are also putting in place working-from-
home environments, expanding related tools and reviewing
the system so that a wide range of business and operational
tasks can be performed remotely.
Probability of occurrence
Impa
ct v
alue
MHI REPORT 2021 FINANCIAL SECTION5
(ii) Potential Impact on Operating Results
Since the Group is engaged in business not only in Japan, but
around the world, it has been affected by the spread of the
COVID-19 pandemic in various countries. The made-to-order
business, which serves infrastructure-related companies and
government agencies, accounts for approximately two thirds
of Group sales. Delayed progress in project orders currently
in the pipeline, particularly those overseas, have led to slow-
down of revenue recognition. Operating results may also be
affected by travel restrictions, supply chain disruption, and
delays on contract negotiations and in the order-taking pro-
cess. The Commercial Aircraft business has also been
affected by the reduction in airline industry capital investment
due to the plunge in passenger air travel demand. This impact
extends to the Group’s production and service business, and
forecasting when demand will recover going forward is prob-
lematic. It is infeasible to predict these effects with much
precision, and going forward they could become more signifi-
cant and prolonged, which could have a material impact on
the Group’s operating results.
b) CHANGES IN THE BUSINESS ENVIRONMENT(i) Deterioration of the Business Environment Surrounding
the Group
The business environment in which the Group operates is
undergoing rapid change. For example, at a global level there
have been changes in the economic environment such as
increased antagonism between the United States and China
leading to the splitting and capture of supply chains, and
intensified competition for dominance through cross-border
regulation in the areas of digital devices and data. Japan,
meanwhile, is undergoing changes in the structure of its
society. It faces a serious labor shortage as its population
continues to shrink, its birthrate declines, and its people grow
older, and it risks an increase in business closures, disconti-
nuity of technologies and skills, and a hollowing out of its
manufacturing sector. The coexistence of economic develop-
ment and environmental load reduction has become a social
issue worldwide, and environmental regulations have been
strengthened in various fields. Such issues are closely related
to the Group’s business. Particularly in the field of energy,
with the development of emerging economies and advance-
ments in electrification, such as the spread of electric
vehicles, global demand for electric power is set to grow
substantially. At the same time, however, global warming is
expected to accelerate efforts to shift to carbon-free energy,
and lead to strengthened regulation of the use of fossil fuels,
all of which are driving significant changes in the business
environment for the Group.
In order to address these changes in the business environ-
ment, MHI Group is working to maintain and strengthen
product competitiveness in such areas as performance, reli-
ability, price and environmental friendliness through R&D and
capital investment. At the same time, it is focusing on incorpo-
rating external knowledge where advantageous to propose
new functions and solutions that anticipate market trends. We
are also pursuing initiatives for new business development
under the guidance of the Growth Strategy Office, which we
set up in April 2020. These include combining existing lines of
business to develop products and services, and cultivating
business domains beyond the reach of our existing business
units. With regard to the M&A and alliances we are undertak-
ing in various product areas, which take the business
environment into consideration, through activities such as
monitoring and screening at the point of entry, we are putting
initiatives aimed at smooth PMI*1 into practice.
*1. Post Merger Integration
(ii) Potential Impact on Operating Results
The trend towards strengthened export controls resulting
from antagonism between the United States and China has
intensified further. Restrictions on the Group’s business
activities in such areas as participation in business discus-
sions and the selection of suppliers, or reduced
competitiveness of the Group as a result of the increasingly
serious labor shortage in Japan and the hollowing-out of its
manufacturing center, could have a material impact on the
Group’s operating results. With regard to environmental
regulation, growing environmental awareness may lead to a
decrease in demand for products and services in businesses
such as thermal power systems, vehicular turbochargers,
and chemical plant-related engineering, as well as a reduc-
tion in business scale, and difficulty in recouping invested
capital. In addition, the thermal power generation systems
business could be affected by a sharp decline in demand for
electricity derived from fossil fuels, and the loss of service
business negotiations to competitors due to intensified com-
petition, which could in turn lead to a decline in orders. In the
event that changes in the business environment lead to cus-
tomers making the decision to cease operations of thermal
power plants on their own initiative, the resulting slump in
the service business could have a material impact on the
Group’s operating results. If various environmental regula-
tions become even more stringent than was assumed that
the time the business plan was formulated, we could encoun-
ter problems when attempting to respond to such changes.
These could result in a reduction in market competitiveness
and the loss of opportunities to win orders, which could nega-
tively impact the Group’s ability to carry its business plans
forward. Furthermore, although the Group is engaged in the
strengthening and expansion of our many energy-related
product businesses through M&A and alliances with other
companies, there could be unforeseen circumstances such
as changes in the market environment, decline in business
competitiveness, or the revision of management strategies
by other companies. Such events may prevent us from pro-
gressing as planned with these M&A and alliances with target
companies, which could have a material impact on the
Group’s operating results, for example by requiring it to write
down assets and recognize impairment losses.
MITSUBISHI HEAVY INDUSTRIES GROUP 6

OPERATIONAL RISKS
c) DISASTERS(i) Natural Disasters, War, and Acts of Terrorism
Disasters have the potential to cause both material and
human loss, disruption of smooth economic activity and social
foundation. Such force majeure events include but are not
limited to the occurrence, or more frequent occurrence of
earthquakes, tsunamis, torrential rains, floods, storms, volca-
nic eruptions, fires, lightning strikes, pandemics other than
COVID-19, and other acts of nature, and the enlargement of the
damage caused by such events. Other potential events include
war, acts of terrorism, political unrest, anti-Japan move-
ments, crimes such as hostage taking or abduction, social
infrastructure paralysis, labor disputes, power outages,
equipment superannuation or malfunction, and other man-
made factors. It is expected that climate change will lead to
enlargement of the effects of natural disasters.
The Group takes steps to mitigate these impacts. We make
use of disaster measure support tools, and have established
and maintain communication systems and a business conti-
nuity plan. We implement regular plant inspections and
training, and strengthen facilities against seismic events. As
well as taking out insurance, we also gather information on
the safety of various countries and other circumstances,
respond with appropriate measures, and cooperate with
relevant governmental agencies.
(ii) Potential Impact on Operating Results
The Group has product and service supply facilities all over
the world, with a particular concentration of production facili-
ties notably in Japan and Thailand. In the event of major
natural disasters such as earthquakes, tsunamis or floods in
those countries and regions, there could be material impacts
on the production capacity of the Group. Specific examples
include loss of or damage to production equipment, supply
chain paralysis or disruption, shortages of materials and
parts or suspension of services necessary to production,
reduced operation or idling of production plants, as well as
loss of alternative production equipment or suppliers, and
damage not covered by insurance. The resulting decline in
orders and revenues would have the potential to materially
impact the Group’s operating results.
d) PRODUCT- AND SERVICE-RELATED PROBLEMS(i) Product- and Service-Related Problems such as Quality and
Safety Issues and Rising Manufacturing Costs
As a global leader in manufacturing and engineering, the
Group leverages advanced technologies to provide solutions
for a wide range of fields, from Energy Systems, Plants &
Infrastructure Systems, through Logistics, Thermal & Drive
Systems, to Aircraft, Defense & Space. The Group makes
unceasing efforts to improve the quality and reliability of its
products, but there is nevertheless the potential for problems
with product performance or delivery delay, or safety issues
that arise in the use of our products. Other potential problems
include rising manufacturing costs stemming from factors
including changes in specifications or process delays,
unforeseen problems associated with materials and parts
procurement or construction work, claims for damages and
contract cancellations from customers due to delivery delays
or underperformance of the products, or deterioration in
customers’ financial solvency. There is also the potential for
similar problems arising from products or services in rela-
tions with our suppliers. In the event that it becomes
impossible to continue transactions with the supplier of a
specific raw material or part and an alternative supplier
cannot be arranged, there could be a negative impact on
production activities and on the provision of products or ser-
vices to the customer.
The Group takes steps to mitigate these risks, such as
through the formulation and administration of regulations, the
maintenance and upgrade of business risk management
frameworks, prior screening and post-order monitoring of
individual projects, education for those responsible for project
implementation, and executives such as business division
managers, and holding ongoing courses of product safety
seminars. In addition, the Group summarizes the causes of
large loss-making projects that occurred in the past, and the
steps taken to deal with them, and ensures that internal edu-
cation reflects the conclusions so as to prevent recurrences.
(ii) Potential Impact on Operating Results
The occurrence of such product- and service-related prob-
lems could lead to additional costs, compensation for
damages paid to customers, and the loss of societal reputa-
tion and trust. Customers, suppliers and other third parties
may bring legal action or arbitration against the Group in
Japan or overseas, to which the Group will respond. The
Group will put forth its utmost efforts so that its claims are
acknowledged in court or in arbitration, but the potential for a
case to nevertheless be ruled against us cannot be ignored.
Furthermore, in such cases, we cannot guarantee that prod-
uct liability insurance will compensate for amounts we may
be required to pay. Thus, product- and service-related prob-
lems could have a material impact on the operating results of
the Group.
e) INTELLECTUAL PROPERTY ISSUES(i) Violation of the Group’s Intellectual Property and Violation of
the Intellectual Property of Third Parties by the Group
The Group values its intellectual property, which comprises
the outcomes of its R&D, as an important management
resource, and puts it to use globally. However, there is never-
theless the potential for instances of intellectual property
infringement claims against the Group by third parties.
The Group appropriately protects its intellectual property
through patent and other rights. It also respects the intel-
lectual property of third parties, makes efforts to avoid
infringement, and takes appropriate procedures such as
MHI REPORT 2021 FINANCIAL SECTION7

licensing technology from the third parties concerned as
necessary. Specifically, we have taken measures to prevent
intellectual property-related disputes by thoroughly investi-
gating intellectual property held by other parties at each
stage of product planning, design and manufacturing. We
enhance the expertise of our Intellectual Property division
through training and human resource development.
(ii) Potential Impact on Operating Results
If competitors took legal action against us regarding the use
of intellectual property and we lost, the Group may be liable
for compensation for damages or become unable to use par-
ticular technologies, which could materially impact our
operating results. We also face the risk of being unable to
execute our business due to being unable to introduce license
for such technologies from third parties necessary to the
execution of our business.
f) INFORMATION SECURITY PROBLEMS(i) Information Security Problems
The Group comes into contact with large amounts of confiden-
tial information, including that of customers, in the execution of
its business activities. It also possesses confidential informa-
tion regarding the Group’s technologies, operations, and other
aspects of business, and our operational dependency on infor-
mation technology is increasing. In the event that increasingly
sophisticated and aggressive cyberattacks exceed the level we
currently anticipate, leading to infection by computer viruses,
unauthorized access and other unforeseen circumstances,
confidential information could be lost or leaked outside the
Group. It is also possible that such cyberattacks could result in
impediments to the use of terminals or servers.
We also implement a cybersecurity program under the
control of the CTO*2 to minimize the risks of such cyberattacks.
Under this program, we perform initiatives such as cyber-
security governance (establishing standards, implementation
of measures, self-assessments, and internal audits) and inci-
dent response.
*2. CTO: Chief Technology Officer
(ii) Potential Impact on Operating Results
Information leaks would substantially reduce our competi-
tiveness and damage our societal reputation and trust,
which could seriously impact the execution of our business.
In addition to becoming the target of investigations by the
authorities, such events could risk claims for damages being
brought against us by our customers. Furthermore if cyber-
attacks were to result in obstacles to the use of servers and
other equipment, this could have a significant impact on the
execution of operations, and lead to the risk of production
activities, and provision of goods and services to customers,
being affected. Thus, information security-related problems
have the potential to materially impact the operating results
of the Group.
g) LEGAL AND REGULATORY VIOLATIONS(i) Significant Legal and Regulatory Violations
The Group conducts business in accordance with various
domestic and overseas laws and regulations. These include
laws and regulations related to taxation, the environment, and
labor and occupational health and safety; economic laws and
regulations such as antitrust laws, anti-dumping laws, and
laws against delay in payment to subcontractors; laws and
regulations related to bribery, trade and exchange; business-
related laws and regulations, such as the construction
industry law; and the securities listing regulations at financial
instrument exchanges (these are hereinafter collectively
referred to as “laws and regulations”). Since we should never
trade risk for return when it comes to laws and regulations
and we also have a duty to ensure compliance by our manage-
ment and workforce, we take rigorous measures to instill
awareness. Specifically, MHI has formulated the “MHI Group
Global Code of Conduct,” which is aimed at all officers and
employees of the Group, and is operated in conjunction with
various other policies it has established. In addition, the Group
holds periodic meetings of the Compliance Committee, has
put in place a whistleblowing system, conveys messages from
management on the importance of thorough compliance with
laws and regulations, enhances and implements internal
education on compliance, information management, and
brand strategy on an ongoing basis, and performs internal
audits that take into account outstanding issues in various
departments. However, we cannot rule out the possibility that,
in spite of our efforts, some officers or employees may violate
laws or regulations.
(ii) Potential Impact on Operating Results
In the event of legal or regulatory violations, the Group may
become subject to investigation or examination by the rel-
evant authorities. Furthermore, the Group may be subject to
administrative penalties, such as fines, reassessment, deter-
mination, the payment of surcharges, suspension of business,
prohibition of exports, or other steps. Moreover, in the event
that laws or regulations have been infringed, the Group may
face legal action from the relevant authorities or other con-
cerned parties for damages incurred, and may lead to the loss
of societal reputation and trust. Taking into account the nature
of the Group, anti-monopoly laws in Japan and overseas, laws
and regulations related to bribery, trade and foreign
exchange, the construction industry law, and laws against
delays in payments to subcontractors could have a particu-
larly significant impact on the Group. Such violations of laws
and regulations have the potential to materially impact our
operating results.
MITSUBISHI HEAVY INDUSTRIES GROUP 8

CONSOLIDATED FINANCIAL STATEMENTS [IFRS]CONSOLIDATED STATEMENT OF FINANCIAL POSITIONMitsubishi Heavy Industries, Ltd. and Consolidated SubsidiariesAs of March 31, 2020 / March 31, 2021
Millions of yen Thousands of U.S. dollars
ASSETS NotesAs of March 31,
2020As of March 31,
2021As of March 31,
2021
Current assets:
Cash and cash equivalents 5, 10 ¥ 281,626 ¥ 245,421 $ 2,216,791
Trade and other receivables 6, 10, 24, 35 611,976 655,181 5,917,992
Other financial assets 7, 10, 35 28,539 30,677 277,093
Contract assets 24, 35 576,061 578,936 5,229,301
Inventories 11, 24 726,228 713,498 6,444,747
Indemnification asset for South African projects 12 407,800 — —
Other current assets 21 206,261 230,955 2,086,125
Total current assets 2,838,493 2,454,670 22,172,071
Non-current assets:
Property, plant and equipment 13, 15 792,920 779,696 7,042,688
Goodwill 14, 15 124,500 124,500 1,124,559
Intangible assets 14, 15 78,908 74,722 674,934
Right-of-use assets 15, 18 96,201 93,321 842,931
Investments accounted for using the equity method 17 177,569 182,897 1,652,036
Investments in securities and other financial assets 7, 10, 35 391,538 560,213 5,060,184
Deferred tax assets 16 382,729 378,338 3,417,378
Other non-current assets 15, 21 102,827 162,365 1,466,579
Total non-current assets 2,147,196 2,356,056 21,281,329
Total assets ¥4,985,690 ¥4,810,727 $43,453,409
See accompanying notes to the consolidated financial statements.
MHI REPORT 2021 FINANCIAL SECTION9
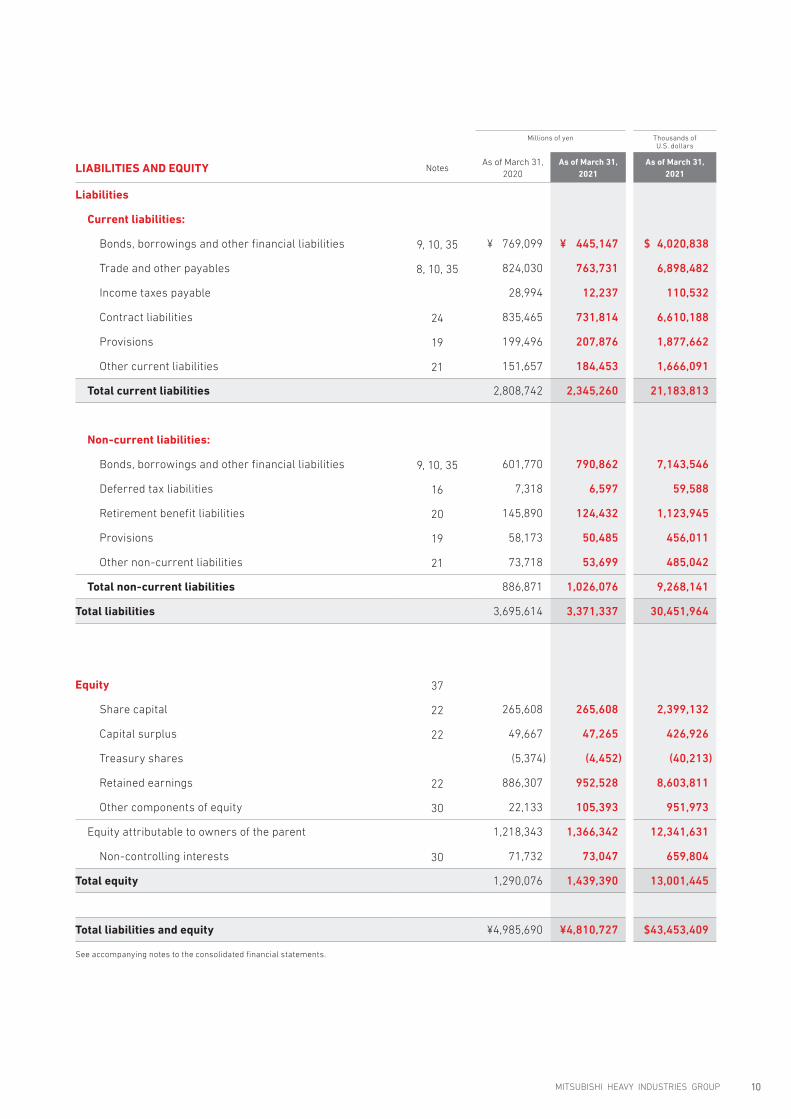
Millions of yen Thousands of U.S. dollars
LIABILITIES AND EQUITY NotesAs of March 31,
2020As of March 31,
2021As of March 31,
2021
Liabilities
Current liabilities:
Bonds, borrowings and other financial liabilities 9, 10, 35 ¥ 769,099 ¥ 445,147 $ 4,020,838
Trade and other payables 8, 10, 35 824,030 763,731 6,898,482
Income taxes payable 28,994 12,237 110,532
Contract liabilities 24 835,465 731,814 6,610,188
Provisions 19 199,496 207,876 1,877,662
Other current liabilities 21 151,657 184,453 1,666,091
Total current liabilities 2,808,742 2,345,260 21,183,813
Non-current liabilities:
Bonds, borrowings and other financial liabilities 9, 10, 35 601,770 790,862 7,143,546
Deferred tax liabilities 16 7,318 6,597 59,588
Retirement benefit liabilities 20 145,890 124,432 1,123,945
Provisions 19 58,173 50,485 456,011
Other non-current liabilities 21 73,718 53,699 485,042
Total non-current liabilities 886,871 1,026,076 9,268,141
Total liabilities 3,695,614 3,371,337 30,451,964
Equity 37
Share capital 22 265,608 265,608 2,399,132
Capital surplus 22 49,667 47,265 426,926
Treasury shares (5,374) (4,452) (40,213)
Retained earnings 22 886,307 952,528 8,603,811
Other components of equity 30 22,133 105,393 951,973
Equity attributable to owners of the parent 1,218,343 1,366,342 12,341,631
Non-controlling interests 30 71,732 73,047 659,804
Total equity 1,290,076 1,439,390 13,001,445
Total liabilities and equity ¥4,985,690 ¥4,810,727 $43,453,409
See accompanying notes to the consolidated financial statements.
MITSUBISHI HEAVY INDUSTRIES GROUP 10

CONSOLIDATED STATEMENT OF PROFIT OR LOSSMitsubishi Heavy Industries, Ltd. and Consolidated Subsidiaries For the fiscal years ended March 31, 2020 and 2021
Millions of yen Thousands of U.S. dollars
Notes 2020 2021 2021
Revenue 24 ¥4,041,376 ¥3,699,946 $33,420,160
Cost of sales 3,331,339 3,116,464 28,149,796
Gross profit 710,036 583,482 5,270,364
Selling, general and administrative expenses 25 583,874 531,383 4,799,774
Share of profit of investments accounted for using the equity method 17 12,898 15,158 136,916
Other income* 26 67,751 167,698 1,514,750
Other expenses 26 236,350 180,873 1,633,754
Profit (loss) from business activities (29,538) 54,081 488,492
Finance income 28 11,616 11,677 105,473
Finance costs 28 14,738 16,404 148,170
Profit (loss) before income taxes (32,660) 49,355 445,804
Income taxes 16 (139,945) 6,153 55,577
Profit 107,284 43,202 390,226
Profit attributable to:
Owners of the parent 87,123 40,639 367,076
Non-controlling interests 20,161 2,562 23,141
In yen In U.S. dollars
Earnings per share attributable to owners of the parent 29 2020 2021 2021
Basic earnings per share ¥259.39 ¥120.92 $1.092
Diluted earnings per share 259.06 120.83 1.091
See accompanying notes to the consolidated financial statements.
* As stated in Note 3. “Significant Accounting Policies (14) Profit from business activities,” Other income includes dividend income. The amount of dividend income in fiscal years ended March 31, 2020 and 2021 were 12,096 million yen and 10,664 million yen ($96,323 thousand) respectively.
MHI REPORT 2021 FINANCIAL SECTION11

CONSOLIDATED STATEMENT OF COMPREHENSIVE INCOMEMitsubishi Heavy Industries, Ltd. and Consolidated Subsidiaries For the fiscal years ended March 31, 2020 and 2021
Millions of yen Thousands of U.S. dollars
Notes 2020 2021 2021
Profit ¥ 107,284 ¥ 43,202 $ 390,226
Items that will not be reclassified to profit or loss:
Net gain (loss) from financial assets measured at FVTOCI 10, 30 (50,873) 37,943 342,724
Remeasurement of defined benefit plans 20, 30 (23,201) 56,097 506,702
Share of other comprehensive loss of entities accounted for using the equity method 17, 30 (24) (163) (1,472)
Total (74,098) 93,878 847,963
Items that may be reclassified to profit or loss:
Cash flow hedges 30, 35 (1,713) (271) (2,447)
Hedge cost 30, 35 (639) 874 7,894
Exchange differences on translating foreign operations 30 (25,106) 37,962 342,895
Share of other comprehensive income of entities accounted for using the equity method 17, 30 941 5,970 53,924
Total (26,517) 44,535 402,267
Total other comprehensive income (loss) (100,616) 138,413 1,250,230
Comprehensive income ¥ 6,668 ¥181,616 $1,640,466
Comprehensive income attributable to:
Owners of the parent ¥ (8,201) ¥173,635 $1,568,376
Non-controlling interests 14,869 7,980 72,080
See accompanying notes to the consolidated financial statements.
MITSUBISHI HEAVY INDUSTRIES GROUP 12

CONSOLIDATED STATEMENT OF CHANGES IN EQUITYMitsubishi Heavy Industries, Ltd. and Consolidated Subsidiaries For the fiscal years ended March 31, 2020 and 2021
Millions of yen
Equity attributable to owners of the parentNon-
controlling interests
Total equityNotes Share capital
Capital surplus
Treasury shares
Retained earnings
Other components of
equityTotal
Balance as of April 1, 2019 ¥ 265,608 ¥ 185,302 ¥ (5,572) ¥ 869,238 ¥ 96,987 ¥ 1,411,564 ¥ 317,128 ¥ 1,728,693Profit 87,123 87,123 20,161 107,284Other comprehensive loss 30 (95,324) (95,324) (5,291) (100,616)
Comprehensive income (loss) — — — 87,123 (95,324) (8,201) 14,869 6,668Transfer to retained earnings (22,287) 22,287 — —
Purchase of treasury shares (14) (14) (14)Disposal of treasury shares 57 467 524 524Dividends 23 (47,016) (47,016) (5,866) (52,883)Put options held by non-
controlling shareholders 11,214 11,214 8,912 20,127
Transactions with non-controlling interests 32 (146,568) (1,816) (148,385) (259,449) (407,835)
Other (337) (253) (750) (1,341) (3,862) (5,204)Total transactions with owners — (135,634) 198 (47,766) (1,816) (185,019) (260,265) (445,285)Balance as of March 31, 2020 ¥ 265,608 ¥ 49,667 ¥ (5,374) ¥ 886,307 ¥ 22,133 ¥ 1,218,343 ¥ 71,732 ¥ 1,290,076
Profit 40,639 40,639 2,562 43,202Other comprehensive income 30 132,995 132,995 5,418 138,413
Comprehensive income — — — 40,639 132,995 173,635 7,980 181,616Transfer to retained earnings 49,668 (49,668) — —
Purchase of treasury shares (5) (5) (5)Disposal of treasury shares 83 364 447 447Dividends 23 (25,188) (25,188) (5,073) (30,261)Transactions with
non-controlling interests 32 (1,611) (67) (1,678) (1,380) (3,058)
Other (874) 563 1,100 789 (212) 576Total transactions with owners — (2,402) 921 (24,087) (67) (25,636) (6,665) (32,302)Balance as of March 31, 2021 ¥265,608 ¥ 47,265 ¥(4,452) ¥952,528 ¥105,393 ¥1,366,342 ¥ 73,047 ¥1,439,390
Thousands of U.S. dollars
Equity attributable to owners of the parentNon-
controlling interests
Total equityNotes Share capital
Capital surplus
Treasury shares
Retained earnings
Other components of
equityTotal
Balance as of March 31, 2020 $ 2,399,132 $ 448,622 $ (48,541) $ 8,005,663 $ 199,918 $ 11,004,814 $ 647,927 $ 11,652,750Profit 367,076 367,076 23,141 390,226Other comprehensive income 30 1,201,291 1,201,291 48,938 1,250,230
Comprehensive income — — — 367,076 1,201,291 1,568,376 72,080 1,640,466Transfer to retained earnings 448,631 (448,631) — —
Purchase of treasury shares (45) (45) (45)Disposal of treasury shares 749 3,287 4,037 4,037Dividends 23 (227,513) (227,513) (45,822) (273,335)Transactions with
non-controlling interests 32 (14,551) (605) (15,156) (12,464) (27,621)
Other (7,894) 5,085 9,935 7,126 (1,914) 5,202Total transactions with owners — (21,696) 8,319 (217,568) (605) (231,559) (60,202) (291,771)Balance as of March 31, 2021 $2,399,132 $426,926 $(40,213) $8,603,811 $ 951,973 $12,341,631 $659,804 $13,001,445
See accompanying notes to the consolidated financial statements.
MHI REPORT 2021 FINANCIAL SECTION13

CONSOLIDATED STATEMENT OF CASH FLOWSMitsubishi Heavy Industries, Ltd. and Consolidated Subsidiaries For the fiscal years ended March 31, 2020 and 2021
Millions of yen Thousands of U.S. dollars
Notes 2020 2021 2021
Cash flows from operating activities:Profit (loss) before income tax ¥ (32,660) ¥ 49,355 $ 445,804Depreciation, amortization and impairment loss 323,967 238,258 2,152,091Finance income and costs 2,324 (5,369) (48,496)Share of profit of investments accounted for using the
equity method (12,898) (15,158) (136,916)
Gain on sale of shares of subsidiaries and affiliates — (83,041) (750,076)Gain on sale of property, plant and equipment,
and intangible assets (978) (45,570) (411,615)
Loss on disposal of property, plant and equipment, and intangible assets 7,842 6,912 62,433
Decrease (increase) in trade receivables 65,082 (27,739) (250,555)Increase in contract assets 46,447 4,308 38,912Increase in inventories and advanced payments 39,162 57,222 516,863Decrease in trade payables (27,859) (68,731) (620,820)Decrease in contract liabilities (34,185) (124,703) (1,126,393)Decrease in provisions (12,559) (11,011) (99,458)Increase (decrease) in retirement benefit liabilities (126) 3,496 31,577Decrease in indemnification asset of South African projects 12 131,777 — —Others 26 8,715 5,094 46,012
Subtotal 504,051 (16,677) (150,636)Interest received 7,218 5,407 48,839Dividends received 26 14,903 14,968 135,200Interest paid (10,444) (9,543) (86,198)Income taxes paid (63,164) (89,102) (804,823)
Net cash provided by operating activities 452,564 (94,948) (857,628)Cash flows from investing activities:
Purchases of property, plant and equipment and intangible assets (246,291) (146,212) (1,320,675)
Proceeds from sales of property, plant and equipment and intangible assets 31,133 43,956 397,037
Purchases of investments (including investments accounted for using equity method) (13,924) (15,796) (142,679)
Proceeds from sales and redemption of investments (including investments accounted for using equity method) 23,981 12,521 113,097
Payments for acquisition of subsidiaries (28,733) — —Proceeds from sale of subsidiaries 1,652 775 7,000Payments for acquisition of businesses — (71,082) (642,055)Net decrease in short-term loans receivable 201 708 6,395Disbursement of long-term loans (807) (8,482) (76,614)Collection of long-term loans 237 222 2,005Others (7,015) 1,138 10,279
Net cash provided by (used in) investing activities (239,566) (182,249) (1,646,183)Cash flows from financing activities:
Net increase (decrease) in short-term borrowings 9 (19,800) 96,778 874,157Proceeds from long-term borrowings 9 65,341 212,500 1,919,429Repayment of long-term borrowings 9 (45,506) (58,146) (525,210)Proceeds from issuance of bonds 9 — 65,000 587,119Payment for redemption of bonds 9 (65,000) (10,000) (90,326)Proceeds from issuance of stock to non-controlling interests 19 — —Payments for acquisition of interests in subsidiaries from
non-controlling interests 9 (13,908) (22,549) (203,676)
Dividends paid to owners of the parent 23 (46,933) (25,667) (231,839)Dividends paid to non-controlling interests (5,837) (5,144) (46,463)Proceeds from factoring agreements 9 145,264 139,315 1,258,377Repayment of liabilities under factoring agreements 9 (192,502) (145,045) (1,310,134)Repayments of lease liabilities 9 (23,256) (22,667) (204,742)Others (2,332) (2,633) (23,782)
Net cash provided by (used in) financing activities (204,452) 221,737 2,002,863Effect of exchange rate changes on cash and cash equivalents (10,153) 19,255 173,922Net decrease in cash and cash equivalents (1,608) (36,205) (327,025)
Cash and cash equivalents at the beginning of the year 5 283,235 281,626 2,543,817Cash and cash equivalents at the end of the year 5 ¥ 281,626 ¥ 245,421 $ 2,216,791
See accompanying notes to the consolidated financial statements.
MITSUBISHI HEAVY INDUSTRIES GROUP 14

NOTES TO CONSOLIDATED FINANCIAL STATEMENTSMitsubishi Heavy Industries, Ltd. and Consolidated Subsidiaries Fiscal years ended March 31, 2020 and 2021
1. REPORTING ENTITY
Mitsubishi Heavy Industries, Ltd. (hereinafter referred to as “MHI”)
is a company incorporated in Japan. MHI’s consolidated financial
statements consist of accounts of MHI and its consolidated subsid-
iaries (hereinafter referred to as the “Group”). Based on the four
reporting segments “Energy Systems,” “Plants & Infrastructure
Systems,” “Logistics, Thermal & Drive Systems” and “Aircraft,
Defense & Space,” the Group is engaged in the development, man-
ufacture, sale and after-sale service of a wide variety of products.
2. BASIS OF PREPARATION
(1) Compliance with IFRSThe consolidated financial statements of the Group have been
prepared in accordance with International Financial Reporting
Standards (IFRS), pursuant to the provisions set forth in Article 93
of the Ordinance on Terminology, Forms, and Preparation Methods
of Consolidated Financial Statements, as the Group meets the
requirements of a “Specified Company” prescribed in Article 1-2 of
said ordinance.
These consolidated financial statements were approved by
MHI’s President Seiji Izumisawa on June 29, 2021.
(2) Presentation of currencyThe Group’s consolidated financial statements are presented in
Japanese yen, which is also the Group’s functional currency.
Figures are presented in millions of yen and are rounded down to
the nearest million yen, unless otherwise indicated.
U.S. dollar amounts are included solely for convenience pur-
poses. These translations should not be construed as representa-
tions that the Japanese yen actually represent, or have been or
could be converted into U.S. dollars.
As the amounts shown in U.S. dollars are solely for convenience
purposes, the prevailing rate at March 31, 2021 of ¥110.71=US$1 is
used for the purpose of presenting U.S. dollar amounts in the
accompanying consolidated financial statements.
(3) Basis of measurementThe Group’s consolidated financial statements have been pre-
pared on the historical cost basis, except for certain items, such as
financial instruments and defined benefit liability (asset), as
described in Note 3. “Significant Accounting Policies.”
(4) Standards and interpretations not yet appliedNone of the new accounting standards and guidelines that have
been issued or amended by the date of approval of the consoli-
dated financial statements have a material impact on the consoli-
dated financial statements of the Group.
(5) Use of estimates and judgmentsIn preparing these consolidated financial statements, the Group’s
management has made critical judgments, estimates and assump-
tions that affect the application of accounting policies and the
reported amounts of assets and liabilities, revenue and expenses,
and disclosure of contingent liabilities as at the end of the reporting
period. Although estimates and assumptions are based on the
management’s best judgments using past experience and available
information, they may differ from actual future values. Estimates
and underlying assumptions are continuously reviewed, and the
effects of any revisions are recognized in the period in which the
revision is made and any subsequent periods affected.
Information about judgments made in the application of
accounting policies that have significant impacts on the amounts
recognized in the consolidated financial statements are as follows:
• Scope of consolidation (Note 3. “Significant Accounting Policies
(1) Basis of consolidation”)
• Recognition of intangible assets arising from development
(Note 3. “Significant Accounting Policies (8) Intangible assets”)
• Recognition of revenue (Note 3. “Significant Accounting Policies
(13) Revenue”)
Judgments, estimates and underlying assumptions that may
have significant impacts on the consolidated financial statements
are as follows:
• Recoverable amount of non-financial assets (Note 3. “Significant
Accounting Policies (10) Impairment of non-financial assets,”
15. “Impairment of non-financial assets”)
• Measurement of provisions (Note 3. “Significant Accounting
Policies (11) Provisions,” 19. “Provisions”)
• Measurement of defined benefit obligations (Note 3. “Significant
Accounting Policies (12) Post-employment benefits,”
20. “Employee benefits”)
• Measurement of revenue (Note 3. “Significant Accounting
Policies (13) Revenue,” 24. “Revenue”)
• Recoverability of deferred tax assets (Note 3. “Significant
Accounting Policies (17) Income taxes,” 16. “Income taxes”)
MHI REPORT 2021 FINANCIAL SECTION15

3. SIGNIFICANT ACCOUNTING POLICIES
(1) Basis of consolidationa) Subsidiaries
Subsidiaries are entities controlled by the Group. The Group con-
trols an entity when it is exposed, or has rights to, variable returns
from its involvement with the entity and has the ability to affect the
returns through its power over the entity.
Subsidiaries’ financial statements are included in the consoli-
dated financial statements from the date on which control starts
until the date on which control ends. If accounting policies adopted
by subsidiaries differ from those adopted by MHI, the financial
statements of those subsidiaries are adjusted. Balances of receiv-
ables and payables and transaction amounts between Group
companies and unrealized gains or losses arising from transac-
tions between Group companies are eliminated in the preparation
of the consolidated financial statements.
b) Associates and joint ventures (entities accounted for using the
equity method)
Associates are entities in which the Group has significant influ-
ence, but does not have control or joint control over the financial
and operating policies.
Joint ventures are arrangements in which two or more parties,
including the Group, have joint control under contractual arrange-
ments, in which the Group has rights to the net assets of the
arrangements. Joint control requires the unanimous consent of
the jointly controlling parties in financial and operating decisions
related to their activities.
Investments in associates and joint ventures are accounted for
using the equity method (hereinafter referred to as “entities
accounted for using the equity method”). Goodwill related to enti-
ties accounted for using the equity method is included in the car-
rying amount of investments, and is not amortized. When there is
an indication that an investment in an entity accounted for using
the equity method may be impaired, the carrying amount of the
entire investment (including goodwill) is evaluated for impairment
as a single asset.
If accounting policies adopted by associates or joint ventures
accounted for using the equity method differ from those adopted
by the Group in the application of the equity method, the equity
method is applied after financial statements of those associates or
joint ventures are adjusted. It is impracticable for certain entities
accounted for using the equity method to align their closing date
with that of the Group due to the intent of joint investors and other
reasons. For such entities, the equity method is applied after
necessary adjustments are made in relation to significant trans-
actions or events during the period occurring from the difference
in the closing date.
(2) Business combinationsBusiness combinations are accounted for using the acquisition
method. The consideration of acquisition is measured as the aggre-
gate of the acquisition-date fair value of the assets transferred,
liabilities assumed and equity securities issued by the Group in
exchange for control of the acquiree. Transaction costs directly
attributable to the acquisition are accounted for as expenses when
they are incurred. Identifiable assets and liabilities of the acquired
entity are recognized at their fair value on the acquisition date.
Goodwill is measured as the difference between the fair value
of consideration transferred in the acquisition of the entity less the
net recognized amount of identifiable assets acquired and liabili-
ties assumed as at the date of acquisition. If the fair value of con-
sideration transferred in the acquisition is lower than the net
recognized amount of assets acquired and liabilities assumed, the
difference is recognized as profit.
When consideration for the business combination transferred
from the Group includes assets or liabilities arising from a contin-
gent consideration arrangement, it is measured at fair value on
the acquisition date and is included as part of the above consider-
ation transferred in the acquisition.
Non-controlling interests are measured initially at their pro-
portionate share of the acquiree’s identifiable net assets at the
date of acquisition.
(3) Foreign currency translationForeign currency transactions are translated into the functional
currencies of the Group at the exchange rates at the dates of the
transactions or an approximation of the rate.
Monetary assets and liabilities denominated in foreign curren-
cies at the end of the reporting period are translated at the
exchange rates at the end of the reporting period.
Exchange differences arising from the translation or settle-
ment are recognized as profit or loss. On the other hand, exchange
differences arising from financial assets at FVTOCI are recognized
as other comprehensive income.
Assets and liabilities of foreign operations are translated into
Japanese yen using the exchange rates at the end of the reporting
period, whereas revenue and expenses are translated using the
average exchange rate during the period unless there is signifi-
cant fluctuation in the exchange rates.
Exchange differences arising from translation of financial
statements of foreign operations are recognized in other compre-
hensive income. At the time of the disposal of a foreign operation,
cumulative exchange differences recognized in other components
of equity are transferred to profit or loss.
(4) Financial instrumentsFinancial instruments are recognized on the date when the Group
becomes a contracting party to the financial instruments.
Financial assets purchased in the common ways are recognized
on the transaction date.
a) Non-derivative financial assets
Non-derivative financial assets which are classified as debt
instruments are measured at amortized cost since all these
instruments satisfy both of the following conditions:
• The financial assets are held within a business model whose
objective is to hold financial assets in order to collect contractual
cash flows.
• The contractual terms of the financial assets give rise on speci-
fied dates to cash flows that are solely payments of principal and
interest on the principal amount outstanding.
After initial recognition, financial assets measured at amor-
tized cost are measured at amortized cost using the effective
interest method.
MITSUBISHI HEAVY INDUSTRIES GROUP 16
Equity instruments are measured at fair value.
Non-derivative financial assets are measured at fair value plus
transaction costs at initial recognition, unless the assets are
measured at fair value through profit or loss. However, trade
receivables that do not contain a significant financing component
are initially measured at the transaction price.
For financial assets measured at fair value, except for equity
instruments held for trading that must be measured at fair value
through profit or loss (FVTPL), the Group determines, for each
equity instrument, whether the instrument is measured at FVTPL
or if it irrevocably designates the instrument as measured at fair
value through other comprehensive income (FVTOCI).
For assets designated as financial assets at FVTOCI at initial
recognition, any changes in fair value after initial recognition are
recognized as other comprehensive income. If a financial asset at
FVTOCI is derecognized, or the fair value decreases significantly,
the amount accumulated in other components of equity is trans-
ferred to retained earnings. Dividends from financial assets at
FVTOCI are recognized as profit or loss in principle.
When the contractual right to cash flows from a financial asset
expires or the Group transfers a financial asset and substantially
all the risks and rewards of ownership of the financial asset, the
financial asset is derecognized.
b) Non-derivative financial liabilities
Non-derivative financial liabilities are classified as financial liabili-
ties measured at amortized cost. Financial liabilities measured at
amortized cost are measured at fair value less transaction costs
at initial recognition.
After initial recognition, such liabilities are measured at amor-
tized cost using the effective interest method.
When the obligation specified in the contract for a non-
derivative financial liability is discharged, cancelled or expires,
the non-derivative financial liability is derecognized.
c) Derivative transactions and hedge accounting
The Group uses derivative instruments, including forward
exchange contracts, currency swap contracts, interest rate swap
contracts and forward contracts, to hedge foreign currency risks,
interest rate risks and commodity price risks.
Derivative transactions are initially recognized at fair value on
the date when the Group becomes party to the contract, and
related transaction costs are expensed as incurred. After the
initial recognition, they are measured at fair value with changes in
the fair value recognized in profit or loss, unless they are desig-
nated as the hedging instrument in a cash flow hedge.
When applying hedge accounting, the Group formally desig-
nates and documents the hedging relationship, the risk manage-
ment objective and strategy at the inception of a hedge. The
documentation includes identification of the hedging instrument,
the hedged item, the nature of the risk being hedged and the
methods of assessing hedge effectiveness. The Group assesses
whether the hedging relationship is effective prospectively on an
ongoing basis.
The Group applies the following accounting treatment for deriva-
tive transactions that meet the requirements for hedge accounting.
(i) Fair value hedge
Changes in the fair value of derivative transactions that are desig-
nated as fair value hedges are recognized in profit or loss together
with changes in the fair value of the hedged assets or liabilities
that corresponds to the hedged risk.
When derivative transactions are designated as the hedging
instrument for equity instruments that are designated as financial
assets measured at FVTOCI, changes in the fair value of the hedg-
ing instrument and hedged assets are recognized in other com-
prehensive income.
(ii) Cash flow hedge
When a derivative transaction is designated as the hedging instru-
ment in a cash flow hedge, the effective portion of changes in the
fair value of the derivative is recognized as other comprehensive
income and the ineffectiveness is recognized immediately as
profit or loss.
When applying a cash flow hedge to a currency swap contract,
the Group designates the portion other than the currency basis
spread as the hedging instrument and treats the currency basis
spread as costs of hedging, and recognizes changes in its fair
value in other components of equity through other comprehen-
sive income.
The cash flow hedge accumulated in other components of
equity is transferred to profit or loss in the same period during
which cash flows of the hedged item affect profit or loss. However,
when the hedged item is associated with acquisition of a non-
financial asset, such an amount is accounted for as an adjustment
to the initial acquisition cost of the non-financial asset.
When the Group recognizes the costs of hedging for a deriva-
tive transaction entered into in order to hedge a time-period
related hedged item, it transfers the cumulative costs of hedging
accumulated in other components of equity to profit or loss on a
systematic and rational basis over the period during which the
hedge adjustment from the hedging instrument could affect profit
or loss.
When a forecast transaction is no longer highly probable to
occur, hedge accounting is discontinued. When the forecast trans-
action is no longer expected to occur, the amount accumulated in
other components of equity is transferred to profit or loss.
d) Impairment of financial assets
For financial assets measured at amortized cost, the Group
determines, at the end of each reporting period, whether credit
risk on the asset has increased significantly since initial recogni-
tion. If the credit risk has increased significantly, a loss allowance
at an amount equal to lifetime expected credit losses is recog-
nized. If no significant increase in the credit risk is identified, a
loss allowance at an amount equal to 12-month expected credit
losses is recognized.
However, for trade receivables and contract assets, loss allow-
ance for doubtful accounts is recognized at an amount equal to the
lifetime expected credit losses, regardless of whether or not the
credit risk has increased significantly since the initial recognition.
Evidence indicating a significant increase in credit risk includes
default or delinquency by a debtor, extension of the due date pro-
vided by the Group for a debtor on terms that the Group would not
implement under other circumstances, and indications that a
debtor or issuer will enter bankruptcy. Provision of loss allowance
is recognized in profit or loss.
MHI REPORT 2021 FINANCIAL SECTION17
NOTES TO CONSOLIDATED FINANCIAL STATEMENTS

(5) Cash and cash equivalentsCash and cash equivalents consist of cash on hand, deposits that
can be withdrawn at any time, and short-term investments that
are readily convertible and subject only to insignificant risk of
changes in value. Short-term investments mean investments that
have a maturity of three months or less from the acquisition date.
(6) InventoriesInventories are measured at the lower of cost and net realizable
value. Cost is the amount including costs of purchase, costs of
conversion and all costs incurred in bringing the inventories to their
present location and condition. Net realizable value is the estimated
selling price in the ordinary course of business less the estimated
costs of completion and estimated costs necessary to sell.
The inventory valuation method is as follows:
Merchandise and finished goods: principally moving
average method
Work in process: principally specific identification method
Raw materials and supplies: principally moving average method
(7) Property, plant and equipmentProperty, plant and equipment are presented at cost less accumu-
lated depreciation and impairment losses, using the cost model.
Cost includes any costs directly attributable to the acquisition of
assets, dismantling costs, removal costs, and restoration costs for
the site where the property, plant and equipment have been located.
Property, plant and equipment are depreciated using the
straight-line method over the estimated useful lives except for
assets those are not depreciated, such as land.
The estimated useful lives of major property, plant and equip-
ment are as follows:
Buildings and structures: 2 to 60 years
Machinery and vehicles: 2 to 20 years
Tools, furniture and fixtures: 2 to 20 years
The depreciation method, estimated useful lives and residual
value are reviewed at the end of the fiscal year and revised where
necessary.
(8) Intangible assetsIntangible assets are presented at the amount of acquisition cost
less accumulated amortization and impairment losses, using the
cost model. Intangible assets are amortized over the estimated
useful lives using the straight-line method. The estimated useful
lives of major intangible assets are as follows:
Software: 3 to 10 years
Technologies recognized through business combination: 7 to
25 years
Customer relationship recognized through business combina-
tion: 2 to 25 years
Other: 3 to 15 years
Intangible assets with indefinite useful lives are presented at the
amount of acquisition cost less accumulated impairment losses.
Expenses incurred with respect to development activities of
the Group are capitalized only when it can be proved that the
expenses satisfy all the following conditions:
• The technical feasibility of completing the intangible asset so
that it will be available for use or sale.
• The Group intends to complete the intangible asset and use or
sell it.
• The Group is able to use or sell the intangible asset.
• The intangible asset’s future economic benefits are probable.
• Adequate technical, financial and other resources are available to
complete the development and to use or sell the intangible asset.
• The expenditure attributable to the intangible asset during its
development is reliably measurable.
Development expenses that do not satisfy the above require-
ments for capitalization and expenditures on research activities
are expensed as incurred. The amortization method, estimated
useful lives and residual value are reviewed at the end of the fiscal
year and revised where necessary.
(9) Leasesa) Leases as lessor
Leases in which substantially all the risks and rewards of owner-
ship of the asset are transferred to the lessee under the contract
are classified as finance leases. Leases other than finance leases
are classified as operating leases.
With regard to the amount received from lessees under finance
leases, the net investment in leases is recorded as “trade and
other receivables,” and unearned finance income is allocated to
the net investment at a constant interest rate over the lease term
and recognized in the fiscal year to which the profit is attributed.
Lease revenues under operating leases are recognized on a
straight-line basis over the lease term.
b) Leases as lessee
For leases as lessee, the Group recognizes assets and liabilities
under an on-balance sheet accounting model. The Group recog-
nizes a right-of-use asset which represents the right to use the
underlying leased asset and a lease liability which represents the
obligation to make lease payments for all leases at the lease
commencement date. The Group measures right-of-use assets
and lease liabilities as follows.
For short-term leases with a lease term of 12 months or less
and leases of low value, however, the Group has elected not to
recognize right-of-use assets and lease liabilities.
• Right-of-use assets
Right-of-use assets are measured at cost, which mainly com-
prises the amount of the initial measurement of the lease liability
adjusted for any initial direct costs incurred and any prepaid lease
payments made at or before the commencement date. After initial
recognition, right-of-use assets are measured, at cost less any
accumulated depreciation and any accumulated impairment
losses, using the cost model.
Right-of-use assets are depreciated on a straight-line basis
over the period until the earlier of the end of the useful life or the
end of the lease term.
MITSUBISHI HEAVY INDUSTRIES GROUP 18

• Lease liabilities
Lease liabilities are initially recognized at the lease commence-
ment date and are measured at the present value of the lease
payments that are not paid at that date. To calculate the present
value, the interest rate implicit in the lease is used as the discount
rate. If that rate cannot be readily determined, the Group’s incre-
mental borrowing rate is used. Lease liabilities are remeasured, if
each lease contract contains an option to purchase the underlying
asset or an option to extend or terminate the lease and there is a
change in possibilities to exercise such options.
The Group presents “right-of-use assets” separately from other
assets and lease liabilities in “bonds, borrowings and other finan-
cial liabilities” in the consolidated statement of financial position.
(10) Impairment of non-financial assetsWith regard to property, plant and equipment and intangible
assets, the Group determines, at the end of the reporting period,
whether or not there is any indication of impairment. If any such
indication exists, the Group performs an impairment test by esti-
mating the recoverable amount of the asset. With regard to good-
will and intangible assets with indefinite useful lives, the Group
conducts an impairment test annually or whenever there is any
indication of impairment.
The recoverable amount of the asset or the cash-generating
unit (“CGU”) is the higher of its fair value less costs of disposal and
its value in use. Value in use is determined as the present value of
future cash flows that are expected to arise from the asset or the
CGU. A CGU is the smallest identifiable group of assets that gener-
ates cash inflows that are largely independent of cash inflows
from other assets or groups of assets. When the recoverable
amount of an individual asset cannot be estimated, the recover-
able amount of the CGU to which the asset belongs is determined.
If the recoverable amount of an asset or a CGU is less than its
carrying amount, the carrying amount of the asset or the CGU is
reduced to the recoverable amount.
For non-financial assets for which an impairment loss was
recognized, except for goodwill, the Group reassesses the pos-
sibility that the impairment loss will be reversed, at the end of
each reporting period.
(11) ProvisionsThe Group recognizes a provision when there is a present legal or
constructive obligation arising from past events, it is probable that
an outflow of resources embodying economic benefits will be
required to settle the obligation, and the amount of the obligation
can be measured reliably. In doing so, if the period up to the settle-
ment of the obligation is expected to be a long term and the time
value of money is material, a provision is measured based on the
present value of expenditure expected at the time of settlement.
If some or all of expenditure required for the Group to settle the
provisions is expected to be reimbursed, the reimbursement is
recognized as a separate asset only when it is virtually certain that
the Group will receive the reimbursement.
If provisions and external reimbursements are recognized in
the same reporting period, these amounts are presented on a net
basis in the consolidated statement of profit or loss.
(12) Post-employment benefitsThe Group has adopted lump-sum payment on retirement and
pension plans as post-employment benefit plans for employees.
These plans are roughly classified as defined benefit plans or
defined contribution plans. Accounting policies for respective
plans are as follows.
a) Defined benefit plans
In defined benefit plans, the present value of defined benefit obli-
gations is calculated separately for each plan by estimating the
amount of future benefits that employees have earned in exchange
for their service rendered in the prior fiscal years and the current
fiscal year. The amount used to settle the obligations less fair
value of plan assets is recognized as defined benefit liability
(asset). The asset ceiling in this calculation is the present value of
future economic benefits available in the form of refunds from the
plan or reductions in future contributions to the plan. The present
value of defined benefit obligations is calculated using the pro-
jected unit credit method, and the discount rate is determined by
reference to the market yield on high quality corporate bonds at
the end of the fiscal year corresponding to the estimated timing for
future benefit payments.
Service cost and net interest cost on net defined benefit liabil-
ity (asset) are recognized as profit or loss, and remeasurement of
defined benefit liability (asset) is recognized as other comprehen-
sive income and immediately transferred to retained earnings.
b) Defined contribution plans
Contributions for retirement benefits under defined contribution
plans are recognized as expenses in profit or loss as the related
service is provided.
(13) RevenueThe Group recognizes revenue at an amount that reflects the
consideration to which the Group expects to be entitled in
exchange for the transfer of goods or services to customers based
on the following five-step approach, except for interest and divi-
dend income, etc. under IFRS 9.
Step 1: Identify the contract with the customer
Step 2: Identify the performance obligations in the contract
Step 3: Determine the transaction price
Step 4: Allocate the transaction price to the separate performance
obligations in the contract
Step 5: Recognize revenue when (or as) the entity satisfies a per-
formance obligation
Revenue is recognized to the extent that an inflow of economic
benefits to the Group is probable and its amount can be measured
reliably, regardless of the timing of receiving the payment, and
measured at the fair value of consideration received or receivable
after taxes in light of contractual payment terms.
Of incremental costs of obtaining contracts with customers and
fulfillment costs directly related to contracts, the portion that is
expected to be recoverable is recognized as assets and is regularly
amortized over the transfer of related goods or services to custom-
ers. Incremental costs of obtaining contracts with customers are
costs that would not be incurred if the contract is not obtained.
Requirements for revenue recognition of the Group are as follows.
MHI REPORT 2021 FINANCIAL SECTION19
NOTES TO CONSOLIDATED FINANCIAL STATEMENTS
a) Sale of products
With regard to revenue from the sale of goods, performance
obligations are principally considered to be satisfied at the time of
delivery of the goods, at which point in time customers obtain
control and revenue is recognized. Revenue from the sale of goods
is measured at an amount of consideration promised in the con-
tract with the customer less sales returns, discounts, rebates,
taxes collected on behalf of third parties and others.
b) Rendering of services and construction contracts
For contracts for the rendering of services or construction con-
tracts under which the control of a good or service promised in the
contracts is transferred to customers over the contract term,
revenue is recognized by estimating total revenue for each con-
tract and measuring progress towards the complete satisfaction
of the performance obligation. The progress is measured using a
method that depicts the satisfaction of the performance obliga-
tion, and is principally estimated based on the proportion of costs
incurred to satisfy the performance obligation against the
expected total costs of satisfying the performance obligation.
(14) Profit from business activities“Profit from business activities” on the consolidated statement of
profit or loss is presented as a measure that enables continuous
comparison and assessment of the Group’s business performance.
“Profit from business activities” is calculated by subtracting “cost of
sales,” “selling, general and administrative expenses” and “other
expenses” from “revenue” and adding “share of profit (loss) of
investments accounted for using the equity method” and “other
income” to the resulting amount. “Other income” and “other
expenses” consist of dividend income, gains or losses on sales of
fixed assets, impairment losses on fixed assets, and others.
Dividend income from shares and investments in capital held by the
Group, where the investment is held by the Group over the long term
due to business operation requirements, such as collaborating with
other companies, is included in profit from business activities as the
results of the business. Dividend income is recognized when the
Group’s right to receive the dividend income is established.
(15) Finance income and costs“Finance income” and “finance costs” consist of interest income,
interest expenses, foreign exchange gains or losses, gains or
losses on derivatives (except for gains or losses recognized in
other comprehensive income) and others. Interest income and
expenses are recognized using the effective interest method when
they arise.
(16) Government grantsGovernment grants are recognized when the Group obtains rea-
sonable assurance of both of the following matters.
• The Group’s activities, status and others comply with the inci-
dental conditions to the receipt of the grants.
• The grants are paid to the Group.
Grants associated with revenue are presented by deducting the
grants from related expenses.
(17) Income taxesIncome taxes consist of current taxes and deferred taxes. Except
for income taxes related to the initial recognition of business
combinations and those which are recognized directly in equity or
other comprehensive income, income taxes are recognized as
profit or loss.
Current taxes are measured as the amount that is expected to
be paid to or refunded from tax authorities. The amount of these
taxes is calculated based on tax rates and tax laws that are enacted
or substantively enacted by the end of the reporting period.
Deferred taxes are recognized in relation to temporary differ-
ences arising from differences between the carrying amount of
assets and liabilities for accounting purposes and the related
carrying amount for tax purposes, unused tax losses and unused
tax credits. Based on management plans taking into account tax
implications and others, deferred tax assets are recognized to the
extent that it is probable that taxable profits will be available
against which the deductible temporary differences and unused
tax losses can be utilized.
Deferred tax liabilities are recognized for all taxable temporary
differences in principle. However, taxable temporary differences
on investments in subsidiaries, affiliates and interests in joint
ventures are not recognized if the timing of the reversal of the
temporary differences can be controlled by the Group and it is
probable that the temporary differences will not be reversed in the
foreseeable future. With regard to taxable temporary differences
arising from the initial recognition of goodwill, deferred tax liabili-
ties are also not recognized.
Deferred tax assets are reviewed at the end of each reporting
period, and a reduction is made for the portion for which it is
probable that taxable profits sufficient to utilize all or part of the
deferred tax assets will not be available. On the other hand,
unrecognized deferred tax assets are also reassessed at the end
of each reporting period, and such deferred tax assets are rec-
ognized to the extent that the assets are recoverable if it
becomes probable that the assets will be recovered due to future
taxable profits.
Deferred tax assets and liabilities are measured based on tax
rates and tax laws that are enacted or substantively enacted by the
end of the reporting period and are anticipated to be applied in the
period when the temporary difference is expected to be reversed.
Deferred tax assets and liabilities are offset when the Group
has a legally enforceable right to set off current tax assets against
current tax liabilities and related taxes are levied by the same tax
authority on the same taxable entity.
With regard to uncertain tax position of income taxes, a rea-
sonably estimated amount is recognized as asset or liability when
it is probable to pay or refund income taxes based on interpreta-
tions for the purpose of tax law.
MITSUBISHI HEAVY INDUSTRIES GROUP 20

4. OPERATING SEGMENT
(1) Overview of reporting segmentsThe reporting segments of the Group are components for which
discrete financial information is available and whose operating
results are regularly reviewed by MHI’s Board of Directors to make
decisions about resource allocation and assess their performance.
The Group manages its businesses by business domains and
segments. Each business domain and segment engages in its
business activities by formulating comprehensive strategies on
products and services which are provided in both domestic and
overseas markets. Therefore, MHI aggregates the business
domains and segments by considering similarities of each business
domain’s and segment’s customers and product characteristics.
The Group carried out reorganization effective on April 1, 2020.
In conjunction with the reorganization, the previous three report-
ing segments namely Power Systems; Industry & Infrastructure;
and Aircraft, Defense & Space were restructured into four report-
ing segments namely Energy Systems; Plants & Infrastructure
Systems; Logistics, Thermal & Drive Systems; and Aircraft,
Defense & Space.
Main products and services belonging to each reporting seg-
ment are as follows:
Segment information for the previous fiscal year was restated
based on the categories of reporting segments after the change.
Energy Systems
Thermal power systems (Gas turbine combined cycle [GTCC] and Steam power), Nuclear power generation system
(Light-water reactors, Nuclear fuel cycle & Advanced solutions), Wind power generators, Engines for aircrafts,
Compressors, Environmental plants, Marine machinery
Plants & Infrastructure
SystemsMetals machinery, Commercial ships, Engineering, Environmental systems, Mechatronics systems, Machine tools
Logistics, Thermal &
Drive Systems
Material handling equipment, Turbochargers, Engines, Air-conditioning & refrigeration systems, Automotive
thermal systems
Aircraft, Defense & SpaceCommercial aircraft, Defense aircraft, Missile systems, Naval ships, Special vehicles, Maritime systems (torpe-
does), Space systems
(2) Method for calculating revenue, profit or loss and other items by reporting segmentThe accounting policies of the reporting segments are the same as the accounting policies described in the Note 3. “Significant Accounting
Policies”. Inter-segment revenue reflects arm’s length transaction prices.
(3) Information about revenue, profit or loss and other items by reporting segmentFor the fiscal year ended March 31, 2020 (from April 1, 2019 to March 31, 2020)
Millions of yen
Reporting segment
Adjustments*1 ConsolidatedEnergy Systems
Plants & Infrastructure
Systems
Logistics, Thermal & Drive
Systems
Aircraft, Defense & Space
Total
Revenue
Revenue from external customers ¥1,579,397 ¥750,556 ¥983,918 ¥ 703,862 ¥4,017,736 ¥ 23,640 ¥4,041,376
Inter-segment revenue and transfers 10,896 42,368 6,186 1,122 60,574 (60,574) —
Total ¥1,590,293 ¥792,925 ¥990,105 ¥ 704,985 ¥4,078,310 ¥(36,934) ¥4,041,376
Segment profit (loss)*2 144,383 25,534 29,348 (208,792) (9,524) (20,014) (29,538)
Finance income 11,616
Finance costs 14,738
Profit (loss) before income taxes (32,660)
Other items
Depreciation and amortization 47,085 13,265 43,749 27,082 131,184 13,455 144,639
Impairment losses 717 14 243 177,563 178,538 833 179,372
Share of profit (loss) of investments accounted for using the equity method
¥ 8,299 ¥ 1,409 ¥ (2,108) ¥ — ¥ 7,600 ¥ 5,298 ¥ 12,898
*1. The “Adjustments” classification includes revenues and expenses which are not included in any of the reporting segments. Specifically, income from utilization and disposal of assets, corporate research and development expenses and dividends on shares concerning corporate overall businesses, neither of which are linked to any specific segment.
*2. The segment profit (loss) represents profit (loss) from business activities.
MHI REPORT 2021 FINANCIAL SECTION21
NOTES TO CONSOLIDATED FINANCIAL STATEMENTS

For the fiscal year ended March 31, 2021 (from April 1, 2020 to March 31, 2021)
Millions of yen
Reporting segment
Adjustments*1 ConsolidatedEnergy Systems
Plants & Infrastructure
Systems
Logistics, Thermal & Drive
Systems
Aircraft, Defense & Space
Total
Revenue
Revenue from external customers ¥1,533,380 ¥596,153 ¥855,449 ¥701,087 ¥3,686,071 ¥ 13,875 ¥3,699,946
Inter-segment revenue and transfers 12,622 41,104 4,858 1,022 59,607 (59,607) —
Total ¥1,546,003 ¥637,258 ¥860,307 ¥702,109 ¥3,745,679 ¥(45,732) ¥3,699,946
Segment profit (loss)*2 127,699 (10,222) 15,613 (94,841) 38,249 15,832 54,081
Finance income 11,677
Finance costs 16,404
Profit before income taxes 49,355
Other items
Depreciation and amortization 44,172 12,047 43,325 26,987 126,532 12,709 139,242
Impairment losses 2,759 4,316 83 80,599 87,758 12,584 100,343
Share of profit (loss) of investments accounted for using the equity method
¥ 11,950 ¥ 1,186 ¥ (347) ¥ — ¥ 12,789 ¥ 2,368 ¥ 15,158
*1. The “Adjustments” classification includes revenues and expenses which are not included in any of the reporting segments. Specifically, income from utilization and disposal of assets, corporate research and development expenses and dividends on shares concerning corporate overall businesses, neither of which are linked to any specific segment.
*2. The segment profit (loss) represents profit (loss) from business activities.
Thousands of U.S. dollars
Reporting segment
Adjustments*1 ConsolidatedEnergy Systems
Plants & Infrastructure
Systems
Logistics, Thermal & Drive
Systems
Aircraft, Defense & Space
Total
Revenue
Revenue from external customers $13,850,420 $5,384,816 $7,726,935 $6,332,643 $33,294,833 $ 125,327 $33,420,160
Inter-segment revenue and transfers 114,009 371,276 43,880 9,231 538,406 (538,406) —
Total $13,964,438 $5,756,101 $7,770,815 $6,341,875 $33,833,249 $(413,079) $33,420,160
Segment profit (loss)*2 1,153,454 (92,331) 141,026 (856,661) 345,488 143,004 488,492
Finance income 105,473
Finance costs 148,170
Profit before income taxes 445,804
Other items
Depreciation and amortization 398,988 108,815 391,337 243,762 1,142,913 114,795 1,257,718
Impairment losses 24,920 38,984 749 728,019 792,683 113,666 906,358
Share of profit (loss) of investments accounted for using the equity method
$ 107,939 $ 10,712 $ (3,134) $ — $ 115,518 $ 21,389 $ 136,916
*1. The “Adjustments” classification includes revenues and expenses which are not included in any of the reporting segments. Specifically, income from utilization and disposal of assets, corporate research and development expenses and dividends on shares concerning corporate overall businesses, neither of which are linked to any specific segment.
*2. The segment profit (loss) represents profit (loss) from business activities.
(4) Information by product and serviceThis information is omitted because the classification of products and services is the same as the classification of reporting segments.
MITSUBISHI HEAVY INDUSTRIES GROUP 22

(5) Breakdown by geographical marketa) Revenue from external customers
Millions of yen Thousands of U.S. dollars
2020 2021 2021
Japan ¥1,944,758 ¥1,947,909 $17,594,697U.S.A. 663,779 554,984 5,012,952Asia 700,385 573,181 5,177,319Europe 374,459 318,767 2,879,297Central and South America 131,706 83,853 757,411Africa 60,379 51,349 463,815Middle East 91,267 79,671 719,636Others 74,640 90,230 815,012
Total ¥4,041,376 ¥3,699,946 $33,420,160
*1. Revenue from external customers is classified based on their geographical location into a country or region depending on geographical proximity.*2. The major countries or regions in the category: (1) Asia... China, Thailand, South Korea, Indonesia, Taiwan, India, Singapore, Philippines, Vietnam, Hong Kong, Bangladesh, Malaysia (2) Europe... Germany, United Kingdom, France, Netherlands, Russia, Poland, Uzbekistan, Italy, Spain, Belgium, Sweden, Hungary, Belarus, Austria, Greece, Finland,
Turkmenistan, Denmark (3) Central and South America... Mexico, Brazil, Panama, Trinidad and Tobago, Dominican Republic (4) Africa... Egypt, South Africa, Liberia (5) Middle East... United Arab Emirates, Saudi Arabia, Qatar, Turkey, Israel (6) Others... Canada, Australia
b) Non-current assets
Millions of yen Thousands of U.S. dollars
As of March 31, 2020
As of March 31, 2021
As of March 31, 2021
Japan ¥ 896,361 ¥ 861,102 $ 7,777,996Overseas subtotal 280,209 294,943 2,664,104
Total ¥1,176,570 ¥1,156,045 $10,442,100
*1. Financial instruments, investments accounted for using the equity method, deferred tax assets, and assets for retirement benefits are not included.
(6) Information about major customersMajor external customer from which revenue accounts for 10% or more of the revenue recorded in the consolidated statement of profit or
loss was Ministry of Defense. Its revenue mainly belonged to the reporting segment of Aircraft, Defense & Space and the amount of revenue
was ¥400,723 million ($3,619,573 thousand) for the fiscal year ended March 31, 2021.
5. CASH AND CASH EQUIVALENTS
The breakdown of cash and cash equivalents is as follows:
Millions of yen Thousands of U.S. dollars
As of March 31, 2020
As of March 31, 2021
As of March 31, 2021
Cash and deposits ¥280,141 ¥244,607 $2,209,439Cash equivalents 1,485 814 7,352
Total ¥281,626 ¥245,421 $2,216,791
All cash and cash equivalents are classified as financial assets measured at amortized cost.
MHI REPORT 2021 FINANCIAL SECTION23
NOTES TO CONSOLIDATED FINANCIAL STATEMENTS

6. TRADE AND OTHER RECEIVABLES
The breakdown of trade and other receivables is as follows:
Millions of yen Thousands of U.S. dollars
As of March 31, 2020
As of March 31, 2021
As of March 31, 2021
Trade receivables ¥549,903 ¥588,013 $5,311,290Other 62,072 67,167 606,693
Total ¥611,976 ¥655,181 $5,917,992
All trade and other receivables other than lease receivables
included in “Other” are classified as financial assets measured at
amortized cost.
In the above table, the amounts of trade and other receivables
to be collected after 12 months as of March 31, 2020 and March 31,
2021, were ¥21,650 million and ¥22,800 million ($205,943 thou-
sand), respectively.
7. OTHER FINANCIAL ASSETS
(1) Breakdown of other financial assets
Millions of yen Thousands of U.S. dollars
As of March 31, 2020
As of March 31, 2021
As of March 31, 2021
Financial assets at FVTPLDerivative assets*1 ¥ 6,716 ¥ 9,046 $ 81,708Shares and other investments in capital — 16,740 151,205
Financial assets at FVTOCIShares and other investments in capital 364,883 518,523 4,683,614
Financial assets measured at amortized costTime deposits due more than three months 17,010 13,148 118,760Other 31,466 33,431 301,969
Total ¥420,078 ¥590,890 $5,337,277
Current assets 28,539 30,677 277,093Non-current assets 391,538 560,213 5,060,184
Total ¥420,078 ¥590,890 $5,337,277
*1. Derivative assets at FVTPL Derivative assets include those designated as hedging instruments. The effective portion of any change in fair value of derivative assets is recognized as other com-
prehensive income.
(2) Shares and other investments in capital designated as FVTOCIThe Group holds shares and investments in capital primarily for
the purpose of maintaining and strengthening relations with its
business partners.
The Group has elected to present subsequent changes in fair
value of shares and investments in capital held for the above
purpose in other comprehensive income.
MITSUBISHI HEAVY INDUSTRIES GROUP 24

a) The breakdown of shares and other investments in capital designated as financial assets at FVTOCI
Millions of yen Thousands of U.S. dollars
As of March 31, 2020
As of March 31, 2021
As of March 31, 2021
Marketable securities*1 ¥213,123 ¥379,890 $3,431,397Non-marketable securities*2 151,759 138,632 1,252,208
Total ¥364,883 ¥518,523 $4,683,614
*1. Marketable securities designated as FVTOCI Major marketable securities designated as FVTOCI, of entities in which the Group invests, as of March 31, 2020 and March 31, 2021, are as follows.
As of March 31, 2020 Millions of yen
Entity name Fair value
Mitsubishi Corporation 38,252
Central Japan Railway Company 25,675
Tokio Marine Holdings, Inc. 25,080
Mitsubishi Electric Corporation 10,041
Coca-Cola Bottlers Japan Holdings Inc. 8,681
The Kansai Electric Power Company, Inc. 7,215
Mitsubishi Motors Corporation 6,708
Mitsubishi Estate Company, Limited 6,144
AGC Inc. 5,470
Nippon Yusen Kabushiki Kaisha 5,277
As of March 31, 2021 Millions of yen
Entity name Fair value
Vestas Wind Systems A/S[*] 114,720
Mitsubishi Corporation 52,093
Tokio Marine Holdings, Inc. 26,676
Central Japan Railway Company 24,545
Nippon Yusen Kabushiki Kaisha 15,491
Mitsubishi Electric Corporation 12,685
SUZUKI MOTOR CORPORATION 10,238
AGC Inc. 9,516
Coca-Cola Bottlers Japan Holdings Inc. 7,559
Mitsubishi Estate Company, Limited 7,444
As of March 31, 2021 Thousands of U.S. dollars
Entity name Fair value
Vestas Wind Systems A/S[*] 1,036,220
Mitsubishi Corporation 470,535
Tokio Marine Holdings, Inc. 240,953
Central Japan Railway Company 221,705
Nippon Yusen Kabushiki Kaisha 139,924
Mitsubishi Electric Corporation 114,578
SUZUKI MOTOR CORPORATION 92,475
AGC Inc. 85,954
Coca-Cola Bottlers Japan Holdings Inc. 68,277
Mitsubishi Estate Company, Limited 67,238
[*]. The Group acquired 2.5% of Vestas’s shares on December 14, 2020. Such shares were acquired in exchange for the Group’s shareholding in an offshore wind power plant joint venture, which was jointly established by the
Group and Vestas. The fair value of the shares of Vestas at the date of acquisition was ¥107 billion ($966 million). The difference between the carrying amount of the shares
of the joint venture and the fair value of the shares of Vestas at the date of acquisition was recognized in “other income” and the fair value change of the shares of Vestas through March 31, 2021 was recognized in “other comprehensive income.”
*2. Non-marketable securities designated as FVTOCI Non-marketable securities designated as FVTOCI are mostly securities of nuclear energy related companies, construction related companies, and chemical plant
related companies. Major securities included in “nuclear energy related companies” are Japan Nuclear Fuel Service Limited and Orano S.A. The total fair value of nuclear energy
related securities as of March 31, 2020 and March 31, 2021, were ¥36,617 million and ¥41,536 million ($375,178 thousand), respectively. The major security included in “construction related companies” is Shinryo Corporation. The total fair value of construction related securities as of March 31, 2020
and March 31, 2021, were ¥39,943 million and ¥14,537 million ($131,307 thousand), respectively. Major securities included in “chemical plant related companies” are Japan Trinidad Methanol Co., Ltd., Amjad Oman Investment Holding LLC, and Shama
Development Holding LLC. The total fair value of chemical plant related securities as of March 31, 2020 and March 31, 2021, were ¥25,438 million and ¥24,843 million ($224,397 thousand), respectively.
There are no material shares and concentrated investments in specific industries other than those listed in Notes 1 and 2.
b) Dividend income from financial assets at FVTOCI
The following are the amounts of dividend income from financial assets at FVTOCI that were recognized for the fiscal years ended March 31,
2020 and March 31, 2021.
Millions of yen Thousands of U.S. dollars
2020 2021 2021
Dividend income from investments derecognized during the year ¥ 554 ¥ 84 $ 758
Dividend income from investments held as of the year end 11,542 10,579 95,555
Total ¥12,096 ¥10,664 $96,323
MHI REPORT 2021 FINANCIAL SECTION25
NOTES TO CONSOLIDATED FINANCIAL STATEMENTS

c) Financial assets at FVTOCI derecognized
The following are the fair values, at the date of derecognition, of derecognized financial assets at FVTOCI, and the associated accumulated
gains or losses, and the amounts transferred to retained earnings during the fiscal years ended March 31, 2020 and March 31, 2021.
Millions of yen Thousands of U.S. dollars
2020 2021 2021
Fair value at the date of derecognition ¥27,542 ¥ 9,437 $ 85,240
Accumulated gains (losses) ¥ 7,854 ¥(4,028) $(36,383)
Accumulated gains or losses that have been recognized as other
components of equity are transferred from other components of
equity to retained earnings when the fair value of financial assets
measured at FVTOCI decreases significantly or when they are
derecognized. Accumulated gains or losses transferred to
retained earnings are for those investments that were sold or
otherwise disposed and derecognized as a result of reviewing
business relationships and those investments where the fair
value decreased significantly. The amounts transferred to
retained earnings for the fiscal years ended March 31, 2020 and
March 31, 2021 were ¥68 million and ¥(6,009) million ($(54,276)
thousand), respectively.
8. TRADE AND OTHER PAYABLES
The breakdown of trade and other payables is as follows:
Millions of yen Thousands of U.S. dollars
As of March 31, 2020
As of March 31, 2021
As of March 31, 2021
Trade payables ¥655,208 ¥635,749 $5,742,471Electronically recorded obligations 122,791 78,457 708,671Other 46,030 49,525 447,339
Total ¥824,030 ¥763,731 $6,898,482
Trade and other payables are classified as financial liabilities measured at amortized cost.
9. BONDS, BORROWINGS AND OTHER FINANCIAL LIABILITIES
(1) Breakdown of bonds, borrowings and other financial liabilities
Millions of yen Thousands of U.S. dollars
As of March 31, 2020
As of March 31, 2021
As of March 31, 2021
Financial liabilities measured at amortized costBonds*1 ¥ 140,000 ¥ 195,000 $ 1,761,358Commercial Papers 85,000 196,000 1,770,391Short-term borrowings*2 *3 64,744 50,527 456,390Long-term borrowings*2 *3 308,553 464,095 4,191,988Other 104,808 100,536 908,102
Financial liabilities at FVTPLDerivative liabilities*4 12,778 12,190 110,107
Liabilities under factoring agreement*5 94,233 88,306 797,633Liabilities arising from put options held by non-controlling shareholders 426,066 — —Lease liabilities 134,684 129,353 1,168,394
Total ¥1,370,870 ¥1,236,010 $11,164,393
Current liabilities 769,099 445,147 4,020,838Non-current liabilities 601,770 790,862 7,143,546
Total ¥1,370,870 ¥1,236,010 $11,164,393
*1. The summary of bond issues is as follows:
MITSUBISHI HEAVY INDUSTRIES GROUP 26

Millions of yen Thousands of U.S. dollars
Company nameIssue name
Date of issue As of March 31, 2020
As of March 31, 2021
Interest rate Date of maturity As of March 31, 2021
Mitsubishi Heavy Industries, Ltd.
The 26th Unsecured Corporate Bond Sept 4, 2013 ¥ 15,000 ¥ 15,000 0.877% Sept 4, 2023 $ 135,489
The 28th Unsecured Corporate Bond Sept 3, 2014 25,000 25,000 0.381% Sept 3, 2021 225,815
The 29th Unsecured Corporate Bond Sept 3, 2014 30,000 30,000 0.662% Sept 3, 2024 270,978
The 30th Unsecured Corporate Bond Sept 2, 2015 10,000 — 0.221% Sept 2, 2020 —
The 31st Unsecured Corporate Bond Sept 2, 2015 10,000 10,000 0.630% Sept 2, 2025 90,326
The 32nd Unsecured Corporate Bond Aug 31, 2016 20,000 20,000 0.050% Aug 31, 2021 180,652
The 33rd Unsecured Corporate Bond Aug 31, 2016 10,000 10,000 0.240% Aug 31, 2026 90,326
The 34th Unsecured Corporate Bond Aug 29, 2017 10,000 10,000 0.104% Aug 29, 2022 90,326
The 35th Unsecured Corporate Bond Aug 29, 2017 10,000 10,000 0.330% Aug 27, 2027 90,326
The 36th Unsecured Corporate Bond Nov 24, 2020 — 25,000 0.140% Nov 21, 2025 225,815
The 37th Unsecured Corporate Bond Nov 24, 2020 — 40,000 0.390% Nov 22, 2030 361,304
Total ¥140,000 ¥195,000 $1,761,358
*2. The interest rates on and repayment dates of borrowings are as follows: The weighted average interest rates for short-term and long-term borrowings applicable to the fiscal year ended March 31, 2021, are 0.58% and 0.88%, respectively. Long-term borrowings will be due in 2021 through 2032.*3. Secured borrowings: The amounts of borrowings for which collateral was pledged when the loan agreements were entered into as of March 31, 2020 and March 31, 2021, were ¥435 mil-
lion, and ¥195 million ($1,761 thousand), respectively.
The breakdown of assets pledged as collateral is as follows:
Millions of yen Thousands of U.S. dollars
As of March 31, 2020
As of March 31, 2021
As of March 31, 2021
Property, plant and equipment ¥1,240 ¥1,926 $17,396Trade and other receivables 219 432 3,902Inventories 451 256 2,312
Total ¥1,910 ¥2,616 $23,629
Security interest is executed in case of breach of financial covenants or non-performance of the borrowing contracts.
*4. Derivatives at FVTPL Derivative liabilities include those designated as hedging instruments. The effective portion of any change in fair value of such liabilities is recognized as other com-
prehensive income.*5. Liabilities under factoring agreements The Group converts trade receivables and other receivables into cash pursuant to factoring agreements as a measure of financing. For the factoring agreements that were recognized as liabilities and were not due for payment as of March 31, 2021, the discount rates applied at the conclusion of
the contracts were calculated taking into account interest rates applicable to ordinary borrowing contracts. The payment for these factoring agreements will be due in 2021 through 2024.
For assets that were transferred to third parties pursuant to a factoring agreement with recourse obligation on the Group in the event of non-payment by the debtor, the underlying assets are not derecognized because such transfers do not qualify for derecognition.
Additionally, receivables arising from contract assets that were transferred to third parties are not derecognized because such transfers do not qualify for derecognition.
The amounts of trade receivables transferred without qualifying for derecognition March 31, 2020 and March 31, 2021, were ¥13,489 million, and ¥13,084 million ($118,182 thousand), respectively. These amounts are included in “Trade and other receivables” in the consolidated statement of financial position.
In the same manner, the amounts of contract assets transferred without qualifying for derecognition March 31, 2020 and March 31, 2021, were ¥75,225 million, and ¥72,726 million ($656,905 thousand), respectively. These amounts are included in “Contract assets” in the consolidated statement of financial position.
MHI REPORT 2021 FINANCIAL SECTION27
NOTES TO CONSOLIDATED FINANCIAL STATEMENTS

(2) Changes in liabilities arising from financing activitiesFor the fiscal year ended March 31, 2020 (from April 1, 2019 to March 31, 2020)
Millions of yen
Carrying amount as of April 1,
2019Cash flows
Non-cash transactions Carrying amount as of March 31,
2020Changes in fair value
Foreign currency translation
New contracts
Other movements*1
Bonds ¥ 205,000 ¥ (65,000) ¥ — ¥ — ¥ — ¥ — ¥ 140,000
Commercial papers*2 — 85,000 — — — — 85,000
Short-term borrowings 170,124 (104,800) — (677) — 97 64,744
Long-term borrowings 289,989 19,835 — (1,336) — 64 308,553
Liabilities under factoring agreement 140,405 (47,237) — (95) — 1,160 94,233
Lease liabilities 129,595 (23,256) — (2,926) 16,481 14,790 134,684
Liabilities arising from put options held by non-controlling shareholders
51,974 (13,534) (19,429) (743) 407,800 — 426,066
Other liabilities*3 33,358 (2,914) — — — 16 30,460
Total ¥1,020,449 ¥(151,909) ¥(19,429) ¥(5,779) ¥424,281 ¥16,130 ¥1,283,743
For the fiscal year ended March 31, 2021 (from April 1, 2020 to March 31, 2021)
Millions of yen
Carrying amount as of April 1,
2020Cash flows
Non-cash transactions Carrying amount as of March 31,
2021Changes in fair value
Foreign currency translation
New contracts
Other movements*1
Bonds ¥ 140,000 ¥ 55,000 ¥ — ¥ — ¥ — ¥ — ¥ 195,000
Commercial papers*2 85,000 111,000 — — — — 196,000
Short-term borrowings 64,744 (14,221) — 289 — (285) 50,527
Long-term borrowings 308,553 154,353 — 1,143 — 44 464,095
Liabilities under factoring agreement 94,233 (5,730) — — — (195) 88,306
Lease liabilities 134,684 (22,667) — 1,779 11,481 4,075 129,353
Liabilities arising from put options held by non-controlling shareholders
426,066 (19,523) 596 660 — (407,800) —
Other liabilities*3 30,460 (3,020) — — — 1,028 28,468
Total ¥1,283,743 ¥255,189 ¥596 ¥3,873 ¥11,481 ¥(403,131) ¥1,151,752
For the fiscal year ended March 31, 2021 (from April 1, 2020 to March 31, 2021)
Thousands of U.S. dollars
Carrying amount as of April 1,
2020Cash flows
Non-cash transactions Carrying amount as of March 31,
2021Changes in fair value
Foreign currency translation
New contracts
Other movements*1
Bonds $ 1,264,565 $ 496,793 $ — $ — $ — $ — $ 1,761,358
Commercial papers*2 767,771 1,002,619 — — — — 1,770,391
Short-term borrowings 584,807 (128,452) — 2,610 — (2,574) 456,390
Long-term borrowings 2,787,038 1,394,210 — 10,324 — 397 4,191,988
Liabilities under factoring agreement 851,169 (51,756) — — — (1,761) 797,633
Lease liabilities 1,216,547 (204,742) — 16,069 103,703 36,807 1,168,394
Liabilities arising from put options held by non-controlling shareholders
3,848,487 (176,343) 5,383 5,961 — (3,683,497) —
Other liabilities*3 275,133 (27,278) — — — 9,285 257,140
Total $11,595,546 $2,305,022 $5,383 $34,983 $103,703 $(3,641,324) $10,403,323
*1. “Other movements” under Non-cash transactions includes changes arising from obtaining or losing control of subsidiaries or other businesses, and changes arising from collection of assets.
*2. Cash flows from commercial papers is included in “Net increase (decrease) in short-term borrowings” under cash flows from financing activities in the consolidated statement of cash flows.
*3. Cash flows from liabilities classified as “Other liabilities” in the above table is included in “Others” under cash flows from financing activities in the consolidated statement of cash flows.
MITSUBISHI HEAVY INDUSTRIES GROUP 28

10. FAIR VALUE MEASUREMENTS
(1) Method of fair value measurementThe method of measuring the fair values of financial assets and
liabilities are as follows.
a) Cash and cash equivalents, trade and other receivables, trade
and other payables, and liabilities under factoring agreements
These items are measured at carrying amount because it approxi-
mates fair value due to the short period to maturity or settlement.
b) Bonds and borrowings
Short-term borrowings and commercial papers are measured at
carrying amount because it approximates fair value due to the
short period to settlement.
The fair value of marketable bonds is measured at market price.
The fair values of non-marketable bonds and long-term borrow-
ings are measured by discounting the estimated future cash flows
to the present value using the interest rate applicable to the bor-
rowing over the same residual period with the same conditions.
c) Other financial assets, and other financial liabilities
The fair value of marketable shares and investments in capital are
measured at market price. The fair value of non-marketable
shares and investments in capital are measured based on market
multiples derived from the PBR (price-to-book ratio) of comparable
companies. For derivative assets and liabilities, the fair value of
forward foreign exchange contracts is determined based on the
forward exchange rate at the market as of the end of each report-
ing period. The fair value of interest rate swaps is determined by
discounting the estimated future cash flows to the present value at
the interest rate as of the end of each reporting period.
d) Liabilities arising from put options held by non-controlling
shareholders
Put options attributable to non-controlling interests granted to
non-controlling shareholders of subsidiaries are initially recog-
nized at the present value of the future exercise price as financial
liabilities, the same amount of which is treated mainly as a deduc-
tion from capital surplus. After initial recognition, they are mea-
sured at amortized cost by using the effective interest method
with subsequent changes recognized as capital surplus. The fair
value of put options is determined by discounting the future cash
flows to the present value.
(2) Financial assets and liabilities measured at fair value in the consolidated statement of financial position
The inputs to valuation techniques used to measure fair value are
categorized into either of the following three based on the observ-
ability in the market.
Level 1 inputs: Quoted prices in active markets for identical
assets or liabilities.
Level 2 inputs: Inputs other than quoted prices included within
Level 1 that are observable for the asset or
liability, either directly or indirectly.
Level 3 inputs: I nputs that are not based on observable market
data.
a) The following is the breakdown of measurements of assets and liabilities measured at fair value.
As of March 31, 2020
Millions of yen
Level 1 Level 2 Level 3 Total
Assets:
Securities and investments in capital ¥213,123 ¥ — ¥151,759 ¥364,883
Derivatives — 5,673 1,042 6,716
Total ¥213,123 ¥ 5,673 ¥152,802 ¥371,600
Liabilities:
Derivatives — 12,778 — 12,778
Total ¥ — ¥12,778 ¥ — ¥ 12,778
As of March 31, 2021
Millions of yen
Level 1 Level 2 Level 3 Total
Assets:
Securities and investments in capital ¥379,890 ¥ — ¥155,372 ¥535,263
Derivatives — 7,822 1,224 9,046
Total ¥379,890 ¥ 7,822 ¥156,597 ¥544,310
Liabilities:
Derivatives — 10,018 2,172 12,190
Total ¥ — ¥10,018 ¥ 2,172 ¥ 12,190
MHI REPORT 2021 FINANCIAL SECTION29
NOTES TO CONSOLIDATED FINANCIAL STATEMENTS

As of March 31, 2021
Thousands of U.S. dollars
Level 1 Level 2 Level 3 Total
Assets:
Securities and investments in capital $3,431,397 $ — $1,403,414 $4,834,820
Derivatives — 70,653 11,055 81,708
Total $3,431,397 $70,653 $1,414,479 $4,916,538
Liabilities:
Derivatives — 90,488 19,618 110,107
Total $ — $90,488 $ 19,618 $ 110,107
Financial assets measured at fair value are separately presented as
“Other financial assets” in both the current assets and non-current
assets sections of the consolidated statement of financial position.
Similarly, financial liabilities measured at fair value are separately
presented as “Bonds, borrowings and other financial liabilities” in
both the current liabilities and non-current liabilities sections.
MHI determines at the end of each reporting period whether
there are transfers between levels of the fair value. There were no
such transfers between levels as of the transition date, March 31,
2020 and March 31, 2021.
b) The changes in fair value measurement of assets and liabilities categorized within Level 3 are as follows:
For the fiscal year ended March 31, 2020 (from April 1, 2019 to March 31, 2020)
Millions of yen
Balance as of April 1, 2019
PurchaseOther Comprehensive Income,
Changes in fair value of financial assets at FVTOCI
Sale Other*1 Balance as of March 31, 2020
Securities and investments in capital ¥113,016 ¥4,555 ¥(856) ¥(1,344) ¥36,389 ¥151,759
*1. “Other” includes the amount transferred from “Investments accounted for using the equity method” that was recognized in the fiscal year ended March 31, 2020 to reflect the Group’s diminished influence.
There were no material changes for derivative assets and liabilities.
For the fiscal year ended March 31, 2021 (from April 1, 2020 to March 31, 2021)
Millions of yen
Balance as of April 1, 2020
PurchaseOther Comprehensive Income,
Changes in fair value of financial assets at FVTOCI
Sale Other*1 Balance as of March 31, 2021
Securities and investments in capital ¥151,759 ¥3,231 ¥(11,057) ¥(4,202) ¥15,641 ¥155,372
Thousands of U.S. dollars
Balance as of April 1, 2020
PurchaseOther Comprehensive Income,
Changes in fair value of financial assets at FVTOCI
Sale Other*1 Balance as of March 31, 2021
Securities and investments in capital $1,370,779 $29,184 $(99,873) $(37,955) $141,279 $1,403,414
*1. “Other” includes shares and investments in capital of external companies that have been held by new consolidated subsidiaries at the beginning time of consolida-tion, which the Group acquired its shares in the fiscal year ended March 31, 2021.
There were no material changes for derivative assets and liabilities.
The financial instruments categorized within Level 3 are assessed
in accordance with the valuation policies and procedures approved
by the responsible person of the Financial Management Division.
Of which, the fair values of non-marketable equity instruments
are measured using valuation methods such as the market mul-
tiple method based on comparable public companies and the
discounted cash flow method.
The significant unobservable inputs used for the market multi-
ple method based on comparable public companies are the price-
to-book ratios (PBRs) of comparable companies; the estimated
fair value of these instruments would increase (decrease) if the
PBR were higher (lower). The PBR distributed within a range from
0.6 to 2.4 times for the fiscal year ended March 31, 2020, and
within a range from 0.6 to 3.0 times for the fiscal year ended
March 31, 2021.
The significant unobservable inputs used for the discounted
cash flow method are the discount rates applied; the estimated
fair value of these instruments would increase (decrease) if the
discount rate were higher (lower). The discount rates applied
ranged between 5.9% and 9.9% for the fiscal year ended March
31, 2020 and between 6.4% and 10.0% for the fiscal year ended
March 31, 2021.
For financial assets and liabilities categorized within Level 3, a
significant increase or decrease in fair value is not expected even if
the unobservable inputs are changed to other reasonably possible
alternative assumptions.
MITSUBISHI HEAVY INDUSTRIES GROUP 30
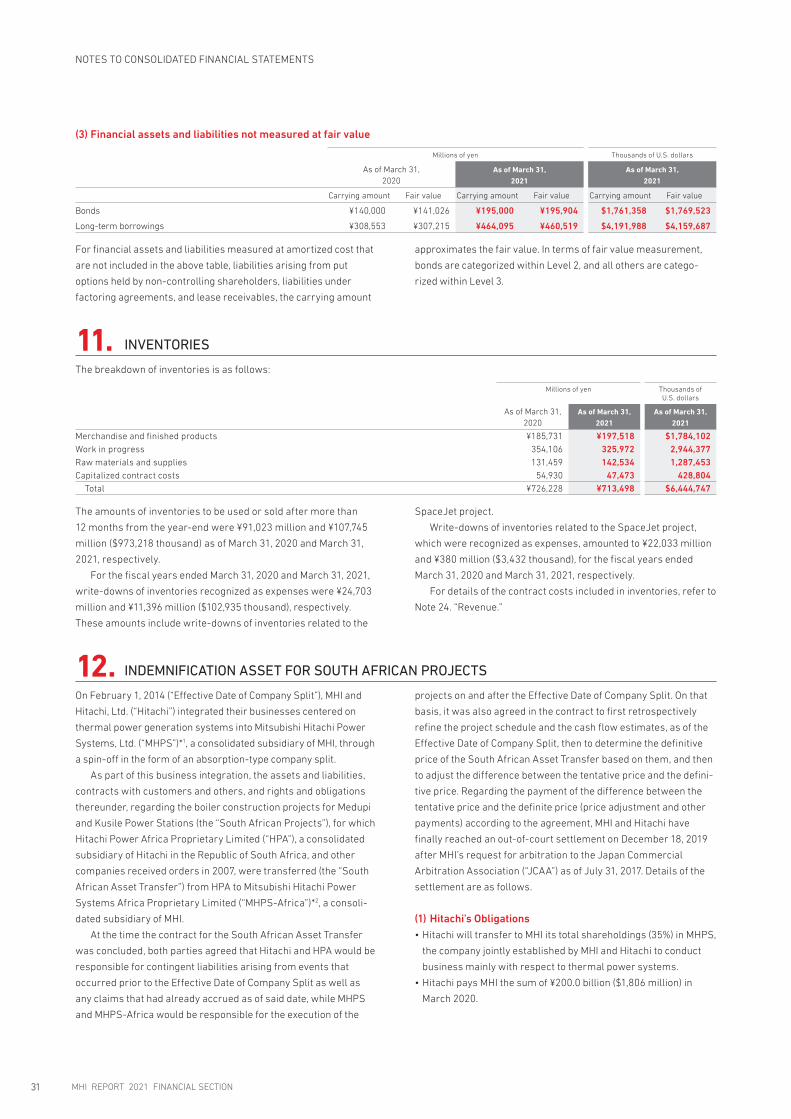
(3) Financial assets and liabilities not measured at fair value
Millions of yen Thousands of U.S. dollars
As of March 31, 2020
As of March 31, 2021
As of March 31, 2021
Carrying amount Fair value Carrying amount Fair value Carrying amount Fair value
Bonds ¥140,000 ¥141,026 ¥195,000 ¥195,904 $1,761,358 $1,769,523
Long-term borrowings ¥308,553 ¥307,215 ¥464,095 ¥460,519 $4,191,988 $4,159,687
For financial assets and liabilities measured at amortized cost that
are not included in the above table, liabilities arising from put
options held by non-controlling shareholders, liabilities under
factoring agreements, and lease receivables, the carrying amount
approximates the fair value. In terms of fair value measurement,
bonds are categorized within Level 2, and all others are catego-
rized within Level 3.
11. INVENTORIES
The breakdown of inventories is as follows:
Millions of yen Thousands of U.S. dollars
As of March 31, 2020
As of March 31, 2021
As of March 31, 2021
Merchandise and finished products ¥185,731 ¥197,518 $1,784,102Work in progress 354,106 325,972 2,944,377Raw materials and supplies 131,459 142,534 1,287,453Capitalized contract costs 54,930 47,473 428,804
Total ¥726,228 ¥713,498 $6,444,747
The amounts of inventories to be used or sold after more than
12 months from the year-end were ¥91,023 million and ¥107,745
million ($973,218 thousand) as of March 31, 2020 and March 31,
2021, respectively.
For the fiscal years ended March 31, 2020 and March 31, 2021,
write-downs of inventories recognized as expenses were ¥24,703
million and ¥11,396 million ($102,935 thousand), respectively.
These amounts include write-downs of inventories related to the
SpaceJet project.
Write-downs of inventories related to the SpaceJet project,
which were recognized as expenses, amounted to ¥22,033 million
and ¥380 million ($3,432 thousand), for the fiscal years ended
March 31, 2020 and March 31, 2021, respectively.
For details of the contract costs included in inventories, refer to
Note 24. “Revenue.”
12. INDEMNIFICATION ASSET FOR SOUTH AFRICAN PROJECTS
On February 1, 2014 (“Effective Date of Company Split”), MHI and
Hitachi, Ltd. (“Hitachi”) integrated their businesses centered on
thermal power generation systems into Mitsubishi Hitachi Power
Systems, Ltd. (“MHPS”)*1, a consolidated subsidiary of MHI, through
a spin-off in the form of an absorption-type company split.
As part of this business integration, the assets and liabilities,
contracts with customers and others, and rights and obligations
thereunder, regarding the boiler construction projects for Medupi
and Kusile Power Stations (the “South African Projects”), for which
Hitachi Power Africa Proprietary Limited (“HPA”), a consolidated
subsidiary of Hitachi in the Republic of South Africa, and other
companies received orders in 2007, were transferred (the “South
African Asset Transfer”) from HPA to Mitsubishi Hitachi Power
Systems Africa Proprietary Limited (“MHPS-Africa”)*2, a consoli-
dated subsidiary of MHI.
At the time the contract for the South African Asset Transfer
was concluded, both parties agreed that Hitachi and HPA would be
responsible for contingent liabilities arising from events that
occurred prior to the Effective Date of Company Split as well as
any claims that had already accrued as of said date, while MHPS
and MHPS-Africa would be responsible for the execution of the
projects on and after the Effective Date of Company Split. On that
basis, it was also agreed in the contract to first retrospectively
refine the project schedule and the cash flow estimates, as of the
Effective Date of Company Split, then to determine the definitive
price of the South African Asset Transfer based on them, and then
to adjust the difference between the tentative price and the defini-
tive price. Regarding the payment of the difference between the
tentative price and the definite price (price adjustment and other
payments) according to the agreement, MHI and Hitachi have
finally reached an out-of-court settlement on December 18, 2019
after MHI’s request for arbitration to the Japan Commercial
Arbitration Association (“JCAA”) as of July 31, 2017. Details of the
settlement are as follows.
(1) Hitachi’s Obligations• Hitachi will transfer to MHI its total shareholdings (35%) in MHPS,
the company jointly established by MHI and Hitachi to conduct
business mainly with respect to thermal power systems.
• Hitachi pays MHI the sum of ¥200.0 billion ($1,806 million) in
March 2020.
MHI REPORT 2021 FINANCIAL SECTION31
NOTES TO CONSOLIDATED FINANCIAL STATEMENTS
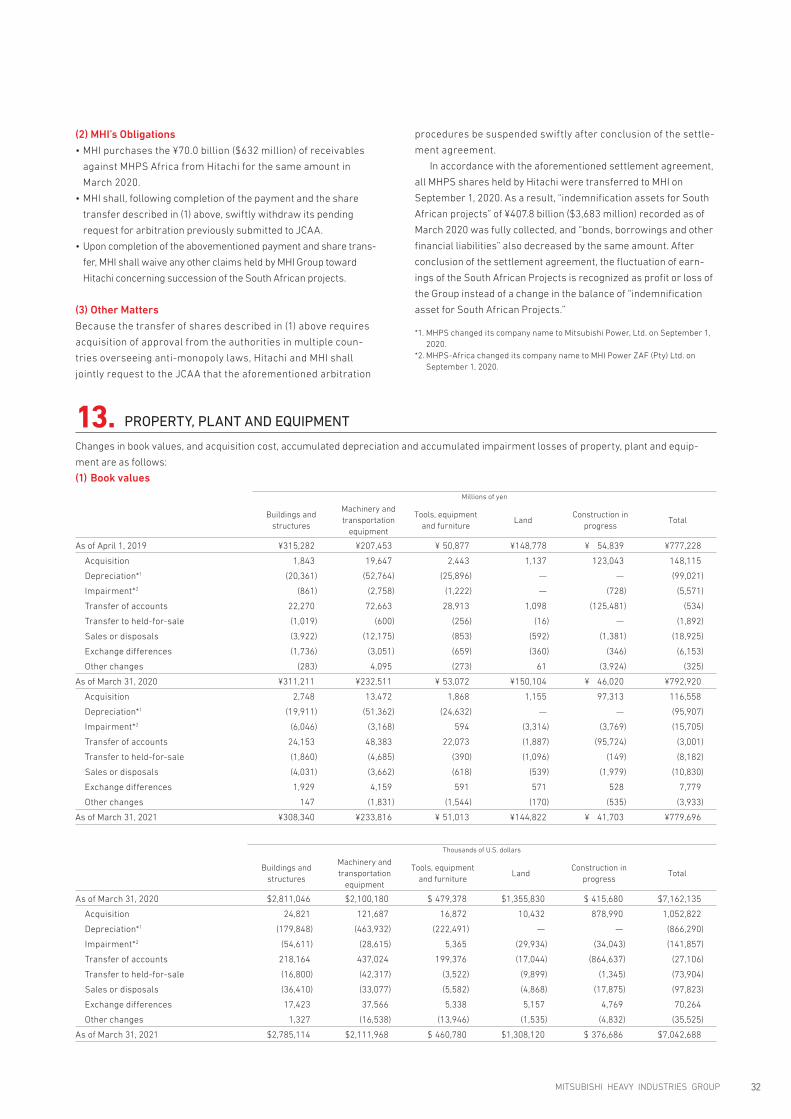
(2) MHI’s Obligations• MHI purchases the ¥70.0 billion ($632 million) of receivables
against MHPS Africa from Hitachi for the same amount in
March 2020.
• MHI shall, following completion of the payment and the share
transfer described in (1) above, swiftly withdraw its pending
request for arbitration previously submitted to JCAA.
• Upon completion of the abovementioned payment and share trans-
fer, MHI shall waive any other claims held by MHI Group toward
Hitachi concerning succession of the South African projects.
(3) Other MattersBecause the transfer of shares described in (1) above requires
acquisition of approval from the authorities in multiple coun-
tries overseeing anti-monopoly laws, Hitachi and MHI shall
jointly request to the JCAA that the aforementioned arbitration
procedures be suspended swiftly after conclusion of the settle-
ment agreement.
In accordance with the aforementioned settlement agreement,
all MHPS shares held by Hitachi were transferred to MHI on
September 1, 2020. As a result, “indemnification assets for South
African projects” of ¥407.8 billion ($3,683 million) recorded as of
March 2020 was fully collected, and “bonds, borrowings and other
financial liabilities” also decreased by the same amount. After
conclusion of the settlement agreement, the fluctuation of earn-
ings of the South African Projects is recognized as profit or loss of
the Group instead of a change in the balance of “indemnification
asset for South African Projects.”
*1. MHPS changed its company name to Mitsubishi Power, Ltd. on September 1, 2020.
*2. MHPS-Africa changed its company name to MHI Power ZAF (Pty) Ltd. on September 1, 2020.
13. PROPERTY, PLANT AND EQUIPMENT
Changes in book values, and acquisition cost, accumulated depreciation and accumulated impairment losses of property, plant and equip-
ment are as follows:
(1) Book values
Millions of yen
Buildings and structures
Machinery and transportation
equipment
Tools, equipment and furniture
LandConstruction in
progressTotal
As of April 1, 2019 ¥315,282 ¥207,453 ¥ 50,877 ¥148,778 ¥ 54,839 ¥777,228
Acquisition 1,843 19,647 2,443 1,137 123,043 148,115
Depreciation*1 (20,361) (52,764) (25,896) — — (99,021)
Impairment*2 (861) (2,758) (1,222) — (728) (5,571)
Transfer of accounts 22,270 72,663 28,913 1,098 (125,481) (534)
Transfer to held-for-sale (1,019) (600) (256) (16) — (1,892)
Sales or disposals (3,922) (12,175) (853) (592) (1,381) (18,925)
Exchange differences (1,736) (3,051) (659) (360) (346) (6,153)
Other changes (283) 4,095 (273) 61 (3,924) (325)
As of March 31, 2020 ¥311,211 ¥232,511 ¥ 53,072 ¥150,104 ¥ 46,020 ¥792,920
Acquisition 2,748 13,472 1,868 1,155 97,313 116,558
Depreciation*1 (19,911) (51,362) (24,632) — — (95,907)
Impairment*2 (6,046) (3,168) 594 (3,314) (3,769) (15,705)
Transfer of accounts 24,153 48,383 22,073 (1,887) (95,724) (3,001)
Transfer to held-for-sale (1,860) (4,685) (390) (1,096) (149) (8,182)
Sales or disposals (4,031) (3,662) (618) (539) (1,979) (10,830)
Exchange differences 1,929 4,159 591 571 528 7,779
Other changes 147 (1,831) (1,544) (170) (535) (3,933)
As of March 31, 2021 ¥308,340 ¥233,816 ¥ 51,013 ¥144,822 ¥ 41,703 ¥779,696
Thousands of U.S. dollars
Buildings and structures
Machinery and transportation
equipment
Tools, equipment and furniture
LandConstruction in
progressTotal
As of March 31, 2020 $2,811,046 $2,100,180 $ 479,378 $1,355,830 $ 415,680 $7,162,135
Acquisition 24,821 121,687 16,872 10,432 878,990 1,052,822
Depreciation*1 (179,848) (463,932) (222,491) — — (866,290)
Impairment*2 (54,611) (28,615) 5,365 (29,934) (34,043) (141,857)
Transfer of accounts 218,164 437,024 199,376 (17,044) (864,637) (27,106)
Transfer to held-for-sale (16,800) (42,317) (3,522) (9,899) (1,345) (73,904)
Sales or disposals (36,410) (33,077) (5,582) (4,868) (17,875) (97,823)
Exchange differences 17,423 37,566 5,338 5,157 4,769 70,264
Other changes 1,327 (16,538) (13,946) (1,535) (4,832) (35,525)
As of March 31, 2021 $2,785,114 $2,111,968 $ 460,780 $1,308,120 $ 376,686 $7,042,688
MITSUBISHI HEAVY INDUSTRIES GROUP 32

(2) Acquisition cost
Millions of yen
Buildings and structures
Machinery and transportation
equipment
Tools, equipment and furniture
LandConstruction in
progressTotal
As of April 1, 2019 ¥839,306 ¥1,300,005 ¥531,897 ¥150,036 ¥87,947 ¥2,909,190
As of March 31, 2020 837,871 1,334,333 542,758 151,778 55,063 2,921,805
As of March 31, 2021 ¥842,767 ¥1,322,011 ¥535,911 ¥145,802 ¥53,893 ¥2,900,387
Thousands of U.S. dollars
Buildings and structures
Machinery and transportation
equipment
Tools, equipment and furniture
LandConstruction in
progressTotal
As of March 31, 2021 $7,612,383 $11,941,206 $4,840,673 $1,316,972 $486,794 $26,198,052
(3) Accumulated depreciation and accumulated impairment losses
Millions of yen
Buildings and structures
Machinery and transportation
equipment
Tools, equipment and furniture
LandConstruction in
progressTotal
As of April 1, 2019 ¥524,024 ¥1,092,553 ¥481,020 ¥1,258 ¥33,108 ¥2,131,962
As of March 31, 2020 526,660 1,101,821 489,686 1,674 9,042 2,128,885
As of March 31, 2021 ¥534,427 ¥1,088,194 ¥484,898 ¥ 980 ¥12,189 ¥2,120,690
Thousands of U.S. dollars
Buildings and structures
Machinery and transportation
equipment
Tools, equipment and furniture
LandConstruction in
progressTotal
As of March 31, 2021 $4,827,269 $9,829,229 $4,379,893 $8,851 $110,098 $19,155,364
*1. Depreciation is included in “Cost of sales” and “Selling, general and administrative expenses” in the consolidated statement of profit or loss*2. For details of impairment, refer to Note 15. “Impairment of Non-Financial Assets.”
14. GOODWILL AND INTANGIBLE ASSETS
Changes in book values, and acquisition cost, accumulated amortization and accumulated impairment losses of goodwill and intangible
assets are as follows:
(1) Book values
Millions of yen
GoodwillInternal
development*3
Technologies recognized
through business combinations
Customer relations
recognized through business
combinations
Software Other Total
As of April 1, 2019 ¥121,117 ¥ 27,763 ¥26,644 ¥17,515 ¥21,083 ¥20,124 ¥ 234,248
Acquisition 84 88,309 — — 10,379 3,036 101,809
Acquisition through business combinations 4,210 — — 8,312 — 851 13,374
Amortization*1 — — (6,866) (7,818) (7,354) (4,535) (26,574)
Impairment*2 — (116,081) — — (1,242) (54) (117,378)
Transfer of accounts — — — — 2,073 (2,096) (23)
Transfer to held-for-sale — — — — — — —
Sale or disposal — — — — (231) (23) (255)
Exchange differences (911) — (424) (75) (183) (504) (2,100)
Other changes — 8 — — 529 (230) 307
As of March 31, 2020 ¥124,500 ¥ — ¥19,354 ¥17,934 ¥25,052 ¥16,567 ¥ 203,409
Acquisition 125 29,402 — — 7,269 1,749 38,547
Acquisition through business combinations 47,950 — — 2,969 — 10,022 60,943
Amortization*1 — — (5,585) (6,939) (7,409) (5,120) (25,054)
Impairment*2 (49,504) (29,402) — — (106) (18) (79,030)
Transfer of accounts — — — — 573 (533) 40
Transfer to held-for-sale — — — — (1,242) (274) (1,516)
Sale or disposal — — — — (368) (36) (404)
Exchange differences 1,551 — 315 430 306 1,079 3,684
Other changes (124) — (84) (201) 126 (1,111) (1,396)
As of March 31, 2021 ¥124,500 ¥ — ¥13,999 ¥14,194 ¥24,202 ¥22,325 ¥ 199,222
MHI REPORT 2021 FINANCIAL SECTION33
NOTES TO CONSOLIDATED FINANCIAL STATEMENTS

Thousands of U.S. dollars
GoodwillInternal
development*3
Technologies recognized
through business combinations
Customer relations
recognized through business
combinations
Software Other Total
As of March 31, 2020 $1,124,559 $ — $174,817 $161,990 $226,284 $149,643 $1,837,313
Acquisition 1,129 265,576 — — 65,658 15,798 348,179
Acquisition through business combinations 433,113 — — 26,817 — 90,524 550,474
Amortization*1 — — (50,447) (62,677) (66,922) (46,246) (226,302)
Impairment*2 (447,150) (265,576) — — (957) (162) (713,846)
Transfer of accounts — — — — 5,175 (4,814) 361
Transfer to held-for-sale — — — — (11,218) (2,474) (13,693)
Sale or disposal — — — — (3,323) (325) (3,649)
Exchange differences 14,009 — 2,845 3,884 2,763 9,746 33,276
Other changes (1,120) — (758) (1,815) 1,138 (10,035) (12,609)
As of March 31, 2021 $1,124,559 $ — $126,447 $128,208 $218,607 $201,652 $1,799,494
(2) Acquisition cost
Millions of yen
GoodwillInternal
development*3
Technologies recognized
through business combinations
Customer relations
recognized through business
combinations
Software Other Total
As of April 1, 2019 ¥207,701 ¥529,486 ¥59,328 ¥59,711 ¥70,243 ¥76,887 ¥1,003,359
As of March 31, 2020 210,233 614,885 58,491 67,728 69,113 65,768 1,086,221
As of March 31, 2021 ¥259,898 ¥644,288 ¥58,840 ¥71,078 ¥70,250 ¥73,674 ¥1,178,031
Thousands of U.S. dollars
GoodwillInternal
development*3
Technologies recognized
through business combinations
Customer relations
recognized through business
combinations
Software Other Total
As of March 31, 2021 $2,347,556 $5,819,600 $531,478 $642,019 $634,531 $665,468 $10,640,691
(3) Accumulated amortization and accumulated impairment losses
Millions of yen
GoodwillInternal
development*3
Technologies recognized
through business combinations
Customer relations
recognized through business
combinations
Software Other Total
As of April 1, 2019 ¥ 86,584 ¥501,722 ¥32,683 ¥42,196 ¥49,159 ¥56,763 ¥769,110
As of March 31, 2020 85,732 614,885 39,137 49,794 44,060 49,201 882,812
As of March 31, 2021 ¥135,398 ¥644,288 ¥44,841 ¥56,884 ¥46,047 ¥51,349 ¥978,809
Thousands of U.S. dollars
GoodwillInternal
development*3
Technologies recognized
through business combinations
Customer relations
recognized through business
combinations
Software Other Total
As of March 31, 2021 $1,222,997 $5,819,600 $405,031 $513,810 $415,924 $463,815 $8,841,197
*1. Amortization of amortizable intangible assets is included in “Cost of sales” and “Selling, general and administrative expenses” in the consolidated statement of profit or loss.
*2. For details of impairment, refer to Note 15. “Impairment of Non-Financial Assets.”*3. Assets still in business development phases that are determined not to be ready for their intended use are classified into intangible assets with indefinite useful
lives based on the analysis that the period over which such assets are expected to generate future economic benefits is not foreseeable. Intangible assets with indefinite useful lives are measured at cost less any accumulated impairment losses.
MITSUBISHI HEAVY INDUSTRIES GROUP 34
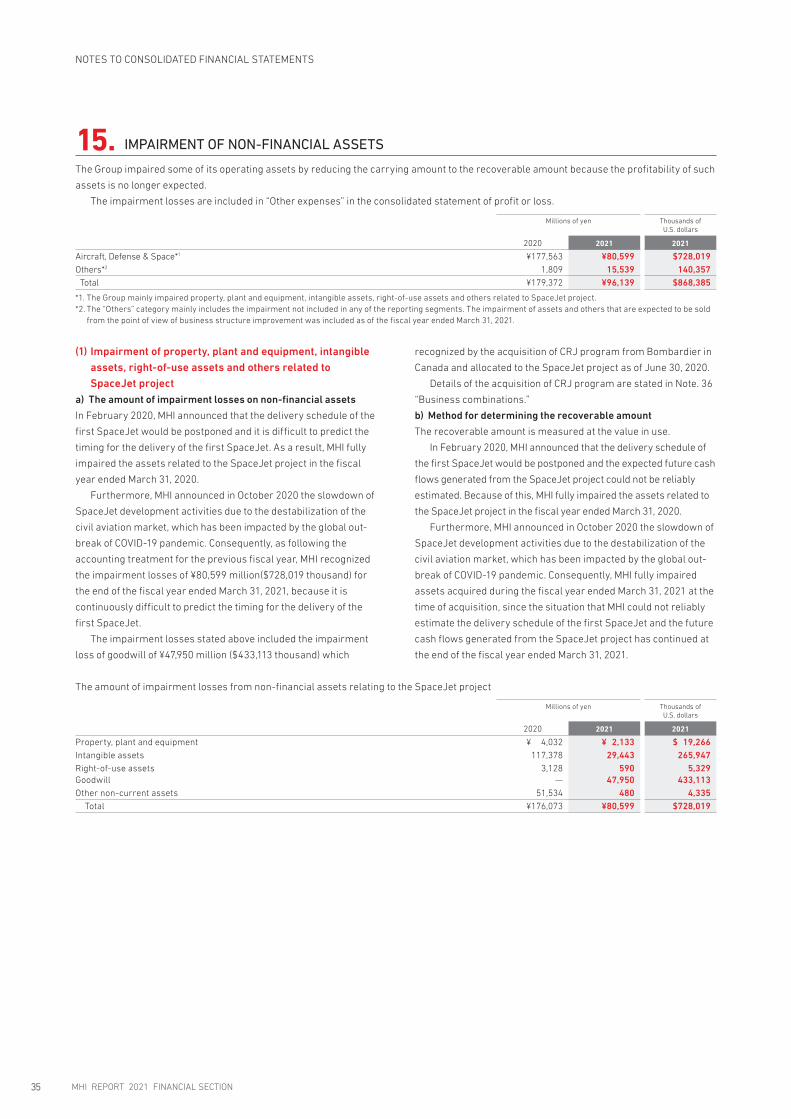
15. IMPAIRMENT OF NON-FINANCIAL ASSETS
The Group impaired some of its operating assets by reducing the carrying amount to the recoverable amount because the profitability of such
assets is no longer expected.
The impairment losses are included in “Other expenses” in the consolidated statement of profit or loss.
Millions of yen Thousands of U.S. dollars
2020 2021 2021
Aircraft, Defense & Space*1 ¥177,563 ¥80,599 $728,019Others*2 1,809 15,539 140,357
Total ¥179,372 ¥96,139 $868,385
*1. The Group mainly impaired property, plant and equipment, intangible assets, right-of-use assets and others related to SpaceJet project.*2. The “Others” category mainly includes the impairment not included in any of the reporting segments. The impairment of assets and others that are expected to be sold
from the point of view of business structure improvement was included as of the fiscal year ended March 31, 2021.
(1) Impairment of property, plant and equipment, intangible assets, right-of-use assets and others related to SpaceJet project
a) The amount of impairment losses on non-financial assets
In February 2020, MHI announced that the delivery schedule of the
first SpaceJet would be postponed and it is difficult to predict the
timing for the delivery of the first SpaceJet. As a result, MHI fully
impaired the assets related to the SpaceJet project in the fiscal
year ended March 31, 2020.
Furthermore, MHI announced in October 2020 the slowdown of
SpaceJet development activities due to the destabilization of the
civil aviation market, which has been impacted by the global out-
break of COVID-19 pandemic. Consequently, as following the
accounting treatment for the previous fiscal year, MHI recognized
the impairment losses of ¥80,599 million($728,019 thousand) for
the end of the fiscal year ended March 31, 2021, because it is
continuously difficult to predict the timing for the delivery of the
first SpaceJet.
The impairment losses stated above included the impairment
loss of goodwill of ¥47,950 million ($433,113 thousand) which
recognized by the acquisition of CRJ program from Bombardier in
Canada and allocated to the SpaceJet project as of June 30, 2020.
Details of the acquisition of CRJ program are stated in Note. 36
“Business combinations.”
b) Method for determining the recoverable amount
The recoverable amount is measured at the value in use.
In February 2020, MHI announced that the delivery schedule of
the first SpaceJet would be postponed and the expected future cash
flows generated from the SpaceJet project could not be reliably
estimated. Because of this, MHI fully impaired the assets related to
the SpaceJet project in the fiscal year ended March 31, 2020.
Furthermore, MHI announced in October 2020 the slowdown of
SpaceJet development activities due to the destabilization of the
civil aviation market, which has been impacted by the global out-
break of COVID-19 pandemic. Consequently, MHI fully impaired
assets acquired during the fiscal year ended March 31, 2021 at the
time of acquisition, since the situation that MHI could not reliably
estimate the delivery schedule of the first SpaceJet and the future
cash flows generated from the SpaceJet project has continued at
the end of the fiscal year ended March 31, 2021.
The amount of impairment losses from non-financial assets relating to the SpaceJet project
Millions of yen Thousands of U.S. dollars
2020 2021 2021
Property, plant and equipment ¥ 4,032 ¥ 2,133 $ 19,266Intangible assets 117,378 29,443 265,947Right-of-use assets 3,128 590 5,329Goodwill — 47,950 433,113Other non-current assets 51,534 480 4,335
Total ¥176,073 ¥80,599 $728,019
MHI REPORT 2021 FINANCIAL SECTION35
NOTES TO CONSOLIDATED FINANCIAL STATEMENTS

(2) Other impairmentsThe amount of impairment losses from non-financial assets relating to other businesses
Millions of yen Thousands of U.S. dollars
2020 2021 2021
Property, plant and equipment ¥1,538 ¥13,571 $122,581Intangible assets — 82 740Right-of-use assets 1,760 330 2,980Goodwill — 1,553 14,027Other non-current assets — 1 9
Total ¥3,299 ¥15,539 $140,357
(3) Impairment test for goodwillAs described in Note 3. “Significant Accounting Policies
(10) Impairment of non-financial assets,” the Group performs
impairment tests annually, or whenever there is an indication of
impairment.
Since goodwill does not generate independent cash flows, the
Group estimates the recoverable amount of goodwill together with
non-financial assets such as other property, plant and equipment
and performs impairment tests on them. The total amount of
non-financial assets including goodwill subject to the impairment
testing, were ¥1,101,783 million, and ¥1,082,134 million ($9,774,491
thousand) as of March 31, 2020 and March 31, 2021, respectively.
The recoverable amount is measured at the value in use. The
value in use is calculated by discounting to the present value the
future cash flows projected based on the business plans, approved
by management, reflecting historical experience and external
information and the growth rate. The Group establishes the
business plans consist of the key points such as trends of future
revenue and gross margin ratios, and the reduction of fixed costs,
which would have significant impacts on the projection. These are
based on factors considered reasonable by management.
For impairment tests of goodwill, the weighted average cost of
capital for each CGU was used as a discount rate.
The discount rates(before tax) used for the impartment tests
were 4.7% to 9.8%, and 6.4% to 10.9% for the fiscal years ended
March 31, 2020 and March 31, 2021, respectively.
Growth rates were 0%, and -0.5% to 0% for the fiscal years
ended March 31, 2020 and March 31, 2021, respectively.
The total amount of the Group’s goodwill at the end of the fiscal
year, which was ¥124,500 million ($1,124,559 thousand) as of
March 31, 2020 and March 31, 2021, respectively.
The breakdown of the carrying amount of goodwill by CGU is as
follows.
The balance of carrying amount of major goodwill by CGU
Millions of yen
Material handling equipment
Steam power GTCC Metals machinery
As of March 31, 2020 ¥55,370 ¥25,473 ¥20,113 ¥16,816
As of March 31, 2021 ¥55,364 ¥25,530 ¥20,159 ¥18,003
Key factors used for impairment tests for the fiscal year ended March 31, 2021
Discount rate (before tax) 6.4% ~ 8.3%
Growth rate –0.5% ~ 0.0%
Thousands of U.S. dollars
Material handling equipment
Steam power GTCC Metals machinery
As of March 31, 2021 $500,081 $230,602 $182,088 $162,614
No impairment loss of goodwill allocated to four main CGUs stated
above table was recognized in either the fiscal year ended March
31, 2020 or the fiscal year ended March 31, 2021.
The recoverable amount of Material handling equipment and
GTCC was sufficiently higher than the carrying amount for the
CGU. The Group judged it was unlikely that the recoverable amount
fall below the carrying amount, even if key factors used for impair-
ment tests changed to the predictable extent reasonably. On the
other hand, although the recoverable amount of Steam power
business and Metals machinery business exceeded the carrying
amount by ¥194,253 million ($1,754,611 thousand) and ¥39,709
million ($358,675 thousand) respectively, an impairment loss may
be recognized if the discount rate (before tax) or the growth rate,
which is among key factors used in the impairment testing were
changed as following.
• Steam power: In case of an increase of 13.7% in the discount rate
or a decrease of 29.9% in the growth rate.
• Metals machinery: In case of an increase of 5.0% in the discount
rate or a decrease of 6.8% in the growth rate.
In addition, an impairment loss also may be recognized in case
that there occurred material changes in the factors of the busi-
ness plan underlying the estimated future cash flows.
MITSUBISHI HEAVY INDUSTRIES GROUP 36

16. INCOME TAXES
(1) Deferred tax assets and liabilitiesa) The breakdown of major factors for deferred tax assets and liabilities
For the fiscal year ended March 31, 2020
Millions of yen
As of April 1, 2019Recognized through
profit or lossRecognized in other
comprehensive incomeAs of March 31, 2020
Deferred tax assets
Investments in subsidiaries, associates and joint ventures
¥ — ¥180,756 ¥ — ¥180,756
Retirement benefits liabilities 71,099 2,929 10,979 85,008
Unused tax losses 22,458 (12,224) — 10,234
Provisions 51,649 (1,291) — 50,358
Excess of book depreciation over tax depreciation
22,396 (918) — 21,477
Accrued expenses, and so forth 16,516 2,681 — 19,198
Loss on valuation of inventories 14,721 5,609 — 20,331
Valuation difference on property, plant and equipment
9,932 8,421 — 18,354
Contract liabilities 18,421 (4,062) — 14,358
Valuation difference on right-of-use assets 12,464 3,239 — 15,704
Valuation difference on securities 2,769 — (547) 2,222
Loss allowance for expected credit losses 7,237 (2,146) — 5,091
Other 72,788 32,208 (1,915) 103,081
Total deferred tax assets ¥322,457 ¥215,202 ¥ 8,517 ¥546,177
Deferred tax liabilities
Valuation difference on securities 45,593 — (25,482) 20,110
Gain (loss) on contribution of securities to retirement benefit trust
45,509 (1,972) — 43,537
Reserve for advanced depreciation of non-current assets
34,223 (6,970) — 27,252
Investments in subsidiaries, associates and joint ventures
9,339 14,178 (6,233) 17,284
Excess of book depreciation over tax depreciation
7,894 3,679 — 11,574
Tax benefits recognized under the Act on Strengthening Industrial Competitiveness
10,574 — — 10,574
Intangible assets recognized through business combinations
8,318 (2,324) — 5,994
Other 31,506 1,889 1,043 34,438
Total deferred tax liabilities ¥192,958 ¥ 8,480 ¥(30,673) ¥170,765
MHI REPORT 2021 FINANCIAL SECTION37
NOTES TO CONSOLIDATED FINANCIAL STATEMENTS
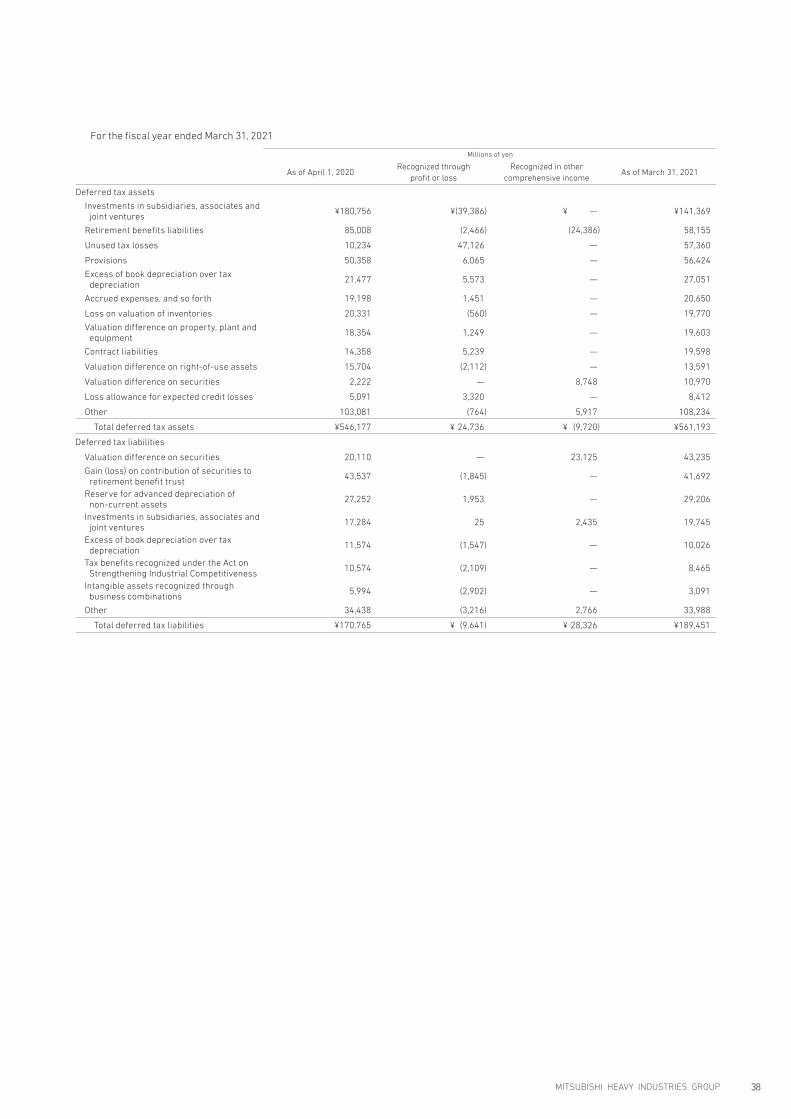
For the fiscal year ended March 31, 2021
Millions of yen
As of April 1, 2020Recognized through
profit or lossRecognized in other
comprehensive incomeAs of March 31, 2021
Deferred tax assets
Investments in subsidiaries, associates and joint ventures
¥180,756 ¥(39,386) ¥ — ¥141,369
Retirement benefits liabilities 85,008 (2,466) (24,386) 58,155
Unused tax losses 10,234 47,126 — 57,360
Provisions 50,358 6,065 — 56,424
Excess of book depreciation over tax depreciation
21,477 5,573 — 27,051
Accrued expenses, and so forth 19,198 1,451 — 20,650
Loss on valuation of inventories 20,331 (560) — 19,770
Valuation difference on property, plant and equipment
18,354 1,249 — 19,603
Contract liabilities 14,358 5,239 — 19,598
Valuation difference on right-of-use assets 15,704 (2,112) — 13,591
Valuation difference on securities 2,222 — 8,748 10,970
Loss allowance for expected credit losses 5,091 3,320 — 8,412
Other 103,081 (764) 5,917 108,234
Total deferred tax assets ¥546,177 ¥ 24,736 ¥ (9,720) ¥561,193
Deferred tax liabilities
Valuation difference on securities 20,110 — 23,125 43,235
Gain (loss) on contribution of securities to retirement benefit trust
43,537 (1,845) — 41,692
Reserve for advanced depreciation of non-current assets
27,252 1,953 — 29,206
Investments in subsidiaries, associates and joint ventures
17,284 25 2,435 19,745
Excess of book depreciation over tax depreciation
11,574 (1,547) — 10,026
Tax benefits recognized under the Act on Strengthening Industrial Competitiveness
10,574 (2,109) — 8,465
Intangible assets recognized through business combinations
5,994 (2,902) — 3,091
Other 34,438 (3,216) 2,766 33,988
Total deferred tax liabilities ¥170,765 ¥ (9,641) ¥ 28,326 ¥189,451
MITSUBISHI HEAVY INDUSTRIES GROUP 38

For the fiscal year ended March 31, 2021
Thousands of U.S. dollars
As of April 1, 2020Recognized through
profit or lossRecognized in other
comprehensive incomeAs of March 31, 2021
Deferred tax assets
Investments in subsidiaries, associates and joint ventures
$1,632,698 $(355,758) $ — $1,276,930
Retirement benefits liabilities 767,843 (22,274) (220,269) 525,291
Unused tax losses 92,439 425,670 — 518,110
Provisions 454,864 54,782 — 509,655
Excess of book depreciation over tax depreciation
193,993 50,338 — 244,341
Accrued expenses, and so forth 173,408 13,106 — 186,523
Loss on valuation of inventories 183,641 (5,058) — 178,574
Valuation difference on property, plant and equipment
165,784 11,281 — 177,066
Contract liabilities 129,690 47,321 — 177,021
Valuation difference on right-of-use assets 141,848 (19,076) — 122,762
Valuation difference on securities 20,070 — 79,017 99,087
Loss allowance for expected credit losses 45,985 29,988 — 75,982
Other 931,090 (6,900) 53,445 977,635
Total deferred tax assets $4,933,402 $223,430 $(87,796) $5,069,036
Deferred tax liabilities
Valuation difference on securities 181,645 — 208,879 390,524
Gain (loss) on contribution of securities to retirement benefit trust
393,252 (16,665) — 376,587
Reserve for advanced depreciation of non-current assets
246,156 17,640 — 263,806
Investments in subsidiaries, associates and joint ventures
156,119 225 21,994 178,348
Excess of book depreciation over tax depreciation
104,543 (13,973) — 90,560
Tax benefits recognized under the Act on Strengthening Industrial Competitiveness
95,510 (19,049) — 76,461
Intangible assets recognized through business combinations
54,141 (26,212) — 27,919
Other 311,064 (29,048) 24,984 307,000
Total deferred tax liabilities $1,542,453 $ (87,083) $ 255,857 $1,711,236
b) Deferred tax assets and liabilities recognized in the consolidated statement of financial position
Millions of yen Thousands of U.S. dollars
As of March 31, 2020
As of March 31, 2021
As of March 31, 2021
Deferred tax assets ¥382,729 ¥378,338 $3,417,388Deferred tax liabilities ¥ 7,318 ¥ 6,597 $ 59,588
c) Unused tax losses and deductible temporary differences for unrecognized deferred tax assets
Millions of yen Thousands of U.S. dollars
As of March 31, 2020
As of March 31, 2021
As of March 31, 2021
Unused tax losses ¥ 459,070 ¥ 547,258 $ 4,943,166Deductible temporary differences 652,642 628,428 5,676,343
Total ¥1,111,712 ¥1,175,687 $10,619,519
In recognizing the deferred tax assets, the Group assesses
whether it is possible that part or all of the deductible temporary
differences, unused tax losses and others are to be utilized
against future taxable profits. The estimate of future taxable
profits is based on the business plan approved by management,
which is established by taking account of the reduction of fixed
costs, the impact of spread of COVID-19 on demand and production
and responses to changes in business environment of the gas and
steam power systems business, which is one of the Group’s core
businesses. For the assessment of the recoverability of deferred
tax assets, the Group assesses that it is probable that the tax
benefit will be realized based on the level of past taxable profits,
the projection of future taxable profits for the period when the
deferred tax assets can be recognized and management plans
taking into account tax implications and others.
MHI REPORT 2021 FINANCIAL SECTION39
NOTES TO CONSOLIDATED FINANCIAL STATEMENTS

d) The amount of unused tax losses for unrecognized deferred tax assets and the expiration year
Millions of yen Thousands of U.S. dollars
As of March 31, 2020
As of March 31, 2021
As of March 31, 2021
Year 1 ¥ 12,051 ¥ 18,145 $ 163,896Year 2 20,604 15,198 137,277Year 3 16,672 25,364 229,103Year 4 20,058 37,463 338,388Year 5 or later 389,684 451,087 4,074,491
Total ¥459,070 ¥547,258 $4,943,166
Local taxes in Japan (corporate inhabitant tax and corporate enterprise tax) are included in the amount of unused tax losses, and the tax rates
are less than 10%.
e) The aggregated amount of temporary differences associated
with investments for unrecognized deferred tax liabilities
The aggregated amount of temporary differences associated with
investments in subsidiaries and associates for unrecognized
deferred tax liabilities as of March 31, 2020 and March 31, 2021,
were ¥271,284 million and ¥318,017 million ($2,872,522 thousand),
respectively. The deferred tax liabilities associated with said
temporary differences are not recognized when the Group is able
to control the timing of the reversal of the temporary differences,
and it is probable that the temporary differences will not reverse
within the foreseeable future.
(2) Income taxes recognized through profit or lossThe breakdown of income taxes recognized through profit or loss for each consolidated fiscal year is as follows:
Millions of yen Thousands of U.S. dollars
2020 2021 2021
Current tax expense
Current period ¥ 63,636 ¥ 36,324 $ 328,100
Prior period restatement 3,141 4,206 37,991
Total of current tax expense 66,777 40,530 366,091
Deferred tax expense
Arising and reversal of temporary differences (207,796) (35,838) (323,710)
Changes in tax rates or the imposition of new taxes 5 1,120 10,116
Other 1,068 340 3,071
Total of deferred tax expense (206,722) (34,377) (310,513)
Total tax expense ¥(139,945) ¥ 6,153 $ 55,577
(3) Reconciliation of income tax rateThe breakdown of major reconciling items between the effective statutory tax rate and the average actual tax rate are as follows:
2020 2021
Effective statutory tax rate in Japan 30.4% 30.5%
Non-deductible expenses (13.5)% 2.8%
Non-taxable revenues 6.4% (1.6)%
Share of profit (loss) of investments accounted for using the equity method 11.7% (9.4)%
Changes in unrecognized deferred tax assets (118.1)% (3.0)%
Tax credit for experiment and research expenses 24.5% (2.4)%
Investments in subsidiaries, associates and joint ventures 497.4% (16.1)%
Revision to year-end deferred tax assets due to a change in tax rate (0.6)% 0.6%
Other (9.7)% 11.0%
Average actual tax rate 428.5% 12.5%
MITSUBISHI HEAVY INDUSTRIES GROUP 40
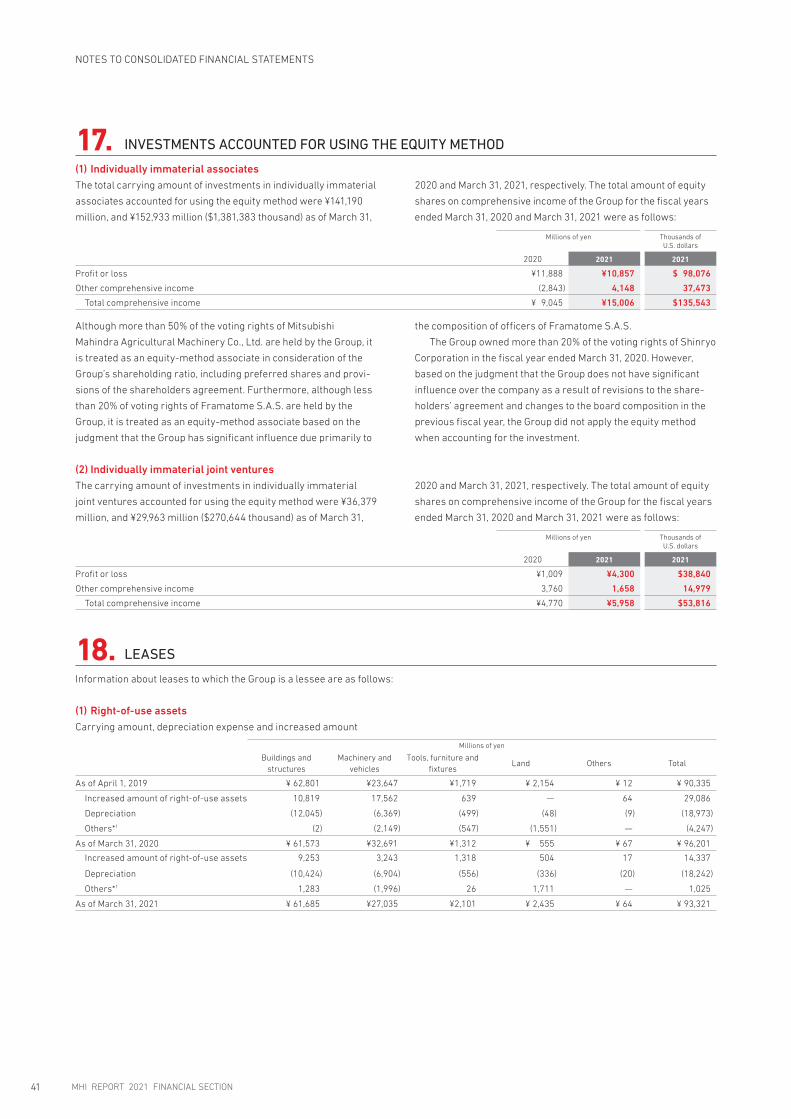
17. INVESTMENTS ACCOUNTED FOR USING THE EQUITY METHOD
(1) Individually immaterial associatesThe total carrying amount of investments in individually immaterial
associates accounted for using the equity method were ¥141,190
million, and ¥152,933 million ($1,381,383 thousand) as of March 31,
2020 and March 31, 2021, respectively. The total amount of equity
shares on comprehensive income of the Group for the fiscal years
ended March 31, 2020 and March 31, 2021 were as follows:
Millions of yen Thousands of U.S. dollars
2020 2021 2021
Profit or loss ¥11,888 ¥10,857 $ 98,076
Other comprehensive income (2,843) 4,148 37,473
Total comprehensive income ¥ 9,045 ¥15,006 $135,543
Although more than 50% of the voting rights of Mitsubishi
Mahindra Agricultural Machinery Co., Ltd. are held by the Group, it
is treated as an equity-method associate in consideration of the
Group’s shareholding ratio, including preferred shares and provi-
sions of the shareholders agreement. Furthermore, although less
than 20% of voting rights of Framatome S.A.S. are held by the
Group, it is treated as an equity-method associate based on the
judgment that the Group has significant influence due primarily to
the composition of officers of Framatome S.A.S.
The Group owned more than 20% of the voting rights of Shinryo
Corporation in the fiscal year ended March 31, 2020. However,
based on the judgment that the Group does not have significant
influence over the company as a result of revisions to the share-
holders’ agreement and changes to the board composition in the
previous fiscal year, the Group did not apply the equity method
when accounting for the investment.
(2) Individually immaterial joint venturesThe carrying amount of investments in individually immaterial
joint ventures accounted for using the equity method were ¥36,379
million, and ¥29,963 million ($270,644 thousand) as of March 31,
2020 and March 31, 2021, respectively. The total amount of equity
shares on comprehensive income of the Group for the fiscal years
ended March 31, 2020 and March 31, 2021 were as follows:
Millions of yen Thousands of U.S. dollars
2020 2021 2021
Profit or loss ¥1,009 ¥4,300 $38,840
Other comprehensive income 3,760 1,658 14,979
Total comprehensive income ¥4,770 ¥5,958 $53,816
18. LEASES
Information about leases to which the Group is a lessee are as follows:
(1) Right-of-use assetsCarrying amount, depreciation expense and increased amount
Millions of yen
Buildings and structures
Machinery and vehicles
Tools, furniture and fixtures
Land Others Total
As of April 1, 2019 ¥ 62,801 ¥23,647 ¥1,719 ¥ 2,154 ¥ 12 ¥ 90,335
Increased amount of right-of-use assets 10,819 17,562 639 — 64 29,086
Depreciation (12,045) (6,369) (499) (48) (9) (18,973)
Others*1 (2) (2,149) (547) (1,551) — (4,247)
As of March 31, 2020 ¥ 61,573 ¥32,691 ¥1,312 ¥ 555 ¥ 67 ¥ 96,201
Increased amount of right-of-use assets 9,253 3,243 1,318 504 17 14,337
Depreciation (10,424) (6,904) (556) (336) (20) (18,242)
Others*1 1,283 (1,996) 26 1,711 — 1,025
As of March 31, 2021 ¥ 61,685 ¥27,035 ¥2,101 ¥ 2,435 ¥ 64 ¥ 93,321
MHI REPORT 2021 FINANCIAL SECTION41
NOTES TO CONSOLIDATED FINANCIAL STATEMENTS

Thousand of U.S. dollars
Buildings and structures
Machinery and vehicles
Tools, furniture and fixtures
Land Others Total
As of March 31, 2020 $556,164 $295,284 $11,850 $ 5,013 $ 605 $ 868,945
Increased amount of right-of-use assets 83,578 29,292 11,904 4,552 153 129,500
Depreciation (94,155) (62,361) (5,022) (3,034) (180) (164,772)
Others*1 11,588 (18,029) 234 15,454 — 9,258
As of March 31, 2021 $557,176 $244,196 $18,977 $21,994 $ 578 $ 842,931
*1. “Others” includes decrease due to cancellation, impairment losses, foreign currency translation gains and losses and others.
(2) Lease liabilitiesFor details of the repayment schedule for lease liabilities, refer to Note 35 “Risk Management (2) Liquidity risk management”.
(3) Amount recognized in profit and loss
Millions of yen Thousands of U.S. dollars
2020 2021 2021
Interest expenses on lease liabilities ¥ 2,409 ¥ 2,165 $ 19,555
Expenses relating to short-term leases 6,703 6,575 59,389
Expenses relating to leases of low-value assets 15,391 18,209 164,474
Lease income from subleasing right-of-use assets ¥ 4,721 ¥ 6,527 $ 58,955
Expense related to variable lease payments not included in the measurement of lease liabilities are immaterial.
(4) Cash outflow related to leases
Millions of yen Thousands of U.S. dollars
2020 2021 2021
Cash outflow related to leases ¥47,186 ¥50,250 $453,888
(5) Nature of leasing activitiesPrimary leasing activities of the Group include leasing of buildings
as offices or plants and leasing of machinery as production facili-
ties for business purposes. The term of lease contracts for build-
ings ranges from 10 to 20 years, while the term of lease contracts
for machinery ranges from 5 to 10 years. Some lease contracts
include a lease term extension option exercisable upon the expira-
tion of the contact.
In measuring lease liabilities, the Group assesses whether it is
reasonably certain to exercise the extension option on the com-
mencement date of the lease and reflect the results of the assess-
ment in the measurement. The Group also assesses whether it is
reasonably certain to exercise the option upon the occurrence of
either a significant event or a significant change in circumstances
that is within its control.
(6) Sale and leasebackThe Group has entered into sale and leaseback transactions on
part of office buildings (buildings), production facilities for busi-
ness purposes (machinery) and other assets with the aim of
increasing the liquidity of these assets, avoiding the risk of uncer-
tainties in the future, and enhancing its access to cash funds.
The lease term of all such contracts is more or less 10 years,
but some of them are attached with an extension option and/or a
purchase option exercisable upon the expiration of the term of the
contract. There are no significant supplementary provisions, such
as restrictions imposed under the lease contracts.
Sale and leaseback transactions increased cash flows by
¥3,014 million for the fiscal year ended March 31, 2020, however,
there was no new transaction for the fiscal year ended March 31,
2021. The profit or loss arising from these sale and leaseback
transactions is immaterial.
Lease information for which the Group is the lessor is not material
and is therefore omitted.
MITSUBISHI HEAVY INDUSTRIES GROUP 42

19. PROVISIONS
Changes in provisions are as follows:
For the fiscal year ended March 31, 2021
Millions of yen
Loss on construction contracts
Product and construction warranties
Levies Other Total
Balance as of April 1, 2020 ¥ 99,624 ¥104,711 ¥ 11,594 ¥ 41,739 ¥257,669
Increase 51,283 31,986 11,437 27,393 122,100
Decrease (utilization) (49,965) (24,931) (11,522) (12,550) (98,969)
Decrease (reversal) (7,301) (15,205) (72) (9,802) (32,382)
Other (Exchange rate differences, etc.) (3,802) 1,317 (161) 12,590 9,943
Balance as of March 31, 2021 ¥ 89,838 ¥ 97,878 ¥ 11,275 ¥ 59,370 ¥258,361
Current liabilities 89,838 81,817 11,275 24,945 207,876
Non-current liabilities — 16,060 — 34,424 50,485
Total ¥ 89,838 ¥ 97,878 ¥ 11,275 ¥ 59,370 ¥258,361
For the fiscal year ended March 31, 2021
Thousands of U.S. dollars
Loss on construction contracts
Product and construction warranties
Levies Other Total
Balance as of April 1, 2020 $ 899,864 $ 945,813 $ 104,724 $ 377,012 $2,327,422
Increase 463,219 288,916 103,305 247,430 1,102,881
Decrease (utilization) (451,314) (225,191) (104,073) (113,359) (893,948)
Decrease (reversal) (65,947) (137,340) (650) (88,537) (292,493)
Other (Exchange rate differences, etc.) (34,341) 11,895 (1,454) 113,720 89,811
Balance as of March 31, 2021 $ 811,471 $ 884,093 $ 101,842 $ 536,265 $2,333,673
Current liabilities 811,471 739,020 101,842 225,318 1,877,662
Non-current liabilities — 145,063 — 310,938 456,011
Total $ 811,471 $ 884,093 $ 101,842 $ 536,265 $2,333,673
(1) Loss on construction contractsIn order to provide for losses from construction contracts for
which the Group has not completed satisfying its performance
obligation,the Group recognizes a provision for losses that are
expected in the subsequent fiscal years for uncompleted con-
struction contracts, if it is probable that a loss has been incurred
and a reliable estimate can be made of the amount of the loss, at
the end of each reporting period. The timing of cash outflows
depends on the progress of the project in the future.
(2) Product and construction warrantiesTo provide for expenditures incurred after the delivery of con-
struction, for example product warranty expenses, the Group
estimates and recognizes warranty expenses expected to be
incurred in the future based primarily on past experience. The
provision is utilized as customers make warranty claim.
(3) LeviesThe Group recognizes provisions for the expected amount of levies
imposed by governments for the Group to engage in business. The
levies are expected to be paid within one year from the end of the
reporting period.
(4) OtherOther provisions include provision for business structure improve-
ment, provision assumed by acquisition of the CRJ program and
asset retirement obligations. Details of acquisition of the CRJ
program and assumption of guarantees which this provision is
recognized are described in Note.36 “Business combinations.”
Among changes of other provisions for the fiscal year ended
March 31, 2021, change of provision for business structure
improvement was ¥13,149 million ($118,769 thousand), which
included provision for the slowdown of SpaceJet development
activities and other business restructuring.
As the Group is involved in nuclear businesses, it owns facili-
ties for processing the radioactive waste of nuclear fuel and for
carrying out research and development on the safety of nuclear
fission reactor materials. However, the asset retirement obliga-
tions associated with the disposal and demolition of such facilities
are not recognized because costs are not reasonably estimable at
present since technology applied to demolition processes as well
as laws and ordinances, which regulate such process methods
have not been developed yet.
MHI REPORT 2021 FINANCIAL SECTION43
NOTES TO CONSOLIDATED FINANCIAL STATEMENTS
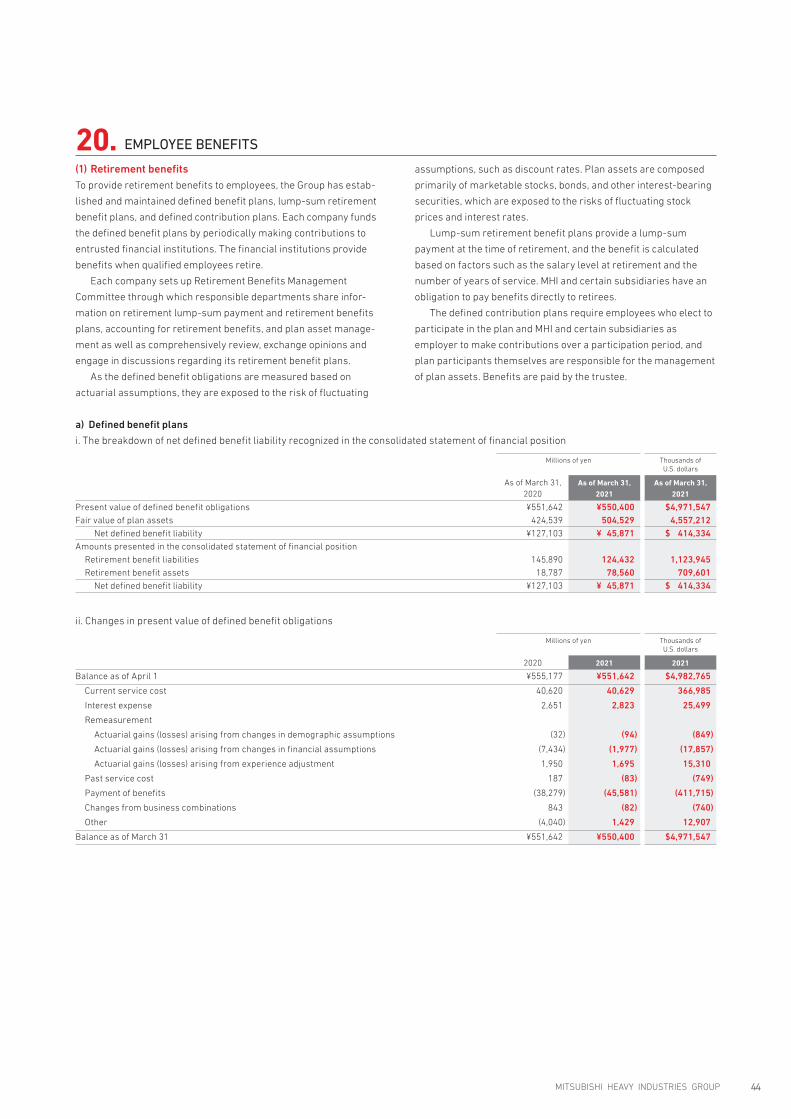
20. EMPLOYEE BENEFITS
(1) Retirement benefitsTo provide retirement benefits to employees, the Group has estab-
lished and maintained defined benefit plans, lump-sum retirement
benefit plans, and defined contribution plans. Each company funds
the defined benefit plans by periodically making contributions to
entrusted financial institutions. The financial institutions provide
benefits when qualified employees retire.
Each company sets up Retirement Benefits Management
Committee through which responsible departments share infor-
mation on retirement lump-sum payment and retirement benefits
plans, accounting for retirement benefits, and plan asset manage-
ment as well as comprehensively review, exchange opinions and
engage in discussions regarding its retirement benefit plans.
As the defined benefit obligations are measured based on
actuarial assumptions, they are exposed to the risk of fluctuating
assumptions, such as discount rates. Plan assets are composed
primarily of marketable stocks, bonds, and other interest-bearing
securities, which are exposed to the risks of fluctuating stock
prices and interest rates.
Lump-sum retirement benefit plans provide a lump-sum
payment at the time of retirement, and the benefit is calculated
based on factors such as the salary level at retirement and the
number of years of service. MHI and certain subsidiaries have an
obligation to pay benefits directly to retirees.
The defined contribution plans require employees who elect to
participate in the plan and MHI and certain subsidiaries as
employer to make contributions over a participation period, and
plan participants themselves are responsible for the management
of plan assets. Benefits are paid by the trustee.
a) Defined benefit plans
i. The breakdown of net defined benefit liability recognized in the consolidated statement of financial position
Millions of yen Thousands of U.S. dollars
As of March 31, 2020
As of March 31, 2021
As of March 31, 2021
Present value of defined benefit obligations ¥551,642 ¥550,400 $4,971,547Fair value of plan assets 424,539 504,529 4,557,212
Net defined benefit liability ¥127,103 ¥ 45,871 $ 414,334Amounts presented in the consolidated statement of financial position
Retirement benefit liabilities 145,890 124,432 1,123,945Retirement benefit assets 18,787 78,560 709,601
Net defined benefit liability ¥127,103 ¥ 45,871 $ 414,334
ii. Changes in present value of defined benefit obligations
Millions of yen Thousands of U.S. dollars
2020 2021 2021
Balance as of April 1 ¥555,177 ¥551,642 $4,982,765
Current service cost 40,620 40,629 366,985
Interest expense 2,651 2,823 25,499
Remeasurement
Actuarial gains (losses) arising from changes in demographic assumptions (32) (94) (849)
Actuarial gains (losses) arising from changes in financial assumptions (7,434) (1,977) (17,857)
Actuarial gains (losses) arising from experience adjustment 1,950 1,695 15,310
Past service cost 187 (83) (749)
Payment of benefits (38,279) (45,581) (411,715)
Changes from business combinations 843 (82) (740)
Other (4,040) 1,429 12,907
Balance as of March 31 ¥551,642 ¥550,400 $4,971,547
MITSUBISHI HEAVY INDUSTRIES GROUP 44

iii. Changes in fair value of plan assets
Millions of yen Thousands of U.S. dollars
2020 2021 2021
Balance as of April 1 ¥465,156 ¥424,539 $3,834,694Interest income 2,140 2,150 19,420Remeasurement
Return on plan assets (excluding amounts included in net interest on the net defined benefit asset) (39,697) 80,595 727,983Contributions to the plan (by the employer) 23,921 23,510 212,356Payment of benefits (26,216) (27,554) (248,884)
Changes from business combinations 0 (115) (1,038)Other (764) 1,404 12,681
Balance as of March 31 ¥424,539 ¥504,529 $4,557,212
iv. The breakdown of fair value of plan assets
As of March 31, 2020
Millions of yen
With quoted market price in an active market
With no quoted market price in an active market
Total
Shares issued by Japanese companies ¥170,052 ¥ — ¥170,052
Shares issued by foreign companies 27,331 2,768 30,100
Bonds issued by Japanese companies 37,311 — 37,311
Bonds issued by foreign companies 54,448 — 54,448
Cash and deposits 41,173 — 41,173
General accounts for life insurance — 17,087 17,087
Other — 74,366 74,366
Total ¥330,316 ¥94,222 ¥424,539
As of March 31, 2021
Millions of yen
With quoted market price in an active market
With no quoted market price in an active market
Total
Shares issued by Japanese companies ¥213,755 ¥ — ¥213,755
Shares issued by foreign companies 38,361 12,494 50,855
Bonds issued by Japanese companies 20,527 — 20,527
Bonds issued by foreign companies 52,368 36,047 88,416
Cash and deposits 39,572 — 39,572
General accounts for life insurance — 16,451 16,451
Other — 74,949 74,949
Total ¥364,586 ¥139,943 ¥504,529
As of March 31, 2021
Thousands of U.S. dollars
With quoted market price in an active market
With no quoted market price in an active market
Total
Shares issued by Japanese companies $1,930,765 $ — $1,930,765
Shares issued by foreign companies 346,499 112,853 459,353
Bonds issued by Japanese companies 185,412 — 185,412
Bonds issued by foreign companies 473,019 325,598 798,627
Cash and deposits 357,438 — 357,438
General accounts for life insurance — 148,595 148,595
Other — 676,984 676,984
Total $3,293,162 $1,264,050 $4,557,212
The total amounts of plan assets include retirement benefit trust
set up for the defined benefit plans and the lump-sum retirement
benefit plan.
The amounts were ¥152,414 million, and ¥205,304 million
($1,854,430 thousand) as of March 31, 2020 and March 31,
2021, respectively.
The fund is managed to hedge its exposure to interest by using
interest rate swap.
Further, 30% of exposures to interest rate risk against defined
benefit obligations are covered by using debt instruments
combined with interest rate swaps. In the fiscal years ended
March 31, 2020 and 2021, The pension fund was managed based
on said policies.
All exposures to foreign exchange risks are hedged using
forward exchange contracts.
MHI REPORT 2021 FINANCIAL SECTION45
NOTES TO CONSOLIDATED FINANCIAL STATEMENTS

v. The significant actuarial assumptions used in determining present value of defined benefit obligations
As of March 31, 2020
As of March 31, 2021
Discount rate Mainly 0.5% Mainly 0.5%
As to the significant actuarial assumptions, the result of the sensitivity analysis (the impact on the defined benefit obligations) based on rea-
sonably possible changes is as follow:
Millions of yen Thousands of U.S. dollars
As of March 31, 2020
As of March 31, 2021
As of March 31, 2021
Increase Decrease Increase Decrease Increase Decrease
Impact in the event of 0.5 percentage point change in the discount rate ¥(30,330) ¥32,297 ¥(29,950) ¥31,880 $(270,526) $287,959
The trial calculation is approximated by changing only the
discount rate, without varying other actuarial assumptions.
Since this calculation does not take into account potential
variation to other actuarial assumptions, the actual calculation
may be affected by fluctuations in other variables.
vi. Plan assets management policy
The Group ensures it is able to provide benefits in the form of
pensions and lump-sum payments. To this end, a target asset
allocation is established to ensure that necessary returns are
received stably over the long term and the Group makes diversi-
fied investments in a broad range of assets, including bonds and
stocks, within permissible risk parameters. The Group also peri-
odically assess the investment status and financial condition of
the plan assets and the asset management environment and
revise the asset management if necessary. For contributions to
the pension funds, the contribution amount is reviewed periodi-
cally by, for example, recalculating the amount once every three
years to balance the future financial position of the pension plan in
compliance with relevant laws and regulations.
The Group makes contributions based on an appropriate actu-
arial calculation to fund the benefits. The amount of contributions
expected to be paid to the defined benefit plans for the fiscal year
ended March 31, 2022 is ¥23,199 million ($209,547 thousand).
vii. The maturity analysis of defined benefit obligations is as follows:
As of March 31, 2020
As of March 31, 2021
Weighted average duration (year) 11.63 11.55
b) Defined contribution plans
Expenses for the defined contribution plans for the fiscal years
ended March 31, 2020 and March 31, 2021 were ¥9,427 million and
¥8,622 million ($77,879 thousand), respectively.
(2) Employee benefits expensesThe aggregated amounts of employee benefit expenses recog-
nized for the fiscal years ended March 31, 2020 and March 31,
2021 were ¥809,971 million and ¥790,475 million ($7,140,050
thousand), respectively.
21. OTHER ASSETS AND LIABILITIES
(1) The breakdown of other assets
Millions of yen Thousands of U.S. dollars
As of March 31, 2020
As of March 31, 2021
As of March 31, 2021
Advances to suppliers and prepaid expenses ¥101,796 ¥ 86,608 $ 782,296Retirement benefit assets 18,787 78,560 709,601Consumption tax receivables (Incl. VAT receivables) 44,568 44,454 401,535Income tax receivables 4,392 42,063 379,938Others 139,543 141,634 1,279,324
Total ¥309,089 ¥393,321 $3,552,714
Current assets 206,261 230,955 2,086,125Non-current assets 102,827 162,365 1,466,579
Total ¥309,089 ¥393,321 $3,552,714
MITSUBISHI HEAVY INDUSTRIES GROUP 46

(2) The breakdown of other liabilitiesMillions of yen Thousands of
U.S. dollars
As of March 31, 2020
As of March 31, 2021
As of March 31, 2021
Accrued expenses ¥ 98,519 ¥121,795 $1,100,126Liabilities in respect of government grants 64,177 42,853 387,074Accrued consumption taxes (Incl. VAT payables) 12,877 15,056 135,994Others 49,800 58,446 527,919
Total ¥225,375 ¥238,152 $2,151,133
Current liabilities 151,657 184,453 1,666,091Non-current liabilities 73,718 53,699 485,042Total ¥225,375 ¥238,152 $2,151,133
22. EQUITY AND OTHER EQUITY ITEMS
(1) The number of shares authorized, shares issued and treasury shares
Shares
2020 2021
The number of shares authorized*:
Common shares 600,000,000 600,000,000
The number of shares issued*:
at the beginning of the year 337,364,781 337,364,781
Changes during the year — —
at the end of the year 337,364,781 337,364,781
* Both the shares authorized and the shares issued are no-par value common stock. All of the shares issued are paid in full. The number of treasury shares included in the shares issued were 1,523,291 shares, and 1,218,459 shares as of March 31, 2020 and March 31, 2021, respectively.
The number of MHI’s common shares held by the Stock Grant ESOP Trust, and the Officer Remuneration BIP Trust I&II were 869,823 shares, and 684,587 shares as of March 31, 2020 and March 31, 2021, respectively. There was no change in the number of MHI’s common shares held by its associates, which was 4,328 shares as of March 31, 2020 and March 31, 2021, respectively.
(2) Details and purpose of surplus accounts included in equitya) Capital surplus
The capital surplus account is composed of amounts arising
from equity transactions that are not included in share capital. A
major component of the capital surplus account is the legal
capital reserve.
The Companies Act of Japan (“the Companies Act”) requires
that at least half of paid-in capital be appropriated as share capital
and the rest be appropriated as legal capital reserve within capital
surplus. In addition, under the Companies Act, legal capital
reserve can be transferred to share capital upon approval at the
General Meeting of Shareholders.
b) Retained earnings
The retained earnings account is composed of legal retained
earnings and other retained earnings.
The Companies Act requires that 10 percent of retained earn-
ings appropriated for dividends be reserved either as legal capital
surplus or legal retained earnings until the total amount of legal
capital surplus or legal retained earnings reaches 25 percent of
the amount of share capital.
Upon fulfilling certain requirements, such as a resolution at the
General Meeting of Shareholders, the amount of legal retained
earnings may be reduced, and part or all of the reduction may be
transferred to share capital.
While the amount available for distribution allowed by the
Companies Act is calculated based on the amount of retained
earnings recognized in the Company’s accounting book prepared
in accordance with generally accepted accounting principles in
Japan, legal retained earnings are excluded from the calculation of
the amount available for distribution.
MHI REPORT 2021 FINANCIAL SECTION47
NOTES TO CONSOLIDATED FINANCIAL STATEMENTS

23. DIVIDENDS
The total dividends for each fiscal year are as follows.
(1) For the fiscal year ended March 31, 2020 (From April 1, 2019 to March 31, 2020)a) Dividends paid
Resolution Type of sharesTotal cash
dividends paid(Millions of yen)
Total cash dividends paid(Thousands of U.S. dollars)
Cash dividends per share
(Yen)
Cash dividends per share
(U.S. dollars)Record date Effective date Source of dividends
June 27, 2019
Annual General Meeting of Shareholders
Common Stock ¥21,876 $201,010 ¥65 $0.5972 March 31, 2019 June 28, 2019Retained earnings
October 31, 2019
Board of Directors Common Stock ¥25,246 $231,976 ¥75 $0.6891September 30,
2019December 4,
2019Retained earnings
*1. Total dividends paid in accordance with the resolution passed at the Annual General Meeting of Shareholders held on June 27, 2019, include ¥55 million ($505 thou-sand) of dividends for the stocks held by the Stock Grant ESOP (Employee Stock Ownership Plan) Trust and Officer Remuneration BIP (Board Incentive Plan) Trust I&II.
*2. Total dividends paid in accordance with the resolution passed by the Board of Directors meeting held on October 31, 2019, include ¥51 million ($468 thousand) of divi-dends for the stocks held by the Stock Grant ESOP (Employee Stock Ownership Plan) Trust and Officer Remuneration BIP (Board Incentive Plan) Trust I&II.
b) Dividends which the record date is within the fiscal year ended March 31, 2020, but take effect in the fiscal year ending March 31, 2021
Resolution Type of sharesTotal cash
dividends paid(Millions of yen)
Total cash dividends paid(Thousands of U.S. dollars)
Cash dividends per share
(Yen)
Cash dividends per share
(U.S. dollars)Record date Effective date Source of dividends
June 26, 2020
Annual General Meeting of Shareholders
Common Stock ¥25,253 $232,040 ¥75 $0.6891 March 31, 2020 June 29, 2020Retained earnings
*1. Total dividends paid in accordance with the resolution passed at the Annual General Meeting of Shareholders held on June 26, 2020, include ¥65 million ($597 thou-sand) of dividends for the stocks held by the Stock Grant ESOP (Employee Stock Ownership Plan) Trust and Officer Remuneration BIP (Board Incentive Plan) Trust I&II.
(2) For the fiscal year ended March 31, 2021 (From April 1, 2020 to March 31, 2021)a) Dividends paid
Resolution Type of sharesTotal cash
dividends paid(Millions of yen)
Total cash dividends paid(Thousands of U.S. dollars)
Cash dividends per share
(Yen)
Cash dividends per share
(U.S. dollars)Record date Effective date Source of dividends
June 26, 2020
Annual General Meeting of Shareholders
Common Stock ¥25,253 $228,100 ¥75 $0.6774 March 31, 2020 June 29, 2020Retained earnings
*1. Total dividends paid in accordance with the resolution passed at the Annual General Meeting of Shareholders held on June 26, 2020, include ¥65 million ($587 thou-sand) of dividends for the stocks held by the Stock Grant ESOP (Employee Stock Ownership Plan) Trust and Officer Remuneration BIP (Board Incentive Plan) Trust I&II.
b) Dividends which the record date is within the fiscal year ended March 31, 2021, but take effect in the fiscal year ending March 31, 2022
Resolution Type of sharesTotal cash
dividends paid(Millions of yen)
Total cash dividends paid(Thousands of U.S. dollars)
Cash dividends per share
(Yen)
Cash dividends per share
(U.S. dollars)Record date Effective date Source of dividends
June 29, 2021
Annual General Meeting of Shareholders
Common Stock ¥25,262 $228,181 ¥75 $0.6774 March 31, 2021 June 30, 2021Retained earnings
*1. Total dividends paid in accordance with the resolution passed at the Annual General Meeting of Shareholders held on June 29, 2021, include ¥51 million ($460 thou-sand) of dividends for the stocks held by the Stock Grant ESOP (Employee Stock Ownership Plan) Trust and Officer Remuneration BIP (Board Incentive Plan) Trust I&II.
MITSUBISHI HEAVY INDUSTRIES GROUP 48

24. REVENUE
(1) Disaggregation of revenueThe Group is composed of four business domains and segments:
Energy Systems; Plants & Infrastructure Systems; Logistics,
Thermal & Drive Systems; and Aircraft, Defense & Space. The
operating results of these business domains and segments are
regularly reviewed by the Board of Directors of the Company for
making decisions about resource allocation and assessing their
performance. Therefore, turnover recognized from these busi-
nesses is presented as revenue.
The Group further disaggregates revenue from contracts with
customers for Aircraft, Defense & Space business domain into
“commercial aircraft” and “defense and space equipment” based
on the type of markets or customers.
For the fiscal year ended March 31, 2020 (From April 1, 2019 to March 31, 2020)
Millions of yen
Reporting segments
TotalAircraft, Defense & Space
Adjustments*1
Energy SystemsPlants &
Infrastructure Systems
Logistics, Thermal & Drive
Systems
Commercial aircraft
Defense and space
equipmentSubtotal Total
Revenue from external customers
¥1,579,397 ¥750,556 ¥983,918 ¥230,367 ¥473,495 ¥703,862 ¥4,017,736 ¥23,640 ¥4,041,376
*1. “Adjustments” includes income from utilization and disposal of assets, which are not included in any of the reporting segments.
For the fiscal year ended March 31, 2021 (From April 1, 2020 to March 31, 2021)
Millions of yen
Reporting segments
TotalAircraft, Defense & Space
Adjustments*1
Energy SystemsPlants &
Infrastructure Systems
Logistics, Thermal & Drive
Systems
Commercial aircraft
Defense and space
equipmentSubtotal Total
Revenue from external customers
¥1,533,380 ¥596,153 ¥855,449 ¥177,415 ¥523,672 ¥701,087 ¥3,686,071 ¥13,875 ¥3,699,946
*1. “Adjustments” includes income from utilization and disposal of assets, which are not included in any of the reporting segments.
For the fiscal year ended March 31, 2021 (From April 1, 2020 to March 31, 2021)
Thousands of U.S. dollars
Reporting segments
TotalAircraft, Defense & Space
Adjustments*1
Energy SystemsPlants &
Infrastructure Systems
Logistics, Thermal & Drive
Systems
Commercial aircraft
Defense and space
equipmentSubtotal Total
Revenue from external customers
$13,850,420 $5,384,816 $7,726,935 $1,602,520 $4,730,123 $6,332,643 $33,294,833 $125,327 $33,420,160
*1. “Adjustments” includes income from utilization and disposal of assets, which are not included in any of the reporting segments.
The Group is engaged in the sales of products, performance of con-
struction works and rendering of services in Energy Systems, Plants
& Infrastructure Systems, Logistics, Thermal & Drive Systems and
Aircraft, Defense & Space business domains and segments.
Of these, Energy Systems, Plants & Infrastructure Systems, and
Defense and space equipment businesses are engaged in construc-
tion work in which performance obligations are satisfied over a long
period exceeding one year. The revenue of these three businesses is
set forth above. These amounts include revenue recognized over
time based on the progress towards completion and determining
the total transaction price for each construction contract.
• Sales of products
The Group determines that performance obligations have been
satisfied when customers obtain control of the products. Hence,
revenue from sales of products is usually recognized upon the
delivery of goods.
• Performance of construction and rendering of services
Since the control of goods or services promised is being trans-
ferred to customers over the contracted period as per the con-
tract, the Group recognizes revenue from performance of
construction and rendering of services over time based on the
progress towards complete satisfaction of a performance obli-
gation. The progress is mainly measured by specifying the satis-
faction of performance obligation. Measurements are mainly
based on the ratio of the estimated costs incurred to satisfy the
performance obligation over a certain period, against the esti-
mated total costs to fully satisfy the contractual obligation.
The estimated total revenue and costs are subject to change
due to the factors set out below, among others, which could arise
from contracts with customers and suppliers. There were cer-
tain construction contracts which involved significant manage-
ment judgment.
MHI REPORT 2021 FINANCIAL SECTION49
NOTES TO CONSOLIDATED FINANCIAL STATEMENTS

(a) Factors that may cause changes in the estimated total revenue
• Claims for damage or other requests by customers arising from
delivery delays, underperformance of the product and other
reasons
(b) Factors that may cause changes in the estimated total costs
• Changes in product specifications
• Responses to process delays
• Fluctuations of procurement costs such as materials and parts
• Responses to underperformance
• Events that were not considered in the planning of construction
The consideration of a transaction is received based on the
progress for each performance obligation satisfied over time,
such as a milestone in the case of a construction contract. The
consideration for the sale of goods or rendering of services is
received within one year after the performance obligation is
satisfied. In either case, the contract does not include a signifi-
cant financing component. In addition, within consideration from
contracts with customers, no significant amounts have been
excluded from the transaction price.
Further, the Group provides warranties assuring that a product
satisfies specifications as provided in the contract. However, the
Group does not identify this warranty as a separate performance
obligation because it does not provide a distinct service. For cer-
tain products and construction contracts, under which warranties
on performance and delivery guarantees are provided, revenue is
reduced to the extent a refund liability to customers is deemed to
be incurred, as a result of unsatisfied obligations.
(2) The breakdown of revenue by geographical marketFor the breakdown of revenue by geographical market, refer to Note 4. “Operating Segment.”
(3) Contract balances
Millions of yen Thousands of U.S. dollars
As of March 31, 2020
As of March 31, 2021
As of March 31, 2021
Receivables from contracts with customers ¥559,170 ¥597,633 $5,398,184Contract assets 576,061 578,936 5,229,301Contract liabilities ¥835,465 ¥731,814 $6,610,188
Significant changes in contract assets and liabilities
Changes to contract assets mainly occurred as a result of the
recognition of revenue (leading to increases in contract assets)
and transfers to trade receivables (leading to decreases in con-
tract assets).
Changes to contract liabilities mainly occurred as a result of
advance payments from customers (leading to increases in con-
tract liabilities) and the recognition of revenue (leading to
decreases in contract liabilities).
Of the above-mentioned decreases in contract liabilities as a
result of the recognition of revenue, amounts transferred from the
beginning balance of contract liabilities were ¥457,408 million and
¥520,473 million ($4,701,228 thousand) for the fiscal years ended
March 31, 2020 and March 31, 2021, respectively.
All revenues recognized for performance obligations satisfied
(or partially satisfied) in the previous periods are immaterial.
(4) Transaction price allocated to the remaining performance obligationsThe aggregate amount of the transaction price allocated to the remaining performance obligations as of March 31, 2021, and the balance by
reporting segment are as follows.
Aggregate balance of the transaction price allocated to the remaining performance obligations at the end of each fiscal year
Millions of yen
Reporting segments
Adjustments*1 TotalEnergy Systems
Plants & Infrastructure
Systems
Logistics, Thermal & Drive Systems
Aircraft, Defense & Space
Total
As of March 31, 2020 ¥3,432,686 ¥1,028,652 ¥29,329 ¥929,109 ¥5,419,777 ¥694 ¥5,420,471
As of March 31, 2021 ¥3,228,043 ¥ 988,357 ¥36,576 ¥892,863 ¥5,145,840 ¥259 ¥5,146,100
*1. “Adjustments” includes general services not included in any of the reporting segments.
Thousands of U.S. dollars
Reporting segments
Adjustments*1 TotalEnergy Systems
Plants & Infrastructure
Systems
Logistics, Thermal & Drive Systems
Aircraft, Defense & Space
Total
As of March 31, 2021 $29,157,646 $8,927,441 $330,376 $8,064,881 $46,480,354 $2,339 $46,482,702
*1. “Adjustments” includes general services not included in any of the reporting segments.
MITSUBISHI HEAVY INDUSTRIES GROUP 50

The transaction amounts allocated to the remaining perfor-
mance obligations in the three reporting segments, namely
Energy Systems, Plants & Infrastructure Systems and Aircraft,
Defense & Space, are mainly attributable to the individual made-
to-order products business. As such, many of such transactions
are for construction contracts that have performance obligations
to be satisfied over a long period exceeding one year. Whereas
the transaction amounts allocated to the remaining performance
obligations in the Logistics, Thermal & Drive Systems, are mainly
attributable to medium-volume production business, are mainly
related the sale of the products and rendering of the service for
which the performance obligation is completed within one year.
Remaining performance obligations for each reporting seg-
ment are expected to be satisfied and recognized as revenue
within the number of years from the end of each fiscal year as
stated below.
• Energy Systems: Within 6 years
• Plants & Infrastructure Systems: Within 4 years
• Logistics, Thermal & Drive Systems: Within 1 year
• Aircraft, Defense & Space: Within 3 years
(5) Assets recognized from the costs to obtain or fulfil contracts with customers
Millions of yen Thousands of U.S. dollars
As of March 31, 2020
As of March 31, 2021
As of March 31, 2021
Assets recognized from the costs to obtain contracts ¥ 396 ¥ 595 $ 5,374Assets recognized from the costs to fulfil contracts 54,534 46,877 423,421
Total ¥54,930 ¥47,473 $428,804
The Group recognizes assets only to the extent that it is probable
that the incremental costs of obtaining contracts and direct cost of
fulfilling contracts will be recoverable, which is included in
“Inventories” in the consolidated statement of financial position.
The majority of such assets recognized by the Group as the
incremental costs of obtaining contracts are mainly commissions
paid to trading companies used in obtaining construction con-
tracts. These assets are amortized in accordance with the trans-
ference pattern of goods or services to customers for the relevant
construction contracts.
In addition, assets recognized from the costs for expected
future contracts are mainly costs for designing mass production
drawings or making jigs dedicated for new models and products
that had been incurred prior to the conclusion of contracts with
customers. After the contracts were concluded, said assets are
amortized in accordance with the transference pattern of goods or
services to customers.
For the fiscal years ended March 31, 2020 and March 31, 2021, the
amount of amortization for the assets recognized from the con-
tract costs were ¥22,431 million and ¥15,254 million ($137,783
thousand) respectively. While the amount of impairment losses
was ¥3,215 million for the fiscal year ended March 31, 2020, there
is no relevant expense for the fiscal year ended March 31, 2021.
25. SELLING, GENERAL AND ADMINISTRATIVE EXPENSES
The breakdown of selling, general and administrative expenses is as follows:
Millions of yen Thousands of U.S. dollars
2020 2021 2021
Employee benefit expenses ¥220,413 ¥229,524 $2,073,200
Research and development expenses*1 73,666 68,383 617,676
Business development expenses 52,686 50,174 453,202
Remuneration and fees 48,283 41,758 377,183
Depreciation and amortization 37,380 33,880 306,024
Loss allowance for expected credit losses 2,014 770 6,955
Others 149,428 106,891 965,504
Total ¥583,874 ¥531,383 $4,799,774
*1. The Group recognizes research and development expenses in selling, general and administrative expenses.
MHI REPORT 2021 FINANCIAL SECTION51
NOTES TO CONSOLIDATED FINANCIAL STATEMENTS

26. OTHER INCOME AND EXPENSES
The breakdown of other income and expenses is as follows:
Millions of yen Thousands of U.S. dollars
2020 2021 2021
Other income
Gain on sales of investment securities ¥ — ¥ 83,916 $ 757,980
Gain on sale of property, plant and equipment 978 45,570 411,615
Recognition of revenue deferred in prior fiscal years — 21,238 191,834
Dividend income*1 12,096 10,664 96,323
Settlement income 47,690 — —Others 6,985 6,310 56,995
Total ¥ 67,751 ¥167,698 $1,514,750
Other expenses
Impairment losses*2 179,327 99,554 899,232
Various related losses expected in conjunction with slowdown of development of SpaceJet project — 41,109 371,321
Business structure improvement expenses 1,939 10,901 98,464
Loss on sale and retirement of property, plant and equipment, and intangible assets 7,842 6,912 62,433
Loss allowance for expected credit losses 12,068 — —
Settlement expenses 13,469 — —
Others 21,703 22,397 202,303
Total ¥236,350 ¥180,873 $1,633,754
*1. In the consolidated statement of cash flows, dividend income is included in “Others” under cash flows from operating activities. As stated in Note 7. “Other Financial Assets,” all dividend income is derived from financial assets at FVTOCI.
*2. Impairment losses include impairment on non-financial assets such as goodwill recognized in relation to the SpaceJet project, as described in Note 15. “Impairment of Non-Financial Assets.”
It also includes write-downs due to fair value remeasurement of the disposal group as held for sale related to the Plants & Infrastructure Systems domain.
27. GOVERNMENT GRANTS
Government grants received by the Group principally relate to
research and development activities.
Government grants recorded for the fiscal years ended March
31, 2020 and 2021 were ¥7,713 million and ¥35,045 million
($316,547 thousand), respectively. The main portion of these grants
is deducted from research and development expenses as incurred,
and some portion is deferred and recognized as other income.
28. FINANCE INCOME AND FINANCE COSTS
The breakdown of finance income and finance costs are as follows:
Millions of yen Thousands of U.S. dollars
2020 2021 2021
Finance income
Interest income
Financial assets measured at amortized cost ¥ 7,059 ¥ 5,387 $ 48,658
Foreign exchange gain 2,000 4,972 44,910
Others 2,556 1,317 11,895
Total ¥11,616 ¥11,677 $105,473
Finance costs
Interest expense
Financial liabilities measured at amortized cost 7,089 8,261 74,618
Lease liabilities 2,409 2,165 19,555
Others 5,240 5,976 53,978
Total ¥14,738 ¥16,404 $148,170
MITSUBISHI HEAVY INDUSTRIES GROUP 52

29. EARNINGS PER SHARE
The calculation of basic earnings per share and diluted earnings per share attributable to owners of the parent is as follows:
Millions of yen Thousands of U.S. dollars
2020 2021 2021
Profit (attributable to owners of the parent) ¥87,123 ¥40,639 $367,076
Thousands of shares
2020 2021
Weighted-average number of common shares outstanding during the period 335,876 336,073
Impact of the dilutive effect: share subscription rights 432 257
Weighted-average number of common shares outstanding during the period after impact of the dilutive effect 336,309 336,331
Yen U.S. dollars
2020 2021 2021
Earnings per share (attributable to owners of the parent)
Basic earnings per share ¥259.39 ¥120.92 $1.09
Diluted earnings per share ¥259.06 ¥120.83 $1.09
30. OTHER COMPONENTS OF EQUITY AND OTHER COMPREHENSIVE INCOME
(1) Other components of equityChanges in each item of other components of equity are as follows:
Millions of yen Thousands of U.S. dollars
2020 2021 2021
Financial assets measured at FVTOCI
Balance at the beginning of the year ¥105,782 ¥ 55,366 $ 500,099
Changes during the year (50,347) 37,648 340,059
Transfer to retained earnings (68) 6,009 54,276
Balance at the end of the year 55,366 99,024 894,444
Remeasurement of defined benefit plans
Balance at the beginning of the year ¥ — ¥ — $ —
Changes during the year (22,355) 55,677 502,908
Transfer to retained earnings 22,355 (55,677) (502,908)
Balance at the end of the year — — —
Cash flow hedges
Balance at the beginning of the year ¥ (9,760) ¥ (8,073) $ (72,920)
Changes during the year 1,687 1,928 17,414
Balance at the end of the year (8,073) (6,145) (55,505)
Hedge costs
Balance at the beginning of the year ¥ (242) ¥ (881) $ (7,957)
Changes during the year (639) 874 7,894
Balance at the end of the year (881) (7) (63)
Exchange differences on translating foreign operations
Balance at the beginning of the year ¥ 1,208 ¥ (24,277) $ (219,284)
Changes during the year (25,485) 36,798 332,381
Balance at the end of the year (24,277) 12,521 113,097
Other components of equity
Balance at the beginning of the year ¥ 96,987 ¥ 22,133 $ 199,918
Changes during the year (97,140) 132,928 1,200,686
Transfer to retained earnings 22,287 (49,668) (448,631)
Balance at the end of the year ¥ 22,133 ¥105,393 $ 951,973
MHI REPORT 2021 FINANCIAL SECTION53
NOTES TO CONSOLIDATED FINANCIAL STATEMENTS

(2) Breakdown of each item of other comprehensive income included in non-controlling interests
Millions of yen Thousands of U.S. dollars
2020 2021 2021
Financial assets measured at FVTOCI ¥ (64) ¥ 313 $ 2,827
Remeasurement of defined benefit plans (2) 231 2,086
Cash flow hedges (407) 138 1,246
Exchange differences on translating foreign operations (4,817) 4,734 42,760
Other comprehensive income ¥(5,291) ¥5,418 $48,938
(3) Other comprehensive incomeThe breakdown of each item of other comprehensive income and related impact of tax effects (including non-controlling interests) are as follows:
Millions of yen Thousands of U.S. dollars
2020 2021 2021
Items that will not be reclassified to profit (loss)
Net gain (loss) from financial assets measured at FVTOCI
Amount arising during the year ¥ (77,115) ¥ 55,161 $ 498,247
Before tax effects (77,115) 55,161 498,247
Tax effects 26,242 (17,217) (155,514)
After tax effects (50,873) 37,943 342,724
Remeasurement of defined benefit plans
Amount arising during the year ¥ (34,180) ¥ 80,484 $ 726,980
Before tax effects (34,180) 80,484 726,980
Tax effects 10,979 (24,386) (220,269)
After tax effects (23,201) 56,097 506,702
Share of other comprehensive income (loss) of entities accounted for using the equity method
Amount arising during the year ¥ (24) ¥ (163) $ (1,472)
Before tax effects (24) (163) (1,472)
Tax effects — — —
After tax effects (24) (163) (1,472)
Items that may be reclassified to profit (loss)
Cash flow hedges
Amount arising during the year ¥ (3,826) ¥ (2,033) $ (18,363)
Reclassification adjustments 987 1,689 15,256
Before tax effects (2,838) (344) (3,107)
Tax effects 1,125 72 650
After tax effects (1,713) (271) (2,447)
Hedge costs
Amount arising during the year ¥ (723) ¥ 1,453 $ 13,124
Reclassification adjustments (196) (195) (1,761)
Before tax effects (919) 1,257 11,353
Tax effects 281 (382) (3,450)
After tax effects (639) 874 7,894
Exchange differences on translating foreign operations
Amount arising during the year ¥ (30,520) ¥ 43,882 $ 396,368
Reclassification adjustments 10 (6,300) (56,905)
Before tax effects (30,510) 37,582 339,463
Tax effects 5,404 380 3,432
After tax effects (25,106) 37,962 342,895
Share of other comprehensive income (loss) of entities accounted for using the equity method
Amount arising during the year ¥ 1,365 ¥ 3,048 $ 27,531
Reclassification adjustments (423) 2,922 26,393
Before tax effects 941 5,970 53,924
Tax effects — — —
After tax effects 941 5,970 53,924
Total other comprehensive income ¥(100,616) ¥138,413 $1,250,230
MITSUBISHI HEAVY INDUSTRIES GROUP 54

31. RELATED PARTY TRANSACTIONS
(1) Transactions with affiliates and joint ventures
Millions of yen Thousands of U.S. dollars
As of March 31, 2020
As of March 31, 2021
As of March 31, 2021
Balance of receivables*1 ¥72,474 ¥85,530 $772,558Balance of payables ¥73,895 ¥60,406 $545,623
Millions of yen Thousands of U.S. dollars
2020 2021 2021
Revenue ¥294,750 ¥162,336 $1,466,317
Purchases ¥ 66,248 ¥ 63,343 $ 572,152
*1. The Group provides loans to some of its related parties. The total amounts of loans to related parties were ¥3,566 million, and ¥10,786 million ($97,425 thousand) as of March 31, 2020 and March 31, 2021, respectively. Loans to related parties were mainly provided to Japan Casting & Forging Corporation. The Group sets loss allowances for the loans as ¥363 million, and ¥7,691 million ($69,469 thousand) as of March 31, 2020 and March 31, 2021, respectively. The loans receivable and the loss allowances shown in the table above are net amounts.
(2) Remuneration for management personnelRemuneration amount for directors is as follows:
Millions of yen Thousands of U.S. dollars
2020 2021 2021
Short-term remuneration ¥479 ¥499 $4,507
Share-based remuneration 225 85 767
Total ¥705 ¥585 $5,284
Other than above, the amount of welfare expenses, which is borne by MHI when appointing directors, for the fiscal years ended March 31,
2020 and March 31, 2021 were ¥11 million and ¥12 million ($108 thousand), respectively.
MHI REPORT 2021 FINANCIAL SECTION55
NOTES TO CONSOLIDATED FINANCIAL STATEMENTS

32. MAJOR SUBSIDIARIES
The Group’s major subsidiaries are as follows:
Name of subsidiary Location
Ownership percentage of voting rights*1, 2
As of March 31, 2020
As of March 31, 2021
Energy Systems
Mitsubishi Power, Ltd.*3 Nishi-ku, Yokohama City 65.0% 100%
Mitsubishi Heavy Industries Aero Engines, Ltd. Komaki City, Aichi 100% 100%
Mitsubishi Heavy Industries Compressor Corporation Minato-ku, Tokyo 100% 100%
Mitsubishi Power Industries Co., Ltd. Naka-ku, Yokohama City100%(100%)
100%(100%)
Mitsubishi Heavy Industries Marine Machinery & Equipment Co., Ltd Nagasaki City, Nagasaki 100% 100%
Mitsubishi Power Aero LLC Connecticut, U.S.A.100%(100%)
100%(100%)
MHI Holding Denmark ApS Copenhagen, Denmark 100% 100%
Mitsubishi Power Americas, Inc. Florida, U.S.A.100%(100%)
100%(100%)
Mitsubishi Power Europe GmbH Duisburg, Germany100%(100%)
100%(100%)
Plants & Infrastructure Systems
Mitsubishi Heavy Industries Engineering, Ltd. Nishi-ku, Yokohama City 100% 100%
Mitsubishi Shipbuilding Co., Ltd. Nishi-ku, Yokohama City 100% 100%
Mitsubishi Heavy Industries Machine Tool Co., Ltd. Ritto City, Shiga 100% 100%
Mitsubishi Heavy Industries Machinery Systems, Ltd. Hyogo-ku, Kobe City 100% 100%
Mitsubishi Heavy Industries Environmental & Chemical Engineering Co., Ltd. Nishi-ku, Yokohama City 100%(100%)
100%(100%)
Mitsubishi Heavy Industries Marine Structure Co., Ltd. Nagasaki City, Nagasaki 100% 100%
Mitsubishi Heavy Industries Transportation and Construction Engineering, Ltd. Nishi-ku, Yokohama City 100%(100%)
100%(100%)
Primetals Technologies, Limited. London, U.K.100%(100%)
100%(100%)
Logistics, Thermal & Drive Systems
Mitsubishi Heavy Industries Thermal Systems, Ltd. Chiyoda-ku, Tokyo 100% 100%
Mitsubishi Heavy Industries Engine & Turbocharger, Ltd. Chuo-ku, Sagamihara City100%(100%)
100%
Mitsubishi Logisnext Co., Ltd. Nagaokakyo City, Kyoto64.6%(64.6%)
64.6%
Mitsubishi Heavy Industries Air-Conditioning and Refrigeration Corporation Minato-ku, Tokyo100%(100%)
100%(100%)
Mitsubishi Turbocharger Asia Co., Ltd. Chonburi, Thailand99.9%(99.9%)
99.9%(99.9%)
Mitsubishi Heavy Industries-Haier (Qingdao) Air-Conditioners Co., Ltd. Shandong, China55.0%(55.0%)
55.0%(55.0%)
UniCarriers Americas Corporation*4 Illinois, U.S.A.100%(100%)
100%(100%)
Mitsubishi Heavy Industries-Mahajak Air Conditioners Co., Ltd. Bangkok, Thailand81.8%(81.8%)
81.8%(81.8%)
Mitsubishi Turbocharger and Engine Europe B.V. Almere, The Netherlands100%(100%)
100%(100%)
Mitsubishi Heavy Industries Air Conditioning Europe, Ltd. Uxbridge, U.K.100%(100%)
100%(100%)
Shanghai MHI Turbocharger Co., Ltd. Shanghai, China56.2%(56.2%)
56.2%(56.2%)
Mitsubishi Turbocharger and Engine America, Inc. Illinois, U.S.A.100%(100%)
100%(100%)
Mitsubishi Logisnext Europe B.V. Almere, The Netherlands100%(100%)
100%(100%)
Mitsubishi Caterpillar Forklift America Inc.*5 Texas, U.S.A.93.1%(93.1%)
100%(100%)
Aircraft, Defense & Space
Mitsubishi Aircraft Corporation Minato-ku, Nagoya City 86.9% 86.9%
MHI RJ Aviation ULC Quebec, Canada100%(100%)
100%(100%)
MITSUBISHI HEAVY INDUSTRIES GROUP 56

Name of subsidiary Location
Ownership percentage of voting rights*1, 2
As of March 31, 2020
As of March 31, 2021
Others
MHI International Investment B.V. Almere, The Netherlands 100% 100%
Mitsubishi Heavy Industries (China) Co., Ltd. Beijing, China 100% 100%
Mitsubishi Heavy Industries Asia Pacific Pte. Ltd. Singapore 100% 100%
Mitsubishi Heavy Industries America, Inc. Texas, U.S.A. 100% 100%
Mitsubishi Heavy Industries Europe, Ltd.*6 London, U.K. 100% 100%
Mitsubishi Heavy Industries (Thailand) Ltd. Bangkok, Thailand100%(100%)
100%(100%)
Mitsubishi Heavy Industries (Shanghai) Co., Ltd. Shanghai, China100%(100%)
100%(100%)
Other subsidiaries 222 companies 223 companies
*1. The numbers in brackets in the ownership percentage of voting rights represent the percentage of indirect ownership, out of the total ownership percentage.*2. In the Group’s consolidated financial statements, no consolidated subsidiaries with material non-controlling interests have been included for the fiscal years ended
March 31, 2020 and March 31, 2021, respectively.*3. As described in Note 12. “Indemnification Asset for South African Projects,” the Group concluded settlement agreement with Hitachi, Ltd. (“Hitachi”), and acquired the
entire economic stake in Mitsubishi Hitachi Power Systems, Ltd. (“MHPS”) from Hitachi in the fiscal year ended March 31, 2020. As a result, non-controlling interests in MHPS held by Hitachi was reduced to zero.
Subsequently, transfer of MHPS shares from Hitachi to MHI has been completed, and the Group’s ownership percentage of voting rights in MHPS increased from 65% to 100% in the fiscal year ended March 31, 2021. However, as stated above, reduction of non-controlling interests held by Hitachi has been accounted for in the fiscal year ended March 31, 2020, there is no change in non-controlling interests in the current fiscal year.
In addition, MHPS changed its company name to Mitsubishi Power, Ltd. on September 1, 2020.*4. UniCarriers Americas Corporation changed its company name to Mitsubishi Logisnext Americas(Marengo)Inc. on April 1, 2021.*5. The Group acquired additional shares in Mitsubishi Caterpillar Forklift America Inc.in the fiscal year ended March 31, 2021. As a result, the Group’s ownership per-
centage of voting rights increased from 93.1% to 100%. This transaction had no material impact on non-controlling interests and other equity items. Mitsubishi Caterpillar Forklift America Inc. changed its company name to Mitsubishi Logisnext Americas (Houston) Inc. on April 1, 2021.*6. Mitsubishi Heavy Industries Europe,Ltd. changed its company name to Mitsubishi Heavy Industries EMEA, Ltd. on April 3, 2021.
33. COMMITMENTS
(1) Commitments related to the acquisition of property, plant and equipment
The amounts committed for the purchase of property, plant and
equipment where the purchase has already been committed but
has not been inspected for acceptance were ¥31,323 million and
¥68,641 million ($620,007 thousand) as of March 31, 2020 and
March 31, 2021, respectively.
(2) Commitments related to the acquisition of intangible assets
The amounts committed for the purchase of intangible assets
where the purchase has already been committed but has not been
inspected for acceptance were ¥1,119 million and ¥1,671 million
($15,093 thousand) as of March 31, 2020 and March 31, 2021,
respectively.
(3) Commitments to joint venturesThe Group is committed to making capital investments in some
joint ventures.
The amounts by which the Group may make new or additional
capital investments were ¥18,115 million and ¥7,899 million
($71,348 thousand) as of March 31, 2020 and March 31, 2021,
respectively.
34. CONTINGENT LIABILITIES
(Contingent liabilities relating to changes to the delivery schedule
of SpaceJet)
Given the destabilization of the civil aviation market, which has
been impacted by the global outbreak of COVID-19 pandemic, MHI
announced in October 2020 the slowdown of SpaceJet develop-
ment activities.
Therefore, it is difficult to predict the timing for the delivery of
the first SpaceJet, and it is possible that additional burdens will
arise depending on the results of discussions with customers and
other parties concerned, and this could impact the future financial
position and operating results.
MHI REPORT 2021 FINANCIAL SECTION57
NOTES TO CONSOLIDATED FINANCIAL STATEMENTS

35. RISK MANAGEMENT
The Group is exposed to credit risk, liquidity risk, and market risk
(foreign currency risk, interest rate risk and share price risk) in the
course of its operating activities and has established risk manage-
ment policies and frameworks to avoid or reduce these risks.
(1) Credit risk managementThe Group’s financial assets and financial guarantee contracts
that are measured at amortized cost under “Trade and other
receivables,” “Other financial assets” and “Contract assets” are
exposed to credit risk of the customers.
The Group regularly manages the due dates and balances of
receivables from each customer, and assesses their credit status.
The Group has accepted collateral with respect to specific trans-
actions with customers for credit enhancement purposes. The
Group also tries to reduce credit risk by utilizing letters of credit,
trade insurance, etc. The Group has no excessive credit risk con-
centrated on a single customer.
The credit risks related to deposits and derivative transactions
that the Group has entered into are limited because all transactions
entered into are with highly creditworthy financial institutions.
Loss allowance for expected credit loss for “Trade and other
receivables” and “Contract assets” presented in the consolidated
statement of financial position are always measured at an amount
equal to the lifetime expected credit losses (Simplified approach).
As a general rule, loss allowance for expected credit losses for
financial assets measured at amortized cost other than those noted
above are measured at the same amounts as the 12-month
expected credit losses. However, when payments have not been
made within due dates, the Group considers that there has been a
significant increase in credit risk since initial recognition, and recog-
nizes loss allowances for expected credit losses (ECL) at an amount
equal to the lifetime expected credit losses (General approach).
For financial assets with a significant increase in credit risk, if
full or partial collection of receivables is considered extremely
difficult, for example when a debtor requests a major modification
in payment conditions because of serious financial difficulties, it is
deemed to be a default. When a debtor is deemed to be in default
or when events such as the commencement of legal liquidation
proceedings due to bankruptcy of debtor take place, the Group
considers such financial assets to be credit-impaired. The Group
also directly reduces the carrying amount of financial assets when
it is evident that the amount of the financial assets cannot be
collected in the future.
The amount of ECL is measured as follows:
• Trade and other receivables and contract assets
Based on the simplified approach, receivables and contract
assets are classified according to the customers’ credit risk
characteristics. The ECL are measured by multiplying a provi-
sion rate determined by adjusting forecasts such as future
economic conditions to the rate of past credit losses calculated
based on this classification.
• Other financial assets measured at amortized cost
Based on the general approach, ECL for receivables that are not
deemed to have a significant increase in credit risk are assumed
by multiplying the total carrying amount of the financial assets
by a provision rate calculated by adjusting forecasts, such as
future economic conditions, to the rate of past credit losses for
the same kind of assets. ECL for financial assets that are
deemed to have a significant increase in credit risk and credit-
impaired financial assets are determined as the difference
between the present value of estimated future cash flows dis-
counted by the initial effective interest rate of the assets and the
gross carrying amount of the assets.
a) Balances of loss allowance for ECL for assets
Millions of yen Thousands of U.S. dollars
Measurement method of credit losses Classification As of March 31, 2020
As of March 31, 2021
As of March 31, 2021
Simplified approach — ¥1,162,857 ¥1,205,288 $10,886,893General approach Measured at an amount equal to the 12-month ECL 70,023 95,863 865,892
Measured at an amount equal to the lifetime ECL — — —Measured at an amount equal to the lifetime ECL
(credit impaired)¥ 1,752 ¥ 9,149 $ 82,639
Credit ratings of financial assets within the same classification in the table above are largely the same.
MITSUBISHI HEAVY INDUSTRIES GROUP 58
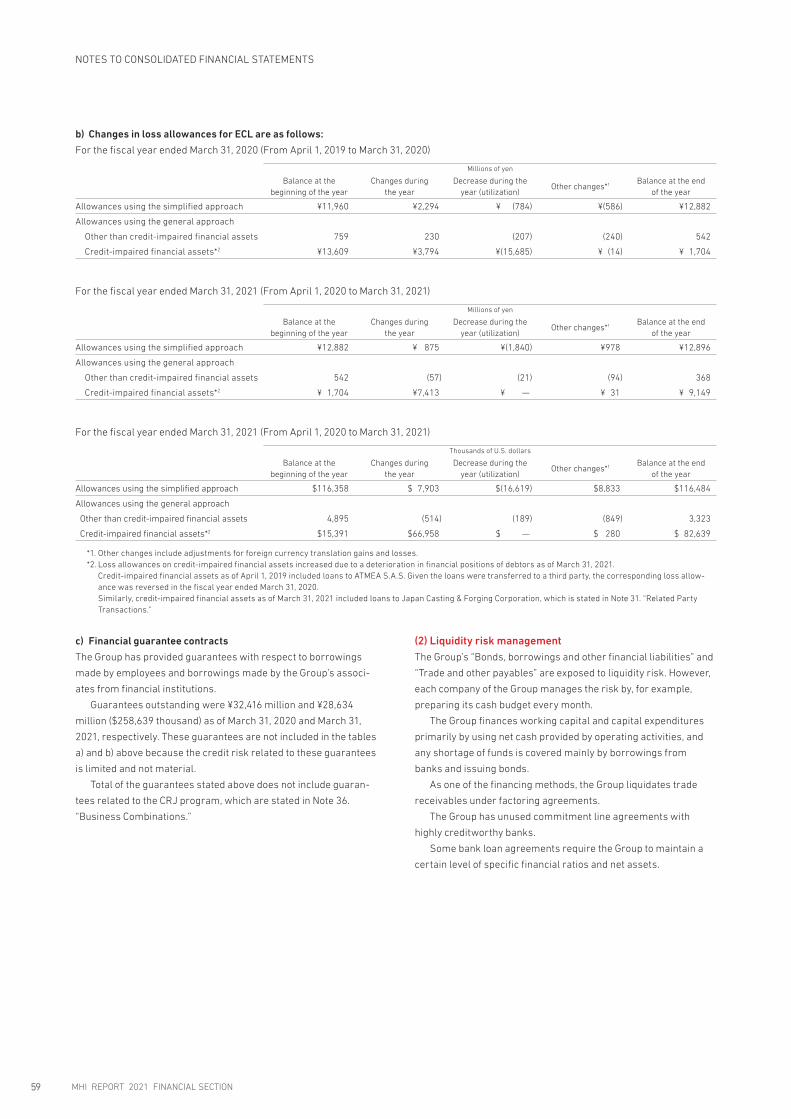
b) Changes in loss allowances for ECL are as follows:
For the fiscal year ended March 31, 2020 (From April 1, 2019 to March 31, 2020)
Millions of yen
Balance at the beginning of the year
Changes during the year
Decrease during the year (utilization)
Other changes*1 Balance at the end of the year
Allowances using the simplified approach ¥11,960 ¥2,294 ¥ (784) ¥(586) ¥12,882
Allowances using the general approach
Other than credit-impaired financial assets 759 230 (207) (240) 542
Credit-impaired financial assets*2 ¥13,609 ¥3,794 ¥(15,685) ¥ (14) ¥ 1,704
For the fiscal year ended March 31, 2021 (From April 1, 2020 to March 31, 2021)
Millions of yen
Balance at the beginning of the year
Changes during the year
Decrease during the year (utilization)
Other changes*1 Balance at the end of the year
Allowances using the simplified approach ¥12,882 ¥ 875 ¥(1,840) ¥978 ¥12,896
Allowances using the general approach
Other than credit-impaired financial assets 542 (57) (21) (94) 368
Credit-impaired financial assets*2 ¥ 1,704 ¥7,413 ¥ — ¥ 31 ¥ 9,149
For the fiscal year ended March 31, 2021 (From April 1, 2020 to March 31, 2021)
Thousands of U.S. dollars
Balance at the beginning of the year
Changes during the year
Decrease during the year (utilization)
Other changes*1 Balance at the end of the year
Allowances using the simplified approach $116,358 $ 7,903 $(16,619) $8,833 $116,484
Allowances using the general approach
Other than credit-impaired financial assets 4,895 (514) (189) (849) 3,323
Credit-impaired financial assets*2 $15,391 $66,958 $ — $ 280 $ 82,639
*1. Other changes include adjustments for foreign currency translation gains and losses.*2. Loss allowances on credit-impaired financial assets increased due to a deterioration in financial positions of debtors as of March 31, 2021. Credit-impaired financial assets as of April 1, 2019 included loans to ATMEA S.A.S. Given the loans were transferred to a third party, the corresponding loss allow-
ance was reversed in the fiscal year ended March 31, 2020. Similarly, credit-impaired financial assets as of March 31, 2021 included loans to Japan Casting & Forging Corporation, which is stated in Note 31. “Related Party
Transactions.”
c) Financial guarantee contracts
The Group has provided guarantees with respect to borrowings
made by employees and borrowings made by the Group’s associ-
ates from financial institutions.
Guarantees outstanding were ¥32,416 million and ¥28,634
million ($258,639 thousand) as of March 31, 2020 and March 31,
2021, respectively. These guarantees are not included in the tables
a) and b) above because the credit risk related to these guarantees
is limited and not material.
Total of the guarantees stated above does not include guaran-
tees related to the CRJ program, which are stated in Note 36.
“Business Combinations.”
(2) Liquidity risk managementThe Group’s “Bonds, borrowings and other financial liabilities” and
“Trade and other payables” are exposed to liquidity risk. However,
each company of the Group manages the risk by, for example,
preparing its cash budget every month.
The Group finances working capital and capital expenditures
primarily by using net cash provided by operating activities, and
any shortage of funds is covered mainly by borrowings from
banks and issuing bonds.
As one of the financing methods, the Group liquidates trade
receivables under factoring agreements.
The Group has unused commitment line agreements with
highly creditworthy banks.
Some bank loan agreements require the Group to maintain a
certain level of specific financial ratios and net assets.
MHI REPORT 2021 FINANCIAL SECTION59
NOTES TO CONSOLIDATED FINANCIAL STATEMENTS
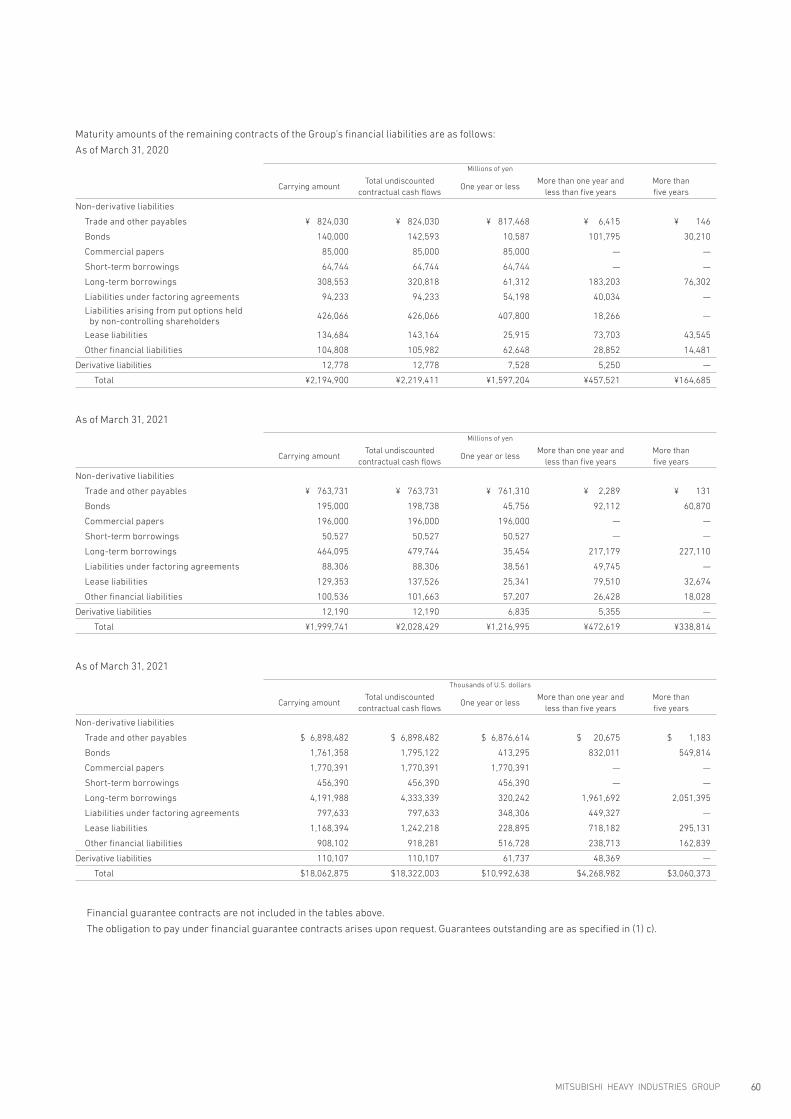
Maturity amounts of the remaining contracts of the Group’s financial liabilities are as follows:
As of March 31, 2020
Millions of yen
Carrying amountTotal undiscounted
contractual cash flowsOne year or less
More than one year and less than five years
More than five years
Non-derivative liabilities
Trade and other payables ¥ 824,030 ¥ 824,030 ¥ 817,468 ¥ 6,415 ¥ 146
Bonds 140,000 142,593 10,587 101,795 30,210
Commercial papers 85,000 85,000 85,000 — —
Short-term borrowings 64,744 64,744 64,744 — —
Long-term borrowings 308,553 320,818 61,312 183,203 76,302
Liabilities under factoring agreements 94,233 94,233 54,198 40,034 —
Liabilities arising from put options held by non-controlling shareholders
426,066 426,066 407,800 18,266 —
Lease liabilities 134,684 143,164 25,915 73,703 43,545
Other financial liabilities 104,808 105,982 62,648 28,852 14,481
Derivative liabilities 12,778 12,778 7,528 5,250 —
Total ¥2,194,900 ¥2,219,411 ¥1,597,204 ¥457,521 ¥164,685
As of March 31, 2021
Millions of yen
Carrying amountTotal undiscounted
contractual cash flowsOne year or less
More than one year and less than five years
More than five years
Non-derivative liabilities
Trade and other payables ¥ 763,731 ¥ 763,731 ¥ 761,310 ¥ 2,289 ¥ 131
Bonds 195,000 198,738 45,756 92,112 60,870
Commercial papers 196,000 196,000 196,000 — —
Short-term borrowings 50,527 50,527 50,527 — —
Long-term borrowings 464,095 479,744 35,454 217,179 227,110
Liabilities under factoring agreements 88,306 88,306 38,561 49,745 —
Lease liabilities 129,353 137,526 25,341 79,510 32,674
Other financial liabilities 100,536 101,663 57,207 26,428 18,028
Derivative liabilities 12,190 12,190 6,835 5,355 —
Total ¥1,999,741 ¥2,028,429 ¥1,216,995 ¥472,619 ¥338,814
As of March 31, 2021
Thousands of U.S. dollars
Carrying amountTotal undiscounted
contractual cash flowsOne year or less
More than one year and less than five years
More than five years
Non-derivative liabilities
Trade and other payables $ 6,898,482 $ 6,898,482 $ 6,876,614 $ 20,675 $ 1,183
Bonds 1,761,358 1,795,122 413,295 832,011 549,814
Commercial papers 1,770,391 1,770,391 1,770,391 — —
Short-term borrowings 456,390 456,390 456,390 — —
Long-term borrowings 4,191,988 4,333,339 320,242 1,961,692 2,051,395
Liabilities under factoring agreements 797,633 797,633 348,306 449,327 —
Lease liabilities 1,168,394 1,242,218 228,895 718,182 295,131
Other financial liabilities 908,102 918,281 516,728 238,713 162,839
Derivative liabilities 110,107 110,107 61,737 48,369 —
Total $18,062,875 $18,322,003 $10,992,638 $4,268,982 $3,060,373
Financial guarantee contracts are not included in the tables above.
The obligation to pay under financial guarantee contracts arises upon request. Guarantees outstanding are as specified in (1) c).
MITSUBISHI HEAVY INDUSTRIES GROUP 60
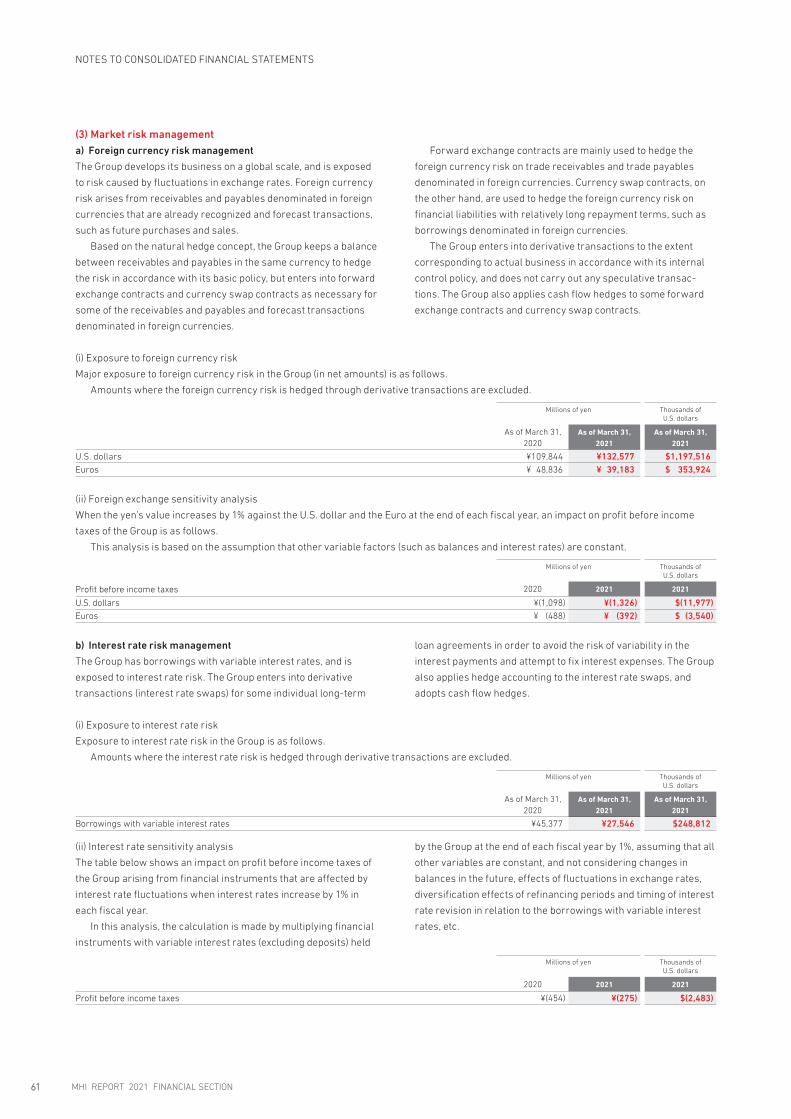
(3) Market risk managementa) Foreign currency risk management
The Group develops its business on a global scale, and is exposed
to risk caused by fluctuations in exchange rates. Foreign currency
risk arises from receivables and payables denominated in foreign
currencies that are already recognized and forecast transactions,
such as future purchases and sales.
Based on the natural hedge concept, the Group keeps a balance
between receivables and payables in the same currency to hedge
the risk in accordance with its basic policy, but enters into forward
exchange contracts and currency swap contracts as necessary for
some of the receivables and payables and forecast transactions
denominated in foreign currencies.
Forward exchange contracts are mainly used to hedge the
foreign currency risk on trade receivables and trade payables
denominated in foreign currencies. Currency swap contracts, on
the other hand, are used to hedge the foreign currency risk on
financial liabilities with relatively long repayment terms, such as
borrowings denominated in foreign currencies.
The Group enters into derivative transactions to the extent
corresponding to actual business in accordance with its internal
control policy, and does not carry out any speculative transac-
tions. The Group also applies cash flow hedges to some forward
exchange contracts and currency swap contracts.
(i) Exposure to foreign currency risk
Major exposure to foreign currency risk in the Group (in net amounts) is as follows.
Amounts where the foreign currency risk is hedged through derivative transactions are excluded.
Millions of yen Thousands of U.S. dollars
As of March 31, 2020
As of March 31, 2021
As of March 31, 2021
U.S. dollars ¥109,844 ¥132,577 $1,197,516Euros ¥ 48,836 ¥ 39,183 $ 353,924
(ii) Foreign exchange sensitivity analysis
When the yen’s value increases by 1% against the U.S. dollar and the Euro at the end of each fiscal year, an impact on profit before income
taxes of the Group is as follows.
This analysis is based on the assumption that other variable factors (such as balances and interest rates) are constant.
Millions of yen Thousands of U.S. dollars
Profit before income taxes 2020 2021 2021
U.S. dollars ¥(1,098) ¥(1,326) $(11,977)Euros ¥ (488) ¥ (392) $ (3,540)
b) Interest rate risk management
The Group has borrowings with variable interest rates, and is
exposed to interest rate risk. The Group enters into derivative
transactions (interest rate swaps) for some individual long-term
loan agreements in order to avoid the risk of variability in the
interest payments and attempt to fix interest expenses. The Group
also applies hedge accounting to the interest rate swaps, and
adopts cash flow hedges.
(i) Exposure to interest rate risk
Exposure to interest rate risk in the Group is as follows.
Amounts where the interest rate risk is hedged through derivative transactions are excluded.
Millions of yen Thousands of U.S. dollars
As of March 31, 2020
As of March 31, 2021
As of March 31, 2021
Borrowings with variable interest rates ¥45,377 ¥27,546 $248,812
(ii) Interest rate sensitivity analysis
The table below shows an impact on profit before income taxes of
the Group arising from financial instruments that are affected by
interest rate fluctuations when interest rates increase by 1% in
each fiscal year.
In this analysis, the calculation is made by multiplying financial
instruments with variable interest rates (excluding deposits) held
by the Group at the end of each fiscal year by 1%, assuming that all
other variables are constant, and not considering changes in
balances in the future, effects of fluctuations in exchange rates,
diversification effects of refinancing periods and timing of interest
rate revision in relation to the borrowings with variable interest
rates, etc.
Millions of yen Thousands of U.S. dollars
2020 2021 2021
Profit before income taxes ¥(454) ¥(275) $(2,483)
MHI REPORT 2021 FINANCIAL SECTION61
NOTES TO CONSOLIDATED FINANCIAL STATEMENTS
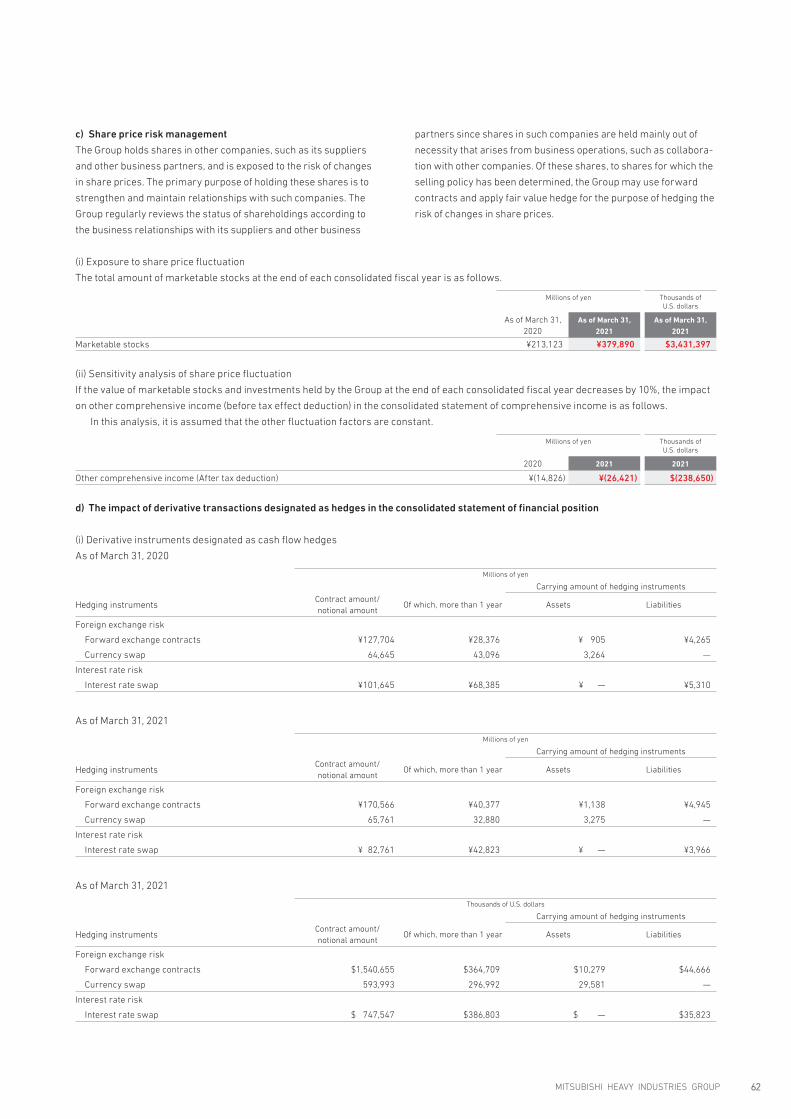
c) Share price risk management
The Group holds shares in other companies, such as its suppliers
and other business partners, and is exposed to the risk of changes
in share prices. The primary purpose of holding these shares is to
strengthen and maintain relationships with such companies. The
Group regularly reviews the status of shareholdings according to
the business relationships with its suppliers and other business
partners since shares in such companies are held mainly out of
necessity that arises from business operations, such as collabora-
tion with other companies. Of these shares, to shares for which the
selling policy has been determined, the Group may use forward
contracts and apply fair value hedge for the purpose of hedging the
risk of changes in share prices.
(i) Exposure to share price fluctuation
The total amount of marketable stocks at the end of each consolidated fiscal year is as follows.
Millions of yen Thousands of U.S. dollars
As of March 31, 2020
As of March 31, 2021
As of March 31, 2021
Marketable stocks ¥213,123 ¥379,890 $3,431,397
(ii) Sensitivity analysis of share price fluctuation
If the value of marketable stocks and investments held by the Group at the end of each consolidated fiscal year decreases by 10%, the impact
on other comprehensive income (before tax effect deduction) in the consolidated statement of comprehensive income is as follows.
In this analysis, it is assumed that the other fluctuation factors are constant.
Millions of yen Thousands of U.S. dollars
2020 2021 2021
Other comprehensive income (After tax deduction) ¥(14,826) ¥(26,421) $(238,650)
d) The impact of derivative transactions designated as hedges in the consolidated statement of financial position
(i) Derivative instruments designated as cash flow hedges
As of March 31, 2020
Millions of yen
Carrying amount of hedging instruments
Hedging instrumentsContract amount/ notional amount
Of which, more than 1 year Assets Liabilities
Foreign exchange risk
Forward exchange contracts ¥127,704 ¥28,376 ¥ 905 ¥4,265
Currency swap 64,645 43,096 3,264 —
Interest rate risk
Interest rate swap ¥101,645 ¥68,385 ¥ — ¥5,310
As of March 31, 2021
Millions of yen
Carrying amount of hedging instruments
Hedging instrumentsContract amount/ notional amount
Of which, more than 1 year Assets Liabilities
Foreign exchange risk
Forward exchange contracts ¥170,566 ¥40,377 ¥1,138 ¥4,945
Currency swap 65,761 32,880 3,275 —
Interest rate risk
Interest rate swap ¥ 82,761 ¥42,823 ¥ — ¥3,966
As of March 31, 2021
Thousands of U.S. dollars
Carrying amount of hedging instruments
Hedging instrumentsContract amount/ notional amount
Of which, more than 1 year Assets Liabilities
Foreign exchange risk
Forward exchange contracts $1,540,655 $364,709 $10,279 $44,666
Currency swap 593,993 296,992 29,581 —
Interest rate risk
Interest rate swap $ 747,547 $386,803 $ — $35,823
MITSUBISHI HEAVY INDUSTRIES GROUP 62
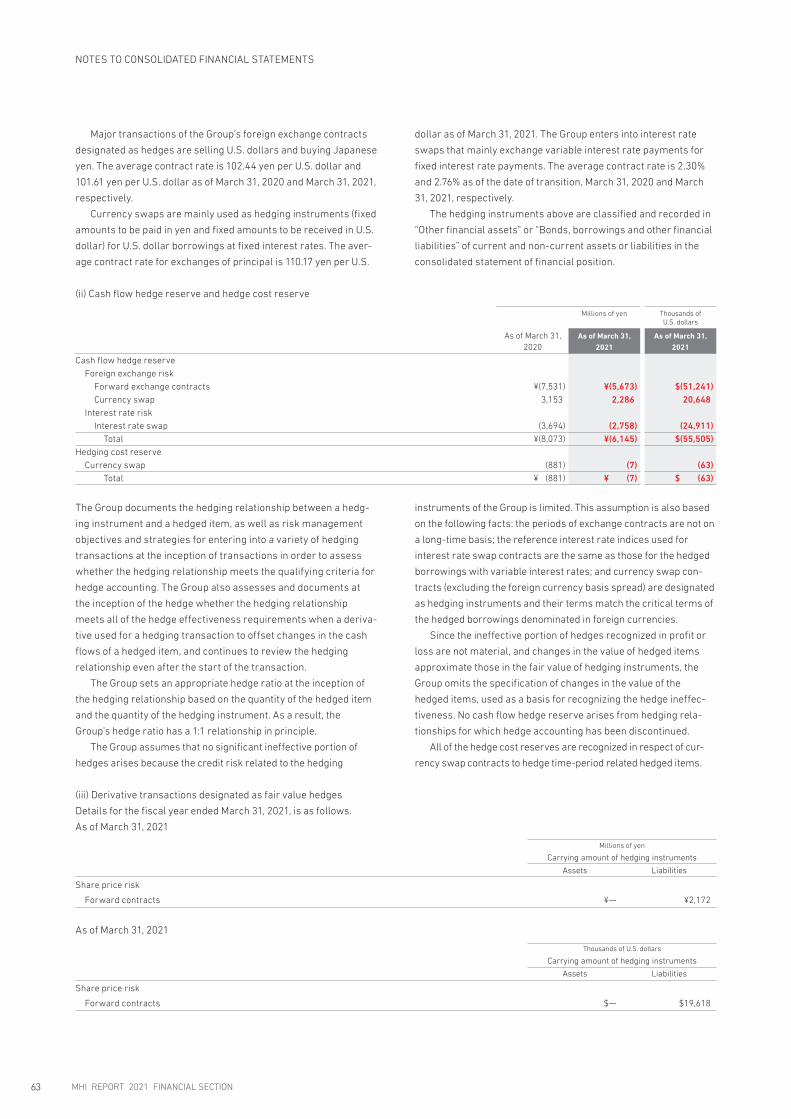
Major transactions of the Group’s foreign exchange contracts
designated as hedges are selling U.S. dollars and buying Japanese
yen. The average contract rate is 102.44 yen per U.S. dollar and
101.61 yen per U.S. dollar as of March 31, 2020 and March 31, 2021,
respectively.
Currency swaps are mainly used as hedging instruments (fixed
amounts to be paid in yen and fixed amounts to be received in U.S.
dollar) for U.S. dollar borrowings at fixed interest rates. The aver-
age contract rate for exchanges of principal is 110.17 yen per U.S.
dollar as of March 31, 2021. The Group enters into interest rate
swaps that mainly exchange variable interest rate payments for
fixed interest rate payments. The average contract rate is 2.30%
and 2.76% as of the date of transition, March 31, 2020 and March
31, 2021, respectively.
The hedging instruments above are classified and recorded in
“Other financial assets” or “Bonds, borrowings and other financial
liabilities” of current and non-current assets or liabilities in the
consolidated statement of financial position.
(ii) Cash flow hedge reserve and hedge cost reserve
Millions of yen Thousands of U.S. dollars
As of March 31, 2020
As of March 31, 2021
As of March 31, 2021
Cash flow hedge reserveForeign exchange risk
Forward exchange contracts ¥(7,531) ¥(5,673) $(51,241)Currency swap 3,153 2,286 20,648
Interest rate riskInterest rate swap (3,694) (2,758) (24,911)
Total ¥(8,073) ¥(6,145) $(55,505)Hedging cost reserve
Currency swap (881) (7) (63)Total ¥ (881) ¥ (7) $ (63)
The Group documents the hedging relationship between a hedg-
ing instrument and a hedged item, as well as risk management
objectives and strategies for entering into a variety of hedging
transactions at the inception of transactions in order to assess
whether the hedging relationship meets the qualifying criteria for
hedge accounting. The Group also assesses and documents at
the inception of the hedge whether the hedging relationship
meets all of the hedge effectiveness requirements when a deriva-
tive used for a hedging transaction to offset changes in the cash
flows of a hedged item, and continues to review the hedging
relationship even after the start of the transaction.
The Group sets an appropriate hedge ratio at the inception of
the hedging relationship based on the quantity of the hedged item
and the quantity of the hedging instrument. As a result, the
Group’s hedge ratio has a 1:1 relationship in principle.
The Group assumes that no significant ineffective portion of
hedges arises because the credit risk related to the hedging
instruments of the Group is limited. This assumption is also based
on the following facts: the periods of exchange contracts are not on
a long-time basis; the reference interest rate indices used for
interest rate swap contracts are the same as those for the hedged
borrowings with variable interest rates; and currency swap con-
tracts (excluding the foreign currency basis spread) are designated
as hedging instruments and their terms match the critical terms of
the hedged borrowings denominated in foreign currencies.
Since the ineffective portion of hedges recognized in profit or
loss are not material, and changes in the value of hedged items
approximate those in the fair value of hedging instruments, the
Group omits the specification of changes in the value of the
hedged items, used as a basis for recognizing the hedge ineffec-
tiveness. No cash flow hedge reserve arises from hedging rela-
tionships for which hedge accounting has been discontinued.
All of the hedge cost reserves are recognized in respect of cur-
rency swap contracts to hedge time-period related hedged items.
(iii) Derivative transactions designated as fair value hedges
Details for the fiscal year ended March 31, 2021, is as follows.
As of March 31, 2021
Millions of yen
Carrying amount of hedging instruments
Assets Liabilities
Share price risk
Forward contracts ¥— ¥2,172
As of March 31, 2021
Thousands of U.S. dollars
Carrying amount of hedging instruments
Assets Liabilities
Share price risk
Forward contracts $— $19,618
MHI REPORT 2021 FINANCIAL SECTION63
NOTES TO CONSOLIDATED FINANCIAL STATEMENTS

The hedge ratio for fair value hedges is 1:1 and there is no ineffective portion of hedges.
The above hedging instruments were recorded in “bonds, borrowings and other financial liabilities” on the consolidated statement of
financial position
In addition, the impact of hedged items designated as hedges on the consolidated statement of financial position is as follows:
As of March 31, 2021
Millions of yen
Hedged item Carrying amountAccumulated fair value hedge
adjustment on hedged item included in carrying amount of hedged item
Share price risk ¥12,929 ¥493
As of March 31, 2021
Thousands of U.S. dollars
Hedged item Carrying amountAccumulated fair value hedge
adjustment on hedged item included in carrying amount of hedged item
Share price risk $116,782 $4,453
The hedged item above is classified and recorded in “Other financial assets” in the consolidated statement of financial position.
e) Impact on the consolidated statement of profit or loss and the consolidated statement of comprehensive income
The impact of applying hedge accounting on the consolidated statement of profit or loss and the consolidated statement of comprehensive
income is as follows:
As of March 31, 2020
Millions of yen
Changes in the fair value of hedging instruments recognized in other
comprehensive income
Amount transferred from other components of equity to profit or loss
as a reclassification adjustment
Line item of profit or loss transferred as a reclassification adjustment
Foreign exchange risk
Forward exchange contracts ¥(3,949) ¥ 888 Finance costs
Currency swap 3,410 (719) Finance income
Interest rate risk
Interest rate swap ¥(3,287) ¥ 818 Finance costs
As of March 31, 2021
Millions of yen
Changes in the fair value of hedging instruments recognized in other
comprehensive income
Amount transferred from other components of equity to profit or loss
as a reclassification adjustment
Line item of profit or loss transferred as a reclassification adjustment
Foreign exchange risk
Forward exchange contracts ¥(4,882) ¥ 3,183 Finance costs
Currency swap 3,162 (3,151) Finance income
Interest rate risk
Interest rate swap ¥ (313) ¥ 1,657 Finance costs
As of March 31, 2021
Thousands of U.S. dollars
Changes in the fair value of hedging instruments recognized in other
comprehensive income
Amount transferred from other components of equity to profit or loss
as a reclassification adjustment
Line item of profit or loss transferred as a reclassification adjustment
Foreign exchange risk
Forward exchange contracts $(44,097) $ 28,750 Finance costs
Currency swap 28,561 (28,461) Finance income
Interest rate risk
Interest rate swap $ (2,827) $ 14,967 Finance costs
MITSUBISHI HEAVY INDUSTRIES GROUP 64
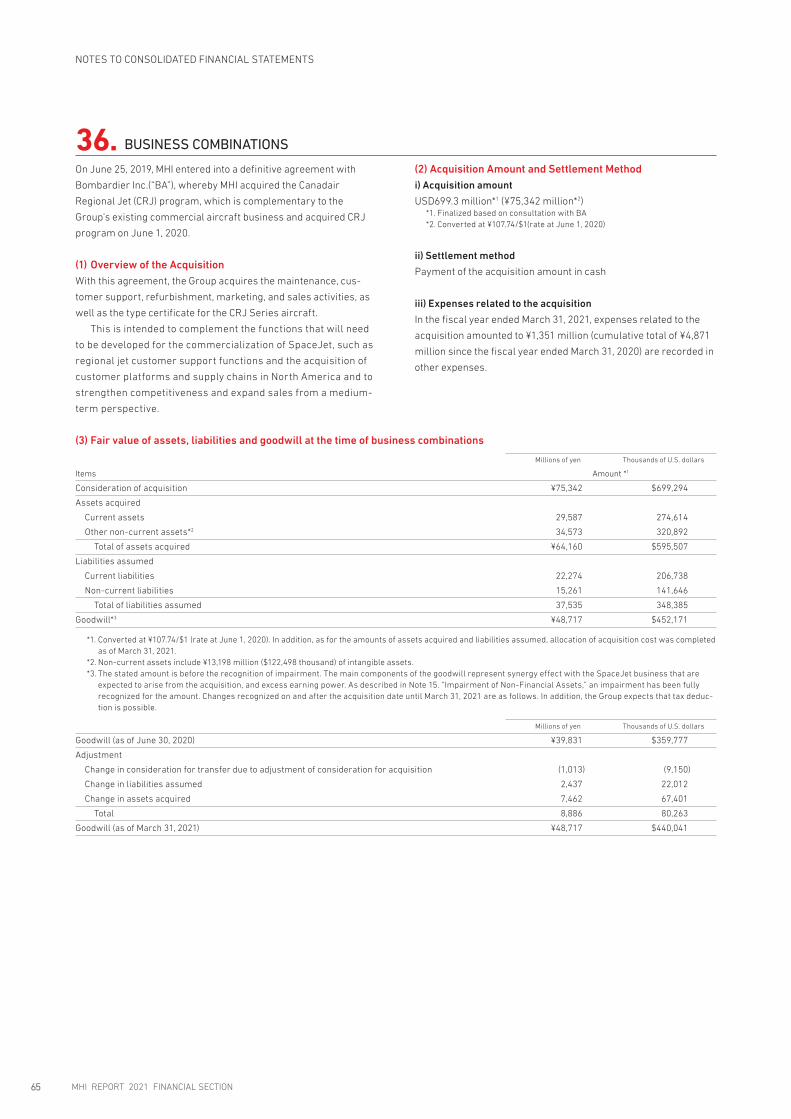
36. BUSINESS COMBINATIONS
On June 25, 2019, MHI entered into a definitive agreement with
Bombardier Inc.(“BA”), whereby MHI acquired the Canadair
Regional Jet (CRJ) program, which is complementary to the
Group’s existing commercial aircraft business and acquired CRJ
program on June 1, 2020.
(1) Overview of the AcquisitionWith this agreement, the Group acquires the maintenance, cus-
tomer support, refurbishment, marketing, and sales activities, as
well as the type certificate for the CRJ Series aircraft.
This is intended to complement the functions that will need
to be developed for the commercialization of SpaceJet, such as
regional jet customer support functions and the acquisition of
customer platforms and supply chains in North America and to
strengthen competitiveness and expand sales from a medium-
term perspective.
(2) Acquisition Amount and Settlement Methodi) Acquisition amount
USD699.3 million*1 (¥75,342 million*2)*1. Finalized based on consultation with BA*2. Converted at ¥107.74/$1(rate at June 1, 2020)
ii) Settlement method
Payment of the acquisition amount in cash
iii) Expenses related to the acquisition
In the fiscal year ended March 31, 2021, expenses related to the
acquisition amounted to ¥1,351 million (cumulative total of ¥4,871
million since the fiscal year ended March 31, 2020) are recorded in
other expenses.
(3) Fair value of assets, liabilities and goodwill at the time of business combinations
Millions of yen Thousands of U.S. dollars
Items Amount *1
Consideration of acquisition ¥75,342 $699,294
Assets acquired
Current assets 29,587 274,614
Other non-current assets*2 34,573 320,892
Total of assets acquired ¥64,160 $595,507
Liabilities assumed
Current liabilities 22,274 206,738
Non-current liabilities 15,261 141,646
Total of liabilities assumed 37,535 348,385
Goodwill*3 ¥48,717 $452,171
*1. Converted at ¥107.74/$1 (rate at June 1, 2020). In addition, as for the amounts of assets acquired and liabilities assumed, allocation of acquisition cost was completed as of March 31, 2021.
*2. Non-current assets include ¥13,198 million ($122,498 thousand) of intangible assets.*3. The stated amount is before the recognition of impairment. The main components of the goodwill represent synergy effect with the SpaceJet business that are
expected to arise from the acquisition, and excess earning power. As described in Note 15. “Impairment of Non-Financial Assets,” an impairment has been fully recognized for the amount. Changes recognized on and after the acquisition date until March 31, 2021 are as follows. In addition, the Group expects that tax deduc-tion is possible.
Millions of yen Thousands of U.S. dollars
Goodwill (as of June 30, 2020) ¥39,831 $359,777
Adjustment
Change in consideration for transfer due to adjustment of consideration for acquisition (1,013) (9,150)
Change in liabilities assumed 2,437 22,012
Change in assets acquired 7,462 67,401
Total 8,886 80,263
Goodwill (as of March 31, 2021) ¥48,717 $440,041
MHI REPORT 2021 FINANCIAL SECTION65
NOTES TO CONSOLIDATED FINANCIAL STATEMENTS
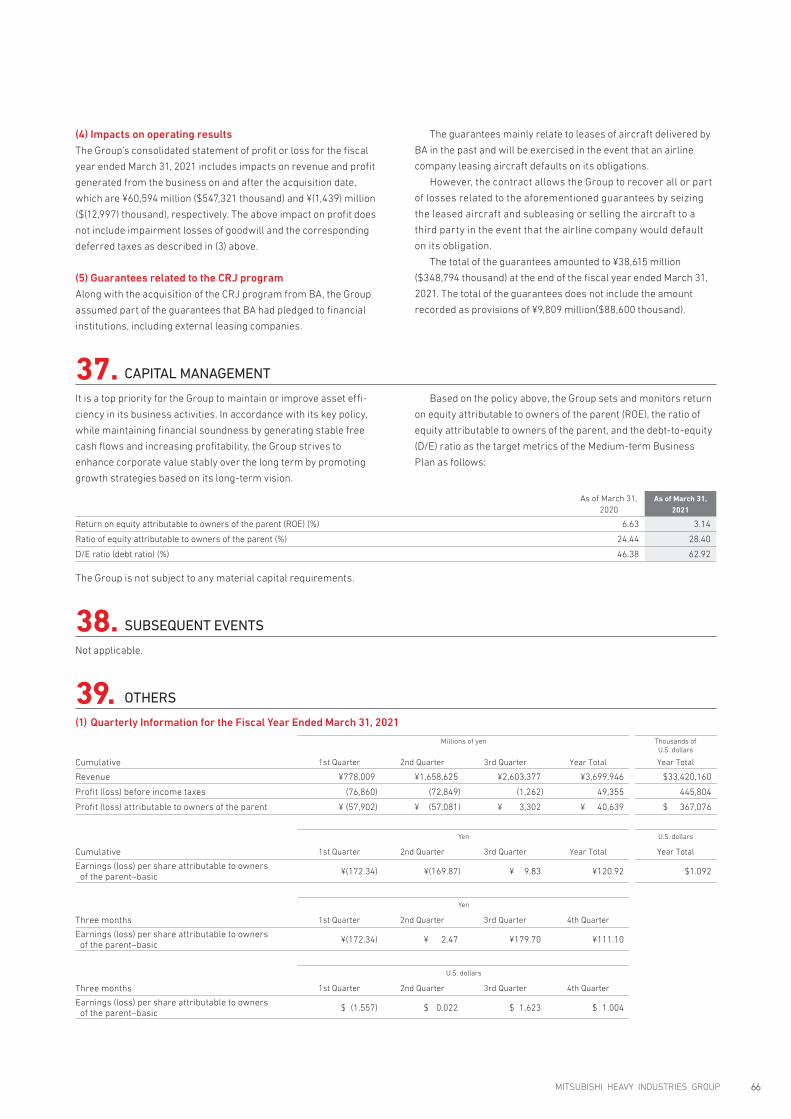
(4) Impacts on operating resultsThe Group’s consolidated statement of profit or loss for the fiscal
year ended March 31, 2021 includes impacts on revenue and profit
generated from the business on and after the acquisition date,
which are ¥60,594 million ($547,321 thousand) and ¥(1,439) million
($(12,997) thousand), respectively. The above impact on profit does
not include impairment losses of goodwill and the corresponding
deferred taxes as described in (3) above.
(5) Guarantees related to the CRJ programAlong with the acquisition of the CRJ program from BA, the Group
assumed part of the guarantees that BA had pledged to financial
institutions, including external leasing companies.
The guarantees mainly relate to leases of aircraft delivered by
BA in the past and will be exercised in the event that an airline
company leasing aircraft defaults on its obligations.
However, the contract allows the Group to recover all or part
of losses related to the aforementioned guarantees by seizing
the leased aircraft and subleasing or selling the aircraft to a
third party in the event that the airline company would default
on its obligation.
The total of the guarantees amounted to ¥38,615 million
($348,794 thousand) at the end of the fiscal year ended March 31,
2021. The total of the guarantees does not include the amount
recorded as provisions of ¥9,809 million($88,600 thousand).
37. CAPITAL MANAGEMENT
It is a top priority for the Group to maintain or improve asset effi-
ciency in its business activities. In accordance with its key policy,
while maintaining financial soundness by generating stable free
cash flows and increasing profitability, the Group strives to
enhance corporate value stably over the long term by promoting
growth strategies based on its long-term vision.
Based on the policy above, the Group sets and monitors return
on equity attributable to owners of the parent (ROE), the ratio of
equity attributable to owners of the parent, and the debt-to-equity
(D/E) ratio as the target metrics of the Medium-term Business
Plan as follows:
As of March 31, 2020
As of March 31, 2021
Return on equity attributable to owners of the parent (ROE) (%) 6.63 3.14
Ratio of equity attributable to owners of the parent (%) 24.44 28.40
D/E ratio (debt ratio) (%) 46.38 62.92
The Group is not subject to any material capital requirements.
38. SUBSEQUENT EVENTS
Not applicable.
39. OTHERS
(1) Quarterly Information for the Fiscal Year Ended March 31, 2021
Millions of yen Thousands of U.S. dollars
Cumulative 1st Quarter 2nd Quarter 3rd Quarter Year Total Year Total
Revenue ¥778,009 ¥1,658,625 ¥2,603,377 ¥3,699,946 $33,420,160
Profit (loss) before income taxes (76,860) (72,849) (1,262) 49,355 445,804
Profit (loss) attributable to owners of the parent ¥ (57,902) ¥ (57,081) ¥ 3,302 ¥ 40,639 $ 367,076
Yen U.S. dollars
Cumulative 1st Quarter 2nd Quarter 3rd Quarter Year Total Year Total
Earnings (loss) per share attributable to owners of the parent–basic
¥(172.34) ¥(169.87) ¥ 9.83 ¥120.92 $1.092
Yen
Three months 1st Quarter 2nd Quarter 3rd Quarter 4th Quarter
Earnings (loss) per share attributable to owners of the parent–basic
¥(172.34) ¥ 2.47 ¥179.70 ¥111.10
U.S. dollars
Three months 1st Quarter 2nd Quarter 3rd Quarter 4th Quarter
Earnings (loss) per share attributable to owners of the parent–basic
$ (1.557) $ 0.022 $ 1.623 $ 1.004
MITSUBISHI HEAVY INDUSTRIES GROUP 66
(2) Major Lawsuitsa) On July 31, 2017, MHI filed a demand for arbitration against
Hitachi, Ltd. seeking performance of the obligation to make a
payment as the price adjustment and other payments relating
to the South African Asset Transfer. MHI and Hitachi reached a
settlement on December 18, 2019 regarding this case, and the
arbitration proceedings have been cancelled on September 14,
2020. (for details, refer to Note 12. “Indemnification Asset for
South African Projects”).
b) In October 2017, Korea East-West Power Co., Ltd. (“EWP”) filed a
demand for arbitration against MHI and its consolidated sub-
sidiary, Mitsubishi Hitachi Power Systems, Ltd. (“MHPS”)*, to
the Korean Commercial Arbitration Board, seeking compensa-
tion for damages in relation to non-operating losses due to a
burnout accident that occurred during the commissioning
period of steam turbine generation facilities. EWP has claimed
that this burnout accident was caused by an intentional act or
gross negligence of MHPS, and MHI and that MHPS shall bear
liability for the damages under the contract and the laws of
South Korea. With regard to these claims, MHI and MHPS
believe that MHPS had neither the intention nor the gross
negligence and will assert that the responsibility of MHPS is
limited under the contract.
* MHPS changed its company name to Mitsubishi Power, Ltd. on September 1, 2020.
c) There was a temporary dispute between a consortium com-
posed of MHI and Daewoo Engineering & Construction Co., Ltd.
(“the Company, etc.”) and El Sharika El-Djazairia El-Omania Lil
Asmida SPA (“AOA”) regarding a chemical fertilizer plant con-
struction contract in Algeria whose orders had been received
by the Company, etc., but a settlement was reached in 2017 (the
“Settlement Agreement”), and the consortium delivered the
plant to AOA. However, AOA subsequently refused to make
some of the outstanding payment under the Settlement
Agreement. Therefore, the Company, etc. filed for arbitration
against AOA and one of its shareholders, Societe Nationale
pour la Recherche, la Production, le Transport, la
Transformation et la Commercialisation des Hydrocarbures
SPA (“SONATRACH”).
In March 2021, the Company, etc. received a counterclaim
from AOA which mainly consists of the cancellation of the
Settlement Agreement and the refund of the payment already
made under the Settlement Agreement. The Company, etc. will
assert that there are no reasonable grounds for AOA’s refusal
to make the outstanding payment and that the counterclaim
should be dismissed.
(3) Impact of the spread of the novel coronavirus disease (COVID-19)
Due to the spread of COVID-19, there has been a decrease in rev-
enue associated with shrinking demand and production adjust-
ments at factories of the Group’s commercial aircraft business
and medium-volume production business. During the fiscal year
ended March 31, 2021, the impact has been incorporated into the
valuation of assets and reflected in the financial figures.
The COVID-19 is an event that impacts economic and corporate
activities in a wide range of ways, and it is currently difficult to
predict how it will spread in the future or when it will end.
Therefore, considering external and other information, the
Company looked over the impact on the business plan, and made
accounting estimates such as the evaluation of assets based on
assumptions according to the product’s characteristics and the
market environment that the products relate to.
If this effect is further prolonged, new production adjustments
and further reductions in sales to customers may occur, which
would affect the financial position and operating results of the
Group from the next fiscal year.
There have been no significant changes since the previous
fiscal year ended March 31, 2020, regarding the assumptions
which include the future spread of COVID-19 and when the pan-
demic will be contained.
MHI REPORT 2021 FINANCIAL SECTION67
NOTES TO CONSOLIDATED FINANCIAL STATEMENTS
INDEPENDENT AUDITOR’S REPORT
Independent Auditor’s Report
To the Board of Directors of Mitsubishi Heavy Industries, Ltd.:
Opinion
We have audited the accompanying consolidated financial statements of Mitsubishi Heavy Industries, Ltd. (“the Company”) and its consolidated subsidiaries (collectively referred to as “the Group”), which comprise the consolidated statement of finanical position as at March 31, 2021, and the consolidated statements of profit or loss, comprehensive income, changes in equity and cash flows for the year then ended, and notes, comprising significant accounting policies and other explanatory information.
In our opinion, the accompanying consolidated financial statements present fairly, in all material respects, the consolidated financial position of the Group as at March 31, 2021, and its consolidated financial performance and its consolidated cash flows for the year then ended in accordance with International Financial Reporting Standards (IFRS).
Basis for Opinion
We conducted our audit in accordance with auditing standards generally accepted in Japan. Our responsibilities under those standards are further described in the Auditor’s Responsibilities for the Audit of the Consolidated Financial Statements section of our report. We are independent of the Group in accordance with the ethical requirements that are relevant to our audit of the consolidated financial statements in Japan, and we have fulfilled our other ethical responsibilities in accordance with these requirements. We believe that the audit evidence we have obtained is sufficient and appropriate to provide a basis for our opinion.
Key Audit Matters
Key audit matters are those matters that, in our professional judgment, were of most significance in our audit of the consolidated financial statements of the current period. These matters were addressed in the context of our audit of the consolidated financial statements as a whole, and in forming our opinion thereon, and we do not provide a separate opinion on these matters.
Reasonableness of the estimates of total revenue and costs related to the revenue recognized from construction contracts and a provision for losses on construction contracts
The key audit matter How the matter was addressed in our audit
As described in Notes 3. “Significant accounting policies, (13) Revenue” and 24. “Revenue” to the consolidated financial statements, the “Company” and the Group are engaged in construction work in which performance obligations are to be satisfied over a long period exceeding one year. These construction works are performed primarily in Energy, Plants & Infrastructure, and Defense and space equipment businesses. The revenue of each business for the year ended March 31, 2021 is set forth below. These amounts include revenue recognized over time based on the progress towards completion and determining the total transaction price for each construction contract.
The primary audit procedures we performed to assess the reasonableness of the estimates of total revenue and costs related to the revenue recognized from construction contracts and a provision for losses on construction contracts are set out below. For construction contracts that any of the consolidated subsidiaries entered into, we requested the component auditors of the relevant consolidated subsidiaries to perform an audit. Then we received the results of audit procedures performed by the component auditors and concluded on whether sufficient and appropriate audit evidence was obtained.
MITSUBISHI HEAVY INDUSTRIES GROUP 68
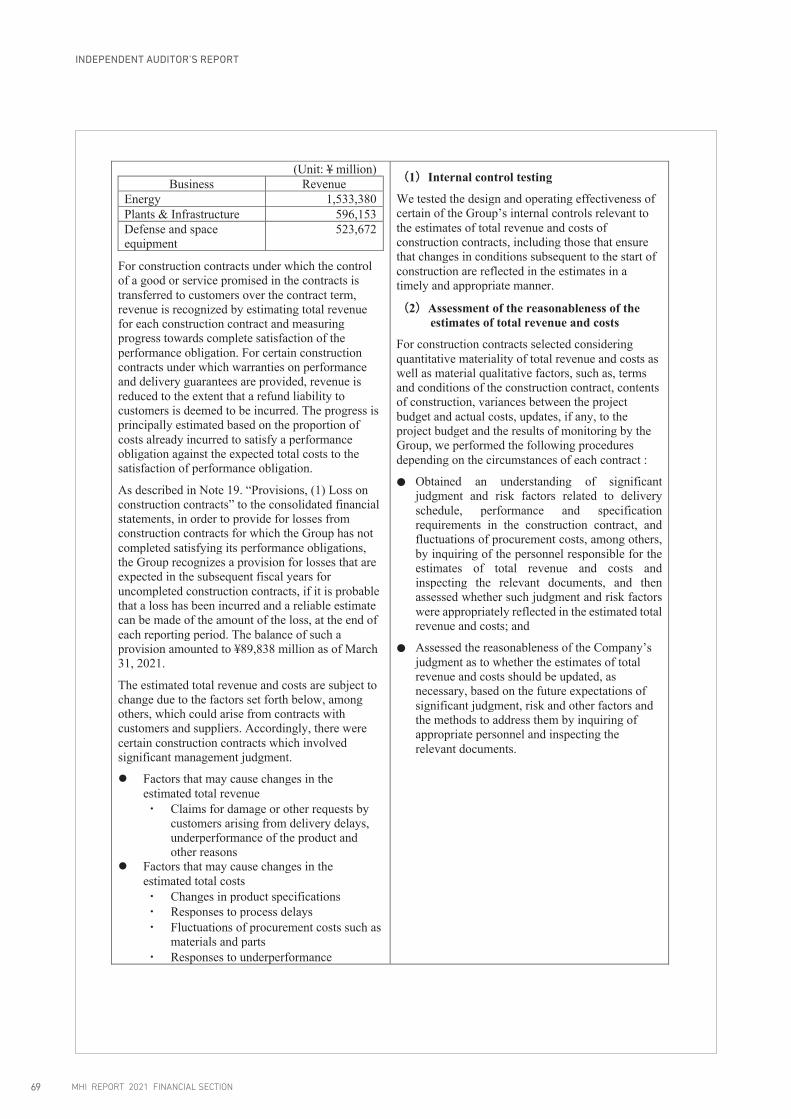
(Unit: ¥ million) Business Revenue
Energy 1,533,380 Plants & Infrastructure 596,153 Defense and space equipment
523,672
For construction contracts under which the control of a good or service promised in the contracts is transferred to customers over the contract term, revenue is recognized by estimating total revenue for each construction contract and measuring progress towards complete satisfaction of the performance obligation. For certain construction contracts under which warranties on performance and delivery guarantees are provided, revenue is reduced to the extent that a refund liability to customers is deemed to be incurred. The progress is principally estimated based on the proportion of costs already incurred to satisfy a performance obligation against the expected total costs to the satisfaction of performance obligation.
As described in Note 19. “Provisions, (1) Loss on construction contracts” to the consolidated financial statements, in order to provide for losses from construction contracts for which the Group has not completed satisfying its performance obligations, the Group recognizes a provision for losses that are expected in the subsequent fiscal years for uncompleted construction contracts, if it is probable that a loss has been incurred and a reliable estimate can be made of the amount of the loss, at the end of each reporting period. The balance of such a provision amounted to ¥89,838 million as of March 31, 2021.
The estimated total revenue and costs are subject to change due to the factors set forth below, among others, which could arise from contracts with customers and suppliers. Accordingly, there were certain construction contracts which involved significant management judgment.
l Factors that may cause changes in theestimated total revenue ・ Claims for damage or other requests by
customers arising from delivery delays, underperformance of the product and other reasons
l Factors that may cause changes in theestimated total costs ・ Changes in product specifications・ Responses to process delays・ Fluctuations of procurement costs such as
materials and parts ・ Responses to underperformance
((1))Internal control testing
We tested the design and operating effectiveness of certain of the Group’s internal controls relevant to the estimates of total revenue and costs of construction contracts, including those that ensure that changes in conditions subsequent to the start of construction are reflected in the estimates in a timely and appropriate manner.
((2))Assessment of the reasonableness of theestimates of total revenue and costs
For construction contracts selected considering quantitative materiality of total revenue and costs as well as material qualitative factors, such as, terms and conditions of the construction contract, contents of construction, variances between the project budget and actual costs, updates, if any, to the project budget and the results of monitoring by the Group, we performed the following procedures depending on the circumstances of each contract :
● Obtained an understanding of significantjudgment and risk factors related to deliveryschedule, performance and specification requirements in the construction contract, and fluctuations of procurement costs, among others, by inquiring of the personnel responsible for the estimates of total revenue and costs and inspecting the relevant documents, and then assessed whether such judgment and risk factors were appropriately reflected in the estimated total revenue and costs; and
● Assessed the reasonableness of the Company’sjudgment as to whether the estimates of total revenue and costs should be updated, as necessary, based on the future expectations of significant judgment, risk and other factors and the methods to address them by inquiring of appropriate personnel and inspecting the relevant documents.
MHI REPORT 2021 FINANCIAL SECTION69
INDEPENDENT AUDITOR’S REPORT

・ Events that were not considered in the planning of construction
We, therefore, determined that our assessment of the reasonableness of the estimates of total revenue and costs related to the revenue recognized from construction contracts and a provision for losses on construction contracts was one of the most significant matters in our audit of the consolidated financial statements for the fiscal year ended March 31, 2021, and accordingly, a key audit matter.
Appropriateness of the Company’s judgment on the recoverability of deferred tax assets
The key audit matter How the matter was addressed on our audit
In the consolidated statement of financial position of the Group, deferred tax assets of ¥378,338 million were recognized as of March 31, 2021, representing 16% of non-current assets. As described in Note 16. “Income taxes” to the consolidated financial statements, the amount of gross deferred tax assets before being offset by deferred tax liabilities amounted to ¥561,193 million. Of this amount, the deferred tax assets related to deductible temporary differences arising from investments in subsidiaries, associates and joint ventures accounted for ¥141,369 million (before being offset by deferred tax liabilities).
As described in Note 3. “Significant accounting policies, (17) Income taxes” to the consolidated financial statements, deferred tax assets are reviewed at the end of each reporting period and are recognized to the extent that it is probable that taxable profit will be available against which deductible temporary differences and unused tax losses can be utilized.
For deductible temporary differences arising from investments in subsidiaries, associates and joint ventures, deferred tax assets are recognized to the extent that it is probable that the temporary differences are expected to reverse by reducing taxable income in the foreseeable future based on management plans taking into account tax implications and others.
The future taxable income used to determine the recoverability of deferred tax assets was estimated based on the business plan approved by management. The business plan included key factors, such as the reduction of fixed costs, the impact of the spread of COVID-19 on demand and production, and responses to changes in the business environment of the Gas and Steam power systems business, which is one of the Group’s core businesses. These factors involved significant
The primary audit procedures we performed to assess whether the Company’s judgment on the recoverability of deferred tax assets was appropriate, included the following:
(1) Internal control testing
We tested the design and operating effectiveness of certain of the Company’s internal controls relevant to the judgment on the recoverability of deferred tax assets, including those over the process of preparing the business plan and estimating future taxable income.
(2) Assessment of the reasonableness of the estimated future taxable income
In order to assess the reasonableness of key factors adopted in the business plan, which was used as the basis for estimating future taxable income, we performed the following procedures, among others:
● assessed the feasibility and reasonableness of the cost reduction plans by inquiring of the responsible personnel and inspecting the relevant documents;
● performed a trend analysis on expected revenue reflecting the impact of COVID-19 based mainly on external information and statistical data; and
● confirmed the consistency of the measures to respond to changes in the business environment of Gas and Steam power systems business with past actual results and external information on the future outlook.
(3) Assessment of the reasonableness of the scheduling of when deductible temporary differences and unused tax losses will reverse
In order to assess the reasonableness of key factors used in scheduling when deductible temporary differences and unused tax losses will reverse, we performed the following procedures, among others:
MITSUBISHI HEAVY INDUSTRIES GROUP 70
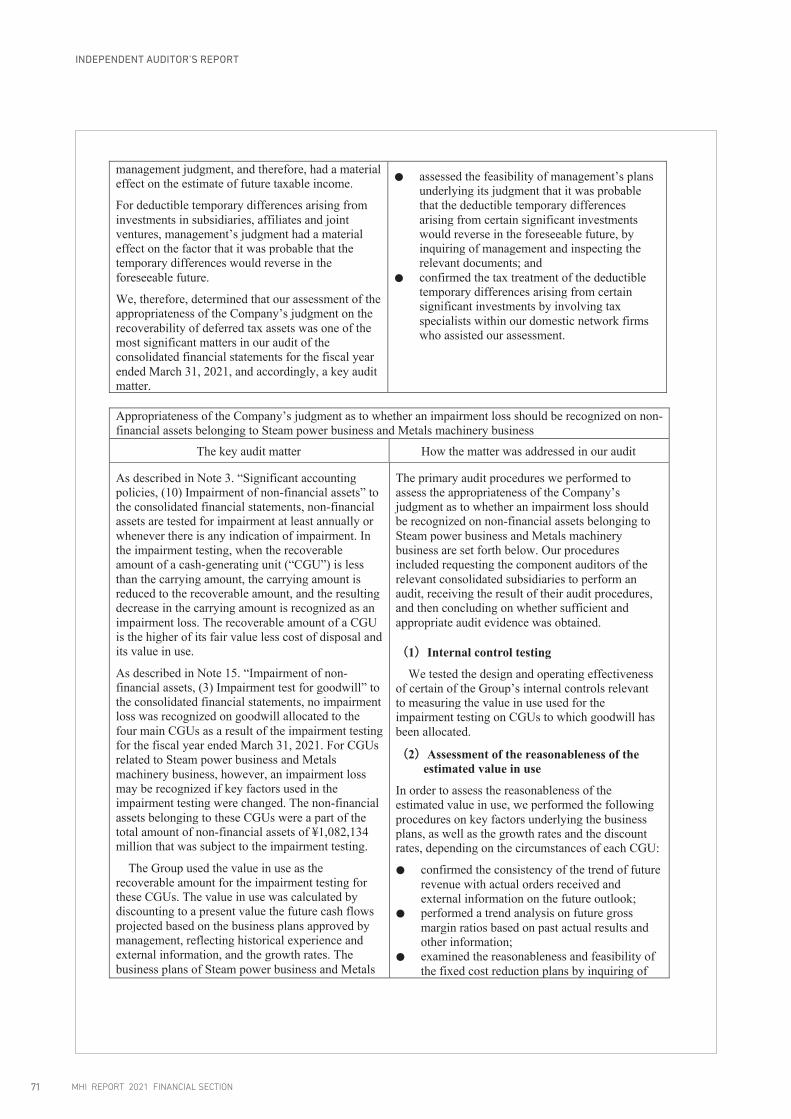
management judgment, and therefore, had a material effect on the estimate of future taxable income.
For deductible temporary differences arising from investments in subsidiaries, affiliates and joint ventures, management’s judgment had a material effect on the factor that it was probable that the temporary differences would reverse in the foreseeable future.
We, therefore, determined that our assessment of the appropriateness of the Company’s judgment on the recoverability of deferred tax assets was one of the most significant matters in our audit of the consolidated financial statements for the fiscal year ended March 31, 2021, and accordingly, a key audit matter.
● assessed the feasibility of management’s plansunderlying its judgment that it was probable that the deductible temporary differences arising from certain significant investments would reverse in the foreseeable future, by inquiring of management and inspecting the relevant documents; and
● confirmed the tax treatment of the deductibletemporary differences arising from certain significant investments by involving tax specialists within our domestic network firms who assisted our assessment.
Appropriateness of the Company’s judgment as to whether an impairment loss should be recognized on non-financial assets belonging to Steam power business and Metals machinery business
The key audit matter How the matter was addressed in our audit
As described in Note 3. “Significant accounting policies, (10) Impairment of non-financial assets” to the consolidated financial statements, non-financial assets are tested for impairment at least annually or whenever there is any indication of impairment. In the impairment testing, when the recoverable amount of a cash-generating unit (“CGU”) is less than the carrying amount, the carrying amount is reduced to the recoverable amount, and the resulting decrease in the carrying amount is recognized as an impairment loss. The recoverable amount of a CGU is the higher of its fair value less cost of disposal and its value in use.
As described in Note 15. “Impairment of non-financial assets, (3) Impairment test for goodwill” to the consolidated financial statements, no impairment loss was recognized on goodwill allocated to the four main CGUs as a result of the impairment testing for the fiscal year ended March 31, 2021. For CGUs related to Steam power business and Metals machinery business, however, an impairment loss may be recognized if key factors used in the impairment testing were changed. The non-financial assets belonging to these CGUs were a part of the total amount of non-financial assets of ¥1,082,134 million that was subject to the impairment testing.
The Group used the value in use as the recoverable amount for the impairment testing for these CGUs. The value in use was calculated by discounting to a present value the future cash flows projected based on the business plans approved by management, reflecting historical experience and external information, and the growth rates. The business plans of Steam power business and Metals
The primary audit procedures we performed to assess the appropriateness of the Company’s judgment as to whether an impairment loss should be recognized on non-financial assets belonging to Steam power business and Metals machinery business are set forth below. Our procedures included requesting the component auditors of the relevant consolidated subsidiaries to perform an audit, receiving the result of their audit procedures, and then concluding on whether sufficient and appropriate audit evidence was obtained.
((1))Internal control testing
We tested the design and operating effectiveness of certain of the Group’s internal controls relevant to measuring the value in use used for the impairment testing on CGUs to which goodwill has been allocated.
((2))Assessment of the reasonableness of theestimated value in use
In order to assess the reasonableness of the estimated value in use, we performed the following procedures on key factors underlying the business plans, as well as the growth rates and the discount rates, depending on the circumstances of each CGU:
● confirmed the consistency of the trend of futurerevenue with actual orders received and external information on the future outlook;
● performed a trend analysis on future grossmargin ratios based on past actual results and other information;
● examined the reasonableness and feasibility ofthe fixed cost reduction plans by inquiring of
MHI REPORT 2021 FINANCIAL SECTION71
INDEPENDENT AUDITOR’S REPORT
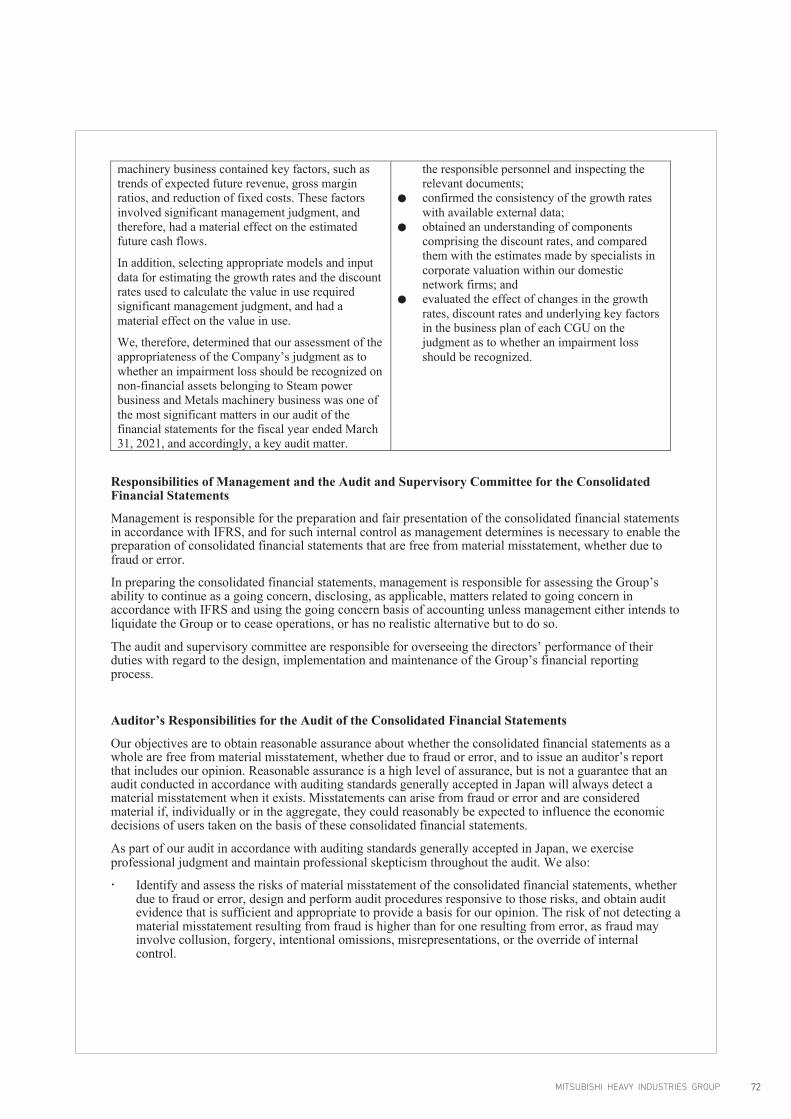
machinery business contained key factors, such as trends of expected future revenue, gross margin ratios, and reduction of fixed costs. These factors involved significant management judgment, and therefore, had a material effect on the estimated future cash flows.
In addition, selecting appropriate models and input data for estimating the growth rates and the discount rates used to calculate the value in use required significant management judgment, and had a material effect on the value in use.
We, therefore, determined that our assessment of the appropriateness of the Company’s judgment as to whether an impairment loss should be recognized on non-financial assets belonging to Steam power business and Metals machinery business was one of the most significant matters in our audit of the financial statements for the fiscal year ended March 31, 2021, and accordingly, a key audit matter.
the responsible personnel and inspecting the relevant documents;
● confirmed the consistency of the growth rateswith available external data;
● obtained an understanding of componentscomprising the discount rates, and compared them with the estimates made by specialists in corporate valuation within our domestic network firms; and
● evaluated the effect of changes in the growthrates, discount rates and underlying key factors in the business plan of each CGU on the judgment as to whether an impairment loss should be recognized.
Responsibilities of Management and the Audit and Supervisory Committee for the Consolidated Financial Statements
Management is responsible for the preparation and fair presentation of the consolidated financial statements in accordance with IFRS, and for such internal control as management determines is necessary to enable the preparation of consolidated financial statements that are free from material misstatement, whether due to fraud or error.
In preparing the consolidated financial statements, management is responsible for assessing the Group’s ability to continue as a going concern, disclosing, as applicable, matters related to going concern in accordance with IFRS and using the going concern basis of accounting unless management either intends to liquidate the Group or to cease operations, or has no realistic alternative but to do so.
The audit and supervisory committee are responsible for overseeing the directors’ performance of their duties with regard to the design, implementation and maintenance of the Group’s financial reporting process.
Auditor’s Responsibilities for the Audit of the Consolidated Financial Statements
Our objectives are to obtain reasonable assurance about whether the consolidated financial statements as a whole are free from material misstatement, whether due to fraud or error, and to issue an auditor’s report that includes our opinion. Reasonable assurance is a high level of assurance, but is not a guarantee that an audit conducted in accordance with auditing standards generally accepted in Japan will always detect a material misstatement when it exists. Misstatements can arise from fraud or error and are considered material if, individually or in the aggregate, they could reasonably be expected to influence the economic decisions of users taken on the basis of these consolidated financial statements.
As part of our audit in accordance with auditing standards generally accepted in Japan, we exercise professional judgment and maintain professional skepticism throughout the audit. We also:
� Identify and assess the risks of material misstatement of the consolidated financial statements, whetherdue to fraud or error, design and perform audit procedures responsive to those risks, and obtain auditevidence that is sufficient and appropriate to provide a basis for our opinion. The risk of not detecting amaterial misstatement resulting from fraud is higher than for one resulting from error, as fraud mayinvolve collusion, forgery, intentional omissions, misrepresentations, or the override of internalcontrol.
MITSUBISHI HEAVY INDUSTRIES GROUP 72

� Obtain an understanding of internal control relevant to the audit in order to design audit proceduresthat are appropriate in the circumstances, while the objective of the audit is not to express an opinionon the effectiveness of the Group’s internal control.
� Evaluate the appropriateness of accounting policies used and the reasonableness of accountingestimates and related disclosures made by management.
� Conclude on the appropriateness of management’s use of the going concern basis of accounting andbased on the audit evidence obtained, whether a material uncertainty exists related to events orconditions that may cast significant doubt on the Group’s ability to continue as a going concern. If weconclude that a material uncertainty exists, we are required to draw attention in our auditor’s report tothe related disclosures in the consolidated financial statements or, if such disclosures are inadequate, tomodify our opinion. Our conclusions are based on the audit evidence obtained up to the date of ourauditor’s report. However, future events or conditions may cause the Group to cease to continue as agoing concern.
� Evaluate whether the presentation and disclosures in the consolidated financial statements are inaccordance with IFRS, the overall presentation, structure and content of the consolidated financialstatements, including the disclosures, and whether the consolidated financial statements represent theunderlying transactions and events in a manner that achieves fair presentation.
� Obtain sufficient appropriate audit evidence regarding the financial information of the entities orbusiness activities within the Group to express an opinion on the consolidated financial statements. Weare responsible for the direction, supervision and performance of the group audit. We remain solelyresponsible for our audit opinion.
We communicate with the audit and supervisory committee regarding, among other matters, the planned scope and timing of the audit, significant audit findings, including any significant deficiencies in internal control that we identify during our audit.
We also provide the audit and supervisory committee with a statement that we have complied with relevant ethical requirements regarding independence, and communicate with them all relationships and other matters that may reasonably be thought to bear on our independence, and where applicable, related safeguards.
From the matters communicated with the audit and supervisory committee, we determine those matters that were of most significance in the audit of the consolidated financial statements of the current period and are therefore the key audit matters. We describe these matters in our auditor’s report unless law or regulation precludes public disclosure about the matter or when, in extremely rare circumstances, we determine that a matter should not be communicated in our report because the adverse consequences of doing so would reasonably be expected to outweigh the public interest benefits of such communication.
Convenience Translation
The U.S. dollar amounts in the accompanying consolidated financial statements with respect to the year ended March 31, 2021 are presented solely for convenience. Our audit also included the translation of yen amounts into U.S. dollar amounts and, in our opinion, such translation has been made on the basis described in Note 2 to the consolidated financial statements.
Interest required to be disclosed by the Certified Public Accountants Act of Japan
Our firm and its designated engagement partners do not have any interest in the Company and its subsidiaries which are required to be disclosed pursuant to the provisions of the Certified Public Accountants Act of Japan.
MHI REPORT 2021 FINANCIAL SECTION73
INDEPENDENT AUDITOR’S REPORT
/S/Takuji Kanai Designated Engagement Partner Certified Public Accountant
/S/Kenji Tanaka Designated Engagement Partner Certified Public Accountant
/S/Kentaro Maruta Designated Engagement Partner Certified Public Accountant
KPMG AZSA LLC Tokyo Office, Japan July 6, 2021
Notes to the Reader of Independent Auditor’s Report: This is a copy of the Independent Auditor’s Report and the original copies are kept separately by the Company and KPMG AZSA LLC.
MITSUBISHI HEAVY INDUSTRIES GROUP 74