33
1 § Michael Stadermann § Harry Radousky § Juan Santiago § Gergely Zimanyi

1
§ Michael Stadermann
§ Harry Radousky
§ Juan Santiago
§ Gergely Zimanyi

2
§ 1/6th of the world’s population
does not have daily access to
fresh water
§ 30+% of the U.S experienced
severe drought in 2015
§ Water will be major driver of
conflicts worldwide
§ Global market for desalination is
only $12-14 billion/year, because
specialized on sea water for
Western infrastructure
$20bn for Valentine’s day in US
$20bn quarterly shipment on iphones

3
§ technology has focused on
sea water
§ inland brackish water desalination would be
better suited for California
National Drought Mitigation Center
September 1, 2015

4
Reverse Osmosis:
§ uses non-renewable fossil energy source:
• amplifies the cause of drought
• increases dependency on increasingly scarce
fossil fuels
§ operates at high pressures, increasing costs
§ lot of mechanical moving parts
SONADES:
§ energized by renewable photovoltaic energy:
• does not amplify drought
• photovoltaics developed into a mature,
affordable technology
§ operates at low pressures, reducing costs
§ electronic technology, essentially no moving
parts
CA can become a desalination technology leader, generating manufacturing jobs and revenue

LLNL-PRES-649605
This work was performed under the auspices of the U.S. Department of Energy by Lawrence Livermore National Laboratory under contract DE-AC52-07NA27344.Lawrence Livermore National Security, LLC
Michael Stadermann, Juan Santiago
IMAGE

Lawrence Livermore National LaboratoryLLNL-PRES-649605
6
•high energy efficiency (2.5 kWh/m3
for seawater, 1.0 kWh/m3 for brackish water)
E ~ (posmotic + pmembrane)·V
•requires 40-80 bar of pressure for sea water
•requires extensive water pre- and post-treatment
•cost increases at small scale
pump
(75 atm)
high pressure
brine

Lawrence Livermore National LaboratoryLLNL-PRES-649605
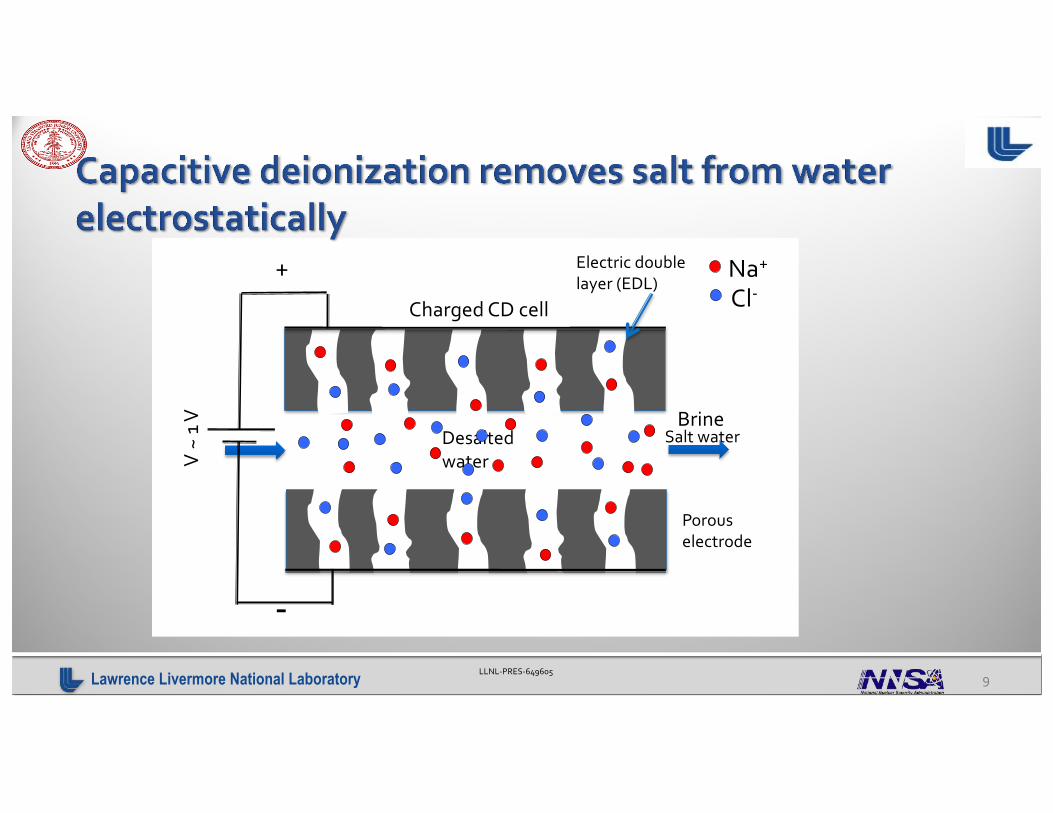
• removes salt from water
E ~ I2·R
• energy efficiencies of <0.5 kWh/m3 are possible

Lawrence Livermore National LaboratoryLLNL-PRES-649605
• RO lower limit is given by membrane resistance
• CD energy cost scales with concentration throughout
• energy cost for CD is much lower for low salt concentrations
Lawrence Livermore National LaboratoryLLNL-PRES-649605
9
Desalted
water
Porous
electrode
Salt water
Uncharged CD cellCharged CD cell
V ~
1 V
Electric double
layer (EDL)Na+
Cl-
+
-
Brine
Lawrence Livermore National LaboratoryLLNL-PRES-649605
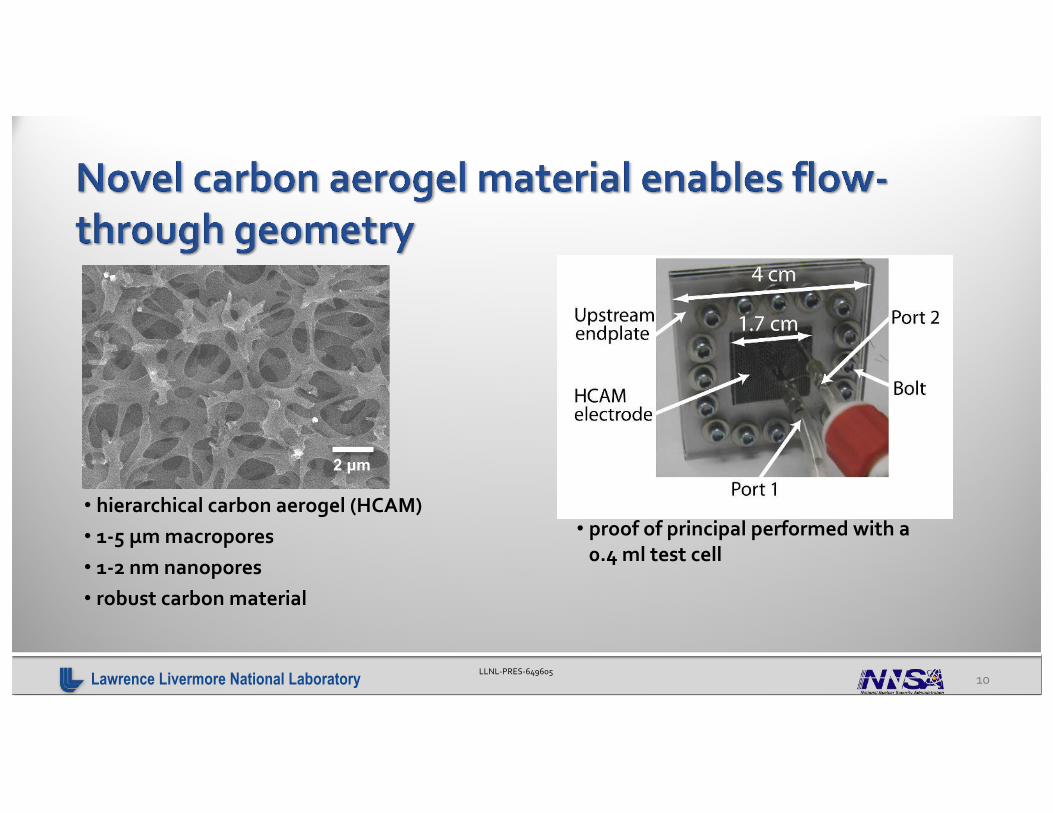
10
• hierarchical carbon aerogel (HCAM)
• 1-5 μm macropores
• 1-2 nm nanopores
• robust carbon material
• proof of principal performed with a
0.4 ml test cell
2 μm

• Modified Donnan model
• Charge balance
• Mass transport in macropores
• Micropore potential drop
• Voltage equations
• Conservation of current
Variables:
volumetric electrode charge : macropore concentration
: Donnan potential
Fitting parameters:
micropore capacitance
native charge density
c

Conclusions:• Time scales:CC, min(tconv, tdiff); CV: min(tRC,tconv)
• CV demonstrate constantandcontrollableeffluentconcentration; Fasterdesalinationratewithshorttimeofcharging
• Constant current (CC)
• Constant voltage (CV)
tdiff =le2
Defft
RC= RC t
conv=le
υRC Convection DiffusionTime scales:
0 0.5 1 1.5 265
70
75
80
85
90
95
100
Position (mm)
Con
cent
ratio
n (m
M)
1s
200s
400s
600s
800s
1000sC
once
ntra
tion
(mM
)
0 1000 2000 3000 40000
20
40
60
80
100
Time (s)
Con
cent
ratio
n (m
M)
2×10⁻⁷
m/s
5×10⁻⁷
m/s
4.2×10⁻⁶
m/s
8.4×10⁻⁶
m/s
2×10⁻⁵
m/s
Con
cent
ratio
n (m
M)
0 0.5 1 1.5 2
20
30
40
50
60
70
80
90
100
1s
10s
20s
50s
100s
500s
1000s
Con
cent
ratio
n (m
M)
Position (mm)0 100 200 300 400 500
0
20
40
60
80
100
Con
cent
ratio
n (m
M)
2.1×10⁻⁶
m/s
4.2×10⁻⁶
m/s
1×10⁻⁵
m/s
5×10⁻⁵
m/s
Time (s)
mM
mM

EIS Cyclic voltammetry Leakage current
• 300 µm thick HCAM electrodes
• Flow rate: 0.24 mL/min
• Iext = 7.7 mA to 48 mA
• Vext = 1V
• Inlet concentration: 100 mM
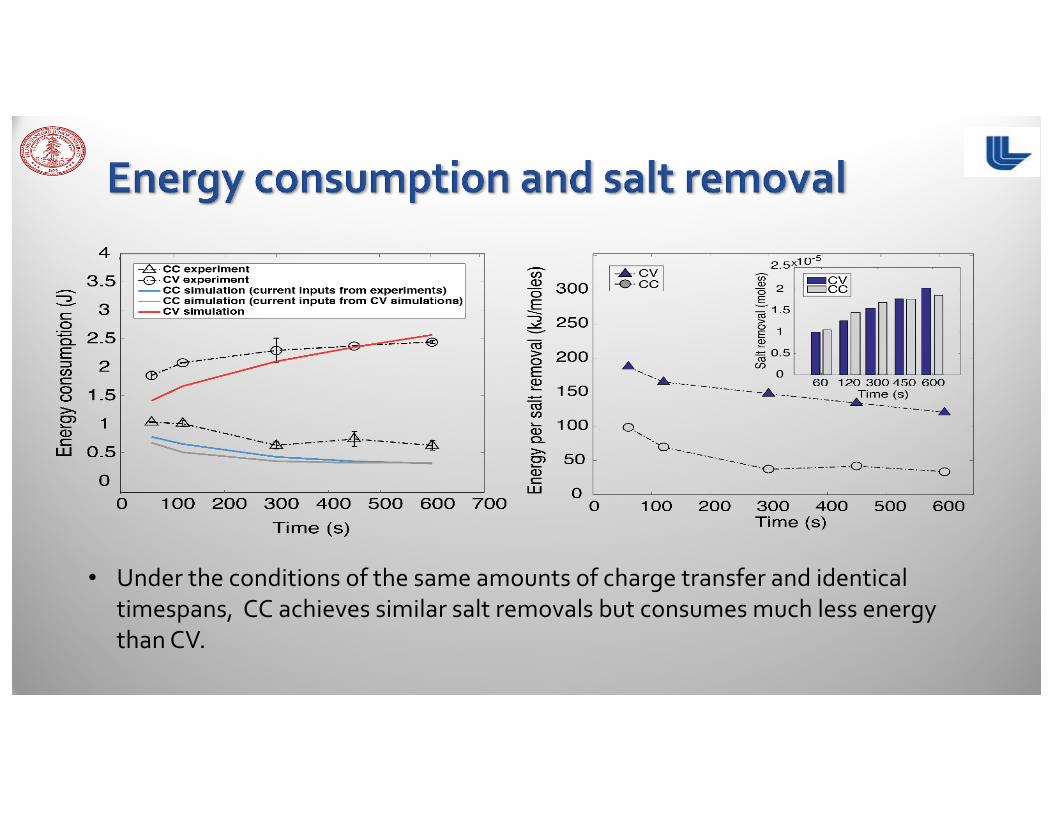
• Under the conditions of the same amounts of charge transfer and identical
timespans, CC achieves similar salt removals but consumes much less energy
than CV.
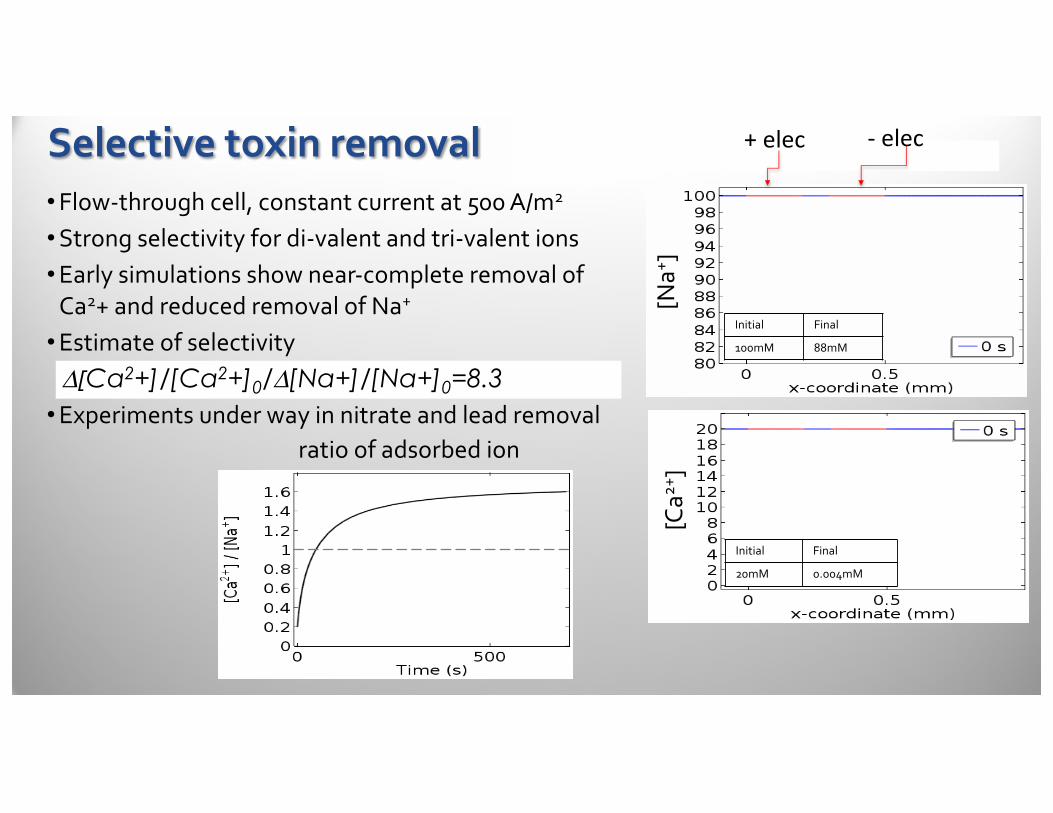
+elec - elec
[Ca
2+]
[Na
+]
• Flow-through cell, constant current at 500 A/m2
• Strong selectivity for di-valent and tri-valent ions
• Early simulations show near-complete removal of
Ca2+ and reduced removal of Na+
• Estimate of selectivity
• Experiments under way in nitrate and lead removal
Initial Final
100mM 88mM
Initial Final
20mM 0.004mM
ratio of adsorbed ion
D[Ca2+]/[Ca2+]0/D[Na+]/[Na+]0=8.3
Selective toxin removal

Lawrence Livermore National LaboratoryLLNL-PRES-649605
16
• water in electrode does not contribute
to desalination
• slow (60 mins/ cycle)
• high energy cost
• low capacity (removes ~1.5 g/L/charge)
• entire electrode volume
contributes to desalination
• faster (10-20x)
• lower energy cost (up to 3x)
• higher capacity (~4.5 g/L/charge)
Flow-between architecture
LLNL/Stanford flow-through
electrode architecture (ftCDI)

Lawrence Livermore National LaboratoryLLNL-PRES-649605 17
FTE-CDIadvantages
Fullyelectric androbusttovariablepower
supply
Size-independent costandefficiency
Demonstratedionselectivity(heavymetals,
nitrate)
projectedenergyuseforbrackishwater:
0.1-0.2kWh/m3
(5-10xlessthanRO)
Reverse osmosis

Lawrence Livermore National LaboratoryLLNL-PRES-649605
cell
module
system
feed water
brin
e
treated water
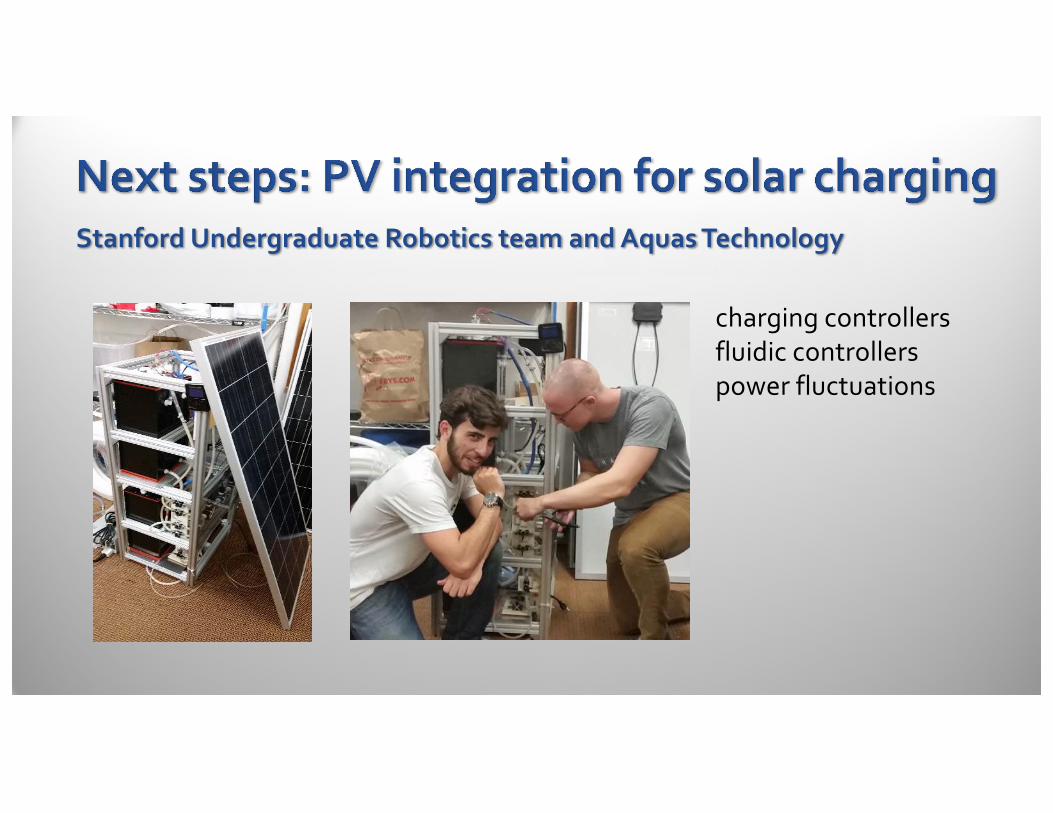
Stanford Undergraduate Robotics team and Aquas Technology
charging controllers
fluidic controllers
power fluctuations


2. Integrated Solar Charging:Flow-through photovoltaic cell Harry Radousky, Gergely Zimanyi
Rela%ve'output'ion'concentra%on'(%)'''''''''
40'''''''50''''''''''60'''''''''70''''''''''80'''''''''90''''''''100'
'0'''''''''''''5'''''''''''''10'''''''''''15'''''''''''20'''''''''''25''''''''''30'
Time'(min)'
ionconcentra%on(%)
%me(min)Fig. 5a-c ISC SONADES: Nano-structured PV electrode.
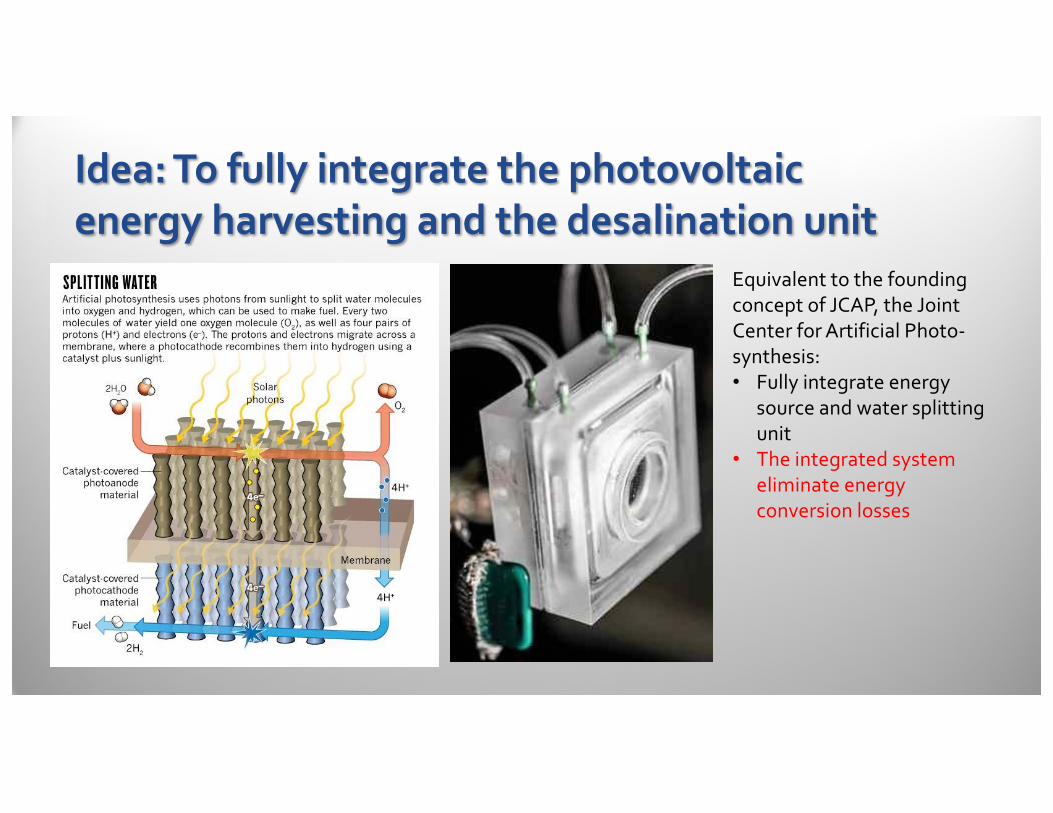
Idea: To fully integrate the photovoltaic energy harvesting and the desalination unit
Equivalent to the founding
concept of JCAP, the Joint
Center for Artificial Photo-
synthesis:
• Fully integrate energy
source and water splitting
unit
• The integrated system
eliminate energy
conversion losses
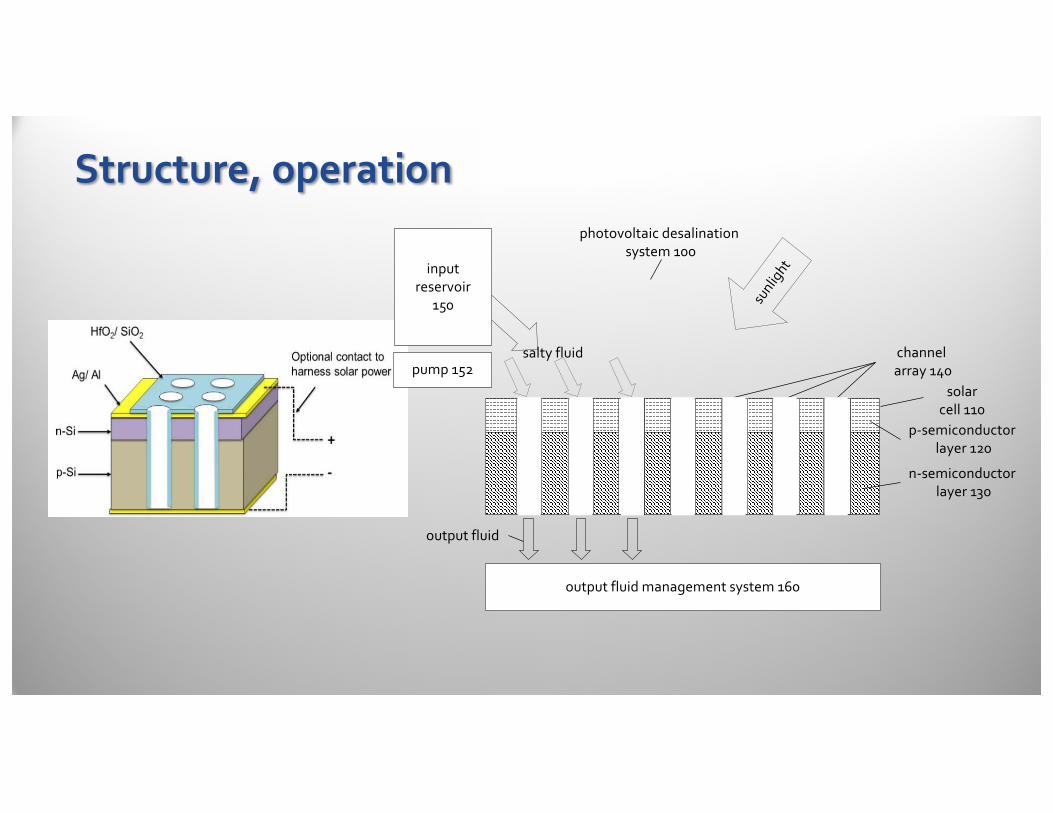
p-semiconductor
layer 120
n-semiconductor
layer 130
solar
cell 110
channel
array 140salty fluid
output fluid management system 160
photovoltaic desalination
system 100
output fluid
Structure, operation
input
reservoir
150
pump 152

Operation
FIG. 2C
electric double
layer EDLchannel 140i
---------
---------
---------
---++++++
++++++
++++++
+
+
+
+
-
-
-
-
-
-
-
-
+
+
+
+
n-layer 130
p-layer 120
- space charge
region in p-layer
+ space charge
region in n-layer
solar cell 110
-
+
+
-
+
-
+
-
+
-
-
+
+
-
+
-
+
-
salty fluid
reduced salinity
output fluid
---------
---------
---------
---++++++
++++++
++++++
+
+
+
+
-
-
-
-
-
-
-
-
+
+
+
+
• Incident sunlight
photogenerates +/– charges
in the p and n layers of the
PV cell
• +/- ions of saltwater, flowing
in channel through the p
and n layers get adsorbed to
the walls, salinity of output
water is reduced
• adsorbed ions are cyclically
flushed by blocking sunlight

Proof of concept: 1. Single type of charging: Nanochannel array in AAO
• drilled millions of 50-100 nm diameter channels into anodic aluminum oxide (AAO) layer
with metal assisted chemical etching, coated channel surfaces with insulating HfO2
• substantial reduction of salinity achieved

Proof of concept: 2. Nanochannel array in PV cells
• 50% reduction of salinity achieved
in few minutes under illumination
• channels need to be flushed
Rela%ve'output'ion'concentra%on'(%)'''''''''
40'''''''50''''''''''60'''''''''70''''''''''80'''''''''90''''''''100'
'0'''''''''''''5'''''''''''''10'''''''''''15'''''''''''20'''''''''''25''''''''''30'
Time'(min)'
ionconcentra%on(%)
%me(min)ISC SONADES: Nano-structured PV electrode.
• Drilled millions of 50-100 nm diameter channels
into Si PV cell with silver particle assisted
chemical etching
• Coated channel surfaces with insulating HfO2

Simulations
. Poisson’s and continuity
Hierarchical simulation infrastructure:
• Espresso platform for physics and
chemistry of adsorption at walls ~1nm
• Nernst-Planck inspire microfluidics, finite
element simulation with Openfoam
platform 50-500nm
• Effective medium theory for Stanford
simulations for meso- and macroscopic
device simulation

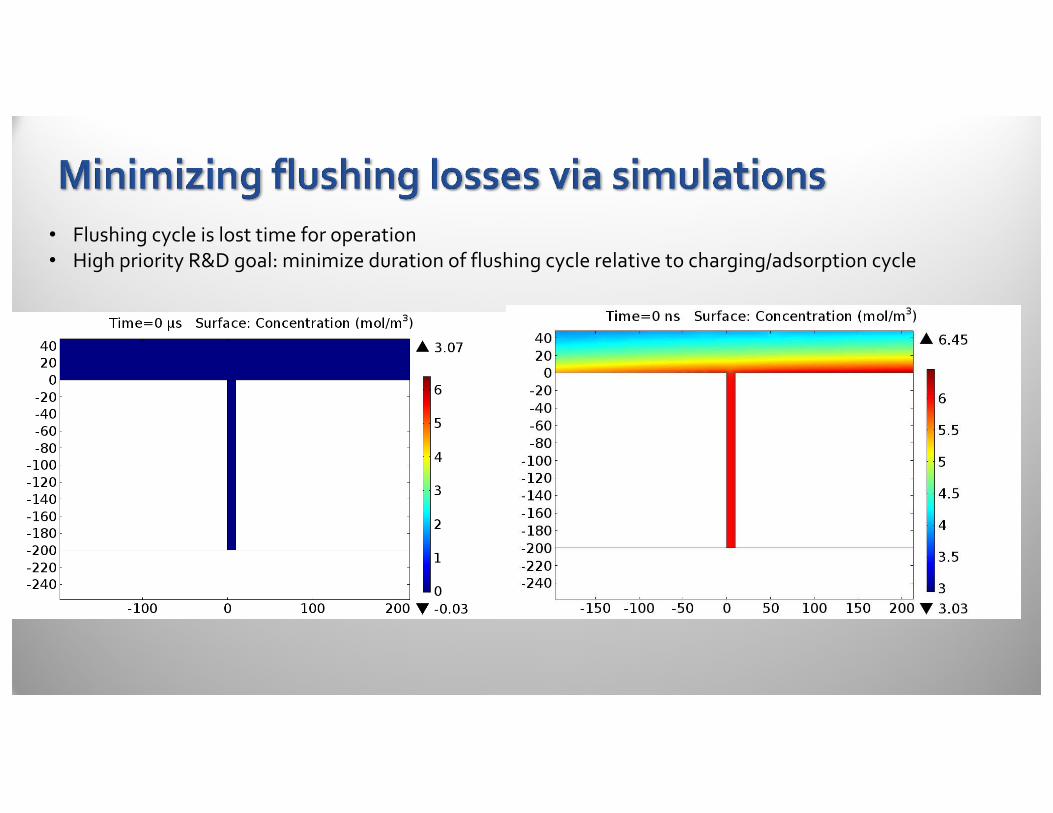
• Flushing cycle is lost time for operation
• High priority R&D goal: minimize duration of flushing cycle relative to charging/adsorption cycle


Discrete Solar Charging project is predictable to deliver high flow-rate
prototypes ready for scale-up in about 2 years
Integrated Solar Charging project is high risk-high reward,
eliminates energy conversion losses, promises to deliver efficient
prototypes in about 2 years
electrode
structure,
nano-channel
optimization
simulation,
effective
models
material
optimization
operations
modeling:
flushing
optimization
optimization
of photo-
voltaic energy
conversion


