Page 1
Materials 2012, 5, 721-740; doi:10.3390/ma5040721
materials ISSN 1996-1944
www.mdpi.com/journal/materials
Review
Micro-Imaging by Interference Microscopy: A Case Study of Orientation-Dependent Guest Diffusion in MFI-Type Zeolite Host Crystals
Laurent Gueudré 1, Tomas Binder 1, Christian Chmelik 1, Florian Hibbe 1, Douglas M. Ruthven 2
and Jörg Kärger 1,*
1 Department of Interface Physics, University of Leipzig, Leipzig 04109, Germany;
E-Mails: [email protected] (L.G.); [email protected] (T.B.);
[email protected] (C.C.); [email protected] (F.H.); 2 Department of Chemical and Biological Engineering, University of Maine, Orono, ME 04473,
USA; E-Mail: [email protected]
* Author to whom correspondence should be addressed; E-Mail: [email protected] ;
Tel.: +49-341-97-32502; Fax: +49-341-97-32549.
Received: 28 February 2012; in revised form: 10 April 2012 / Accepted: 13 April 2012 /
Published: 24 April 2012
Abstract: Because of the small particle size, orientation-dependent diffusion
measurements in microporous materials remains a challenging task. We highlight here the
potential of micro-imaging by interference microscopy in a case study with MFI-type
crystals in which, although with different accuracies, transient concentration profiles in all
three directions can be observed. The measurements, which were performed with
“rounded-boat” shaped crystals, reproduce the evolution patterns of the guest profiles
recorded in previous studies with the more common “coffin-shaped” MFI crystals. The
uptake and release patterns through the four principal faces (which in the coffin-shaped
crystals extend in the longitudinal direction) are essentially coincident and there is no
perceptible mass transfer in the direction of the long axis. The surface resistances of the
four crystal faces through which mass transfer occurs are relatively small and have only a
minor effect on the mass transfer rate. As a result of the pore structure, diffusion in the
crystallographic c direction (which corresponds to the direction of the long axis) is
expected to be much slower than in the transverse directions. This could explain the very
low rate of mass transfer observed in the direction of the long axis, but it is also possible
that the small end faces of the crystal may have high surface resistance. It is not possible to
OPEN ACCESS
Page 2
Materials 2012, 5
722
distinguish unequivocally between these two possibilities. All guest molecules studied
(methyl-butane, benzene and 4-methyl-2-pentyne) show the same orientation dependence
of mass transfer. The long 4-methyl-2-pentyne molecules would be expected to propagate
at very different rates through the straight and sinusoidal channels. The coinciding patterns
for uptake through the mutually perpendicular crystal faces therefore provide clear
evidence that both the coffin shaped crystals and the rounded-boat-shaped crystals
considered in this study, must be intergrowths rather than pure single crystals.
Keywords: MFI (mordenite framework inverted); diffusion; anisotropy; surface resistance;
interference microscopy
1. Introduction
Mass transfer is critically important for most of the technological applications of nanoporous
materials, including separation, catalysis, gas storage and sensing applications [1–5]. The exploration
of mass transfer rates for confined molecules is among the hot topics of current fundamental
research [6–8]. In many nanoporous materials the crystal structure is non-isotropic (non-cubic).
Structural anisotropy immediately gives rise to anisotropy in the guest mobilities. Consequently, mass
transfer in such materials must be characterized by a diffusion tensor, i.e., by three principal values and
the orientation of the tensor main axes, rather than by a single diffusivity. Since the positions of the
atoms forming the host lattice of such materials are known from X-ray diffraction [9–11] and since
there exist well established approaches for modeling the force field exerted on the guest molecules by
both the host lattice and other guest molecules [12–15], the exploration of diffusion anisotropy has
become a popular area for molecular dynamics simulations, especially for zeolites of structure types
MFI [16–23] and CHA [24,25].
In addition to attempts to predict the propagation rates in different directions from molecular
dynamics simulations, an alternative approach has been developed, based on structural considerations
that suggest that, in some nanoporous crystalline materials, the pore geometry should give rise to
well-defined interdependences between the rates of mass transfer in the different crystallographic
directions. Prominent examples of host systems in which this phenomenon of “structure-correlated
diffusion anisotropy” may be expected to occur include the zeolites of type MFI [26,27] and
CHA [28]. Also here, corroboration from molecular dynamics simulations turned out to be most
valuable for determining the conditions under which the resulting correlation rules are applicable. For
example, in such simulations, the correlation rules were found to hold for small hydrocarbons in
MFI [16,20], including even for multicomponent diffusion [21], while for water in chabazite [24,25] or
long-chain paraffins in MFI [23], due to specific host-guest interactions, deviations from these simple
rules are to be expected.
It is important to note, however, that these detailed predictions from molecular dynamics
simulations of diffusion anisotropy in zeolites have generally not been confirmed by experimental
studies. This is particularly true for MFI-type zeolites which generally have a twin structure, i.e., the
crystals are intergrowths rather than genuine single crystals. Kocirik and co-workers [29] confirmed
Page 3
Materials 2012, 5
723
the form of this sub-structure by demonstrating that iodine distributes rapidly along the interfaces
between the different sub-sections. After treating with alkaline hydrogen peroxide solution at elevated
temperatures and ultrasound, Schmidt et al. [30] were able to break the intergrowths into their
individual segments, which showed a coherent crystal structure [31].
Interestingly, the deviations from ideal single-crystalline morphology obviously did not affect
the first pulsed field gradient nuclear magnetic resonance (PFG NMR) studies of diffusion
anisotropy [32,33]. Analysis of the measurements on the basis of the correlation rule of diffusion
anisotropy in MFI-type zeolites [26,27] yielded self-consistent results. This may be understood by
realizing that the diffusion path lengths covered in these studies were of the order of only a few
micrometers. Therefore most of the observed diffusion paths remained within the same subunit, which
is effectively a structurally homogeneous single crystal.
The most important conclusion from these early PFG NMR studies is that diffusion in the direction
of the longitudinal extension of the crystals was found to be much slower than in the perpendicular
directions. This finding is consistent with the general assumption that, in the typically coffin-shaped
MFI-type crystals, the channel pores (the sinusoidal and straight channels) are directed perpendicular
to the longitudinal crystal extension so that transport in the longitudinal direction has to occur by
alternating periods of travel through straight and sinusoidal segments. The required changes of
direction at the channel intersections are rate-limiting and lead to a reduction in the diffusivity by a
factor (referred to as the anisotropy factor) of about 5 [26].
Similarly, in uptake measurements with crystals embedded in sputtered copper [34], uptake in the
transverse direction, i.e., through the large crystal faces, was found to give rise to substantially larger
diffusivities than uptake in the longitudinal direction (as observed for crystals embedded vertically). In
this case, the anisotropy factor was found to be about three.
Orientation-dependent diffusivities may also be determined from single-crystal permeation
studies [35–37]. In these measurements, single MFI-type crystals are embedded within an otherwise
impermeable membrane. Since the crystals are oriented with their longitudinal extension perpendicular
to the plane of the membrane, the permeation rate yields the diffusivity in that direction. For several
systems for which comparative data are available, the mean diffusivity values derived from the
membrane measurements do not differ significantly from the mean values of the diffusivities
determined from macroscopic rate measurements (for example by the ZLC technique) [38–41] which
measure the average diffusivity in all directions. There is a good deal of scatter but these data do not
provide any real indication of the expected anisotropy.
Single-crystal micro-imaging by interference microscopy has provided us with a new tool for
observing diffusion anisotropy. It makes it possible to follow the evolution of transient concentration
profiles by recording the time dependence of the integral over local intracrystalline concentrations in
the observation direction which, for crystals of constant thickness, may also be interpreted as the mean
value of the intracrystalline concentration in the observation direction. In this way, one obtains
two-dimensional maps of these concentration integrals (or: mean concentrations) and their variation
with time. In a typical experiment, molecular uptake or release, in response to a well-defined pressure
step, is followed. However, it is also possible to follow the response to any other variation in the
external pressure, including the so-called partial loading experiments [42–44] where the first pressure
Page 4
Materials 2012, 5
724
step is followed by a second one which is applied before the crystal under study has equilibrated with
the surrounding gas phase [45].
The measurement of integrals, rather than of local concentrations, does not impose any restriction in
the viability of this technique provided that, in the system under study, mass transfer is confined to the
directions perpendicular to the observation direction. In this case, the integral in the observation direction
degenerates to the simple product of the local concentration and the crystal thickness. The excellent
measuring conditions provided in such situations have been extensively exploited by considering
nanoporous materials with pore systems extended in either one [45–50] or two [51,52] dimensions.
In three-dimensional pore networks, mass transfer generally occurs also in the observation
direction. Under these conditions, the determination of local concentrations from the concentration
integrals becomes an “ill-posed” problem. In very detailed studies with MFI type zeolites [53–55] the
underlying diffusivities and transport resistances were determined by looking for the best fit
between the experimentally-determined concentration integrals and corresponding solutions of the
diffusion equation.
Information on the local concentrations becomes more reliably accessible if, in addition to the
concentration integrals recorded during a given transient sorption experiment, the same experiment is
repeated with the crystal in a different crystallographic orientation. The benefit of such studies has
been demonstrated with zeolite crystals of type SAPO STA-7 [56,57] where local molecular
concentrations during molecular uptake could be reliably extracted from the concentration integrals in
two different observation directions.
As a result of similar studies with coffin-shaped MFI-type zeolites [58], the concentration integrals
during molecular uptake were found to be essentially the same for any of the four possible positions in
which the crystals could be placed within the adsorption cell, providing clear evidence that the
individual zeolite particles, though appearing as single crystals, were twinned intergrowths.
From detailed studies using fluorescence microscopy [59,60], the intergrowth structure of MFI-type
zeolites is known to depend on the conditions during crystallization. This finding suggests that there is
no a-priori limitation that prohibits the synthesis of structurally coherent MFI-type crystals. Being able
to measure orientation-dependent diffusivities, interference microscopy has a unique position among
the techniques applicable in the search for such materials. As a case study, the present communication
reports the results of micro-imaging studies with a class of MFI type crystals which, by following a
procedure reported in references [61–63], may be synthesized as particles which allow the novel
possibility of observing the concentration integrals in all three directions.
The benefit of these novel options and the associated surplus in information appears in an impressive
diversity of the thus accessible transient concentration profiles of guest molecules during uptake and
release illustrating, in unprecedented clarity, the interplay of the transport resistances in the intracrystalline
pore space and on the crystal boundary, and the impact of their concentration dependences.
Page 5
Materials 2012, 5
725
2. Experimental Section
2.1. Synthesis
Following the recipe published in [61], the MFI-type crystals used in this study were synthesized
with a TPA-silicalite-1-precursor sol prepared by hydrolyzing a silicon source (Aerosil 130) with a
structuring agent (tetrapropylammonium bromide) and a complexing agent (benzene-1,2-diol) in
water, yielding the relation 60 SiO2/12 TPABr/15 NaOH/24 benzene-1,2-diol/1800 H2O. The sol was
subsequently heated in an autoclave up to 433 K and kept there for 7 days without stirring. The
hydrolyzed solution was filtered through a filter membrane (nominal pore size 0.2 µm). The template
was removed from the micropore by calcination in O2/air mixture at 50/50 at 823 K for 12 h. No
additional treatment (including surface leaching) was performed prior to the calcination.
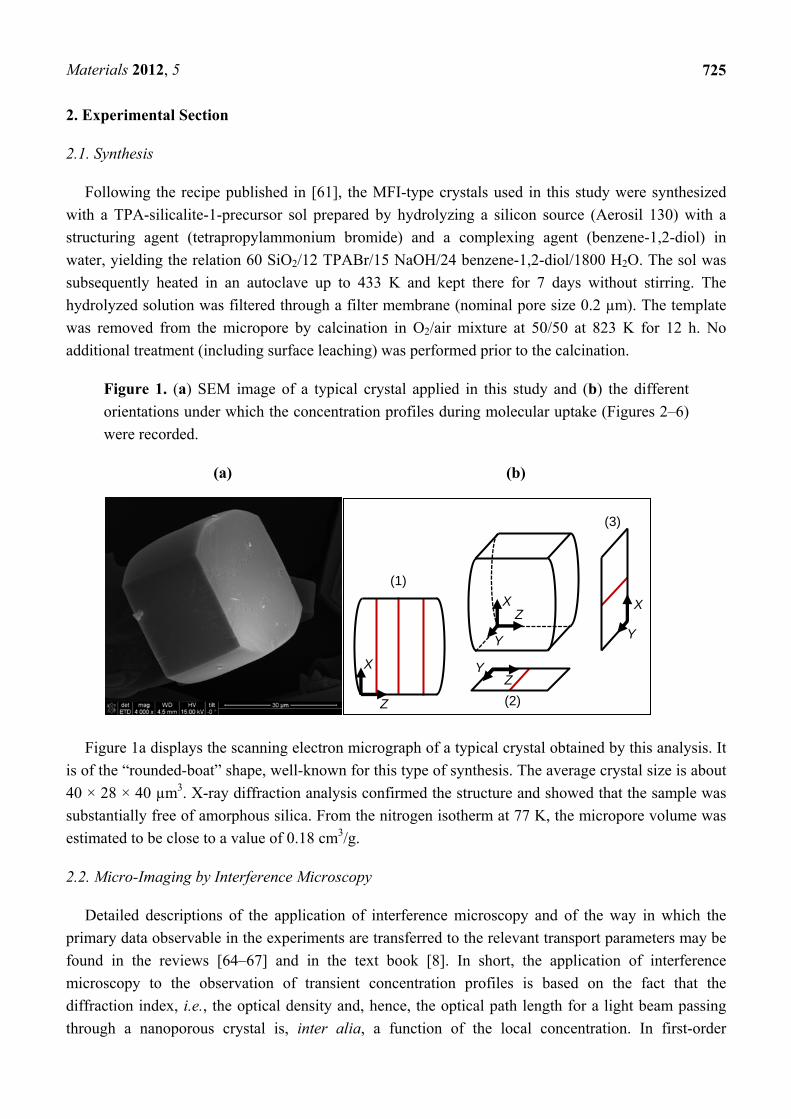
Figure 1. (a) SEM image of a typical crystal applied in this study and (b) the different
orientations under which the concentration profiles during molecular uptake (Figures 2–6)
were recorded.
(a) (b)
Figure 1a displays the scanning electron micrograph of a typical crystal obtained by this analysis. It
is of the “rounded-boat” shape, well-known for this type of synthesis. The average crystal size is about
40 × 28 × 40 µm3. X-ray diffraction analysis confirmed the structure and showed that the sample was
substantially free of amorphous silica. From the nitrogen isotherm at 77 K, the micropore volume was
estimated to be close to a value of 0.18 cm3/g.
2.2. Micro-Imaging by Interference Microscopy
Detailed descriptions of the application of interference microscopy and of the way in which the
primary data observable in the experiments are transferred to the relevant transport parameters may be
found in the reviews [64–67] and in the text book [8]. In short, the application of interference
microscopy to the observation of transient concentration profiles is based on the fact that the
diffraction index, i.e., the optical density and, hence, the optical path length for a light beam passing
through a nanoporous crystal is, inter alia, a function of the local concentration. In first-order
X
Y
(3)
Z
X
(1)
YZ(2)
XZ
Y
Page 6
Materials 2012, 5
726
approximation the optical density can be assumed to vary linearly with the local concentration. Hence,
any change in local concentration leads to changes in the optical path length and, hence, in the phase of
the light beam passing through the crystal. These changes are recorded by observing the interference
patterns with light passing through the surrounding atmosphere (which, for observation of interference,
must be coherent with the light passing through the crystal). Changes in the interference patterns
may therefore be related directly, by an appropriate computer program, to the changes in the
concentration integral.
We refer to Figure 1 to visualize the attainable information. Considering that, within the optical
(and sorption!) cell, the crystal is positioned with its XZ plane on the bottom (scheme (1) in Figure 1b),
the observation direction of microscopy is along the crystal Y coordinate. The primary data provided
by interference microscopy are therefore, except for a constant, unknown factor of proportionality, the
changes in the concentration integral: , , , (1)
or, for constant crystal thickness completely equivalently, the mean concentration <c(X, Z)>Y along
this direction. We have used the notations c(X, Y, Z) for the local concentrations at positions X, Y, Z of
a given crystal and LY for the crystal thickness in Y direction. In the plane perpendicular to the
observation direction, the concentration integral or the mean concentration (in the case referred to as
CY(X,Z) or <c(X, Z)>Y, respectively) may be determined with a spatial resolution (∆X, ∆Z) of
about 0.5 μm.
Instead of representing the evolution of the measured concentration integral over the whole plane of
observation (i.e., in the selected case, of CY(X,Z,t) or <c(X, Z)>Y over the complete XZ plane), for the
sake of clarity we confine ourselves to cross-sections through the “landscape” of concentration
integrals, i.e., to plotting the profiles along only certain lines. The straight lines shown in Figure 1b
indicate the lines along which the concentration integrals shown in Figure 2–6 have been determined.
To obtain the diffusivities and permeabilities in different directions X, Y, Z (see Figure 1b), the
crystal under study must be flipped at least once, with exactly the same adsorption and desorption
cycle being applied in each orientation. Due to the curved shape of the corresponding crystal face,
(Figure 1b) experiments recording the concentration profiles in the XY-plane are particularly
demanding. In addition to the instability of this crystal position, the analysis of the concentration
profiles is also complicated by the varying crystal thickness LZ and the occurrence of light diffraction
and scattering. Therefore, except for Figure 4 which demonstrates the feasibility of investigating the
evolution of concentration profiles in this XY-plane for methyl-butane, we confined ourselves to the
measurement of transient profiles in the XZ- and YZ-planes.
To correlate the measured concentration integrals with the transport parameters giving rise to the
observed behavior, the general solution of the appropriate form of the diffusion equation (Fick’s 2nd
law) for a model crystal is used, including surface resistances and the corresponding boundary
conditions. In crystal X direction, e.g., the corresponding relations are: , , , , , , (2)
Page 7
Materials 2012, 5
727
and
, , , 0 , , , (3)
where we have assumed that the particle under study may be considered to behave as a single crystal.
The diffusivity (i.e., the principal tensor element) in crystal X direction is DX and αX denotes the
permeability through the two crystal faces perpendicular to the X direction (which are assumed to
coincide). Further on, notably for large pressure steps covering a large range of intracrystalline
concentration during uptake (release), both the diffusivities and the surface permeabilities may need to
be considered as concentration dependent. For this purpose, the two-parameter equations
D(c) = Dc=0 (1+ ca), α(c) = αc=0 (1+ cb) (4)
are found to provide a useful approximation.
The relevant parameter set is determined from the best fit of the model calculations to the measured
concentration integrals, in particular to their time dependence as observed over different pressure steps,
including uptake and release. Clearly, only a small fraction of the parameters can be determined with
sufficient accuracy by such a procedure but the parameters that can be found are exactly those that
control the mass transfer rates in different directions.
2.3. The Guest Molecules under Study
The measurements have been performed with benzene, methyl-butane and 4-methyl-2-pentyne as
guest molecules. Benzene is one of the “guinea pigs” used in numerous diffusion studies with
MFI-type zeolites [41,68–76]. In contrast to n-alkanes where the diffusivities obtained by different
research groups reveal order-of-magnitude differences (see reference [8], Section 18.2.1), the benzene
diffusivities obtained in these studies are essentially similar, yielding, at room temperature, corrected
diffusivities of ≈ 1 … 6 × 10⁻¹⁴ m2 s−1 (see reference [8], Section 18.3.1).
In previous IFM (interference microscopy) diffusion studies [58] methyl-butane was found to serve
as an excellent probe molecule for the recording of transient concentration profiles. For crystal sizes
typically about 10 μm, the measured intracrystalline diffusivity of 1–3 × 10⁻¹³ m2 s−1, i.e., about one
order of magnitude greater than the benzene diffusivities, turned out to allow the recording of several
subsequent, still well-distinguished concentration profiles during molecular uptake and release, with
minimal expenditure of time. As a consequence of the limited time resolution (20 seconds per profile
under the given conditions), with any further increase of the diffusivity (e.g., with methyl-propane
[58]) the number of profiles which may be recorded during uptake or release is reduced.
While both benzene and methyl-butane are bulky molecules which are expected to propagate by a
jump-like movement between the channel intersections, the third probe molecule, 4-methyl-2-pentyne,
is of rod-like structure. Following the investigations by Rees et al. [68,69], the diffusion of rod-like
molecules in the straight channels of MFI-type zeolites is expected to be notably faster than in the
sinusoidal channels. It is for this reason that 4-methyl-2-pentyne was included in our studies.
Page 8
Materials 2012, 5
728
3. Results and Discussion
The measurement results are presented as selected (1D) concentration profiles through the three
possible different planes of observation, taken along the lines shown in Figure 1b. The data points are
compared with the corresponding solutions of Fick’s 2nd law, Equation 2, with the boundary
condition, Equation 3. The full lines represent the solutions yielding the best fit to the experimental
data points, determined under the simplifying condition of constancy of the transport parameters D and
α. Table 1 provides a summary of these values.
Table 1. Diffusion coefficients D and surface permeabilities α at room temperature
(≈ 295 K) for methyl-butane, benzene and 4-methyl-2-pentyne as guest molecules in the
rounded-boat-shaped crystals of silicalite considered in this study. The given numbers are
obtained from best fits of the solution of Fick’s 2nd law to the experimental data (full lines
in Figures 2–6), determined separately for adsorption and desorption under the assumption
of a negligibly small concentration dependence of D and α. Except for 4-methyl-2-pentyne,
the diffusivities and surface permeabilities in X and Y direction are assumed to coincide.
Ads/Des, pressure (mbar) Direction D (m2 s−1) α (m s−1)
Methyl-butane Ads, 0–1 X,Y 2.4 × 10⁻¹³ 1.5 × 10⁻⁷
Des, 1–0 X,Y 2.6 × 10⁻¹³ 5.0 × 10⁻⁸
Benzene Ads, 0–0.5 X,Y 1.5 × 10⁻¹⁴ 9.5 × 10⁻⁹
Des, 1–0 X,Y 1.4 × 10⁻¹⁴ 7.0 × 10⁻⁹
4-Methyl-2-pentyne Des, 1–0 X 4.4 × 10−13 1.9 × 10⁻⁸
Des, 1–0 Y 5.2 × 10⁻¹³ 1.3 × 10⁻⁸
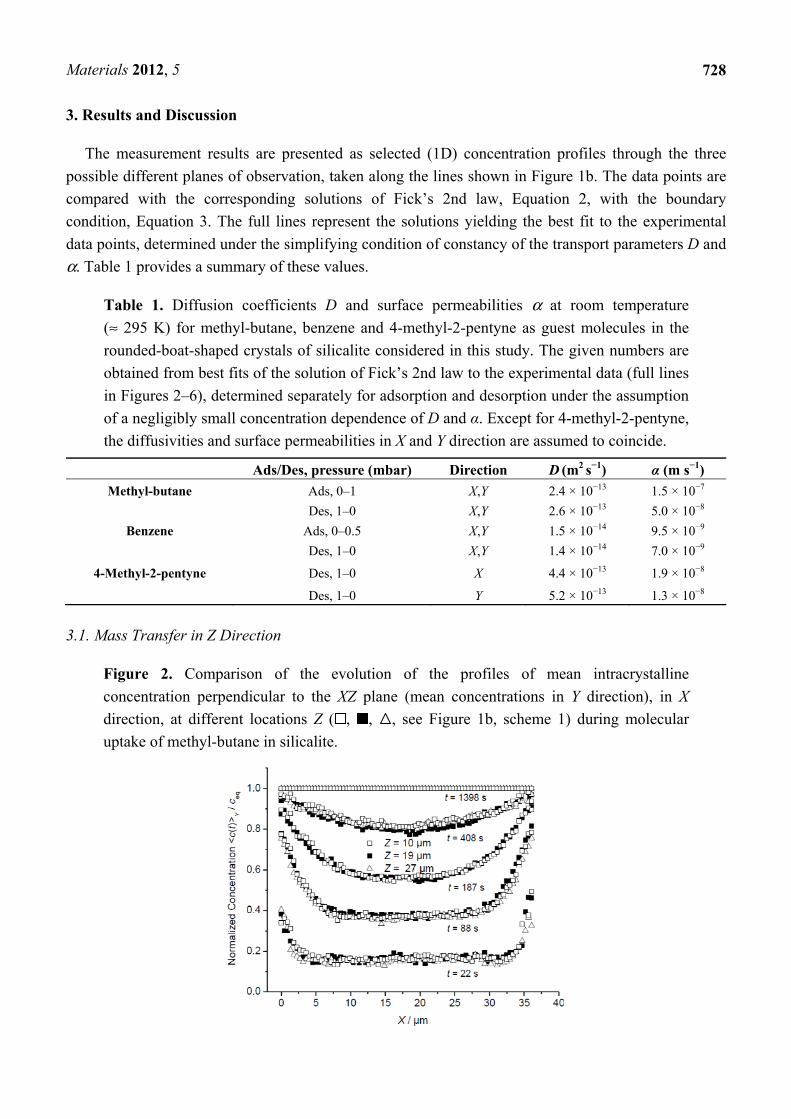
3.1. Mass Transfer in Z Direction
Figure 2. Comparison of the evolution of the profiles of mean intracrystalline
concentration perpendicular to the XZ plane (mean concentrations in Y direction), in X
direction, at different locations Z ( , , , see Figure 1b, scheme 1) during molecular
uptake of methyl-butane in silicalite.
Page 9
Materials 2012, 5
729
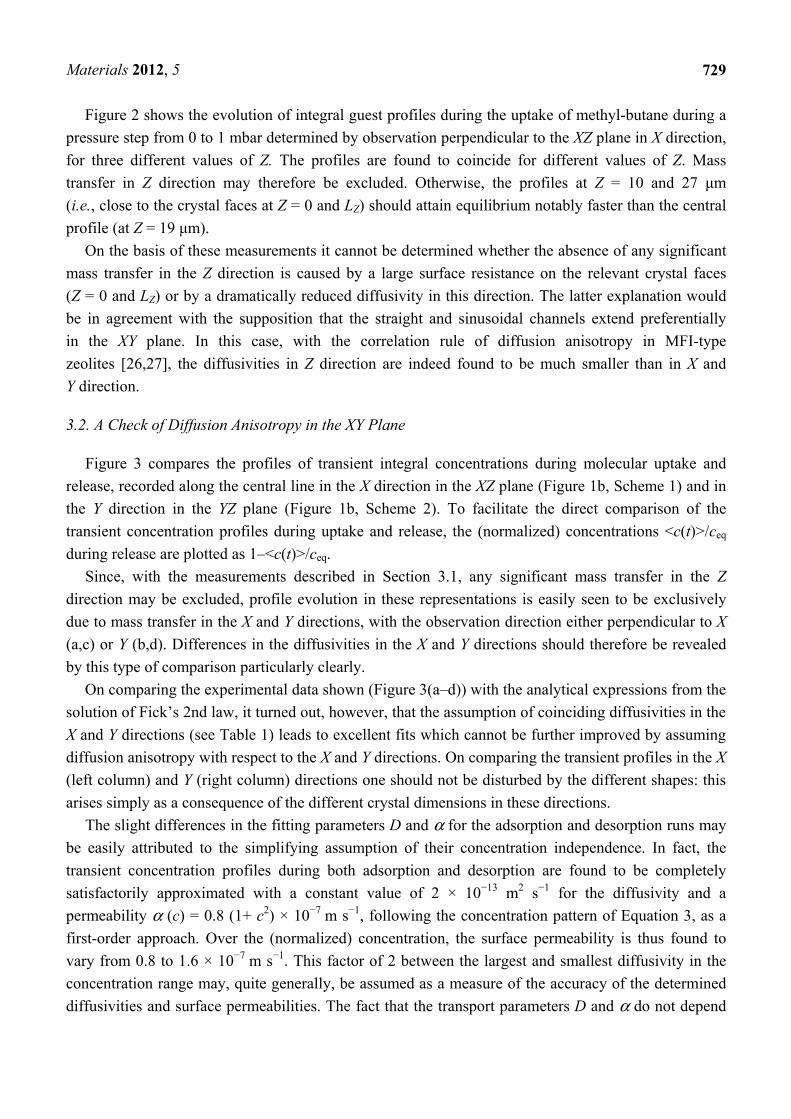
Figure 2 shows the evolution of integral guest profiles during the uptake of methyl-butane during a
pressure step from 0 to 1 mbar determined by observation perpendicular to the XZ plane in X direction,
for three different values of Z. The profiles are found to coincide for different values of Z. Mass
transfer in Z direction may therefore be excluded. Otherwise, the profiles at Z = 10 and 27 μm
(i.e., close to the crystal faces at Z = 0 and LZ) should attain equilibrium notably faster than the central
profile (at Z = 19 μm).
On the basis of these measurements it cannot be determined whether the absence of any significant
mass transfer in the Z direction is caused by a large surface resistance on the relevant crystal faces
(Z = 0 and LZ) or by a dramatically reduced diffusivity in this direction. The latter explanation would
be in agreement with the supposition that the straight and sinusoidal channels extend preferentially
in the XY plane. In this case, with the correlation rule of diffusion anisotropy in MFI-type
zeolites [26,27], the diffusivities in Z direction are indeed found to be much smaller than in X and
Y direction.
3.2. A Check of Diffusion Anisotropy in the XY Plane
Figure 3 compares the profiles of transient integral concentrations during molecular uptake and
release, recorded along the central line in the X direction in the XZ plane (Figure 1b, Scheme 1) and in
the Y direction in the YZ plane (Figure 1b, Scheme 2). To facilitate the direct comparison of the
transient concentration profiles during uptake and release, the (normalized) concentrations <c(t)>/ceq
during release are plotted as 1–<c(t)>/ceq.
Since, with the measurements described in Section 3.1, any significant mass transfer in the Z
direction may be excluded, profile evolution in these representations is easily seen to be exclusively
due to mass transfer in the X and Y directions, with the observation direction either perpendicular to X
(a,c) or Y (b,d). Differences in the diffusivities in the X and Y directions should therefore be revealed
by this type of comparison particularly clearly.
On comparing the experimental data shown (Figure 3(a–d)) with the analytical expressions from the
solution of Fick’s 2nd law, it turned out, however, that the assumption of coinciding diffusivities in the
X and Y directions (see Table 1) leads to excellent fits which cannot be further improved by assuming
diffusion anisotropy with respect to the X and Y directions. On comparing the transient profiles in the X
(left column) and Y (right column) directions one should not be disturbed by the different shapes: this
arises simply as a consequence of the different crystal dimensions in these directions.
The slight differences in the fitting parameters D and α for the adsorption and desorption runs may
be easily attributed to the simplifying assumption of their concentration independence. In fact, the
transient concentration profiles during both adsorption and desorption are found to be completely
satisfactorily approximated with a constant value of 2 × 10⁻¹³ m2 s−1 for the diffusivity and a
permeability α (c) = 0.8 (1+ c2) × 10−7 m s−1, following the concentration pattern of Equation 3, as a
first-order approach. Over the (normalized) concentration, the surface permeability is thus found to
vary from 0.8 to 1.6 × 10⁻⁷ m s−1. This factor of 2 between the largest and smallest diffusivity in the
concentration range may, quite generally, be assumed as a measure of the accuracy of the determined
diffusivities and surface permeabilities. The fact that the transport parameters D and α do not depend
Page 10
Materials 2012, 5
730
significantly, if at all, on concentration is revealed already by the similar shapes of the intracrystalline
concentration profiles during uptake (top of Figure 3) and release (bottom of Figure 3).
Figure 3. Profiles of mean concentrations during uptake (a,b) and release (c,d) of
methyl-butane observed perpendicular to the XZ plane along X (a,c, Figure 1b, Scheme 1,
central line) and perpendicular to the YZ plane along Y (b,d, Figure 1b, Scheme 2) and
comparison with the solution of Fick’s 2nd law with the diffusivities and surface
permeabilities given in Table 1 (solid lines).
(a) (b)
(c) (d)
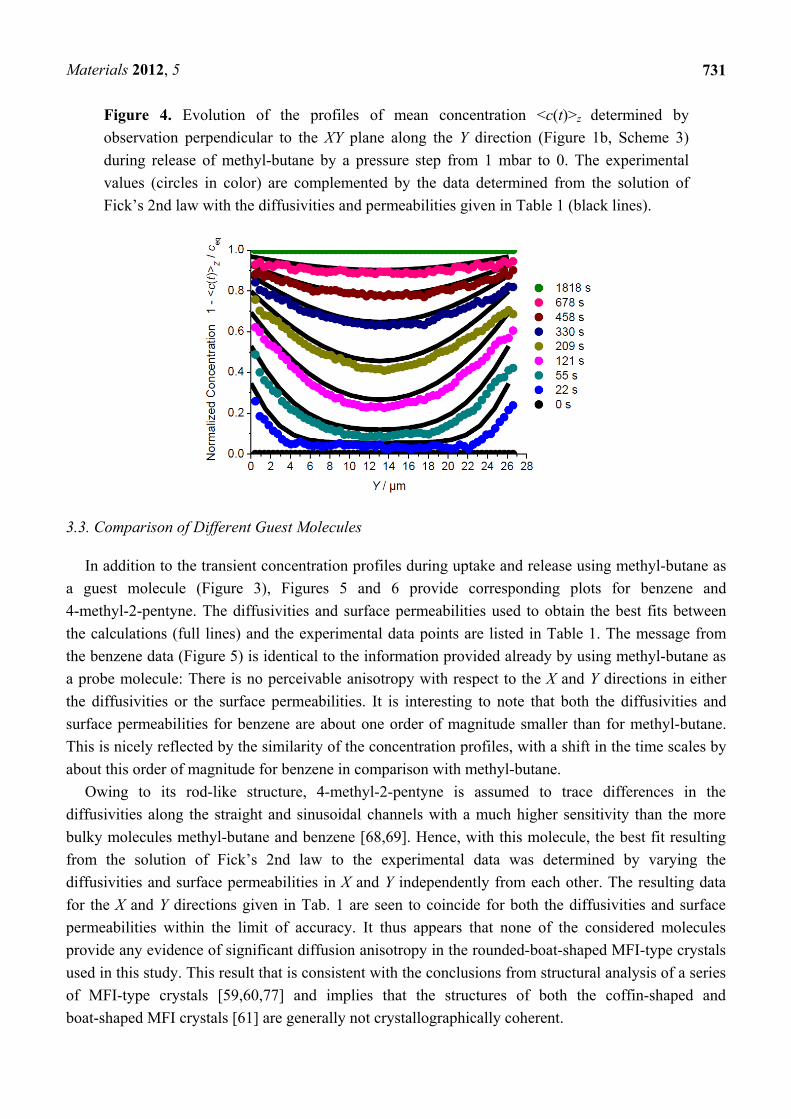
As an example of transient sorption experiments recorded by observation along the third direction,
Figure 4 shows the profiles during methyl-butane release under the conditions considered in
Figure 3b,d. The curvature of the crystal surface perpendicular to observation direction gave rise to a
much lower accuracy of the profiles. However, also in this case, the values determined from the
analytical solution of Fick’s 2nd law with the data given in Table 1 (black full lines) are found to
satisfactorily approximate to the measured values.
Page 11
Materials 2012, 5
731
Figure 4. Evolution of the profiles of mean concentration <c(t)>z determined by
observation perpendicular to the XY plane along the Y direction (Figure 1b, Scheme 3)
during release of methyl-butane by a pressure step from 1 mbar to 0. The experimental
values (circles in color) are complemented by the data determined from the solution of
Fick’s 2nd law with the diffusivities and permeabilities given in Table 1 (black lines).
3.3. Comparison of Different Guest Molecules
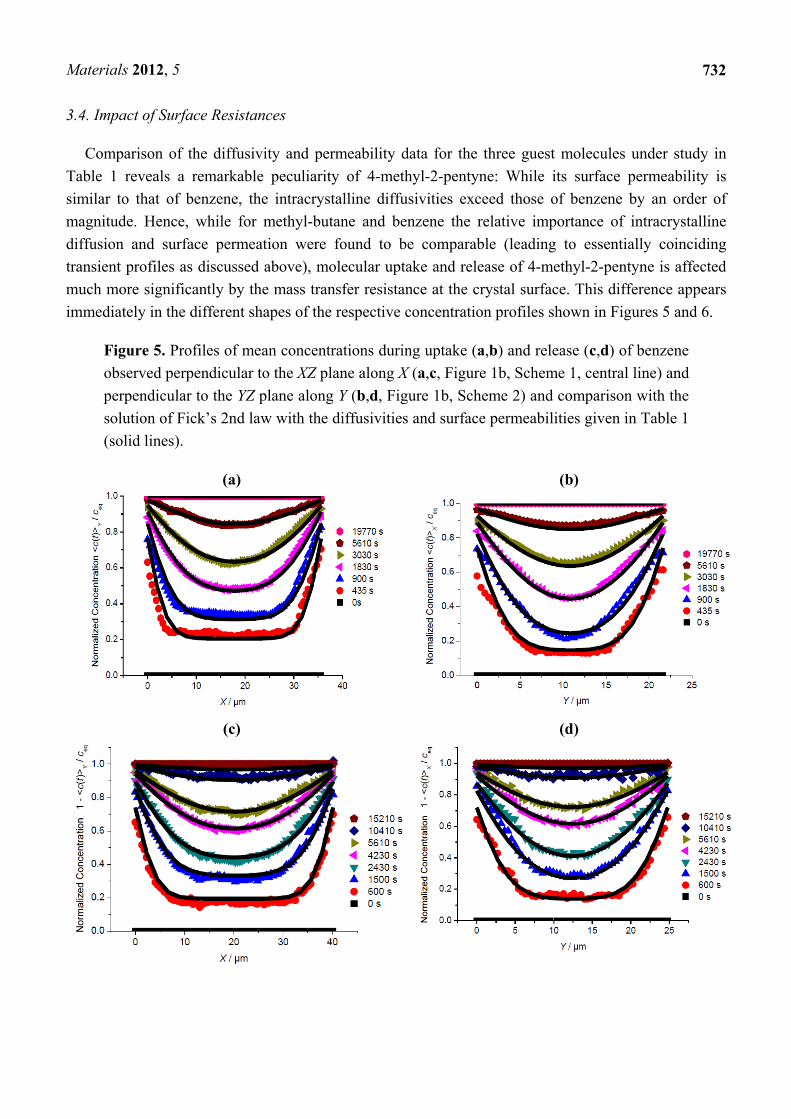
In addition to the transient concentration profiles during uptake and release using methyl-butane as
a guest molecule (Figure 3), Figures 5 and 6 provide corresponding plots for benzene and
4-methyl-2-pentyne. The diffusivities and surface permeabilities used to obtain the best fits between
the calculations (full lines) and the experimental data points are listed in Table 1. The message from
the benzene data (Figure 5) is identical to the information provided already by using methyl-butane as
a probe molecule: There is no perceivable anisotropy with respect to the X and Y directions in either
the diffusivities or the surface permeabilities. It is interesting to note that both the diffusivities and
surface permeabilities for benzene are about one order of magnitude smaller than for methyl-butane.
This is nicely reflected by the similarity of the concentration profiles, with a shift in the time scales by
about this order of magnitude for benzene in comparison with methyl-butane.
Owing to its rod-like structure, 4-methyl-2-pentyne is assumed to trace differences in the
diffusivities along the straight and sinusoidal channels with a much higher sensitivity than the more
bulky molecules methyl-butane and benzene [68,69]. Hence, with this molecule, the best fit resulting
from the solution of Fick’s 2nd law to the experimental data was determined by varying the
diffusivities and surface permeabilities in X and Y independently from each other. The resulting data
for the X and Y directions given in Tab. 1 are seen to coincide for both the diffusivities and surface
permeabilities within the limit of accuracy. It thus appears that none of the considered molecules
provide any evidence of significant diffusion anisotropy in the rounded-boat-shaped MFI-type crystals
used in this study. This result that is consistent with the conclusions from structural analysis of a series
of MFI-type crystals [59,60,77] and implies that the structures of both the coffin-shaped and
boat-shaped MFI crystals [61] are generally not crystallographically coherent.
Page 12
Materials 2012, 5
732
3.4. Impact of Surface Resistances
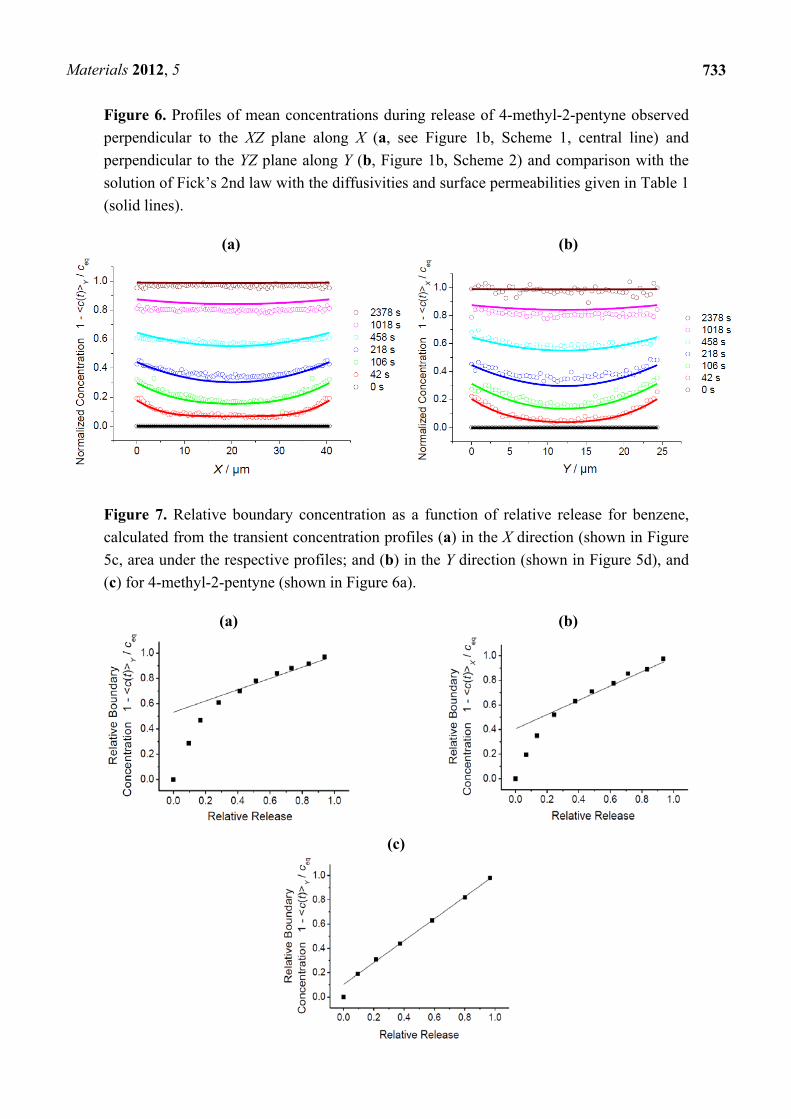
Comparison of the diffusivity and permeability data for the three guest molecules under study in
Table 1 reveals a remarkable peculiarity of 4-methyl-2-pentyne: While its surface permeability is
similar to that of benzene, the intracrystalline diffusivities exceed those of benzene by an order of
magnitude. Hence, while for methyl-butane and benzene the relative importance of intracrystalline
diffusion and surface permeation were found to be comparable (leading to essentially coinciding
transient profiles as discussed above), molecular uptake and release of 4-methyl-2-pentyne is affected
much more significantly by the mass transfer resistance at the crystal surface. This difference appears
immediately in the different shapes of the respective concentration profiles shown in Figures 5 and 6.
Figure 5. Profiles of mean concentrations during uptake (a,b) and release (c,d) of benzene
observed perpendicular to the XZ plane along X (a,c, Figure 1b, Scheme 1, central line) and
perpendicular to the YZ plane along Y (b,d, Figure 1b, Scheme 2) and comparison with the
solution of Fick’s 2nd law with the diffusivities and surface permeabilities given in Table 1
(solid lines).
(a) (b)
(c) (d)
Page 13
Materials 2012, 5
733
Figure 6. Profiles of mean concentrations during release of 4-methyl-2-pentyne observed
perpendicular to the XZ plane along X (a, see Figure 1b, Scheme 1, central line) and
perpendicular to the YZ plane along Y (b, Figure 1b, Scheme 2) and comparison with the
solution of Fick’s 2nd law with the diffusivities and surface permeabilities given in Table 1
(solid lines).
(a) (b)
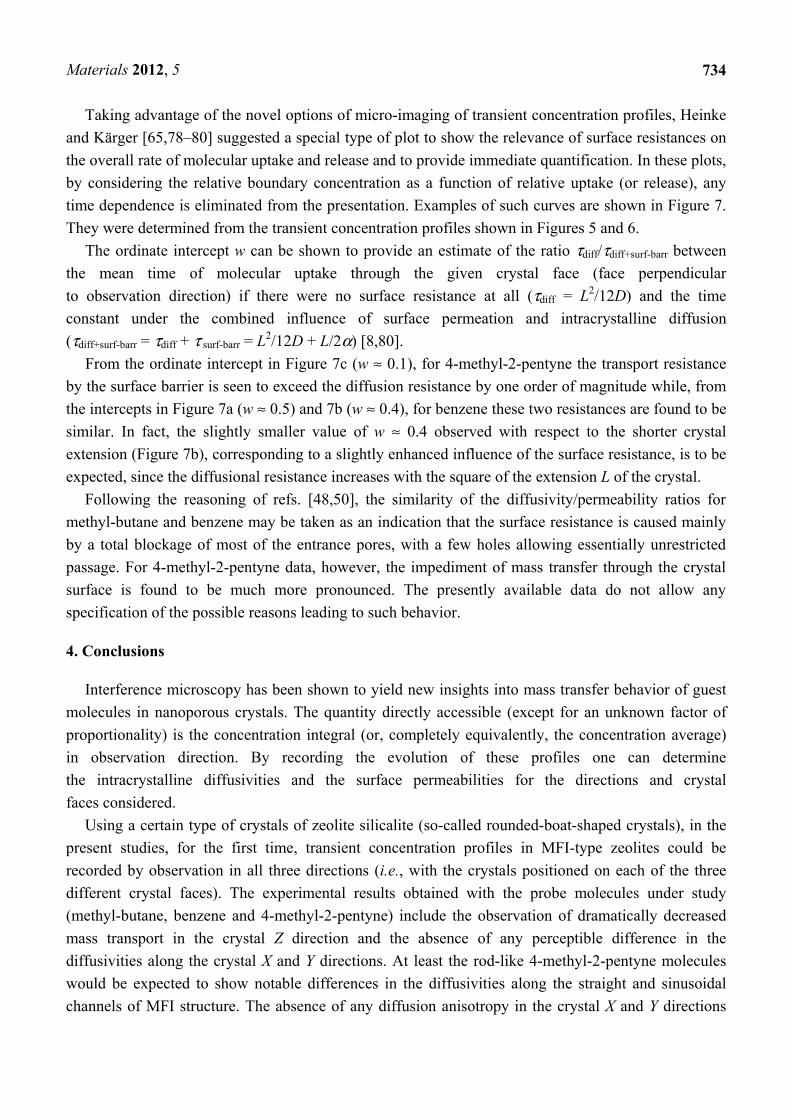
Figure 7. Relative boundary concentration as a function of relative release for benzene,
calculated from the transient concentration profiles (a) in the X direction (shown in Figure
5c, area under the respective profiles; and (b) in the Y direction (shown in Figure 5d), and
(c) for 4-methyl-2-pentyne (shown in Figure 6a).
(a) (b)
(c)
Page 14
Materials 2012, 5
734
Taking advantage of the novel options of micro-imaging of transient concentration profiles, Heinke
and Kärger [65,78–80] suggested a special type of plot to show the relevance of surface resistances on
the overall rate of molecular uptake and release and to provide immediate quantification. In these plots,
by considering the relative boundary concentration as a function of relative uptake (or release), any
time dependence is eliminated from the presentation. Examples of such curves are shown in Figure 7.
They were determined from the transient concentration profiles shown in Figures 5 and 6.
The ordinate intercept w can be shown to provide an estimate of the ratio τdiff/τdiff+surf-barr between
the mean time of molecular uptake through the given crystal face (face perpendicular
to observation direction) if there were no surface resistance at all (τdiff = L2/12D) and the time
constant under the combined influence of surface permeation and intracrystalline diffusion
(τdiff+surf-barr = τdiff + τ surf-barr = L2/12D + L/2α) [8,80].
From the ordinate intercept in Figure 7c (w ≈ 0.1), for 4-methyl-2-pentyne the transport resistance
by the surface barrier is seen to exceed the diffusion resistance by one order of magnitude while, from
the intercepts in Figure 7a (w ≈ 0.5) and 7b (w ≈ 0.4), for benzene these two resistances are found to be
similar. In fact, the slightly smaller value of w ≈ 0.4 observed with respect to the shorter crystal
extension (Figure 7b), corresponding to a slightly enhanced influence of the surface resistance, is to be
expected, since the diffusional resistance increases with the square of the extension L of the crystal.
Following the reasoning of refs. [48,50], the similarity of the diffusivity/permeability ratios for
methyl-butane and benzene may be taken as an indication that the surface resistance is caused mainly
by a total blockage of most of the entrance pores, with a few holes allowing essentially unrestricted
passage. For 4-methyl-2-pentyne data, however, the impediment of mass transfer through the crystal
surface is found to be much more pronounced. The presently available data do not allow any
specification of the possible reasons leading to such behavior.
4. Conclusions
Interference microscopy has been shown to yield new insights into mass transfer behavior of guest
molecules in nanoporous crystals. The quantity directly accessible (except for an unknown factor of
proportionality) is the concentration integral (or, completely equivalently, the concentration average)
in observation direction. By recording the evolution of these profiles one can determine
the intracrystalline diffusivities and the surface permeabilities for the directions and crystal
faces considered.
Using a certain type of crystals of zeolite silicalite (so-called rounded-boat-shaped crystals), in the
present studies, for the first time, transient concentration profiles in MFI-type zeolites could be
recorded by observation in all three directions (i.e., with the crystals positioned on each of the three
different crystal faces). The experimental results obtained with the probe molecules under study
(methyl-butane, benzene and 4-methyl-2-pentyne) include the observation of dramatically decreased
mass transport in the crystal Z direction and the absence of any perceptible difference in the
diffusivities along the crystal X and Y directions. At least the rod-like 4-methyl-2-pentyne molecules
would be expected to show notable differences in the diffusivities along the straight and sinusoidal
channels of MFI structure. The absence of any diffusion anisotropy in the crystal X and Y directions
Page 15
Materials 2012, 5
735
must therefore be taken as an indication that the rounded-boat-shaped MFI-type crystals under study
are intergrowths rather than single crystals as has been found generally for other forms of MFI.
Comparison of the intracrystalline diffusivities and surface permeabilities determined in these
studies shows a remarkable peculiarity. While for methyl-butane and benzene the transport resistance
on the crystal surfaces (XZ and YZ planes) may be expected to be caused by essentially total blockage
of the vast majority of the pore entrances on the crystal surface, with only a few pores being
permeable, surface permeation of 4-methyl-2-pentyne appears to follow a completely different
mechanism, leading to an additional reduction in permeability. The exploration of the origin of these
differences is among the challenging new questions emerging from the application of interference
microscopy to the study of mass transfer phenomena in nanoporous materials.
Acknowledgments
We gratefully acknowledge the contributions of Sergey Vasenkov, now at the University of Florida,
Gainesville, and Pavel Kortunov, now at ExxonMobil, to the development of our experimental device
for micro-imaging by interference microscopy and the financial support by the German Science
Foundation, notably via the International Research Training Group “Diffusion in Porous Materials”, as
well as by the Fonds der Chemischen Industrie, the Max-Buchner-Forschungsstiftung and the
Alexander von Humboldt Foundation.
References
1. Chen, N.Y.; Degnan, T.F.; Smith, C.M. Molecular Transport and Reaction in Zeolites;
Wiley-VCH: New York, NY, USA, 1994.
2. Schüth, F.; Sing, K.S.W.; Weitkamp, J. Handbook of Porous Solids; Wiley-VCH: Weinheim,
Germany, 2002.
3. Auerbach, S.M., Carrado, K.A., Dutta, P.K., Eds. Handbook of Zeolite Science and Technology;
CRC Press: Boca Raton, FL, USA, 2003.
4. Laeri, F., Schüth, F., Simon, U., Wark, M., Eds. Host-Guest-Systems Based on Nanoporous
Crystals; Wiley-VCH: Weinheim, Germany, 2003.
5. Ertl, G., Knözinger, H., Schüth, F., Weitkamp, J., Eds. Handbook of Heterogeneous Catalysis,
Wiley-VCH: Weinheim, Germany, 2008.
6. Metzler, R.; Klafter, J. The random walk’s guide to anomalous diffusion: A fractional dynamics
approach. Phys. Rep. 2000, 339, 1–77.
7. Klages, R.; Radons, G.; Sokolov, I.M. Anomalous Transport; Weinheim, Germany, 2008.
8. Kärger, J.; Ruthven, D.M.; Theodorou, D.N. Diffusion in Nanporous Materials;
Wiley-VCH: Weinheim, Germany, 2012.
9. Treacy, M.M.J.; Higgins, J.B. Collection of Simulated XRD Powder Patterns for Zeolites;
Elsevier: Amsterdam, The Netherlands, 2007.
10. Flanigen, E.M.; Bennett, J.M.; Grose, R.W.; Cohen, J.P.; Patton, R.L.; Kirchner, R.M.;
Smith, J.V. Silicalite, a new hydrophobic crystalline silica molecular-sieve. Nature 1978, 271,
512–514.
Page 16
Materials 2012, 5
736
11. Kokotailo, G.T.; Lawton, S.L.; Olson, D.H.; Meier, W.M. Structure of synthetic zeolite ZSM-5.
Nature 1978, 272, 437–438.
12. Theodorou, D.N.; Snurr, R.Q.; Bell, A.T. Molecular dynamics and diffusion in microporous
materials. In Comprehensive Supramolecular Chemistry; Alberti, G., Bein, T., Eds.; Pergamon:
Oxford, NY, USA, 1996; pp. 507–548.
13. Haberlandt, R.; Fritzsche S.; Vörtler H.L. Simulation of microporous systems: Confined fluids in
equilibrium and diffusion in zeolites. In Handbook of Surfaces and Interfaces of Materials;
Nalwa, H.S., Ed.; Academic Press: New York, NY, USA, 2001; Volume 5, pp. 357–443.
14. Dubbeldam, D.; Calero, S.; Vlugt, T.J.H.; Krishna, R.; Maesen, T.L.M.; Beerdsen, E.; Smit, B.
Force field parametrization through fitting on inflection points in isotherms. Phys. Rev. Lett. 2004,
93, 088302:1–088302:4.
15. Saengsawang, O.; Schüring, A.; Remsungnen, T.; Loisruangsin, A.; Hannongbua, S.; Magusin,
P.C.M.; Fritzsche, S. Rotational motion of pentane in the flat gamma cages of zeolite KFI.
J. Phys. Chem. C 2008, 112, 5922–5929.
16. June, R.L.; Bell, A.T.; Theodorou, D.N. Prediction of low occupancy sorption of alkanes in
silicalite prediction of low occupancy sorption of alkanes in silicalite. J. Phys. Chem. 1990, 94,
1508–1516.
17. June, R.L.; Bell, A.T.; Theodorou, D.N. A molecular dynamics study of mehane and xenon in
silicalite. J. Phys. Chem. 1990, 94, 8232–8240.
18. June, R.L.; Bell, A.T.; Theodorou, D.N. Molecular dynamics studies of butane and hexane in
silicalite. J. Phys. Chem. 1992, 96, 1051–1059.
19. Hernandez, E.; Catlow, C.R.A. Molecular dynamics simulations of n-butane and n-hexane
diffusion in silicalite. In Proceedings: Mathematical and Physical Science; The Royal Society:
London, UK, 1995; Volume 448, pp. 143–160.
20. Demontis, P.; Fris, E.S.; Suffritti, G. Molecular dynamics studies on zeolite: 6. Temperature
dependence of diffusion of methane in silicalite. J. Phys. Chem. 1992, 96, 1482–1490.
21. Gergidis, L.N.; Theodorou, D.N. Molecular dynamics simulation of n-butane-methane mixtures in
silicalite. J. Phys. Chem. B 1999, 103, 3380–3390.
22. Bussai, C.; Fritzsche, S.; Haberlandt, R.; Hannongbua, S. A molecular dynamics (MD) study of
methane in silicalite-1: A novel moller-plesset potential energy surface. In Recent Advances in the
Science and Technology of Zeolites and Related Materials; van Steen, E., Callanan, L.H.,
Claeys M., Eds.; Elsevier: Amsterdam, The Netherlands, 2004; Volume 154, pp. 2104–2109.
23. Schüring, A.; Fritzsche, S.; Haberlandt, R.; Vasenkov, S.; Kärger, J. Modelling molecular
diffusion in channel networks via displacements between the channelsegments. Phys. Chem.
Chem. Phys. 2004, 6, 3676–3679.
24. Jost, S.; Biswas, P.; Schuring, A.; Karger, J.; Bopp, P.A.; Haberlandt, R.; Fritzsche, S. Structure and
self-diffusion of water molecules in chabazite: A molecular dynamics study. J. Phys. Chem. C 2007,
111, 14707–14712.
25. Chanajaree, R.; Bopp, P.A.; Fritzsche, S.; Kärger, J. Water dynamics in chabazite. Microp.
Mesop. Mat. 2011, 146, 106–118.
Page 17
Materials 2012, 5
737
26. Kärger, J. Random walk through two-channel networks: A simple means to correlate the
coefficients of anisotropic diffusion in ZSM-5 type zeolite. J. Phys. Chem. 1991, 95,
5558–5560.
27. Kärger, J.; Pfeifer, H. On the interdependence of the principal values of the diffusion tensor in
zeolites with channel networks. Zeolites 1992, 12, 872–873.
28. Bär, N.K.; Kärger, J.; Pfeifer, H.; Schäfer, H.; Schmitz, W. Diffusion anisotropy in natural
chabazite. Microporous Mesoporous Mat. 1998, 22, 289–295.
29. Kocirik, M.; Kornatowski, J.; Masarik, V.; Novak, P.; Zikanova, A.; Maixner, J. Investigation of
sorption and transport of sorbate molecules in crystals of MFI structure type by iodine indicator
technique. Microporous Mesoporous Mat. 1998, 23, 295–308.
30. Schmidt, W.; Wilczok, U.; Weidenthaler, C.; Medenbach, O.; Goddard, R.; Buth, G.; Cepak, A.
Preparation and morphology of pyramidal MFI single crystal segments. J. Phys. Chem. B 2007,
111, 13538–13543.
31. Tzoulaki, D.; Schmidt, W.; Wilczok, U.; Kärger, J. Formation of surface barriers on silicalite-1
crystal fragments by residual water vapour as probed with isobutane by interference microscopy.
Microporous Mesoporous Mat. 2008, 110, 72–76.
32. Hong, U.; Kärger, J.; Pfeifer, H.; Müller, U.; Unger, K.K. Observing diffusion anisotropy in
zeolites by pulsed field gradient NMR. Z. Phys. Chem. 1991, 173, 225–234.
33. Hong, U.; Kärger, J.; Kramer, R.; Pfeifer, H.; Seiffert, G.; Müller, U.; Unger, K.K.; Lück, H.B.;
Ito, T. PFG NMR study of diffusion anisotropy in oriented ZSM-5 type zeolite crystallies.
Zeolites 1991, 11, 816–821.
34. Caro, J.; Noack, M.; Marlow, F.; Peterson, D.; Griepenstrog, M.; Kornatowksi, J.J. Selective
sorption uptake kinetics of n-hexane on zsm-5: A new method for measuring anitsotropic
diffusivities. J. Phys. Chem. 1993, 97, 13685–13690.
35. Hayhurst, D.T.; Paravar, A. Direct measurement of diffusivity for butane across a single large
silicalite crystal. In Proceeding of the Sixth International Zeolite Conference, Reno, NV, USA,
1983; Olson, D., Bisio, A., Eds.; Butterworths: Guildford, UK, 1984; pp. 217–224.
36. Hayhurst, D.T.; Paravar, A.R. Diffusion of C1 to C5 normal paraffins in silicalite. Zeolites 1988,
8, 27–29.
37. Shah, D.B.; Chokchai, S.; Hayhurst, D. Measurements of transport rates of C4 hydrocarbons
across a single-crystal silicalite membrane. J. Chem. Soc. Faraday Trans. 1993, 89, 3161–3167.
38. Eic, M.; Ruthven, D.M. Intracrystalline diffusion of linear paraffins and benzene in silicalite
studied by the ZLC method. In Zeolites: Facts, Figures, Future; Jacobs, P.A., van Santen, R.A.,
Eds.; Elsevier: Amsterdam, The Netherlands, 1989; pp. 897–906.
39. Hufton, J.R.; Ruthven, D.M.; Danner, R.P. Adsorption and diffusion of hydrocarbons in silicalite at
very low concentration: Effect of Defect Sites. Microporous Mater. 1995, 5, 39–52.
40. Cavalcante, C.L.; Ruthven, D.M. Adsorption of branched and cyclic paraffins in silicalite. 2:
Kinetics. Ind. Eng. Chem. Res. 1995, 34, 185–191.
41. Brandani, S.; Jama, M.; Ruthven, D. Diffusion, Self-diffusion and counter-diffusion of benzene
and p-xylene in silicalite. Microporous Mesoporous Mat. 2000, 6, 283–300.
42. Brandani, S.; Ruthven, D.M. Analysis of ZLC desorption curves for gaseous systems. Adsorpt.
1996, 2, 133–143.
Page 18
Materials 2012, 5
738
43. Ruthven, D.M.; Brandani, S.; Eic, M. Measurement of diffusion in microporous solids by
macroscopic methods. In Adsorption and Diffusion; Karge, H.G., Weitkamp, J., Eds.; Springer:
Berlin, Germany, 2008; Volume 7, pp. 45–85.
44. Ruthven, D.M.; Brandani, S. Measurement of diffusion in porous solids by zero length column
(ZLC) methods. In Recent Advances in Gas Separation by Microporous Ceramic Membranes;
Kanellopoulos, N.K., Ed.; Elsevier: Amsterdam, The Netherlands, 2000; pp. 187–212.
45. Chmelik, C.; Heinke, L.; Kortunov, P.; Li, J.; Olson, D.; Tzoulaki, D.; Weitkamp, J.; Kärger, J.
Ensemble measurement of diffusion: Novel beauty and evidence. Chem. Phys. Chem. 2009, 10,
2623–2627.
46. Chmelik, C.; Hibbe, F.; Tzoulaki, D.; Heinke, L.; Caro, J.; Li, J.; Kärger, J. Exploring the nature
of surface barriers on MOF Zn(tbip) by applying IR microscopy in high temporal and spatial
resolution. Microporous Mesoporous Mater. 2010, 129, 340–344.
47. Heinke, L.; Tzoulaki, D.; Chmelik, C.; Hibbe, F.; van Baten, J.; Lim, H.; Li, J.; Krishna, R.;
Kärger, J. Assessing guest diffusivities in porous hosts from transient concentration profiles.
Phys. Rev. Lett. 2009, 102, 065901: 1–065901: 4.
48. Hibbe, F.; Chmelik, C.; Heinke, L.; Pramanik, S.; Li, J.; Ruthven, D.M.; Tzoulaki, D.; Kärger, J.
The nature of surface barriers on nanoporous solids explored by microimaging of transient guest
distributions. J. Am. Chem. Soc. 2011, 133, 2804–2807.
49. Tzoulaki, D.; Heinke, L.; Li, J.; Lim, H.; Olson, D.; Caro, J.; Krishna, R.; Chmelik, C.; Kärger, J.
Assessing surface permeabilities from transient guest profiles in nanoporous materials.
Angew. Chem. Int. Ed. 2009, 48, 3525–3528.
50. Heinke, L.; Kärger, J. Correlating surface permeability with intracrystalline diffusivity in
nanoporous solids. Phys. Rev. Lett. 2011, 106, 074501: 1–074501: 4.
51. Hibbe, F.; Marthala, R.; Chmelik, C.; Weitkamp, J.; Kärger, J. Micro-imaging of transient guest
profiles in nanochannels. J. Chem. Phys. 2011, 135, 184201:1–184201:5.
52. Kärger, J.; Kortunov, P.; Vasenkov, S.; Heinke, L.; Shah, D.B.; Rakoczy, R.A.; Traa, Y.;
Weitkamp, J. Unprecedented insight into diffusion by monitoring concentration of guest
molecules in nanoporous host materials. Angew. Chem. Int. Edit. 2006, 45, 7846–7849.
53. Geier, O.; Vasenkov, S.; Lehmann, E.; Kärger, J.; Schemmert, U.; Rakoczy, R.A.; Weitkamp, J.
Interference microscopy investigation of the influence of regular intergrowth effects in MFI-type
zeolites on molecular uptake. J. Phys. Chem. B 2001, 105, 10217–10222.
54. Kortunov, P.; Heinke, L.; Vasenkov, S.; Chmelik, C.; Shah, D.B.; Kärger, J.; Rakoczy, R.A.;
Traa, Y.; Weitkamp, J. Internal concentration gradients of guest molecules in nanoporous host
materials: Measurement and microscopic analysis. J. Phys. Chem. B 2006, 110, 23821–23828.
55. Lehmann, E.; Chmelik, C.; Scheidt, H.; Vasenkov, S.; Staudte, B.; Kärger, J.; Kremer, F.;
Zadrozna, G.; Kornatowski, J. Regular intergrowth in the AFI type crystals: Influence on the
intracrystalline adsorbate distribution as observed by interference and FTIR-microscopy. J. Amer.
Chem. Soc. 2002, 124, 8690–8692.
56. Wright, P.A.; Maple, M.J.; Slawin, A.M.Z.; Patinek, V.; Aitken, R.A.; Welsh, S.; Cox, P.A.
Cation-directed syntheses of novel zeolite-like metalloaluminophosphates STA-6 and STA-7 in
the presence of azamacrocycle templates. J. Chem. Soc. Dalton Trans. 2000, 1243–1248.
Page 19
Materials 2012, 5
739
57. Castro, M.; Garcia, R.; Warrender, S.J.; Slawin, A.M.Z.; Wright, P.A.; Cox, P.A.; Fecant, C.;
Mellot-Dranznieksd, C.; Bats, N. Co-templating and modelling in the rational synthesis of zeolitic
solids. Chem. Commun. 2007, 3470–3472.
58. Tzoulaki, D.; Heinke, L.; Schmidt, W.; Wilczok, U.; Kärger, J. Exploring crystal morphology of
nanoporous hosts from transient guest profiles. Angew. Chem. Int. Ed. 2008, 47, 3954–3957.
59. Karwacki, L.; Stavitski, E.; Kox, M.H.F.; Kornatowski, J.; Weckhuysen, B.M. Intergrowth
structure of zeolite crystals as determined by optical and fluorescence microscopy of the
template-removal process. Angew. Chem.-Int. Edit. 2007, 46, 7228–7231.
60. Karwacki, L.; Kox, M.H.F.; Winter, D.A.M. de; Drury, M.R.; Meeldijk, J.D.; Stavitski, E.;
Schmidt, W.; Mertens, M.; Cubillas, P.; John, N.; et al. Morphology-dependent zeolite
intergrowth structures leading to distinct internal and outer-surface molecular diffusion barriers.
Nat. Mater. 2009, 8, 959–965.
61. Shao, C.; Li, X.; Qiu, S.; Xiao, F.-S.; Terasaki, O. Size-controlled synthesis of silicalite-1 single
crystals in the presence of benzene-1,2-diol. Microporous Mesoporous Materials 2000, 39,
117–123.
62. Gueudré, L.; Jolimaîte, E.; Bats, N.; Dong, W. Diffusion in zeolites: is surface resistance a critical
parameter? Adsorption 2010, 16, 17–27.
63. Gueudré, L.; Bats, N.; Jolimaître, E. Effect of surface resistance on cyclohexane uptake curves in
Silicalite-1 crystals. Microporous Mesoporous Materials 2012, 147, 310–317.
64. Kärger, J.; Vasenkov, S. Quantitation of diffusion in zeolite catalysts. Microporous Mesoporous
Mat. 2005, 85, 195–206.
65. Karge, H.G.; Kärger, J. Application of IR spectroscopy, IR microscopy, and optical interference
microscopy to diffusion in zeolites. In Adsorption and Diffusion; Karge, H.G., Weitkamp, J., Eds.;
Springer: Berlin, Germany, 2008; Volume 7, pp. 135–206.
66. Chmelik, C.; Heinke, L.; Valiullin, R.; Kärger, J. New view of diffusion in nanoporous materials.
Chem. Ing. Tech. 2010, 82, 779–804.
67. Chmelik, C.; Kärger, J. In-situ study on molecular diffusion phenomena in nanoporous catalytic
solids. Chem. Soc. Rev. 2010, 39, 4864–4884.
68. Song, L.; Rees, L.V.C. Frequency response measurements of diffusion in microporous materials.
In Adsorption and Diffusion; Karge, H.G., Weitkamp, J., Eds.; Springer: Berlin, Germany, 2008;
Volume 7, pp. 235–276.
69. Rees, L.V.C.; Song, L. Frequency response methods for the characterization of microporous
solids. In Recent Advances in Gas Separation by Microporous Ceramic Membranes;
Kanellopoulos, N.K., Ed.; Elsevier: Amsterdam, The Netherlands, 2000; pp. 139–186.
70. Song, L.J.; Sun, Z.L.; Rees, L.V.C. Experimental and molecular simulation studies of adsorption
and diffusion of cyclic hydrocarbons in silicalite-1. Microporous Mesoporous Mat. 2002, 55,
31–49.
71. Förste, C.; Kärger, J.; Pfeifer, H.; Riekert, L.; Bulow, M.; Zikanova, A. Comparison of
nuclear-magnetic-resonance tracer exchange and molecular uptake of benzene on pentasils.
J. Chem. Soc. Faraday Trans. I 1990, 86, 881–885.
72. Qureshi, W.; Wei, J. One- and two-component diffusion in zeolite ZSM-5 I. Theoretical. J. Catal.
1990, 126, 126–146.
Page 20
Materials 2012, 5
740
73. Beschmann, K.; Koktailo, G.; Riekert, L. Kinetics of sorption of aromatics in zeolite ZSM-5.
Chem. Eng. Process 1987, 27, 223–229.
74. Eic, M.; Ruthven, D.M. Intracrystalline diffusion of linear paraffins and benzene in silicalite
studied by the ZLC method. In 8th International Conference on Zeolites; Jacobs, P.A.,
van Santen, R.A., Eds.; Elsevier: Amsterdam, The Netherlands, 1989; pp. 897–905.
75. Zikanova, A.; Bülow, M.; Schlodder, H. Intracrystalline diffusion of benzene in ZSM-5 and
silicalite. Zeolites 1987, 7, 115–118.
76. Doelle, H.-J.; Heering, J.; Riekert, L.; Marosi, L. Sorption and catalytic reaction in pentasil
zeolites. Influence of preparation and crystal size on equilibria and kinetics. J. Catal. 1981, 71,
27–40.
77. Stavitski, E.; Drury, M.R.; Winter, D.A.M. de; Kox, M.H.F.; Weckhuysen, B.M. Intergrowth
structure of zeolite crystals and pore orientation of individual subunits revealed by electron
backscatter diffraction/focused ion beam experiments. Angew. Chem. Int. Edit. 2008, 47,
5637–5640.
78. Heinke, L.; Kortunov, P.; Tzoulaki, D.; Kärger, J. The options of interference microscopy to
explore the significance of intracrystalline diffusion and surface permeation for overall mass
transfer on nanoporous materials. Adsorpt. J. Int. Adsorpt. Soc. 2007, 13, 215–223.
79. Heinke, L. Significance of concentration-dependent intracrystalline diffusion and surface
permeation for overall mass transfer. Diffusion Fundam. 2007, 4, 12.1–12.11.
80. Heinke, L.; Kärger, J. Discriminating the molecular pathways during uptake and release on
nanoporous host systems. J. Chem. Phys. 2009, 130, 044707: 1–044707: 8.
© 2012 by the authors; licensee MDPI, Basel, Switzerland. This article is an open access article
distributed under the terms and conditions of the Creative Commons Attribution license
(http://creativecommons.org/licenses/by/3.0/).