International Journal of Scientific Engineering and Applied Science (IJSEAS) - Volume-1, Issue-3, June 2015 ISSN: 2395-3470 www.ijseas.com 264 MICROARRAY DATA ANALYSIS USING R PROGRAMMING Nirusha P1 , Sabreen Taj B G2 , Thriveni T G3 , Gurumurthy H4 , 1 Research Scholar, G M Institute of Technology, Davanagere, India 2 Research Scholar, G M Institute of Technology, Davanagere, India 3 Professor, Department of Biotechnology, G M Institute of Technology, Davanagere, India 4 Professor & HOD of Biotechnology, G M Institute of Technology, Davanagere, India ABSTRACT Gene expression profiling provides unprecedented opportunities to study patterns of gene expression regulation, for example, in diseases or developmental processes. Bioinformatics analysis plays an important part of processing the information embedded in large-scale expression profiling studies and for laying the foundation for biological interpretation. Over the past years, numerous tools have emerged for microarray data analysis. One of the most popular platforms is R, an open source and open development software project for the analysis and comprehension of genomic data, based on the R programming language. In this work use R analysis packages to demonstrate the workflow of microarray data analysis for different cancer forms annotation, normalization, expression index calculation, and diagnostic plots to pathway analysis, leading to a meaningful visualization and interpretation of the data which will help in gene product identification which will further help in drug discovery to combat the cancer progressions. 1. INTRODUCTION Microarray data analysis is becoming an increasingly integral part of biological research. Analysis of cell expression that would have previously taken months to perform can now be carried out in a matter of hours with the use of these miraculous chips. The analysis of gene
Transcript
International Journal of Scientific Engineering and Applied Science (IJSEAS) - Volume-1, Issue-3, June 2015 ISSN: 2395-3470
www.ijseas.com
264
MICROARRAY DATA ANALYSIS USING R PROGRAMMING
Nirusha PP
1P, Sabreen Taj B G P
2P, Thriveni T G P
3P, Gurumurthy H P
4P,
P
1PResearch Scholar, G M Institute of Technology, Davanagere, India
P
2PResearch Scholar, G M Institute of Technology, Davanagere, India
P
3 PProfessor, Department of Biotechnology, G M Institute of Technology, Davanagere, India
P
4PProfessor & HOD of Biotechnology, G M Institute of Technology, Davanagere, India
ABSTRACT
Gene expression profiling provides unprecedented opportunities to study patterns of
gene expression regulation, for example, in diseases or developmental processes.
Bioinformatics analysis plays an important part of processing the information
embedded in large-scale expression profiling studies and for laying the foundation for
biological interpretation. Over the past years, numerous tools have emerged for
microarray data analysis. One of the most popular platforms is R, an open source and
open development software project for the analysis and comprehension of genomic data,
based on the R programming language. In this work use R analysis packages to
demonstrate the workflow of microarray data analysis for different cancer forms
annotation, normalization, expression index calculation, and diagnostic plots to
pathway analysis, leading to a meaningful visualization and interpretation of the data
which will help in gene product identification which will further help in drug discovery
to combat the cancer progressions.
1. INTRODUCTION
Microarray data analysis is becoming an increasingly integral part of biological research.
Analysis of cell expression that would have previously taken months to perform can now be
carried out in a matter of hours with the use of these miraculous chips. The analysis of gene
International Journal of Scientific Engineering and Applied Science (IJSEAS) - Volume-1, Issue-3, May 2015 ISSN: 2395-3470
www.ijseas.com
265
expression values is of key importance in bioinformatics. The technique makes it possible to
give an initial answer to many important genetic type of questions.
1.1 MICRROARRAYS
A microarray is device that allows for fast and precise analysis of messenger ribonucleic acid
(mRNA) directly from a cell. It consists of two parts: the chip and the optical reader. The
chip is constructed from a plate of glass to which tens of thousands of cDNA genes are
chemically attached in specific locations called spots.. The chip is then run through the
optical reader which records the location and intensities of the fluorescent tags Hala .M. et.al,
2013[1]
1.2 ABOUT R:
R is a language and environment for statistical computing and graphics. It is a GNU
project which is similar to the S language and environment which was developed at Bell
Laboratories (formerly AT&T, now Lucent Technologies) by John Chambers and colleagues.
R can be considered as a different implementation of S. There are some important
differences, but much code written for S runs unaltered under R.
1.3 CANCER
Cancer is one of the dreadful diseases, which causes a considerable death rate in humans.
Cancer is featured by an irregular, unmanageable growth that may demolish and attack
neighbouring healthy body tissues or somewhere else in the body. Milena B et.al, 2014[2].
2. LITERATURE REVIEW
According to the works of Michael R et al, 2009[3] the Gene Expression Omnibus developed
by the National Centre for Bioinformatics (NCBI) at the National Institutes of Health is a
repository of nearly 140 000 gene expression experiments. Establishes a bridge between GEO
and bioconductor. Easy access to GEO data from bioconductor will likely lead to new
analyses of GEO data using novel and rigorous statistical and bioinformatics tools.
International Journal of Scientific Engineering and Applied Science (IJSEAS) - Volume-1, Issue-3, May 2015 ISSN: 2395-3470
www.ijseas.com
269
data’s for different cancer types with different accession numbers being defined into groups
of 2 or more, and the data is characterized. Data for top 250 genes.Analyzed with GEO2R
and got the list of top 250 highly expressed genes, created the excel work sheets for the top
250 genes. Copying the gene ID’s from the created excel work sheet. Copying of highly
expressed top 250 gene ID’s from the created excel sheet is carried out in order to submit to
the DAVID functional annotation tool. Uploading the gene ID’s to the DAVID functional
annotation tool. From the tabulated data copied the top 250 gene ID’s of particular type,
submit the gene ID’s to the DAVID functional annotation tool and annotation summary
results are obtained.
Pathway responsible for cause of cancer identified. There are different pathways involved in
the cancer but we selected only the P53 signalling pathway and pathways in cancer. From the
annotation summary results we have selected only P53 signalling pathway by referring the
KEGG chart from which highly expressed genes with their official gene symbols were
identified. The official gene symbols were submitted to the NCBI tool to get the gene
sequences in FASTA format. From the NCBI mRNA and protein sequences were
downloaded in the FASTA format for the obtained gene symbols. In this project we
concentrating on Homo sapiens so that we have selected Homo sapiens mRNA sequence and
protein, and the sequence summary for particular organism.FASTA format sequences for all
the genes involved in the pathway are loaded as total sequence into the Blast2GO pro tool.
After the sequences are loaded into the Blast2GO pro tool run the blast and interpro, mapping
and annotation. The combined graphs for biological process, molecular function and cellular
components for the given genes were identified by using graph tool.
International Journal of Scientific Engineering and Applied Science (IJSEAS) - Volume-1, Issue-3, May 2015 ISSN: 2395-3470
www.ijseas.com
270
Table 1: Collected data for the different cancer types with two group
Fig. 2: Data sets of various types of cancers with two groups with the pathways involved and the genes involved in the cancer pathways with their gene symbols
International Journal of Scientific Engineering and Applied Science (IJSEAS) - Volume-1, Issue-3, May 2015 ISSN: 2395-3470
www.ijseas.com
271
Table 2: Collected data for the different cancer types with three groups
Fig. 3: Data sets of various types of cancers with two groups with the pathways involved and the genes involved
in the cancer pathways with their gene symbols
5. RESULTS AND DISCUSSION
Analysis of the microarray data of different cancer types with two or multiple group GSM
files in the GEO datasets using the GEO2R analysis tool where normalization of the data and
the identification of top 250 highly expressed genes is done and the gene ID’s are uploaded in
the DAVID functional annotation tool to obtain the annotation summary results and identify
the pathways involved in the cancer expression and the genes responsible for the cancer cause
is identified with their gene symbols and submitted to the Blast2GO pro tool and sequences
run with blast where DNA sequences are converted into proteins and with the interpro scan
similar matches for the proteins are identified followingly annotation statistics are studied for
International Journal of Scientific Engineering and Applied Science (IJSEAS) - Volume-1, Issue-3, May 2015 ISSN: 2395-3470
www.ijseas.com
272
gene ontology distribution and direct gene ontology count for molecular function is made . A
key goal of cancer studies is to systematically characterize the cellular molecular mechanisms
involved in disease progression.
5.1 ANALYSIS OF TWO GROUP DATASET USING GEO2R:
Fig. 4: Result of value distribution in the form of box plot for the esophagus cancer with two group GSM files
with accession number GSE1947
International Journal of Scientific Engineering and Applied Science (IJSEAS) - Volume-1, Issue-3, May 2015 ISSN: 2395-3470
www.ijseas.com
273
Fig. 5: List of top 250 highly expressed genes with their gene ID’s
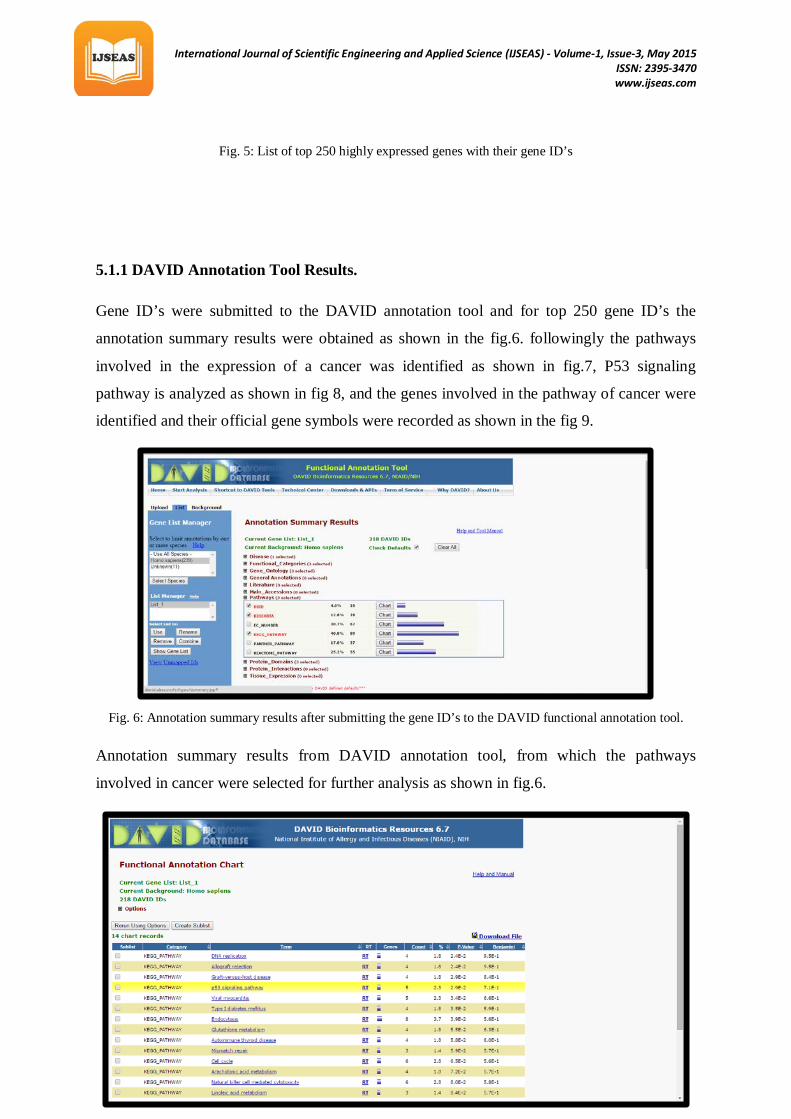
5.1.1 DAVID Annotation Tool Results.
Gene ID’s were submitted to the DAVID annotation tool and for top 250 gene ID’s the
annotation summary results were obtained as shown in the fig.6. followingly the pathways
involved in the expression of a cancer was identified as shown in fig.7, P53 signaling
pathway is analyzed as shown in fig 8, and the genes involved in the pathway of cancer were
identified and their official gene symbols were recorded as shown in the fig 9.
Fig. 6: Annotation summary results after submitting the gene ID’s to the DAVID functional annotation tool.
Annotation summary results from DAVID annotation tool, from which the pathways
involved in cancer were selected for further analysis as shown in fig.6.
International Journal of Scientific Engineering and Applied Science (IJSEAS) - Volume-1, Issue-3, May 2015 ISSN: 2395-3470
www.ijseas.com
274
Fig. 7: Selection of pathway involved in cancer
Through the functional annotation chart, P53 signalling pathway is found ,responsible for the
cause of cancer and is analysed further to know the genes responsible for the pathway as
shown in fig.7.
Fig. 8: P53 signalling pathway is analysed
Analysis of P53 signalling pathway is done to know which genes are responsible for the
pathway of cancer causing the Esophagus cancer as shown in fig.8.
International Journal of Scientific Engineering and Applied Science (IJSEAS) - Volume-1, Issue-3, May 2015 ISSN: 2395-3470
www.ijseas.com
275
Fig. 9: Genes involved in the pathway are identified and their official gene symbols are recorded.
5.1.2 BLAST2GO Tool Results:
FIG. 10: Results for the blast and proceed for the inter pro scan and mapping.
All the FASTA format sequence of the genes responsible for the cancer are uploaded to the
Blast2GO PRO tool to analyse through various functions of it such as visualization,
management, and statistical analysis of annotation results as shown in fig.10.
International Journal of Scientific Engineering and Applied Science (IJSEAS) - Volume-1, Issue-3, May 2015 ISSN: 2395-3470
www.ijseas.com
276
Fig. 11: The sequence similarity distribution and E value distribution
Through this chart, sequence similarity distribution can be analysed which denotes the
distribution of all calculated sequence similarities (percentages), as shown in fig. 11.
Fig. 12: Combined graph for the biological process.
International Journal of Scientific Engineering and Applied Science (IJSEAS) - Volume-1, Issue-3, May 2015 ISSN: 2395-3470
www.ijseas.com
277
Fig. 13: The combined graph for the molecular function.
Fig. 14: Combined graph for cellular component
This confluence score takes into account the number of sequences converging at one GO term
and at the same time penalizes by the distance to the term where each sequence was actually
annotated. Assigned sequences and scores can be displayed at the terms level as shown in fig.
12, 13, 14.
International Journal of Scientific Engineering and Applied Science (IJSEAS) - Volume-1, Issue-3, May 2015 ISSN: 2395-3470
www.ijseas.com
278
Fig. 15: Blast statistics result
When the recorded gene symbols are submitted to NCBI and the sequences in FASTA format
are downloaded and loaded in Blast2GO tool. By using Blast2GO tool species distribution
was analysed and this chart gives the distribution of different species to which more
sequences were aligned during the Blast run, as we have selected Homosapien that shows
maximum Blast Hit represented in the fig.15.
Fig.
16:
Results of annotation statistics for biological process, molecular function, cellular component
Cellular component consists of cell organelle, membrane enclosed lumen, macromolecular
complex, extracellular region and the molecular function consists of depiction of binding and
catalytic activity shown in fig.4.
Fig.
17:
International Journal of Scientific Engineering and Applied Science (IJSEAS) - Volume-1, Issue-3, May 2015 ISSN: 2395-3470
www.ijseas.com
279
Results of annotation statistics for biological process, molecular function, cellular component.
By using Blast2GO tool the direct GO count was analysed and by using this chart ,which
gives total number of protein binding, ATP binding, as shown in fig. 17.
Fig. 18: Results of Gene ontology for biological process with pie chart
By using Blast2GO tool the pie chart for the biological process was obtained and this chart
represents a series of events such as growth, immune system process, localization, biological
regulation which are effected by the cancer gene activity on them as shown in fig.18.
International Journal of Scientific Engineering and Applied Science (IJSEAS) - Volume-1, Issue-3, May 2015 ISSN: 2395-3470
www.ijseas.com
280
Fig. 19: Result of Gene ontology for molecular function with pie chart
Fig. 20: Result of Gene ontology for cellular component with pie chart
Through Blast2GO tool the pie chart for the cellular component was analysed and this chart
represents a part of a cell lumen, extracellular region, membrane, macromolecular complex as
shown in fig.20.
Similar result analysis for 3 group data set is carried out.
CONCLUSION
Cancer is one of the dreadful diseases, which causes a considerable death rate in humans.
Cancer is featured by an irregular, unmanageable growth that may demolish and attack
neighboring healthy body tissues or somewhere else in the body. Microarray based gene
expression profiling has been emerged as an efficient technique for cancer classification, as
well as for diagnosis, prognosis, and treatment purposes.
Microarray based gene expression profiling using R has become an important and promising
approach that can be used for cancer classification. This project mainly gives an overview of
the genes involved in the expression of the various cancer types with two or multiple group
data’s as an example of the results mentioned above of the esophagus cancer with GEO
accession number GSE19742 results which clearly depict the highly expressed genes with the
International Journal of Scientific Engineering and Applied Science (IJSEAS) - Volume-1, Issue-3, May 2015 ISSN: 2395-3470
www.ijseas.com
281
gene symbols CHEK1,GTSE1, CDK1,CCB1,RRM2 from which their functions, count of
highly expressed genes, annotations, blast statistics, pathways involved in the gene
expressions, gene ontology of biological process, gene ontology of molecular function, gene
ontology of cellular components results were obtained, similarly it is analysed for 20 varied
cancer types. This is an important step for diagnosis and prognosis purposes.
SCOPE OF FUTURE WORK
Microarray data analysis using R programming cancer studies can be carried out
systematically and characterize the cellular, molecular mechanisms involved in disease
progression and highly expressed genes causing cancer has been identified.
In future work for the highly expressed genes, their gene products will be identified which
will be further help in the drug discovery to combat the cancer progressions.
REFERENCES
1. Hala .M, Ghada .H, Alshamlan, Badr, Jorge Andrade, & Bao Riyue “A Study of Cancer
Microarray Gene Expression Profile: Objectives and Approaches” in London, U.K.
Proceedings of the World Congress on Engineering, 2013 vol 2.
2. Milena B. Furtado, Hieu T. Nima, Jodee A. Gould, Mauro W, Costa, Nadia A. Rosenthal
, Sarah E. Boyd. “Microarray profiling to analyse adult cardiac fibroblast identity”. 2014
Genomics Data, vol 2, pp.345–350.
3. Michael R. Stratton, Peter J. Campbell& P. Andrew Futreal.“The cancer genome”. 2009,