Page 1
MICROBIAL DETOXIFICATION OF GROUNDNUT MEAL NATURALLY CONTAMINATED WITH AFLATOXIN USING RHODOCOCCUS
ERYTHROPOLIS
A THESIS SUBMITTED TO THE GRADUATE SCHOOL OF NATURAL AND APPLIED SCIENCES
OF MIDDLE EAST TECHNICAL UNIVERSITY
BY
ÖNAY BURAK DOĞAN
IN PARTIAL FULFILLMENT OF THE REQUIREMENTS FOR
THE DEGREE OF MASTER OF SCIENCE IN
FOOD ENGINEERING
AUGUST 2015
Page 3
Approval of the thesis:
MICROBIAL DETOXIFICATION OF GROUNDNUT MEAL NATURALLY CONTAMINATED WITH AFLATOXIN USING RHODOCOCCUS
ERYTHROPOLIS
submitted by ÖNAY BURAK DOĞAN in partial fulfillment of the requirements for the degree of Master of Science in Food Engineering Department, Middle East Technical University by, Prof. Dr. Gülbin Dural Ünver _______________ Dean, Graduate School of Natural and Applied Sciences Prof. Dr. Alev Bayındırlı _______________ Head of Department, Food Engineering Assoc. Prof. Dr. Deniz Çekmecelioğlu _______________ Supervisor, Food Engineering Dept., METU Prof. Dr. Tahsin Faruk Bozoğlu _______________ Co-supervisor, Food Engineering Dept., METU Examining Committee Members: Prof. Dr. Zümrüt Begüm Ögel _______________ Food Engineering Dept.,KGTÜ Assoc. Prof. Dr. Deniz Çekmecelioğlu _______________ Food Engineering Dept., METU Assoc. Prof. Dr. İlkay Şensoy _______________ Food Engineering Dept., METU Asst. Prof. Dr. Baran Önal Ulusoy _______________ Food Engineering Dept., ÇKÜ Asst. Prof. Dr. Yeşim Soyer _______________ Food Engineering Dept., METU
Date: 21.08.2015
Page 4
iv
I hereby declare that all information in this document has been obtained and presented in accordance with academic rules and ethical conduct. I also declare that, as required by these rules and conduct, I have fully cited and referenced all material and results that are not original to this work.
Name, Last name: Önay Burak Doğan
Signature:
Page 5
v
ABSTRACT
MICROBIAL DETOXIFICATION OF GROUNDNUT MEAL NATURALLY
CONTAMINATED WITH AFLATOXIN USING RHODOCOCCUS
ERYTHROPOLIS
Doğan, Önay Burak
M.S., Department of Food Engineering
Supervisor: Assoc. Prof. Dr. Deniz Çekmecelioğlu
Co-Supervisor: Prof. Dr. Tahsin Faruk Bozoğlu
August 2015, 103 pages
Aflatoxins are highly mutagenic toxins with carcinogenic effects produced
as secondary metabolites by fungal species Aspergillus flavus and Aspergillus
parasiticus under certain conditions. Chronic or acute consumption of aflatoxins
found in food and feed products possesses great health risks. It is particularly an
important problem in animal feed from food waste and by-products. Therefore there
is growing need to eliminate aflatoxins from contaminated products.
In this study, first the optimum growth conditions of gram-positive, aerobic
bacterium Rhodococcus erythropolis, which is known to be degrading aflatoxin,
were determined in synthetic media. One factor at a time approach was adopted to
determine the most effective carbon and nitrogen sources for growth. Plackett-
Burman design was used to screen other variables (temperature, pH, liquid culture
volume, agitation speed and concentrations of nitrogen and carbon sources)
Page 6
vi
important for growth. Three variables determined as significant by Plackett-Burman
design was then further evaluated with Box-Behnken response surface optimization
method and optimum conditions were defined for growth of R. erythropolis.
For better understanding of aflatoxin degrading ability of R. erythropolis,
viable cells and crude extracellular enzymes were compared. Process conditions for
detoxification of Aflatoxin B1 were optimized by Box-Behnken response surface
method with three variables (solid concentration, inoculum volume and time).
Decrease in toxicity of treated groundnut meal was assessed by sheep liver
glutathione-S-transferase (GST) assay.
The results showed that peptone and glucose are the best nitrogen and
carbon sources for growth of R. erythropolis, respectively. Optimal culture
conditions were found as 22.5 °C of temperature, pH 7, 100 mL of liquid volume in
500 mL flasks, 1% (v/v) of inoculum volume, 135 rpm of agitation speed, 5 g/L of
glucose concentration and 5 g/L of peptone concentration.
Viable cells were found to be more effective for Aflatoxin B1 degradation
and used for rest of the study. It was observed that R. erythropolis cells and
extracellular enzymes are able to degrade aflatoxin even when grown in absence of
the toxin. It was observed that viable cell cultures of R. erythropolis performed
better detoxification activity than extracellular enzymes. Optimum conditions for
detoxification were found as 27.4 %(w/v) of solid concentration, 4.88 %(v/v) of
inoculum volume and 24 h of time by Box-Behnken response optimization. At these
conditions maximum reduction in AFB1 was predicted as 92.2% and verified as
87.3% Toxicity of treated groundnut meal extracts were found to be decreased
significanty by GST assay. Treated samples inhibited the enzyme activity 64.5%
and untreated samples inhibited 86.6%.
As a result, viable cell cultures of R. erythropolis was suggested as
an effective detoxification agent for aflatoxin contaminated groundnut meal used
for animal feed.
Page 7
vii
Keywords: Mycotoxins, aflatoxin, detoxification, Rhodococcus erythropolis,
groundnut meal.
Page 8
viii
ÖZ
DOĞAL OLARAK AFLATOKSİN İLE KONTAMİNE OLMUŞ YERFISTIĞI
KÜSPESİNİN RHODOCOCCUS ERYTHROPOLIS KULLANILARAK
MİKROBİYAL DETOKSİFİKASYONU
Doğan, Önay Burak
Yüksek Lisans, Gıda Mühendisliği Bölümü
Tez Yöneticisi: Doç. Dr. Deniz Çekmecelioğlu
Ortak Tez Yöneticisi: Prof. Dr. Tahsin Faruk Bozoğlu
Ağustos 2015, 103 sayfa
Aflatoksinler Aspergillus flavus ve Aspergillus parasiticus türü küflerin
belirli koşullar altında ürettiği kanserojen etkiye sahip mutajenik ikincil
metabolitlerdir. Gıda ve yemlerde bulunan aflatoksinlerin kronik veya akut tüketimi
büyük sağlık risklerine neden olmaktadır. Özellikle gıda artıkları ve yan
ürünlerinden üretilen yemlerde aflatoksin önemli bir sorundur. Bu nedenle
kontamine olmuş ürünlerde aflatoksinleri giderme gereksinimi her geçen gün
artmaktadır.
Bu çalışmada öncelikle aflatoksin parçaladığı bilinen gram-pozitif ve
aerobic Rhodococcus erythropolis bakterisinin en uygun gelişim koşulları sentetik
ortamda belirlenmiştir. Gelişim için en etkili olan karbon ve azot kaynaklarının
belirlenmesi için her seferinde bir faktör değiştirme yaklaşımı kullanılmıştır.
Gelişim için önemli faktörler (sıcaklık, pH, sıvı kültür hacmi, çalkalama hızı ile
azot ve karbon kaynakları derişimi) Plackett-Burman yöntemi ile taranmıştır.
Plackett-Burman tasarımı sonucunda belirlenen önemli üç faktör (sıcaklık, sıvı
Page 9
ix
hacmi ve çalkalama hızı) daha sonra Box-Behnken tepki yüzey optimizasyonu
yöntemiyle incelenmiş ve R. erythropolis gelişimi için gerekli en uygun koşullar
belirlenmiştir.
R. erythropolis’in aflatoksin parçalama yeteneğinin daha iyi anlaşılması için
canlı hücre kültürleri ve hücredışı enzimleri karşılaştırılmıştır. Aflatoksin B1
detoksifikasyon işlemi üç faktörlü (katı derişimi, aşılama hacmi ve süre) Box-
Behnken tepki yüzey yöntemi ile incelenmiştir. İşlenmiş yerfıstığı küspesinde
toksisite değişimi koyun karaciğeri glutathione-S-transferase enzimatik yöntemiyle
değerlendirilmiştir.
Sonuçlar, R. erythropolis gelişimi için en uygun azot ve karbon
kaynaklarının pepton ve glikoz olduğunu göstermiştir. En uygun gelişim koşulları;
22.5°C sıcaklık, 7 pH, 500 mL erlen içerisinde 100 mL sıvı hacmi, %1 aşılama
hacmi, 135 dev/dak çalkalama hızı, 5 g/L glikoz derişimi ve 5 g/L pepton derişimi
olarak bulunmuştur.
Canlı hücrelerin Aflatoksin B1 parçalamada daha etkili olduğu saptanmış ve
çalışmanın geri kalanında bakteri kültürü bu şekilde kullanılmıştır. R. erythropolis
hücreleri ve hücre dışı enzimlerinin aflatoksin yokluğunda geliştirildiğinde bile
AFB1’i parçalamada etkili olduğu gözlemlenmiştir. R. erythropolis’in canlı hücre
kültürlerinin hücre dışı enzimlere göre daha iyi detoksifikasyon etkisi sağladığı
gözlemlenmiştir. Box-Behnken deney tasarımının analizi sonucunda en uygun
detoksifikasyon koşulları ise 27.4 %(w/v) katı derişimi, % 4.88(v/v) aşılama hacmi
ve 24 saat işlem süresi olarak belirlenmiştir. Bu koşullar altında teorik olarak %92.2
detoksifikasyon sağlanması öngörülmektedir ve bu koşullarda tekrarlanan
doğrulama deneylerinde %87.2 detoksifikasyon sağlanmıştır. İşlenmiş yerfıstığı
küspesinin toksisitesinin önemli derecede azaldığı da saptanmıştır. İşlenmiş
örnekler enzim aktivitesini %64.5 oranında inhibe ederken, işlenmemiş örnekler
%86.6 oranında inhibe etmiştir.
Sonuç olarak, R. erythropolis’in canlı hücre kültürleri, aflatoksinlerle
kontamine olmuş ve hayvan yeminde kullanılacak yerfıstığı küspesinin
detoksifikasyonunda etkili detoksifikasyon ajanı olarak önerilmektedir.
Page 10
x
Anahtar Kelimeler: Mikotoksinler, aflatoksin, detoksifikasyon, Rhodococcus
erythropolis, yerfıstığı küspesi.
Page 12
xii
ACKNOWLEDGEMENTS
I would like to express my gratitude and respect to my advisor and mentor,
Assoc. Prof. Dr. Deniz Çekmecelioğlu for his guidance, support and encouragement
through this study. I would like to thank my co-advisor Prof. Dr. Faruk Bozoğlu for
his kind support.
I would also like to thank the examining committee members Prof. Dr.
Zümrüt Begüm Ögel, Assoc. Prof Dr. İlkay Şensoy Assist. Prof. Dr. Baran Önal
Ulusoy, and Assist. Prof Dr. Yeşim Soyer.
METU-BAP coordination (BAP-03-14-2014-008) kindly funded this study
and The Scientific and Technological Council of Turkey (TÜBİTAK) provided
financial support during my thesis studies.
I would like to thank very much to Assist. Prof. Dr. Baran Önal Ulusoy for
aflatoxin analysis in HPLC and Assoc. Prof. Dr. Gülçin Sağdıçoğlu Celep for her
help in sheep liver cytosol preparation.
I owe a debt of gratitude to my lab mates Gözde Ören Yardımcı and Sibel
Uzuner for their valuable contributions. I would like to thank all my colleagues and
friends; Ece Bulut, Ceren Kuvvet, Meltem Karadeniz, Elçin Bilgin, Elif Yıldız
Bulut, Betül Çilek Tatar, Oya Nihan Uncu Bilau and Armağan Cabadağ.
I would like to say thanks to Ali Übeyitoğulları, Ahmet Yıldız and Sertan
Cengiz for their friendship, they always cheered me up in dark days. Thanks to my
wife-to-be Ezgi Ulusoy for her endless love and support.
Finally I would like to express my deepest gratitudes to my parents Gülay-
Önder Doğan and my aunt Ayşegül Kırış for their invaluable support, belief and
unconditional love.
Page 14
xiv
TABLE OF CONTENTS
ABSTRACT ........................................................................................................... v
ÖZ ...................................................................................................................... viii
ACKNOWLEDGEMENTS ..................................................................................xii
TABLE OF CONTENTS ..................................................................................... xiv
LIST OF TABLES ............................................................................................xviii
LIST OF FIGURES ............................................................................................. xix
CHAPTERS
1. INTRODUCTION .............................................................................................. 1
2. LITERATURE REVIEW ................................................................................... 3
2.1 Mycotoxins................................................................................................... 3
2.1.1 Aflatoxins ................................................................................................. 3
2.1.1.1 Metabolism of aflatoxin in human and animal bodies ........................... 5
2.1.1.2 Effect of aflatoxin on liver enzymes ....................................................... 7
2.1.1.3 Cost of aflatoxin contamination .............................................................. 8
2.1.1.4 Aflatoxin management and regulations ................................................... 9
2.2 Detoxification of Aflatoxins ......................................................................... 11
2.2.1. Physical methods of detoxification ......................................................... 11
2.2.2. Chemical methods of detoxification........................................................ 13
2.2.3. Biological methods of detoxification ...................................................... 14
2.2.3.1. Microbiological methods ................................................................... 14
2.2.3.2. Enzymatic methods ........................................................................... 16
2.3. Groundnut ................................................................................................... 17
Page 15
xv
2.4. Rhodococcus erythropolis ............................................................................ 20
2.4.1. Aflatoxin degradation ability of R. erythropolis. ..................................... 21
2.5 Objectives of the study ................................................................................. 24
3. MATERIALS AND METHODS ...................................................................... 25
3.1 Materials ....................................................................................................... 25
3.1.1 Raw materials .......................................................................................... 25
3.1.2 Chemicals ................................................................................................ 26
3.1.3. Buffers and solutions .............................................................................. 26
3.1.4. Growth medium ...................................................................................... 26
3.2. Methods ....................................................................................................... 26
3.2.1 Sample preparation .................................................................................. 26
3.2.2 Bacterial counts and optical density ......................................................... 29
3.2.3 Aflatoxin analysis .................................................................................... 29
3.2.3.1 Aflatoxin extraction ............................................................................ 29
3.2.3.2 Immunoaffinity column chromatography ............................................ 29
3.2.3.3 HPLC analysis .................................................................................... 30
3.2.4 Preparation of sheep liver cytosol ............................................................ 30
3.2.5 Sheep liver glutathione-S-transferase assay .............................................. 31
3.2.6 Statistical methods ................................................................................... 31
3.2.6.1 One factor at a time approach (OFAT) ................................................ 31
3.2.6.2 Plackett-Burman design (PB) .............................................................. 32
3.2.6.3 Response surface optimization ............................................................ 35
3.2.6.3.1 Box Behnken (BB) design for optimization of culture conditions 35
3.2.6.3.2 Box-Behnken (BB) design for optimization of AFB1 detoxification
.................................................................................................................. 38
Page 16
xvi
3.2.6.4 Model verification .............................................................................. 40
4. RESULTS AND DISCUSSION........................................................................ 41
4.1 Growth curve of R. erythropolis NRRL B-16531 .......................................... 41
4.2 Optimization of growth conditions................................................................ 42
4.2.1 One factor at a time ................................................................................. 42
4.2.2 Plackett-Burman (PB) design .................................................................. 45
4.2.3 Box-Behnken (BB) response surface optimization of R. erythropolis
growth ............................................................................................................. 46
4.3 Evaluation of AFB1 degradation by viable cells and extracellular enzymes ... 56
4.4 Optimization of AFB1 degradation................................................................ 58
4.4.1 Box-Behnken (BB) response surface optimization of AFB1 detoxification
........................................................................................................................ 58
4.5 Sheep liver glutathione-S-transferase (GST) assay ........................................ 66
4.6 Industrial applicability of detoxification by R. erythropolis ........................... 68
5. CONCLUSIONS AND RECOMMENDATIONS ............................................. 69
REFERENCES ..................................................................................................... 71
APPENDICES
A. CHEMICALS LIST ......................................................................................... 85
B. BUFFERS AND SOLUTIONS ........................................................................ 87
C. LOWRY’S METHOD FOR PROTEIN DETERMINATION ........................... 89
D. STANDARD CURVE FOR CELL GROWTH ................................................ 91
E. SAMPLE HPLC CHROMATOGRAM ............................................................ 93
F. ANOVA TABLES FOR MULTIPLE COMPARISONS ................................... 95
G. CULTURE GROWTH OPTIMIZATION ........................................................ 99
H. AFB1 DEGRADATION OPTIMIZATION .................................................... 101
I. GST ASSAY ................................................................................................... 103
Page 18
xviii
LIST OF TABLES
TABLES
Table 2.1 Nutrient composition of groundnut meal. .............................................. 19
Table 3.1 Ranges of process variables used for PB design .................................... 33
Table 3.2 PB design parameters for screening of major factors for R. erythropolis
growth. (Coded factors) ........................................................................................ 34
Table 3.3 Ranges of variables for BB optimization............................................... 36
Table 3.4 Experimental design matrix of BB design for growth optimization (coded
factors) ................................................................................................................. 37
Table 3.5 Ranges of variables for BB design for optimization of AFB1 degradation.
............................................................................................................................. 38
Table 3.6 Experimental design matrix of BB design for AFB1 degradation
optimization (coded factors) ................................................................................. 39
Table 4.1 Results of Box-Behnken design for culture growth ............................... 48
Table 4.2 Optimum conditions for maximum growth of R. erythropolis ............... 50
Table 4.3 Results of Box-Behnken design for AFB1 degradation .......................... 59
Table 4.4 Optimal conditions for maximum detoxification ................................... 60
Table A.1 Table of chemicals ............................................................................... 85
Page 19
xix
LIST OF FIGURES
FIGURES
Figure 2.1 Chemical structures of Aflatoxins B1, B2, G1, G2 and M1. (FDA 2012) . 5
Figure 2.2 An overview of AFB1 metabolism. (Yiannikouris and Jouany 2002) .... 7
Figure 2.3 Suggested degradation pathway of AFB1 by R. erythropolis. (Eshelli,
Harvey et al. 2015) ............................................................................................... 23
Figure 3.1 Overview of the detoxification process ............................................... 28
Figure 4.1 Growth curve of R. erythropolis ......................................................... 42
Figure 4.2 Effects of different carbon sources on R. erythropolis growth. ............ 43
Figure 4.3 Effects of different nitrogen sources on R. erythropolis growth .......... 44
Figure 4.4 Pareto chart for screening important factors for R. erythropolis growth.
............................................................................................................................ 46
Figure 4.5 Experimental vs predicted values of log number of cells ..................... 50
Figure 4.6 Surface plot showing the effect of temperature and agitation speed at
constant liquid volume ......................................................................................... 52
Figure 4.7 Surface plot showing the effect of temperature and liquid volume at
constant agitation speed ....................................................................................... 53
Figure 4.8 Surface plot showing the effect of liquid volume and agitation speed at
constant temperature ............................................................................................ 54
Figure 4.9 Contour plots for growth optimization ................................................ 55
Figure 4.10 Evaluation of AFB1 degradation capacity of viable cells and
extracellular enzymes ........................................................................................... 57
Figure 4.11 Experimental vs predicted values of AFB1 reduction ........................ 61
Page 20
xx
Figure 4.12 Surface plot showing the effect of solid concentration and inoculum
volume at constant time ........................................................................................ 63
Figure 4.13 Surface plot showing the effect of inoculum volume and time at
constant solid concentration .................................................................................. 64
Figure 4.14 Surface plot showing the effect of solid concentration and time at
constant inoculum volume .................................................................................... 65
Figure 4.15 Contour plots for AFB1 degradation .................................................. 66
Figure 4.16 AFB1 Inhibition of GST activity towards CDNB. .............................. 67
Figure C.1 Standard curve for Lowry’s method for protein determination ............ 90
Figure D.1 Standard curve for cell growth monitoring ......................................... 91
Figure E.1 Sample HPLC chromatogram for aflatoxin determination................... 93
Figure I.1 Optical density at 340nm for GST assay ............................................ 103
Page 21
1
CHAPTER 1
INTRODUCTION
Aflatoxins are toxic metabolites, which can be found on some very
important agricultural commodities. Aflatoxin contamination is a widespread threat
for human and animal health and it causes a considerable loss of natural and
economic resources.
Groundnut meal is an important feed source especially for poultry and other
livestock. This raw material is rich in protein and fibers but highly susceptible to
fungal contamination. High levels of aflatoxins in groundnut meal may result in
discard of large amounts.
To overcome health effects and economic loss of aflatoxin contamination,
detoxification strategies are gaining importance. In current literature, several
physical, chemical and biological methods for detoxification were suggested. In this
study, efficiency of microbial detoxification by direct use of gram-positive
bacterium R. erythropolis was evaluated.
The aim of this study was to decrease the amount of aflatoxins in naturally
contaminated groundnut meal using R. erythropolis as an efficient detoxifying
agent. By this way, it was also aimed to recover this valuable by-product to
agricultural economy.
Before observing the aflatoxin degrading ability of this microorganism,
growth characteristics and optimum conditions were determined (Chapter 4). First,
one at a time approach was adopted to decide on which carbon and nitrogen sources
were utilized best by the organism (Chapter 3). After that, different growth
Page 22
2
conditions (temperature, pH, liquid culture volume, agitation speed and
concentrations of nitrogen and carbon sources) were screened using Plackett-
Burman design method. Three process variables (temperature, liquid volume,
agitation speed) determined to be significant were then used for optimization by
Box-Behnken response surface method.
In chapter 2, current literature on aflatoxins, detoxification approaches,
target raw material groundnut meal and biocatalyst R. erythropolis are reviewed for
better understanding.
For better understanding of the aflatoxin detoxification, the effect of
extracellular enzymes or bacterial cultures were also examined (Chapter 4). Three
independent variables (solid concentration, inoculum volume and time) were
selected for optimization of aflatoxin detoxification using the Box-Behnken design.
Decrease in toxicity was evaluated by glutathione-S-transferase assay under optimal
conditions.
In chapter 5, overall conclusions are made about this study, and
recommendations are given for those who will study this topic or similar in future.
Also, applicability of this method to the industry was evaluated.
Page 23
3
CHAPTER 2
LITERATURE REVIEW
2.1 Mycotoxins
Mycotoxins are toxic secondary metabolites produced by several mold
species. Common groups of mycotoxins are Aflatoxins, Ochratoxins, Citrinin, Ergot
Alkaloids, Patulin and Fumonisins. Food and feed products colonized by
mycotoxin producing molds can be exposed to different types of mycotoxins which
may cause cancer or liver deterioration and thus provide a great threat for human
and animal health and global economy.
Along rapid development of food and feed production industry, the concept
of food safety is also gaining importance. Although foodborne infections and
intoxications are subjects studied for hundreds of years, risks belonging to fungal
toxins is fairly a new topic. The first case of mycotoxicosis was reported as “Turkey
X disease” in the United Kingdom in 1960 in which more than 100,000 turkeys
were fed with aflatoxin contaminated peanut meal (Wannop, 1961). Only after this
date, studies on mycotoxins gained speed and the last major group of mycotoxins,
fumonisins were discovered in 1988 (Yiannikouris & Jouany, 2002). Mycotoxin
contamination can begin on any stage of the production including natural raw
material, processing and storage.
2.1.1 Aflatoxins
Aflatoxins are furanocoumarin type of secondary metabolites produced by
some strains of fungal species Aspergillus flavus and Aspergillus parasiticus. There
Page 24
4
are 18 derivatives of aflatoxins discovered so far, and four of them, namely B1, B2,
G1 and G2 are produced by Aspergillus. These fatal molecules are named upon their
fluorescence behavior under long wave ultraviolet light. B type of aflatoxins give
blue and G type of aflatoxins give green color when excited by UV. Toxicity of
aflatoxins is in the order of B1>G1>B2>G2 (McLean & Dutton, 1995). The chemical
structures of aflatoxins B1, G1, B2, G2 and also M1 are given in Figure 2.1.
Mutagenic and toxigenic properties of aflatoxins are associated with lactone
ring structure in the toxin and according to Lee et al. (1981), fluorescence behavior
and toxic effects of aflatoxins are directly related. Cleavage of the lactone ring,
reduces the mutagenity of the molecule by 450-fold and toxicity by 18-fold. This
reduction can be monitored by loss of fluorescence under UV excitation.
Page 25
5
Figure 2.1 Chemical structures of Aflatoxins B1, B2, G1, G2 and M1. (FDA, 2012)
2.1.1.1 Metabolism of aflatoxin in human and animal bodies
In living organisms, aflatoxin acts as toxigenic, carcinogenic, mutagenic and
teratogenic agent. Poisoning due to aflatoxin consumption is named as
“aflatoxicosis”. Consuming high levels of aflatoxins results in acute aflatoxicosis.
On the other hand, consuming low levels of aflatoxins for long periods of time
results in chronic aflatoxicosis. Signs of acute toxicosis can be clearly monitored by
congestion and bleeding triggered by liver lesions which are the result of fatty acid
accumulation in the liver. A rapid death (usually a few hours or days) occurs.
Page 26
6
Chronic toxicosis is more common in animal and human. DNA changes induced by
aflatoxins cause slow death of liver cells or formation of tumor cells. In addition,
aflatoxin causes immune system deficiency in livestock, which can lead to other
diseases (Yiannikouris & Jouany, 2002).
Aflatoxicosis is very common in mammals, however abovementioned
effects can vary from one organism to another. Some species can be highly
susceptible, however others like mice are more resistant to adverse effects of
aflatoxins in the liver (Ellis et al., 1991).
AFB1 or other major aflatoxins do not exhibit harmful behavior on their
primary states. Microsomal enzyme sets convert AFB1 to its AFB1-8,9-epoxide
(AFBO). This intermediate molecule is then forwarded to detoxification
mechanisms to conjugate with proteins and glutathione. Detoxified Glutathione-
Aflatoxin conjugate (GSH-AFBO) is excreted from the system but remaining toxic
parts are tend to interact with DNA, RNA and enzymes. Binding of AFB1 to DNA
or RNA causes mutations and errors in protein synthesis. AFB1 also known to
inhibit the activity of important enzymes such as adenosine triphosphatase, enzymes
responsible for glycogenesis and RNA polymerase (Mishra & Das, 2003; Yu,
1977).
Figure 2.2 represents an overview of AFB1 metabolism. By oxidation in the
rumen and liver, AFB1 is converted into another very toxic metabolite, aflatoxicol.
Liver enzyme systems are responsible of oxidation or epoxidation of AFB1. If toxin
is oxidized, other toxic derivatives such as M1, Q1, B2 and P1 are formed.
Particularly important AFM1 is excreted in milk. In epoxidation pathway, AFBO is
formed which is later detoxified by liver enzymes. However, when high amounts
are consumed, all of the epoxide is not detoxified and binds to nucleic acids or
proteins in liver, causing enzyme inhibition and mutations.
Page 27
7
Figure 2.2 An overview of AFB1 metabolism. (Yiannikouris & Jouany, 2002)
2.1.1.2 Effect of aflatoxin on liver enzymes
Reaching the liver, AFB1 is due to a detoxification process, like many other
xenobiotic compounds, where activated toxic compounds are converted into their
water soluble derivatives. Microsomal and cytosolic glutathione-S-transferases
(GSTs) are responsible for detoxifying xenobiotic compounds by catalyzing the
reaction between xenobiotic compounds and –SH group of glutathione (GSH).
Page 28
8
Therefore, GST enzymes protect the cells from the toxigenic and carcinogenic
compounds by forming GSH conjugates (Habig et al., 1974; Strange et al., 2001).
Tests show that GST activity in liver and kidneys is decreased when animals
are fed with AFB1 contaminated feed. Meki et al. (2001) reported that GST activity
in the livers of rats fed with 50 μg AFB1/kg body weight were decreased
significantly. Devendran and Balasubramanian (2011) also reported decreasing
activity of in liver and kidney GST enzymes while increasing AFB1 administration
to the rats.
GST assay is widely used to measure resistance of animal tissues oxidative
damage caused by foreign toxic compounds and medicines in vitro. GST activity is
important when studying effects of antioxidant properties of medicinal herbs (Coruh
et al., 2007). It is also used for studying the effects of aflatoxins and
chemopreventive compounds on liver tissues (Gao et al., 2010).
2.1.1.3 Cost of aflatoxin contamination
In addition to adverse health effects of aflatoxins on human and animals,
they cause a great damage on global economics. Besides the costs of cancer cases
related to aflatoxins, trade restrictions, discarding of contaminated materials, cost of
detection and research activities are important factors comprising the aflatoxin
economy loss.
Liver cancer is the third most deadly type of cancer. Each year, from
550,000 to 600,000 people are estimated to be diagnosed with liver cancer
worldwide. Among these cases, 25,200 to 155,000 are related to chronic aflatoxin
consumption. Aflatoxin related cancer cases are more prevalent in developing
countries, rather than developed countries (Liu & Wu, 2010). According to
American Cancer Society report (2010), liver cancer accounts for 8.6% of the total
cancer cases and the total cost of cancer patients worldwide was estimated as US$
Page 29
9
895 billion in 2008. Therefore, cost of aflatoxin related cancer can be estimated as
US$ 12.5 billion worldwide.
Trade barriers due to aflatoxin limits is a great problem for developing
countries whose economies are dependent on agricultural exports to developed
countries mostly Europe and America. The European Union aflatoxin regulations
aim to reduce health risks by 1.4 deaths per billion of their population annually.
However, these strict regulations are estimated to decrease African agricultural
exports by 64% which means a loss of US$ 670 million per year (Otsuki et al.,
2001).
Management of aflatoxin problem, by detection and prevention researches
also put stress on agricultural industry. In the US, where mycotoxin control
mechanisms are well implemented, cost of combined pre and post-harvest
biocontrol mechanisms is US$ 42-79 per hectare of crop field (Khlangwiset & Wu,
2010). This figure is subject to change with the type of crop and also severity of the
aflatoxin problem. For the peanut industry in Southern US, Lamb and Sternitzke
(2001) estimates an average of US$ 69.34 management costs per hectare of peanut
fields. Thus, cost effective and sustainable methods are still required.
2.1.1.4 Aflatoxin management and regulations
A three stage mechanism is suggested for control and prevention of mycotoxins
in human or animal feed. Primary prevention is to take preliminary measures
against contamination at pre-harvest stage. Secondary prevention step is to
eliminate fungal growth while the product can still be used. However, when the
food material is highly contaminated, tertiary prevention measures must be taken to
eliminate toxins and inhibit fungal growth. (Suttajit, 1991)
By the emerge of mycotoxin problem in food and feed stuff at 1960’s, many
countries began to establish legislations in order to control contamination starting
from late 1970’s. This topic was first reviewed comprehensively by Food and
Page 30
10
Agriculture Organization (1997) in 1995 and it was updated for the last time in
2003 (FAO, 2004). In 2003, among 117 investigated countries, at least 100
countries had regulations for mycotoxin levels in food and feed. Although there is
30% increase compared to 1995, there are still countries which don’t limit
mycotoxins. Many of those countries applying limits on mycotoxin, pay a great
attention to aflatoxins since they have specific limits on only AFB1, total aflatoxins
(B1+B2+G1+G2) or both (van Egmond & Jonker, 2004).
In Turkey, aflatoxin limits are updated in accordance with the European
Union limits. According to Turkish Food Codex, groundnuts and other oily seeds
can contain at maximum, 8.0 μg/kg AFB1 and 15.0 μg/kg total aflatoxin (2011). For
animal feed, only AFB1 limits are applied and maximum allowance is 20 μg/kg,
however, mixed formulations for dairy cattle and calves, dairy sheep and lamb,
dairy goats, porklings and young poultry can only contain 5 μg/kg AFB1 (2014).
These limits are in complete accordance with European Commission regulations
(2006).
Exposure of human and animals to aflatoxin is particularly a great problem
for Africa because of the climate conditions and primitive agricultural practices. In
2002, only 14 countries in Africa were known to have specific mycotoxin limits and
these limits are often applied only to exported products. This number represents a
coverage of only 54% of the population of the continent, and the rest of the African
population is under the risk of consuming aflatoxin contaminated products (Magan
et al., 2011; van Egmond & Jonker, 2004).
Although mycotoxin contamination doesn’t seem to be the greatest problem
for crop producers in Europe and Middle East, due to global climate change at its
utmost pace, a higher rate of mycotoxigenic contamination is expected in these
regions in near future (Magan et al., 2011).
Page 31
11
2.2 Detoxification of Aflatoxins
Health issues and economic losses due to aflatoxin contamination led
science and industry to find ways to reduce aflatoxin content of food and feed stuff
to acceptable levels. Detoxification studies have been conducted on three subtitles;
physical, chemical and biological methods.
2.2.1. Physical methods of detoxification
Physical methods of detoxification refer to decontamination of food and feed
materials by means of separation and degradation. The most commonly suggested
methods are extraction of aflatoxins by solvents, adsorption to solids or using
electromagnetic waves such as γ-rays, UV-light or microwaves.
Gardner et al. (1968) studied separation of aflatoxins from cottonseed and
peanut meals using tertiary and binary solvent mixtures containing different ratios
of acetone, hexane and water. Peanut meal was initially naturally contaminated with
400 to 700 μg/kg total aflatoxins. Using tertiary system containing 54% acetone,
44% hexane and 2% water and binary system containing 90% acetone and 10%
water, 85% and 95% reduction in aflatoxins were reported respectively.
In another study, aqueous isopropanol was suggested for removal of
aflatoxin from cottonseed and peanut meals (Rayner & Dollear, 1968). It was
reported that aflatoxins were not detectable by thin-layer chromatography after
extraction with 6 passes of 80% isopropanol at 60°C for both oilseed meals. Trials
with 88% isopropanol-water azeotrope, however, removed only 88% of aflatoxins
and it was concluded that efficiency of this method was dependent on the
concentration of isopropanol and temperature.
Fonseca and Regitano-d'Arce (1993) suggested 90°, 93° and 96° commercial
ethanol by Soxhlet extraction for peanut meal contaminated with 400 μg/kg AFB1.
They reported that pure ethanol did not reduce the amount of AFB1 significantly.
Page 32
12
However, using 93° and 96°, a complete removal of aflatoxins were detected after
210-240 minutes of extraction.
Use of solid adsorbents is another common method to decrease the adverse
effect of aflatoxins in animal feeds. Adsorbents added to the feed, binds the toxin in
the gastrointestinal tract of animal, lowering the bioavailability during digestion.
Huwig et al. (2001) made a comparison between most commonly used groups of
mycotoxin adsorbents; aluminosilicates, activated charcoal and special polymers.
Although these materials have high capacity for binding mycotoxins in vitro, they
exhibited different interactions in living systems.
Reduction in the mutagenity of AFB1 due to the susceptibility to ionizing
radiation was first reported by Dyck et al. (1982). Aziz et al. (2004) studied the
effect of γ radiation on fungus growth and aflatoxin detoxification on naturally
contaminated maize, chickpeas and groundnuts. It was reported that 4.0 kGy of
irradiation inhibited the growth of mycotoxin producing fungi significantly and at a
dose of 5.0 kGy, growth was totally inhibited. At the same time, application of 6.0
kGy radiation decreased the amount of AFB1 by 74.3-76.7%. Ghanem et al. (2008)
made trials on different food and feed raw materials at 4.6 and 10 kGy radiation. In
peanuts, only 56.6% reduction in AFB1 was achieved and it was observed that the
oil content of the material interferes with the efficiency of γ-irradiation process.
Herzallah et al. (2008) investigated the effect of solar radiation, γ-radiation
and microwave heating on aflatoxin residues in poultry feed. Aflatoxin residues
after treatments were analyzed by ELISA method. More than 60% of
photodegradation was observed in samples exposed to direct sunlight for 30 hours
and the efficiency of this method was found to be independent of the initial toxin
concentration. In samples treated by irradiation doses ranging from 5 to 20 kGy 34
to 40% reduction were detected. Only microwave heating was the least effective
method with a degradation rate of 22 to 32%.
Although physical methods seem feasible, there are limitations and
drawbacks. Use of solvents may leave residues in the product and also affects the
Page 33
13
overall quality by extracting some important nutrients. Adsorbents are good binders
theoretically, but under the rumen conditions, efficiency of binding stays limited.
Electromagnetic degradation methods, on the other hand, require high amount of
initial investment, also limited penetration depth and uneven treatment risks limits
the efficiency.
2.2.2. Chemical methods of detoxification
Chemical methods of detoxification refer to degradation of aflatoxins by
chemical alterations with addition of chemicals.
Ammoniation was suggested as an efficient and economically feasible way
of decontamination for oilseeds. Lee and Cucullu (1978) were able to achieve a
high decontamination rate that only 0.36% of aflatoxin B1 residue was detected in
cottonseed and peanut meal samples. However, despite the high decontamination
rates, there are concerns about the safety of ammonia application for aflatoxin
decontamination. In their study, investigating the in vivo effects of ammonia treated
peanut meal, Neal et al. (2001) reported a decrease in the growth rate of male rats
fed with ammonia treated peanut meal for 90 days. Also, lesions and tumors due to
breakdown products were detected in rat livers.
Ozone treatment is another chemical decontamination method for aflatoxins.
Dwarakanath et al. (1968) were able to achieve 78% destruction of AFB1 in high
moisture peanut meal by ozone treatment at 100°C for an hour. AFB1 and AFG1
were easily destroyed by ozone treatment but AFB2 was more resistant to the
treatment. Akbas and Ozdemir (2006) ozonated artificially contaminated ground
and kernel pistachio. AFB1 in samples were reduced by 23% and the total aflatoxins
were reduced by 24% when treated with 5 mg/L ozone for 140 minutes; indicating
that AFB1 is especially more susceptible to ozone than its other derivatives. Yet,
negative changes in sensory attributes were detected in ozone treated pistachios.
Page 34
14
Samarajeewa et al. (1991) applied 11, 16 and 35 mg chlorine gas for each
grams of corn meal, copra meal and peanuts and achieved more than 75%
degradation of AFB1. Together with the reduction in AFB1 levels, a reduction in the
mutagenicity was also detected.
Li et al. (2009) studied the effect of citric acid treatment on B-type
aflatoxins in peanuts. Treating for 30 minutes with 80g/L citric acid solution
decreased the aflatoxin content from 98.60 µg/kg to below 20 µg/kg. Méndez-
Albores et al. (2007) decontaminated duckling feed initially containing 110 μg/kg
AFB1 with citric acid by up to 86% and reported a decrease of toxicity in treated
samples.
Chemical methods are suggested for cost efficiency, however there are many
risks associated with chemically treated food and feed stuff. Ammoniation and
ozonation are very effective, yet they are also toxic and undesirable chemical
changes can occur depending on the type of contaminated product. When using
other powerful chemicals, it is possible that nutritive and sensory properties are also
changed.
2.2.3. Biological methods of detoxification
Biological detoxification methods are based on conversion of aflatoxins to less
toxic metabolites by direct use of microorganisms or enzymes.
2.2.3.1. Microbiological methods
Ciegler et al. (1966) screened about a thousand different microorganisms
including yeasts, molds, bacteria, actinomycetes, algae and fungal spores for their
ability to degrade aflatoxin. Among those, only gram-negative bacterium
Flavobacterium aurantiacum was able to detoxify contaminated milk, oil, peanut
butter, peanuts and corn partially and the mechanism of action was suggested as
enzymatic (Smiley & Draughon, 2000). Duckling assays showed that no new toxic
Page 35
15
metabolites were produced by this bacterium. However, an orange color
pigmentation is reported with the use of this microorganism (Line et al., 1994). F.
aurantiacum is later reclassified as Nocardia corynebacterioides (Teniola et al.,
2005). Interestingly, this bacterium was again reclassified as Rhodococcus
corynebacterioides, which has a 16S rRNA gene sequence consistent with the
family Rhodococcus (Yassin & Schaal, 2005).
Teniola et al. (2005) first described aflatoxin degrading ability of R.
erythropolis by using cell free extracts in liquid culture. R. erythropolis offered a
high degradation rate with less toxic metabolites under relatively milder conditions.
Aflatoxin degradation ability of this microorganism is further reviewed in Chapter
2.4.1.
Some Pseudomonas strains are also reported as aflatoxin degraders. Sangare
et al. (2014) identified Pseudomonas aeruginosa among 25 other bacterial isolates,
to have capability of degrading aflatoxins in liquid culture media. Maximum
degradation of 90.2% was achieved at temperature of 55°C. Samuel et al. (2014)
were able to reduce AFB1 levels in liquid culture to non-detectable levels by
incubating two P. putida strains for 24 hours at 37°C.
Guan et al. (2010) examined aflatoxin degradation efficiency of gram-
negative bacteria Myxococcus fulvus. This microorganism was able to transform
80.7% of AFB1 incubated in liquid culture media at 30°C for 72 hours. It was
observed that the supernatant of the culture, therefore the extracellular enzymes
were responsible for the degradation process. During the degradation, it was
observed that the lactone ring structure was disturbed.
Some members of Lactic Acid Bacteria (LAB) family is known to bind
aflatoxins physically to their cell walls. While studying the growth inhibitory effect
of Streptococcus lactis on aflatoxin producing fungi A. flavus, Coallier-Ascah and
Idziak (1985) observed a so-called “degradation” of previously formed aflatoxin in
liquid culture. However, this phenomenon was later explained as physical binding
rather than a biochemical conversion (El-Nezami et al., 1998). Haskard et al. (2001)
Page 36
16
reported that Lactobacillus rhamnosus strain GG and L. rhamnosus strain LC-705
were the most efficient binders of aflatoxins among 12 different LAB strains.
Although bound toxins were stable under temperature, pH deviations and physical
stress, adsorption is still considered as a reversible process. Therefore, LAB species
can be used as biological adsorbents in the gastrointestinal tracts of animals to
reduce the bioavailability of the toxin during digestion of feed (Shetty & Jespersen,
2006).
Baker’s yeast, Saccharomyces cerevisiae is also known to bind mycotoxins.
Kusumaningtyas et al. (2006) inoculated chicken feed with A. flavus, S. cerevisiae
and Rhizopus oligosporus. They detected an inhibition on the production rate of
AFB1. This phenomenon was explained by both the yeasts’ competition with A.
flavus and binding of the toxin to the cell walls. Therefore, S. cerevisiae is
recommended as a feed additive to reduce the effects of aflatoxin contamination in
animal feed (Shetty & Jespersen, 2006).
In brief, use of microorganisms is a promising method of detoxification.
Process is natural with the least nutritional and sensory loss possible and maximum
efficiency. Of course, there can be risks associated with microorganisms but
benefits are outweighing. Microbial processes can often be proceeded under milder
conditions with no or minimum amount of other additives.
2.2.3.2. Enzymatic methods
Das and Mishra (2000) used horseradish peroxidase enzyme to detoxify
groundnut meal samples artificially contaminated with AFB1. Treating with 10 IU
enzyme, 100 g of groundnut meal was detoxified by 53%. After enzyme treatment,
samples were exposed to 1kW microwave radiation for 15 minutes and a final of
97% detoxification was achieved. It was observed that enzyme treatment had effects
on the protein structure of the meal, altering the nitrogen solubility. Also, a
reduction in death rate was reported for rats fed with decontaminated groundnut
Page 37
17
samples. Tripathi and Mishra (2009) used peroxidase extracted from garlic bulbs to
detoxify red chili powder and achieved 70% reduction in AFB1.
Motomura et al. (2003) screened 19 types of edible mushrooms against
AFB1 degradation activity. An extracellular enzyme from Pleurotus ostreatus was
reported to be decreasing the fluorescence of the toxin by opening up the lactone
ring, therefore reducing the carcinogenic action of this deadly molecule.
Alberts et al. (2009) examined the aflatoxin degrading ability of laccase
enzymes isolated from different white rot fungi species in liquid culture media.
Peniphora species showed the highest laccase activity and degraded 40.45% of
AFB1 in the medium. Purified fungal lactase enzymes between 0.05 to 1 IU/mL, on
the other hand, were able to degrade 87.34% of AFB1.
Liu et al. (1998) reported that multienzyme extracts from edible and
medicinal mushroom Armillariella tabescens are able to detoxify AFB1 in liquid
solution. Later, one enzyme in this multienzyme mixture was classified as
“aflatoxin oxidase” and purified using ammonium sulfate precipitation,
hydrophobic interaction chromatography and metal ion affinity chromatography
(Cao et al., 2011).
Use of microbial enzymes has many advantages of direct use of
microorganisms. In addition, isolated enzymes are highly specific to substrate,
therefore there are no risks of production of other metabolites or any undesired
chemical changes. However, complex enzyme systems are responsible for
degradation of AFB1 and isolation of one single enzyme is not always as efficient as
direct use of microorganisms. Also, enzyme isolation and purification is a cost and
labor intensive process.
2.3. Groundnut
Groundnut or peanut (Arachis hypogaea L.) is a member of the Fabaceae
family, together with legumes, peas and beans. Groundnut is widely used as a snack
Page 38
18
and oil source. Groundnut oil is produced by either cold pressing or solvent
extraction. After pressing or extraction, defatted part, groundnut meal is left. This
part is low in oil content but contains a high amount of proteins and dietary fibers
for animal feed use. However, it is not always possible to feed animals with
groundnut meal due to high levels of aflatoxin contamination (IMF, 1986).
Although 40% of global production of groundnuts are consumed directly as
nuts, they supply 10% of the World’s oilseed demand. China, India, the USA and
Brazil are the main players in World’s groundnut production. The USA is the net
exporter of this crop, however, most part of the groundnuts produced in China and
India are consumed in domestic markets (Diop et al., 2004).
Groundnuts, one of the major oilseeds, has a great production capacity all
over the world. Groundnut oil is mainly produced in Asia and Africa. Asia produces
73.5% and Africa produces 21.3% of the World’s groundnut oil supply. On average,
China produced 1 million and 869 thousand metric tons and India produces 1
million and 635 thousand tons of groundnut oil from 1993 to 2013 when worldwide
average production was 5 million and 149 thousand tons (FAO, 2014). Turkey,
where the oilseed market is dominated by sunflower seed, produces 6,000 tons of
peanut oil annually (USDA, 2015). Amount of peanut oil production is still limited
but with increasing demand to peanut oil and advances in peanut agriculture in
Çukurova region, it is expected to develop more in coming years.
For the last five years (2011-2015) an average of 6.79 million tons of
groundnut meal was produced worldwide with an increasing trend. USDA estimates
annual 6.98 million tons of production for 2015-2016 season. About two-third of
this amount is consumed domestically as an important protein rich meal in oil
producing countries. Global trade is limited on this commodity due to high levels of
aflatoxin contamination (USDA, 2015).
Groundnut meal is especially important for poultry production. Nitrogen-
corrected total metabolizable energy (TMEn) of solvent extracted groundnut meal is
2,664 kcal/kg average and the protein content ranged between 40.1% and 50.9%
Page 39
19
with a mean of 45.6%. Other nutritional values for groundnut meal is given in Table
2.1. (Batal et al., 2005)
Table 2.1 Nutrient composition of groundnut meal.
Nutrient Mass fraction on dry
basis (%)
Crude protein 45.6 ± 2.8
Crude fat 2.47 ± 2.47
Crude fiber 8.30 ± 2.05
Ash 5.02 ± 0.59
Since the first ever detected aflatoxicosis case happened to be related to
groundnut meal, research was focused on detoxification of groundnut meal.
Groundnut meal, by its nature, is highly susceptible to fungal attack and therefore
aflatoxin contamination. Not all types of fungi, or especially strains of A. flavus are
aflatoxigenic but most isolates from groundnut meal of this species are able to
produce aflatoxins under favorable conditions before, during and after the harvest,
processing or storage phases. On the other hand, invasion of groundnut seeds and
products by Aspergillus species does not only cause aflatoxin contamination but
also there are nutrient losses detected in terms of oil degradation, reduction of
protein content and alterations in carbohydrate structures (Mehan et al., 1991).
Page 40
20
2.4. Rhodococcus erythropolis
Belonging to the order of Actinomycetales and the family Nocardiaceae,
Rhodococci are Gram-positive, aerobic, non-sporulating and non-motile bacteria
(Conville & Witebsky, 2007). Rhodococcus is fairly a new organism for bacterial
microbiology, but its use in modern biotechnology is promising. Due to their
mobile, large and linear plasmid, members of this genus are capable of producing a
large variety of enzymes for degrading different organic compounds (Bell et al.,
1998; Gűrtler & Seviour, 2010).
R. erythropolis in particular, has many possible applications in
biotechnology. Set of enzymes produced by R. erythropolis are reported to be
capable of catalyzing many technologically important biochemical reactions
including oxidation, dehydrogenation, epoxidation, hydroxylation, hydrolysis,
dehalogenations and desulfurizations (de Carvalho & da Fonseca, 2005). Some
examples of biotechnological applications of R. erythropolis are; limonene
degradation (Werf et al., 1999), n-alkanes and alcohols degradation at extreme
conditions (Chih-Wen et al., 2012; de Carvalho, 2012), desulfurization of
dibenzothiopene (Izumi et al., 1994), microbial bioflocculant production (Bicca et
al., 1999; Pirog et al., 2004), degradation of dinitrophenol (Lenke et al., 1992),
cholesterol oxidase activity (Sojo et al., 1997) and last but not least, degradation of
aromatic mycotoxins, especially AFB1 (Alberts et al., 2006; Cserháti et al., 2013;
Eshelli et al., 2015; Teniola et al., 2005).
R. erythropolis is not considered a common human or animal pathogen.
However, it should be noted that there were 7 medical cases where people with
immune deficiency due to some other diseases were diagnosed with R. erythropolis
infection (Bagdure et al., 2012).
Page 41
21
2.4.1. Aflatoxin degradation ability of R. erythropolis.
Teniola et al. (2005) treated liquid cultures supplemented with 2.5 ppm (mg/L)
AFB1 with cell free extracts of 3 different microorganisms, N. corynebacterioides,
Mycobacterium fluoranthenivorans and R. erythropolis. R. erythropolis extracts
showed an efficient reduction in AFB1, only 3-6% residue remaining in the liquid
culture after 72 hours of incubation. Also, it was observed that R. erythropolis has a
wider temperature range for biological detoxification. Alberts et al. (2006)
confirmed abovementioned results by using cell free extracts of R. erythropolis
cultures starting from an initial AFB1 concentration of 1.75 ppm (mg/L). In their
study, 33.2% of AFB1 residue was left in the liquid culture after 72 hours of
treatment and loss of mutagenicity was detected by the Ames test of mutagenicity.
Kong et al. (2012) suggested optimum conditions for AFB1 degradation by
using viable cell cultures of R. erythropolis in synthetic media by Plackett-Burman
design, central composite design and response surface analysis methods. At
temperature 23.2°C, pH 7.17, 24.6 mL liquid volume in 100-mL flasks, 10%
inoculum volume, 180 rpm agitation speed and 81.9 hours of incubation time,
95.8% reduction in AFB1 was reported.
Eshelli et al. (2015) reported 95% reduction in AFB1 in liquid culture starting
with an initial load of 20 µg/mL in 24 hours. In this study, degradation efficiency of
three Actinomycetes, R. erythropolis, Streptomyces lividans and Streptomyces
aureofaciens were compared and no significant difference was reported between the
efficiency of these microorganisms. Degradation products were also analyzed by
HR-FTMS and MS2 fragmentation methods and a possible pathway of degradation
of AFB1 was suggested. As the peak area for AFB1 decreases, an increase in a
metabolite with 236 atomic mass unit (amu) was observed and it was thought that
this low molecular weight compound was then participated in the citrate cycle.
During biodegradation lactone carbonyl ring and cyclopentenone ring of AFB1 was
opened. Suggested degradation mechanism is shown in Figure 2.3. First, lactone
ring is hydrolyzed and open lactone ring is decarboxylated yielding 268 amu
Page 42
22
molecular weight aflatoxin derivative, also known as Aflatoxin D1. This molecule is
then converted to Aflatoxin D2 (MW: 206 amu) where the difuran property is
protected but lactone ring is still missing. At the last stage, unsaturated part of one
furan ring is cleaved yielding the final degradation metabolite with 236 amu
molecular mass.
Page 43
23
Figure 2.3 Suggested degradation pathway of AFB1 by R. erythropolis. (Eshelli et
al., 2015)
Page 44
24
2.5 Objectives of the study
Aflatoxins have detrimental effects on many aspects. The most efficient way
to reduce these effects is to apply post-harvest management procedures. However,
in practice it is not always possible to completely inhibit growth of fungi.
Therefore, detoxification methods are always necessary for food safety.
Groundnut meal is an important commodity for agricultural supply chains,
however aflatoxin problem risks the public health and economy. Reducing the
aflatoxin levels in groundnut meal makes it possible to use it in feed ration mixtures
instead of discarding.
Physical and chemical methods have been suggested to detoxify
contaminated food and feed products. Nonetheless, as mentioned in this literature
review, most of them are inefficient, expensive or causing undesired changes in the
final product. On the other hand, biological methods offer effective detoxification
rates by little or no changes in the physicochemical structure of the product. Within
these biological methods R. erythropolis is a promising detoxifying agent since it
can degrade AFB1 in a short time with a broader range of mild processing
conditions. Detoxification studies using R. erythropolis were only conducted in
liquid culture so far as stated in Chapter 2.4.1. In this study, detoxification in a real
feed material is addressed.
In this work, detoxification of groundnut meal, a byproduct of vegetable oil
production, was studied. For this purpose, first the growth characteristics of R.
erythropolis were investigated and optimized using response surface methodology
(RSM). Aflatoxin degrading ability of the microorganism was also addressed by
making a comparison of viable cell cultures and extracellular enzyme portions.
AFB1 detoxifying ability of the organism in groundnut slurry was then optimized
using RSM. Decrease in the toxicity of degradation byproducts were investigated by
GST assay.
Page 45
25
CHAPTER 3
MATERIALS AND METHODS
3.1 Materials
3.1.1 Raw materials
Defatted groundnut meal (GNM) was provided by a local groundnut oil
production factory from Osmaniye, Turkey. The meal was ground in a laboratory
scale grinding mill (Thomas-Wiley Laboratory Mill, Model 4, Arthur H. Thomas
Company, Philadelphia, PA, USA) equipped with a 1 mm diameter sieve and kept
in plastic bags at room temperature. Meal was naturally contaminated with 270.1 ±
4.9 μg/kg of AFB1.
Rhodococcus erythropolis NRRL B-16531 was kindly provided by the
Agricultural Research Service (ARS) culture collection of United States
Department of Agriculture in lyophilized form. The microorganism was activated in
nutrient broth and stored in 20% glycerol-water as culture stock at -82°C in freezer
(Revco Elite Plus, Thermo Fisher Scientific Inc., Waltham, MA, USA). For short
term storage, it was maintained on nutrient agar at +4°C.
Aflatest® inmunoaffinity columns (VICAM, Watertown, MA, USA) were used
for clean-up of aflatoxins during aflatoxin determination by HPLC.
Sheep liver for GST assay was purchased from Kazan slaughterhouse in
Ankara, Turkey.
Page 46
26
3.1.2 Chemicals
Chemicals used in this study are listed in Table A.1.
3.1.3. Buffers and solutions
Preparations of buffers and solutions are given in Appendix B.
3.1.4. Growth medium
Pre-mix nutrient broth and agar was dissolved in deionized water for activation
and preliminary growth of microorganism. Other media were prepared considering
the amounts of ingredients in the experimental design matrix. At optimal growth
conditions, 5 g/L glucose, 5g/L peptone and 5g/L yeast extract were dissolved in
deionized water and sterilized at 121°C for 15 minutes in autoclave (Tomy SX-
700E, Tomy Kogyo Co., Tokyo, Japan).
3.2. Methods
3.2.1 Sample preparation
Defatted GNM was first weighed and sterilized by autoclaving at 121°C for
15 minutes in 500 mL flasks in solid form.
Sterile liquid supplemented with yeast extract was added to the flask
according to the solid concentration (Table 3.5) after separate sterilization. This
fermentation medium was inoculated with 48 hours grown cultures of R.
erythropolis. For determination of extracellular enzyme activity, growth medium
was centrifuged at 2000 x g for 15 minutes for separation of extracellular part from
the suspension. Liquid portion was filtrated by filter cloth after the fermentation and
discarded. Remaining meal was then dried in a laboratory scale tray dyer (Eksis
Page 47
27
Endustriyel Kurutma Sistemleri, Isparta, Turkey) for 3 hours with 70°C air blowing
at 1m/s and trays rotating at 6 rpm. An overview of the detoxification process is
given in Figure 3.1.
Page 48
28
Figu
re 3
.1 O
verv
iew
of t
he d
etox
ifica
tion
proc
ess
Page 49
29
3.2.2 Bacterial counts and optical density
Growth of the bacteria was monitored by measuring optical density at
wavelength of 600 nm (Shimadzu UV-1700, Shimadzu Corp., Kyoto, Japan).
Samples were diluted with growth medium in order to read absorbance values
between 0.000 and 1.000. To relate optical density with the number of organisms,
plate counts were carried out by overnight incubation of plate count agars
inoculated by spread plate method. Standard curve for optical density versus log
number of cells is presented in Figure D.1.
3.2.3 Aflatoxin analysis
3.2.3.1 Aflatoxin extraction
AOAC Official Method 999.07 (2012) was adopted for extraction and
clean-up of aflatoxins. Previously weighed and processed groundnut cake was
extracted with methanol-water (8:2) plus 50 mL of hexane in 500 mL flasks shaking
at 150 rpm (0.314 x g) for an hour. 10 mL of the methanolic phase of the extract
was filtered through filter paper and diluted with 60 mL of PBS solution.
3.2.3.2 Immunoaffinity column chromatography
Preparatory clean-up was done according to AOAC Official Method 997.07
(2012). Immunoaffinity cleanup columns were first adjusted to room temperature
and conditioned by passing 10 mL of PBS solution prior to sample loading. Filtrate
was then passed through the column at a rate of 3mL/min by using a vacuum
manifold. Column was washed with deionized water. Aflatoxins which remained on
the column were eluted with 1.25 mL HPLC grade methanol and diluted with 1.75
mL water prior to HPLC injection.
Page 50
30
3.2.3.3 HPLC analysis
Aflatoxin analysis were done based on AOAC Official Method 997.07
(2012). High performance liquid chromatograph (Agilent 1100, Agilent
Technologies, CA, USA) equipped with Hichrom ODS-2 column 250 x 4.6 mm
(Hichrom Limited, Berkshire, UK) was used. Coring cell was used for
electrochemical post-column derivatization. Samples (100 μL) were injected into
the mobile phase consisting of water-acetonitrile-methanol (6:2:2) plus KBr and
HNO3 at a flow rate of 1mL/min at 40°C. Fluorescence of aflatoxin was detected by
fluorescence detector at 360 nm excitation and 440 nm cut-off emission
wavelengths.
Concentration of sample solutions were calculated using Equation (1).
C (ng/mL) = a x signal + b (1)
Concentration of AFB1 in samples was calculated according to Equation (2)
AFB1 Concentration =
(2)
Where a & b are coefficients for linear equation, Csmp is the toxin concentration in
the sample extract, signalsmp is the peak area from the chromatogram and Wt is the
test portion taken from the product.
3.2.4 Preparation of sheep liver cytosol
Sheep liver was homogenized in 10 mM potassium phosphate buffer
(pH=7.0) containing 0.15 M KCl, 1 mM EDTA and 1mM DTT. Resulting
homogenate was centrifuged at 4°C at 10,000 x RPM (21801 x g) for 30 minutes by
Sigma 3K30 refrigerated centrifuge (Sigma-Zentrifugen GMBH, Harz, Germany).
Supernatant was then taken and centrifuged again at 4°C at 21,000 x RPM (45782 x
g) for 90 minutes. Supernatant was frozen and stored at -84°C up to three
months(İscan et al., 1998). Protein content of the cytosols were measured by
Page 51
31
Lowry’s method of protein measurement with Folin-Ciocalteu’s phenol reagent as
30mg/mL (Lowry et al., 1951).
3.2.5 Sheep liver glutathione-S-transferase assay
Glutathione-S-transferase (GST) activity was determined
spectrophotometrically at 340 nm wavelength using 1-chloro-2,4-dinitrobenzene
(CDNB) as the substrate. Sheep liver cytosol was diluted 100-folds with 10 mM
potassium phosphate buffer (pH=6.5). Enzymatic reaction was carried out in 100
mM phosphate buffer (pH=6.5) containing 1mM reduced L-glutathione (GSH),
1mM CDNB and groundnut extract. Reaction mixture without extract was used as
the control. Reaction was started by adding enzyme source. Thioether formation
was observed by monitoring absorbance change for 5 minutes at 340 nm and at
30°C in a Shimadzu spectrophotometer. Molar extinction coefficient for CNDB
conjugate at 340 nm was taken as 0.0096 µM-1 cm-1 (Habig et al., 1974). Specific
GST activity was determined using Equation (3).
EA(IU/mL) = x x x dilution factor (3)
where OD340 is absorbance at 340 nm, ε340 is the molar extinction coefficient
for CNDB conjugate at 340 nm, V is reaction volume in mL and Venz is volume of
the enzyme in mL and time is in minutes.
3.2.6 Statistical methods
3.2.6.1 One factor at a time approach (OFAT)
Conventional OFAT approach was used to decide on which carbon and
nitrogen sources are best for the optimum growth of R. erythropolis. For carbon
sources, glucose, xylose, lactose and sucrose were tested, whereas for nitrogen
sources peptone, tryptose and ammonium sulfate were compared. At each trial,
Page 52
32
concentration of other ingredients were hold constant while adding each carbon or
nitrogen source separately. For statistical analysis, analysis of variance (ANOVA)
at 95% confidence level was performed using Minitab 16 (Minitab Inc., State
College, PA, USA).
3.2.6.2 Plackett-Burman design (PB)
Plackett-Burman design is a first order polynomial model to screen a large
number of independent variables instead of time consuming full factorial model
(Plackett & Burman, 1946). In this study, two level PB design was applied with 12
runs and two replications at 95% confidence level. Variables and range of values for
PB design are given in Table 3.1. Given ranges were decided based on preliminary
experiments and previous studies.
The experimental design matrix for temperature, pH, liquid volume,
inoculum volume, agitation speed, glucose concentration and peptone concentration
was constructed by Minitab 16 software. Results were analyzed by ANOVA table
and Pareto chart to screen the most significant variables.
Page 53
33
Table 3.1 Ranges of process variables used for PB design
Variable Low level (-1) High level (+1)
Temperature (°C) 20 40
pH 6 8
Liquid volume (mL) 50 150
Inoculum volume (% v/v) 1 5
Agitation (rpm) 80 160
Glucose concentration (g/L) 5 15
Peptone concentration (g/L) 5 15
Page 54
34
Tabl
e 3.
2 PB
des
ign
para
met
ers f
or sc
reen
ing
of m
ajor
fact
ors f
or R
. ery
thro
polis
gro
wth
. (Co
ded
fact
ors)
Run
Ord
er
Tem
pera
ture
(°C
) pH
Li
quid
volu
me
(mL)
Inoc
ulum
volu
me
(%
v/v)
Agi
tatio
n
(rpm
)
Glu
cose
conc
entr
atio
n (g
/L)
Pept
one
conc
entr
atio
n (g
/L)
1 +1
-1
-1
-1
+1
+1
+1
2 +1
+1
-1
+1
-1
-1
-1
3 -1
+1
-1
-1
-1
+1
+1
4 -1
+1
+1
+1
-1
+1
+1
5 -1
-1
+1
+1
+1
-1
+1
6 -1
+1
+1
-1
+1
-1
-1
7 +1
-1
+1
+1
-1
+1
-1
8 +1
-1
+1
-1
-1
-1
+1
9 +1
+1
-1
+1
+1
-1
+1
10
-1
-1
-1
-1
-1
-1
-1
11
+1
+1
+1
-1
+1
+1
-1
12
-1
-1
-1
+1
+1
+1
-1
Page 55
35
3.2.6.3 Response surface optimization
Response surface optimization with Box-Behnken design was used to find optimum
process conditions for both bacterial growth and aflatoxin detoxification. Box-
Behnken design makes use of three level rotatable response surface design to make
a quadratic model which can analyze individual and combined effects of variables
(Box & Behnken, 1960). Experimental design matrices with two replications were
constructed and ANOVA was performed. Results were analyzed by response
optimizer tool of Minitab 16 software. Experimental data were fit to the quadratic
equation (4).
Y = b + b X + b X + b X + b X X + b X X + b X X + b X +
b X + b X (4)
where b’s are regression coefficients and X1, X2 and X3 are independent
variables as given in Table 3.3 and 3.5.
3.2.6.3.1 Box Behnken (BB) design for optimization of culture
conditions
Design variables for growth medium optimization (temperature, liquid
volume, agitation speed) were decided by the results of PB design. For these three
variables a set of 15 runs was carried out in low, center and high level conditions
with two replications. Levels of the variables are given in Table 3.3 and the
experimental design matrix with coded factors are given in Table 3.4.
Page 56
36
Table 3.3 Ranges of variables for BB optimization
Variable Low level (-1) Center (0) High level (+1)
X1 Temperature (°C) 20 30 40
X2 Liquid volume 100 150 200
X3 Agitation speed (rpm) 80 120 160
Page 57
37
Table 3.4 Experimental design matrix of BB design for growth optimization (coded
factors)
Run Order Temperature
(°C)
Liquid volume
(mL)
Agitation speed
(rpm)
1 0 -1 +1
2 0 +1 -1
3 -1 0 -1
4 +1 +1 0
5 0 0 0
6 0 +1 +1
7 -1 -1 0
8 +1 -1 0
9 +1 0 +1
10 -1 0 +1
11 +1 0 -1
12 -1 +1 0
13 0 -1 -1
14 0 0 0
15 0 0 0
Page 58
38
3.2.6.3.2 Box-Behnken (BB) design for optimization of AFB1
detoxification
Design variables for AFB1 degradation optimization were chosen as solid
concentration, inoculum volume and fermentation time. For these three variables a
set of 15 runs was carried out in low, center and high level conditions with two
replications. Levels of the variables are given in Table 3.5 and the experimental
design matrix with coded factors are given in Table 3.6. Given ranges were decided
based on preliminary experiments and previous studies.
Table 3.5 Ranges of variables for BB design for optimization of AFB1 degradation.
Variable Low level (-1) Center (0) High level (+1)
X1 Solid concentration (g/100 mL) 10 20 30
X2 Inoculum volume (% v/v) 1 3 5
X3 Time (h) 24 48 72
Page 59
39
Table 3.6 Experimental design matrix of BB design for AFB1 degradation
optimization (coded factors)
RunOrder Innoculum size (%
v/v)
Solid conc.
(%(w/v)) Time (h)
1 0 0 0
2 0 +1 -1
3 -1 -1 0
4 0 -1 +1
5 -1 0 -1
6 0 -1 -1
7 +1 +1 0
8 +1 -1 0
9 0 +1 +1
10 -1 +1 0
11 +1 0 -1
12 -1 0 +1
13 +1 0 +1
14 0 0 0
15 0 0 0
Page 60
40
3.2.6.4 Model verification
The predicted models were verified by additional experiments at optimum
points. Performance of quadratic models were evaluated by calculating coefficient
of determination (R2), root mean square error (RMSE) (Eqn. 5) and mean absolute
error (MAE) values (Eqn. 6).
RMSE = ∑ (X , − X , ).
(5)
MAE = 1N X , − X , (6)
Page 61
41
CHAPTER 4
RESULTS AND DISCUSSION
4.1 Growth curve of R. erythropolis NRRL B-16531
Growth curve of R. erythropolis NRRL B-16531 was constructed under
optimum growth conditions (Table 4.2) and presented in Figure 4.1. Cells were
observed to reach stationary phase after the 44th hour of incubation with a specific
growth rate of 0.33 h-1.
Although it is not clearly known on which growth phase aflatoxin degrading
enzymes are produced, there are several advantages of using cells at stationary
phase. Most of the enzymes promoting the survival of the microorganism are
produced during the stationary phase (Fanget & Foley, 2011). Most number of cells
per mL of inoculum is achieved at this phase which means a higher concentration of
biocatalyst available in the reaction medium. Also, cell lysis and modifications in
the cell wall during stationary phase makes intracellular enzymes free in the
medium, increasing the effectiveness of the process (Reed, 1966).
Page 62
42
Time (hours)
0 10 20 30 40 50
Opt
ical
den
sity
at 6
00 n
m
0
1
2
3
4
5
6
Log
num
ber o
f cel
ls / m
L
5
6
7
8
9
10
Figure 4.1 Growth curve of R. erythropolis
4.2 Optimization of growth conditions
4.2.1 One factor at a time
To evaluate the effect of carbon source on R. erythropolis growth, glucose,
xylose, lactose and sucrose were compared as shown in Figure 4.2. There were
significant differences among carbon sources and glucose was found the best
carbon sources giving the highest number of cells (10.135±0.047 log number of
cells/mL).
Page 63
43
Carbon source
Glucose Sucrose Xylose Lactose
OD
600
0
1
2
3
4
5
6
7
Log
num
ber o
f cel
ls /
mL
6
7
8
9
10
a
b
bc c
Figure 4.2 Effects of different carbon sources on R. erythropolis growth.
R. erythropolis can grow on a large variety of carbon sources including
saccharides, alcohols, organic acids and cyclic hydrocarbons (Kurane et al., 1994b).
However, Moumita et al. (2009) reported that different types of carbon metabolism
was observed for different strains of R. erythropolis. Growth of some strains are
favored by glucose or fructose, however some other reach higher number of cells on
sucrose, glycerol or other carbon sources. Results of this study implies that R.
erythropolis NRRL B-16531 favors glucose rather than xylose, lactose or sucrose
but other strains of this microorganism would not necessarily exhibit the same
behavior.
To evaluate the effect of nitrogen source on growth, peptone, tryptose and
ammonium sulfate were used as shown in Figure 4.3. There was no significant
Page 64
44
difference between peptone (9.475±0.019 log number of cells/mL) and tryptose, but
number of cells was significantly lower when ammonium sulfate was used as sole
nitrogen source.
Nitrogen source
Peptone Tryptose Ammonium Sulfate
OD
600
0
1
2
3
4
5
6
Log
num
ber o
f cel
ls /
mL
6
7
8
9
10a
a
b
Figure 4.3 Effects of different nitrogen sources on R. erythropolis growth
Nitrogen metabolism of R. erythropolis is more selective than its carbon
metabolism. Kurane et al. (1986) remarked that as an inorganic nitrogen source,
ammonium sulfate was favorable for cell growth, however addition of organic
nitrogen sources also increased cell growth as reported for R. erythropolis S-1
Page 65
45
strain. Moumita et al. (2009) also confirmed that using inorganic nitrogen sources
for six different strains of R. erythropolis resulted in very low cell mass.
Therefore, peptone was chosen as the nitrogen source and glucose was chosen
as carbon source for growing R. erythropolis in future trials.
4.2.2 Plackett-Burman (PB) design
The PB design is a quick way to screen and select important process
variables prior to response surface optimization. There are many examples of
screening cell growth and other bioprocess variables using PB design method.
Waśko et al. (2010) used this method for optimization of medium components for
Lactobacillus rhamnosus biomass production. Kong et al. (2012) utilized PB design
for optimization of AFB1 degradation of R. erythropolis in liquid culture. Zhang et
al. (2014) optimized the aflatoxin production of A. flavus on peanuts using PB
design.
The PB design matrix was constructed to determine which factors (liquid
volume, agitation speed, temperature, pH, glucose concentration, peptone
concentration and inoculum volume) are significant for growth of R. erythropolis.
Liquid volume, agitation speed and temperature were found significant (P<0.05).
Also, pareto chart in Figure 4.4 shows the standardized effect of seven process
variables where the effect of liquid volume, agitation speed and temperature were
higher. These three factors were further evaluated for optimization of cultivation
conditions using Box-Behnken response surface method.
Page 66
46
Inoculum size
Peptone
Glucose
pH
Temperature
Agitation speed
Liq. volume
43210
Term
Standardized Effect
2.120
Pareto Chart of the Standardized Effects(response is Absorbance, Alpha = 0.05)
Figure 4.4 Pareto chart for screening important factors for R. erythropolis growth.
4.2.3 Box-Behnken (BB) response surface optimization of R. erythropolis
growth
Box-Behnken design was selected for response surface optimization of the
growth conditions because it offers less number of experimental runs than central
composite design (CCD) and full factorial designs with 3 factors by utilizing center
points and midpoints. Thus, Box-Behnken design is more efficient than CCD and
factorial designs (Ferreira et al., 2007).
An overview of experimental results for BB design is given in Table 4.1. At
minimum conditions 7.56±0.09 log number of cells per mL were detected in the
growth medium. Highest log number of cells per mL (10.66±0.04) measured at run
order 4. Comparing the maximum and minimum growth, at optimized conditions,
Page 67
47
log number of cells was 1.41 times higher than non-optimized conditions which
means that the actual number of cells in the medium was 2290 times higher. In their
optimization study, Zhai et al. (2013) could reach 108 CFU/mL biomass density
under optimal conditions where initial biomass density was reported as 106
CFU/mL.
Page 68
48
Table 4.1 Results of Box-Behnken design for culture growth
Run
Order
Temperature
(°C)
Liquid
volume (mL)
Agitation
speed (rpm)
Log number of
cells /mL
1 0 -1 +1 9.24±0.10
2 0 +1 -1 9.57±0.11
3 -1 0 -1 9.37±0.12
4 +1 +1 0 10.66±0.04
5 0 0 0 8.20±0.16
6 0 +1 +1 9.85±0.07
7 -1 -1 0 8.39±0.59
8 +1 -1 0 10.33±0.16
9 +1 0 +1 10.32±0.07
10 -1 0 +1 8.09±1.19
11 +1 0 -1 8.30±1.35
12 -1 +1 0 9.52±0.15
13 0 -1 -1 8.47±0.01
14 0 0 0 7.56±0.09
15 0 0 0 8.14±0.09
Page 69
49
Equation (7) describes growth of R. erythropolis in liquid culture as a function
of coded factors X1 (temperature), X2 (liquid volume) and X3 (agitation speed) and
their interactions. By looking at coefficients in Eqn. (7), liquid volume is more
effective on cell growth than other two independent variables followed by agitation
speed and temperature. Among interactions, liquid volume & agitation speed and
the square of temperature are important factors in this equation.
Y = 9.3909− 0.4256X − 0.9888X + 0.5642X + 0.2218X X −
0.1854X X + 0.4081X X − 0.4751X + 0.2621X − 0.3953X (7)
The RMSE and MAE values were calculated as 0.20 and 0.25 respectively
and the insignificant lack-of-fit (P>0.05) was detected indicating that this model
makes effective prediction of the real situation. The R2 value was found as 0.9696
meaning that 96.96% of the response variable variation can be explained by the
model in equation (7). For validation, a comparison of experimental and predicted
values is given in Figure 4.5 with R2 value of 0.98.
This model was then evaluated with the response optimizer tool of Minitab
16. Optimum conditions were computed as temperature of 22.5°C, liquid volume of
100 mL in 500 mL flasks and agitation speed of 135 rpm. At these conditions, it
was predicted that a maximum of 10.92 log number of cells/mL growth can be
achieved. Overall optimum conditions combining the results of PB and BB designs
are given in Table 4.2.
Page 70
50
Table 4.2 Optimum conditions for maximum growth of R. erythropolis
Variables (units) Values Temperature (°C) 22.5
pH 7 Liquid volume (mL) 100
Inoculum volume (%) 1 Agitation speed (rpm) 135
Glucose concentration (g/L) 5 Peptone concentration (g/L) 5
Experimental values for log number of cells
8.0 8.5 9.0 9.5 10.0 10.5 11.0
Pred
icte
d va
lues
for l
og n
umbe
r of c
ells
8.0
8.5
9.0
9.5
10.0
10.5
11.0
y = 0.97x + 0.28R2 = 0.97
Figure 4.5 Experimental versus predicted values of log number of cells
Page 71
51
Figure 4.6 represents the surface plot for the effect of temperature and
agitation speed when liquid volume is held constant at 150 mL. Increase in cell
growth was observed with increase in agitation speed to around 135 rpm but further
increase reduced the growth. A peak in cell growth was observed at 22.5°C. A
slight decrease was observed at lower temperatures but decrease was more drastic at
higher temperatures. Optimum temperature for R erythropolis CS98 was reported as
25°C confirming the results of this study and 20% lower growth rates was observed
at 20 and 30°C, and it was significantly reduced by further increasing the
temperature to 35°C(Tomioka et al., 1994). Kong et al. (2012) reported that
optimum AFB1 degradation was observed at 23.2°C for R. erythropolis. On the
other hand, Zhai et al. (2013) expressed the optimum growth temperature of R.
erythropolis 4.1491 as 15.3°C which implies that the optimum temperature of this
microorganism is strain dependent.
Page 72
52
1608.0
120
8.5
9.0
20
9.5
30 8040
Log number of cells
Agitation speed
Temperature
Figure 4.6 Surface plot showing the effect of temperature and agitation speed at
constant liquid volume
In Figure 4.7 effect of temperature and liquid volume was plotted while
holding agitation speed at the center of point 120 rpm. Cell growth was increased
by decreasing the liquid volume due to effective oxygen transfer to the medium but
amount of dissolved oxygen is also dependent on temperature where the solubility
of oxygen is higher at lower temperatures. Therefore, at lower temperatures higher
biomass density could be observed even at higher liquid volumes.
Page 73
53
200
8 150
9
10
20
11
30 10040
Log number of cells
Liquid volume
Temperature
Figure 4.7 Surface plot showing the effect of temperature and liquid volume at
constant agitation speed
Figure 4.8 shows the effects of liquid volume and agitation speed where
temperature was held constant at 30°C. A maxima was observed where the liquid
volume is minimum while agitation speed was around 135 rpm. The reasons for
higher growth at lower liquid volumes are mainly effective oxygen dissolution in
the medium and effective mixing of cells and nutrients.
Effect of agitation speed is clearly seen from both figures 4.6 and 4.8. As the
agitation increases, amount of dissolved oxygen increases making it available for
aerobic aspiration of cells and flocculation was prevented. R. erythropolis is known
to be a flocculating agent for bioremediation processes (Kurane et al., 1994a).
However, flocculating activity of this organism negatively affects the growth rate
Page 74
54
by forming cell floccules and biofilms, reducing efficiency of aeration and agitation
(Kamble & Meena, 2010).
Furthermore, as the agitation speed was further increased, limitation in
growth was observed. This limitation could be explained by both oxygen toxicity
and damage on cell wall structures at high shear rates. Oxidative stress caused by
excess oxygen and other oxides limits the growth of aerobic bacterial species, as it
causes oxidative damage on all living organisms (Cabiscol et al., 2000). Oxidative
and high-shear damage on R. erythropolis was also observed by Kamble and Meena
(2010) while increasing agitation speed from 200 rpm to 300 rpm.
160
7 120
8
9
10
100150 80
200
Log number of cells
Agitation speed
Liquid volume
Figure 4.8 Surface plot showing the effect of liquid volume and agitation speed at
constant temperature
Page 75
55
Figure 4.9 is also given to better interpret the dual interactions between
independent variables while the other variable was kept constant at center level.
Elliptic formation in contour plots represents a perfect interaction between variables
(Muralidhar et al., 2001). Elliptical shape was observed in contour plot of agitation
speed vs. temperature, indicating a stronger interaction between these two variables.
However contour plot of agitation speed vs liquid volume indicates that there are
fewer interactions between these two variables.
10.5
10.0
9.5
9.0
8.5
Liquid volume*Temperature
4035302520
200
175
150
125
100
9.5
9.0
8.5
Agitation speed*Temperature
4035302520
160
140
120
100
80
10.0
9.5
9.0
8.58.0
Agitation speed*Liquid volume
200175150125100
160
140
120
100
80
Temperature 30Liquid volume 150Agitation speed 120
Hold Values
Figure 4.9 Contour plots for growth optimization
Page 76
56
4.3 Evaluation of AFB1 degradation by viable cells and extracellular
enzymes
A comparison of AFB1 degradation capacity between viable cell cultures
and crude extracellular part of the culture was made to clarify the mechanism of
degradation. In control group with no inoculation of cells or extracellular enzymes,
6.67±1.57% reduction was achieved after 72 hours (Figure 4.10). Extracellular
enzymes reduced AFB1 by 55.18±0.52% and viable cells reduced 68.52±1.05%
after 72 hours (Figure 4.10). In liquid culture with an initial AFB1 concentration of
2.5 ppm (mg/kg) Teniola et al. (2005) achieved more than 90% degradation in 4
hours and complete degradation after 24 hours. In this study, more than 55%
degradation of AFB1 was observed within 24 hours indicating that the
biodegradation is fastest at first 24 hours of the process. However, there are two
main reasons for slower action in this case. First, initial AFB1 concentration was as
low as 270 µg/kg for the product and further diluted with the addition of liquid
medium to GNM. Therefore, enzymatic reaction was being carried on a slower
phase. Second, complex biochemical matrix of GNM, particularly the oil content
caused a barrier between the liquid medium and AFB1 reducing the availability of
the toxin for biodegradation. It should also be noted that initial evaluation was
carried out under non-optimized conditions.
There was significant difference between control, viable cells and
extracellular enzymes, therefore viable cell cultures were selected for detoxification
of AFB1. In liquid cultures, Teniola et al. (2005) reported AFB1 degradation by both
extracellular and intracellular enzymes of R. erythropolis cell-free extracts.
However, the effect of cell growth on AFB1 reduction was not studied. Kong et al.
(2012) could achieve 95.8% degradation of AFB1 in liquid cultures using viable
cells of R. erythropolis after 81.9 hours.
Alberts et al. (2006) reported that biodegradation of AFB1 occurs even when
the organism was grown in the absence of AFB1, concluding that this ability is a
Page 77
57
constitutive property of R. erythropolis. In this study, also cells grown in the
absence of AFB1 was able to degrade the toxin.
Combining the existing knowledge and results of this study, the mechanism
of action of R. erythropolis on AFB1 can be evaluated. Degradation of AFB1 is a
constitutive ability for R. erythropolis which means that enzymes responsible for
degradation are produced with or without the toxin present in the medium.
Degradation is enzymatic, rather than physical or chemical means. Set of enzymes
responsible for degradation are both extracellular and intracellular, however
combination of these two while cells are growing can increase the efficiency of
degradation.
Time (hours)
Time 24 48 72
AFB 1
redu
ctio
n (%
)
0
20
40
60
80
Viable cellsExtracellular enzymesControl
Figure 4.10 Evaluation of AFB1 degradation capacity of viable cells and
extracellular enzymes
Page 78
58
4.4 Optimization of AFB1 degradation
4.4.1 Box-Behnken (BB) response surface optimization of AFB1
detoxification
In this section, optimal conditions for AFB1 degradation of R. erythropolis
in GNM slurry was presented. Results and conditions of BB experimental design
are given in Table 4.3. A maxima was observed at run order 9, with 91.1±0.8%
detoxification. Minimum detoxification was observed as 71.7±2.5% which
corresponds to 27.05 % increase from the minimum detoxification rate.
Using the results in Table 4.3 a quadratic model was constructed using
response surface method of Minitab 16 software. The quadratic model representing
the response of percent AFB1 reduction against solid concentration (X1), inoculum
volume (X2) and process time (X3) is given in equation (8). The R2, RMSE and
MAE values were found as 0.9825, 1.84 and 1.47 respectively. Lack-of-fit was
insignificant (P>0.05) indicating that this model represents the system well.
Y = 46.3382 + 0.3515X − 0.2340X + 0.0057X X − 0.0185X X −
0.0007X − 0.2434X + 0.0034X (8)
Page 79
59
Table 4.3 Results of Box-Behnken design for AFB1 degradation
Run
Order
Innoculum
size
(% v/v)
Solid conc.
(%(w/v))
Time
(h)
Remaining
AFB1 (μg/kg)
Detoxification
(%)
1 0 0 0 38.2±1.8 85.8±0.7
2 0 +1 -1 26.1±1.9 90.3±0.7
3 -1 -1 0 76.5±6.7 71.7±2.5
4 0 -1 +1 67.3±3.1 75.1±1.2
5 -1 0 -1 36.6±2.6 86.4±1.0
6 0 -1 -1 75.2±4.7 72.1±1.7
7 +1 +1 0 29.4±4.2 89.1±1.5
8 +1 -1 0 82.9±3.1 69.3±1.1
9 0 +1 +1 24.0±2.2 91.1±0.8
10 -1 +1 0 35.4±1.7 86.9±0.4
11 +1 0 -1 30.6±0.8 88.7±0.3
12 -1 0 +1 31.6±1.4 88.3±0.5
13 +1 0 +1 28.2±2.0 89.6±0.7
14 0 0 0 33.3±0.6 87.7±0.2
15 0 0 0 31.8±3.4 88.2±1.2
Page 80
60
The mathematical model in equation (8) was also evaluated for optimum
points using response optimizer tool of Minitab 16 and the optimum conditions
were found as 27.4 %(w/v) of solid concentration, 4.88 % (v/v) of inoculum volume
and 24 hours of time as shown in Table 4.4. At optimal conditions, the predicted
maximum AFB1 reduction was 92.21%. However, the verification experiments
yielded 87.25±0.79% of detoxification. Although actual detoxification was lower
than the predicted maximum, it was still in agreement with the predicted value in
95% confidence interval.
Table 4.4 Optimal conditions for maximum detoxification
Variables (units) Values Solid concentration %(w/v) 27.4 Inoculum volume % (v/v) 4.88
Time (h) 24
For further validation of the model, a comparison of experimental and
predicted values is given in Figure 4.11. This plot represents the variation in
experimental and predicted detoxification where the R2 is 0.95 meaning that 95% of
variations between values can be explained by the quadratic model. High R2 value
also means that predicted and experimental values are in accordance with each
other.
Page 81
61
Experimental AFB1 reduction (%)
65 70 75 80 85 90 95
Pred
icte
d A
FB1 r
educ
tion
(%)
65
70
75
80
85
90
95
y = x - 0.65R2 = 0.95
Figure 4.11 Experimental versus predicted values of AFB1 reduction
The optimal conditions for detoxification suggests that R. erythropolis is an
efficient agent for reducing AFB1 concentration in contaminated products. Also, R.
erythropolis has some advantages over other microorganisms suggested in current
literature. For instance, R. corynebacterioides is also an efficient AFB1 degrader but
pigmentation and slow reaction limits the use of this organism (Teniola et al.,
2005). P. aeruginosa is another good option with maximum 90.2% reduction,
however optimum temperature is 55°C (Samuel et al., 2014). On the other hand, R.
erythropolis is able to grow and detoxify at milder temperature and other process
conditions while maintaining a high detoxification rate even when initial AFB1
concentration is very low.
Figure 4.12 indicates the effect of solid concentration and inoculum over
AFB1 reduction while keeping time constant at 48 h. A dramatic increase was
Page 82
62
observed when solid concentration was increased up to 270 g/L and a slight
decrease was observed after this point where concentration of AFB1 in liquid culture
was calculated as 0.0729 µg/mL. This rapid increase can be explained by higher
initial concentration of substrate AFB1 and also the amount of nutrients from GNM.
Very low AFB1 concentration was used throughout this study compared to liquid
culture experiments, Teniola et al. (2005) used 2.50 ppm (mg/L) and Alberts et al.
(2006) used 1.75 ppm (mg/L) AFB1 concentrations.
In inoculum volume, slight increase was observed until 4.8% and no more
increase was observed thereafter. Higher amount of inoculum means higher amount
of biomass and also extracellular enzymes. Since microorganism was taken from
the growth culture at early stationary phase, growth rate was still enough for a faster
growth and enzyme production. Therefore, further increasing the inoculum volume
had little effect on AFB1 degradation. In fact, the effect of inoculum volume was
insignificant on AFB1 degradation which was confirmed by the study of Kong et al.
(2012). However, effect of inoculum volume was significant by interactions with
other two independent variables.
Page 83
63
5.5
4.070
80
2.510
90
20 1.030
AFB1 Reduction (%)
Innoculum size
Solid conc.
Figure 4.12 Surface plot showing the effect of solid concentration and inoculum
volume at constant time
In Figure 4.13 concave up shape was observed for time changes and concave
down for inoculum volume forming a saddle shape when solid concentration was
kept constant at 20 g/L. Negative interaction between inoculum and time explains
this phenomena. There are not exact maxima or minima for this surface. A
minimum was observed around 30 hours and a maximum was observed around 4 %
v/v. The effect of process time is clearly seen from figure 4.13 where the percent
reduction was higher at the edges. However, this doesn’t necessarily mean that the
amount of toxin was increased after 24th hour and decreased after passing 48th hour.
The time course of AFB1 degradation was presented in chapter 4.3. However, in
response surface analysis, interactions play an important role so that extreme points
were observed at two edges of the time scale. A similar case was observed while
Page 84
64
optimization in liquid culture by Kong et al. (2012) where the optimal incubation
time was 81.9 h, however in this case degradation was lowered at longer and shorter
incubation times.
6086
88
401.0
90
2.54.0 20
5.5
AFB1 Reduction (%)
Time
Innoculum size
Figure 4.13 Surface plot showing the effect of inoculum volume and time at
constant solid concentration
In Figure 4.14 surface plot of solid concentration and time is presented at
constant inoculum volume at 3 % v/v. Valley shape was observed with a minimum
at around 48 hours. AFB1 reduction was increased until the maximum point until
270 g/L but slightly reduced by further increasing the solid concentration.
Page 85
65
6075
80
40
85
10
90
20 2030
AFB1 Reduction (%)
Time
Solid conc.
Figure 4.14 Surface plot showing the effect of solid concentration and time at
constant inoculum volume
Figure 4.15 shows the contour plots for AFB1 degradation of R.
erythropolis. Inoculum volume vs. solid concentration exhibits the characteristics of
elliptical contour at 90% which is the indication of a perfect interaction between
them. Contour plot of time vs. solid liquid ratio resembles a cross shape, a 2D
representation of the saddle formation where no single maximum or minimum
points was observed. This shape indicates that the interaction between time and
solid concentration are insignificant. This interpretation is also confirmed by
insignificance of this interaction in analysis of variance (P>0.05). Only a single
contour was observed in contour plot of time versus inoculum volume. This
interaction is significant for our observations, however, effect is very low, explained
by -0.0185 regression coefficient back in equation (8).
Page 86
66
90
85
80
75
Innoculum size*Solid conc.
3025201510
5
4
3
2
1
90
90
85
80
75
Time*Solid conc.
3025201510
70
60
50
40
30
Time*Innoculum size
54321
70
60
50
40
30
Solid conc. 20Innoculum size 3Time 48
Hold Values
Figure 4.15 Contour plots for AFB1 degradation
4.5 Sheep liver glutathione-S-transferase (GST) assay
To detect reduction in toxicity of detoxified samples, GST activity towards the
substrate CDNB was observed. Figure 4.16 represents the percent enzyme
inhibition using the methanol-water extracts of samples treated with R. erythropolis
culture and untreated ones. Results of the GST assay showed that aflatoxin has an
inhibitory effect on cytosolic GST enzymes. Undiluted extracts of untreated GNM
almost completely inhibited the enzymatic reaction, therefore several dilutions were
made to observe correct enzyme activity. Control group was used to determine the
enzyme activity without toxin source. Treated GNM extracts were determined by
HPLC to contain 5.97 μg/L AFB1 and untreated extracts 45 μg/L AFB1. Treated
samples inhibited the enzyme activity 64.47 ± 0.32 % and untreated samples
Page 87
67
inhibited 86.64 ± 0.52 % as shown in Figure 4.15. Significant difference was found
between control, untreated and treated groups at 95% confidence level. This results
suggests that the activation of binding of GSH to AFB1 disturbed the conjugation of
GSH with CDNB. By microbial detoxification of GNMs, significant loss of GST
activity was detected.
Sample
Control Treated Untreated
Inhi
bitio
n (%
)
0
20
40
60
80
100
Figure 4.16 AFB1 Inhibition of GST activity towards CDNB.
Page 88
68
4.6 Industrial applicability of detoxification by R. erythropolis
In laboratory scale, maximum 87% detoxification could be achieved and
92% was predicted. However it should be noted that this system was only tried in
flask conditions. Under more precisely controlled systems such as laboratory or
industrial scale fermenters, results would be much closer to the predicted model.
Aflatoxin contamination, in nature, has many variations caused by crops,
fields and geographic conditions. In Africa, where the risks are particularly higher,
aflatoxin contamination at rates above 1000 µg/kg was detected in groundnut and
groundnut products. However, feed industry usually tries to deal contaminated
products below 200 µg/kg (Mehan et al., 1991). Therefore 90% detoxification is
enough to solve the problem of industry, where a raw material of 200 µg/kg AFB1
content could be detoxified below the legal limit of 20 µg/kg.
One major drawback of this system would be the need of fresh water for
preparing slurry and energy for drying the product after the treatment. Water
treatment system should be established in order to cope with the high water
requirements of this process. In regions like Africa, where accessibility to
freshwater is limited, assessing the opportunity for solid-state fermentation systems
could be an efficient solution.
Page 89
69
CHAPTER 5
CONCLUSIONS AND RECOMMENDATIONS
In this study, aflatoxin degradation potential of gram positive bacterium R.
erythropolis was investigated. First, optimum growth conditions were determined
and then detoxification of GNM using R. erythropolis was optimized.
For optimum growth conditions, two different statistical methods, Plackett-
Burman design and Box-Behnken design were sequentially used. As a result, the
highest growth (10.92 log number of cells / mL) was observed at temperature of
22.5°C, pH 7, liquid volume of 100 mL in 500 mL flasks, inoculum volume of 1%,
agitation speed of 135 rpm, glucose concentration 5 g/L and peptone concentration
5 g/L. By finding optimum growth conditions, efficient use of R. erythropolis was
suggested for all relevant fields of biotechnology.
To determine the aflatoxin biodegradation behavior of R. erythropolis,
efficacy of viable cell cultures and extracellular enzymes were compared under
non-optimized conditions. It was found that viable cell cultures reduced the amount
of AFB1 in the samples significantly compared to extracellular enzymes. Three
variables (solid concentration, inoculum volume and time) were selected for
optimization of detoxification of GNM. A theoretical optimum of 92.21% reduction
was achieved at as 27.4 %(w/v) solid concentration, 4.88 % v/v inoculum volume
and 24 hours time. Efficiency of this process was also determined by sheep liver
GST inhibition. It was observed that inhibition of the enzyme was significantly
lower with treated sample extracts.
Results of this study shows that R. erythropolis is an effective detoxification
agent for aflatoxin management purposes. Theoretical 92% and practical 87% rates
Page 90
70
are effective enough to detoxify mid-level contaminated products. Suggested
process would decrease the amount of AFB1 from about 200 μg/kg to below 20
μg/kg regulatory limit. This makes possible that discarded GNM can be directly
used as feed or added to mixed formulations.
Although the results of this study are very significant, there are still gaps to
be filled. Suggested process is still laboratory scale, therefore; scale up studies
should be addressed for large scale industrial processing. Solid state fermentation
opportunities should also be evaluated. Other food or feed materials can be
detoxified by R. erythropolis. Even though decrease of toxicity was detected by
GST assay, still safety of the treated feed material should be evaluated by in vivo
tests. Effects of this process on human health should also be addressed by in vitro
tests and clinical trials.
Page 91
71
REFERENCES
2006. Commission Regulation (EC) No 1881/2006 of 19 December 2006 setting
maximum levels for certain contaminants in foodstuffs, (Ed.) E. Comission,
Vol. 1881/2006, OJ L 364.
2010. The Global Economic Cost of Cancer. American Cancer Society.
2012. Official Methods of Analysis of AOAC International. 19 ed, AOAC
INTERNATIONAL. Gaithersburg, MD, USA.
2011. Türk Gıda Kodeksi Bulaşanlar Yönetmeliği, (Ed.) G.T.v.H. Bakanlığı, Resmi
Gazete. Ankara.
2014. Yemlerde İstenmeyen Maddeler Hakkında Tebliğ. in: 2014/11, (Ed.)
G.T.v.H. Bakanlığı, Resmi Gazete. Ankara.
Akbas, M.Y., Ozdemir, M. 2006. Effect of different ozone treatments on aflatoxin
degradation and physicochemical properties of pistachios. Journal of the
Science of Food and Agriculture, 86, 2099-2104.
Alberts, J., Engelbrecht, Y., Steyn, P., Holzapfel, W., van Zyl, W. 2006. Biological
degradation of aflatoxin B1 by Rhodococcus erythropolis cultures.
International Journal of Food Microbiology, 109(1-2), 121-126.
Page 92
72
Alberts, J.F., Gelderblom, W.C.A., Botha, A., van Zyl, W.H. 2009. Degradation of
aflatoxin B1 by fungal laccase enzymes. International Journal of Food
Microbiology, 135(1), 47-52.
Aziz, N.H., Moussa, L.A.A., Far, F.M.E. 2004. Reduction of fungi and mycotoxins
formation in seeds by gamma-radiation. Journal of Food Safety(24), 109-
127.
Bagdure, S.R., Fisher, M.A., Ryan, M.E., Khasawneh, F.A. 2012. Rhodococcus
erythropolis Encephalitis in Patient Receiving Rituximab. Emerging
Infectious Diseases, 18(8), 1377-1379.
Batal, A., Dale, N., Café, M. 2005. Nutrient composition of peanut meal. The
Journal of Applied Poultry Research, 14(2), 254-257.
Bell, K.S., Philp, J.C., Aw, D.W.J. 1998. The genus Rhodococcus. Journal of
Applied Microbiology, 85(2), 195-210.
Bicca, F.C., Fleck, L.C., Ayub, M.A.Z. 1999. Production of biosurfactant by
hydrocarbon degrading Rhodococcus ruber and Rhodococcus erythropolis.
Revista de Microbiologia(30), 231-236.
Box, G.E.P., Behnken, D.W. 1960. Some New Three Level Designs for the Study
of Quantitative Variables. Technometrics, 2(4), 455-475.
Cabiscol, E., Tamarit, J., Ros, J. 2000. Oxidative stress in bacteria and protein
damage by reactive oxygen species. International Microbiology, 3(1), 3-8.
Page 93
73
Cao, H., Liu, D., Mo, X., Xie, C., Yao, D. 2011. A fungal enzyme with the ability
of aflatoxin B 1 conversion: Purification and ESI-MS/MS identification.
Microbiological Research(166), 475-483.
Chih-Wen, L., Mao-Shih, L., Yun-Chi, C., Luis, A.S.-S., Hwai-Shen, L. 2012.
Biodegradation of n-alkanes at high concentration and correlation to the
accumulation of H+ ions in Rhodococcus erythropolis NTU-1. Biochemical
Engineering Journal, 63.
Ciegler, A., Lillehoj, E., Peterson, R., Hall, H. 1966. Microbial detoxification of
aflatoxin. Applied Microbiology, 14(6), 934-939.
Coallier-Ascah, J., Idziak, E.S. 1985. Interaction between Streptococcus lactis and
Aspergillus flavus on production of aflatoxin. Applied and Environmental
Microbiology, 49(1), 163-7.
Conville, P.S., Witebsky, F.G. 2007. Nocardia, Rhodococcus, Gordonia,
Actinomadura, Streptomyces, and other aerobic actinomycetes. 9 ed. in:
Manual of clinical microbiology, (Eds.) J. Versalovic, K.C. Carroll, G.
Funke, J.H. Jorgensen, M.L. Landry, D.W. Warnock, Vol. 1, ASM Press,
2011. Washington, DC, pp. 515-542.
Coruh, N., Celep, A.G.S., Özgökçe, F. 2007. Antioxidant properties of Prangos
ferulacea (L.) Lindl., Chaerophyllum macropodum Boiss. and Heracleum
persicum Desf. from Apiaceae family used as food in …. Food
Chemistry(100), 1237-1242.
Cserháti, M., Kriszt, B., Krifaton, C., Szoboszlay, S., Háhn, J., Tóth, S., Nagy, I.,
Kukolya, J. 2013. Mycotoxin-degradation profile of Rhodococcus strains.
International Journal of Food Microbiology, 166(1), 176-185.
Page 94
74
Das, C., Mishra, H.N. 2000. Effect of aflatoxin B1 detoxification on the
physicochemical properties and quality of ground nut meal. Food
Chemistry, 70(4), 483-487.
de Carvalho, C.C., da Fonseca, M. 2005. The remarkable Rhodococcus
erythropolis. Applied Microbiology and Biotechnology, 67(6), 715-726.
de Carvalho, C.C.C. 2012. Adaptation of Rhodococcus erythropolis cells for growth
and bioremediation under extreme conditions. Research in Microbiology,
163(2), 125-136.
Devendran, G., Balasubramanian, U. 2011. Biochemical and histopathological
analysis of aflatoxin induced toxicity in liver and kidney of rat. Asian
Journal of Plant Science and Research, 1(4), 61-69.
Diop, N., Beghin, J.C., Sewadeh, M. 2004. Groundnut Policies, Global Trade
Dynamics, and the Impact of Trade Liberalization. in: Global Agricultural
Trade and Developing Countries, (Eds.) M.A. Aksoy, J.C. Beghin, World
Bank Publications.
Dwarakanath, C.T., Rayner, E.T., Mann, G.E., Dollear, F.G. 1968. Reduction of
aflatoxin levels in cottonseed and peanut meals by ozonization. Journal of
the American Oil Chemists’ Society, 45(2), 93-95.
Dyck, V.P.J., Tobback, P., Feyes, M. 1982. Sensitivity of aflatoxin B1 to ionizing
radiation. Applied and Environmental Microbiology, 43(6), 1317-1319.
El-Nezami, H., Kankaanpaa, P., Salminen, S., Ahokas, J. 1998. Ability of dairy
strains of lactic acid bacteria to bind a common food carcinogen, aflatoxin
Page 95
75
B1. Food and Chemical Toxicology : an international journal published for
the British Industrial Biological Research Association, 36(4), 321-326.
Ellis, W.O., Smith, J.P., Simpson, B.K., Oldham, J.H. 1991. Aflatoxins in food:
occurrence, biosynthesis, effects on organisms, detection, and methods of
control. Critical Reviews in Food Science and Nutrition, 30(4), 403-39.
Eshelli, M., Harvey, L., Edrada-Ebel, R., McNeil, B. 2015. Metabolomics of the
bio-degradation process of aflatoxin B1 by actinomycetes at an initial pH of
6.0. Toxins, 7(2), 439-456.
Fanget, N.V., Foley, S. 2011. Starvation/stationary-phase survival of Rhodococcus
erythropolis SQ1: a physiological and genetic analysis. Archives of
Microbiology, 193(1), 1-13.
FAO. 2014. FAOSTAT, Food and Agriculture Organization of the United Nations.
Rome, Italy.
FAO. 1997. Worldwide Regulations for Mycotoxins in food and feed in 2003. A
Compendium, FAO Food and Nutrition Paper 64. FAO, Rome.
FAO. 2004. Worldwide Regulations for Mycotoxins in food and feed in 2003. A
Compendium, FAO Food and Nutrition Paper 81. FAO, Rome.
FDA. 2012. Bad Bug Book, Foodborne Pathogenic Microorganisms and Natural
Toxins. Second ed, (Eds.) K.A. Lampel, S. Al-Khaldi, S.M. Cahill, Food
and Drug Administration.
Ferreira, S.L.C., Bruns, R.E., Ferreira, H.S., Matos, G.D., David, J.M., Brandão,
G.C., Silva, E.G.P.d., Portugal, L.A., Reis, P.S.d., Souza, A.S., Santos,
Page 96
76
W.N.L. 2007. Box-Behnken design: an alternative for the optimization of
analytical methods. Analytica Chimica Acta, 597(2), 179-186.
Fonseca, H., Regitano-d'Arce, M. 1993. Aflatoxin removal of peanut meals with
aqueous ethanol. Scientia Agricola, 50(1), 154-156.
Gao, S.S., Chen, X.Y., Zhu, R.Z., Choi, B.M., Kim, B.R. 2010. Sulforaphane
induces glutathione S-transferase isozymes which detoxify aflatoxin B(1)-
8,9-epoxide in AML 12 cells. Biofactors, 36(4), 289-96.
Gardner, H.K., Koltun, S.P., Vix, H.L.E. 1968. Solvent extraction of aflatoxins
from oilseed meals. Journal of Agricultural and Food Chemistry, 16(6),
990-993.
Ghanem, I., Orfi, M., Shamma, M. 2008. Effect of gamma radiation on the
inactivation of aflatoxin B1 in food and feed crops. Brazilian journal of
microbiology : [publication of the Brazilian Society for Microbiology],
39(4), 787-791.
Guan, S., Zhao, L., Ma, Q., Zhou, T., Wang, N., Hu, X., Ji, C. 2010. In vitro
efficacy of Myxococcus fulvus ANSM068 to biotransform aflatoxin B1.
International Journal of Molecular Sciences, 11(10), 4063-4079.
Gűrtler, V., Seviour, R. 2010. Systematics of Members of the Genus Rhodococcus
(Zopf 1891) Emend Goodfellow et al. 1998. in: Biology of Rhodococcus,
(Ed.) H.M. Alvarez, Vol. 16, Springer Berlin Heidelberg, pp. 1-28.
Habig, W.H., Pabst, M.J., Jakoby, W.B. 1974. Glutathione S-transferases. The first
enzymatic step in mercapturic acid formation. The Journal of Biological
Chemistry, 249(22), 7130-9.
Page 97
77
Haskard, C.A., El-Nezami, H.S., Kankaanpaa, P.E., Salminen, S., Ahokas, J.T.
2001. Surface binding of aflatoxin B(1) by lactic acid bacteria. Applied and
Environmental Microbiology, 67(7), 3086-91.
Herzallah, S., Alshawabkeh, K., Al Fataftah, A. 2008. Aflatoxin decontamination of
artificially contaminated feeds by sunlight, γ-radiation, and microwave
heating. Journal of Applied Poultry Research, 17(4), 515-521.
Huwig, A., Freimund, S., Käppeli, O., Dutler, H. 2001. Mycotoxin detoxication of
animal feed by different adsorbents. Toxicology Letters(122), 179-188.
IMF. 1986. Primary Commodities Market Deveopments and Outlook. International
Monetary Fund, Washington D.C.
İscan, M., Çoban, T., Bülbül, D., Eke, B.C., Aygörmez, S., Berberoglu, U. 1998.
Xenobiotic metabolizing and antioxidant enzymes in normal and neoplastic
human breast tissue. European Journal of Drug Metabolism and
Pharmacokinetics, 23(4), 497-500.
Izumi, Y., Ohshiro, T., Ogino, H., Hine, Y. 1994. Selective desulfurization of
dibenzothiophene by Rhodococcus erythropolis D-1. Applied and
Environmental Microbiology, 60(1), 223-226.
Kamble, A.L., Meena, V.S. 2010. Effect of agitation and aeration on the production
of nitrile hydratase by Rhodococcus erythropolis MTCC 1526 in a stirred
tank reactor. Letters in Applied Microbiology(51), 413-4120.
Khlangwiset, P., Wu, F. 2010. Costs and efficacy of public health interventions to
reduce aflatoxin–induced human disease. Food Additives and Contaminants,
27(7), 998-1014.
Page 98
78
Kong, Q., Zhai, C., Guan, B., Li, C., Shan, S., Yu, J. 2012. Mathematic modeling
for optimum conditions on aflatoxin B₁degradation by the aerobic bacterium
Rhodococcus erythropolis. Toxins, 4(11), 1181-1195.
Kurane, R., Hatamochi, K., Kakuno, T. 1994a. Production of a bioflocculant by
Rhodococcus erythropolis S-1 grown on alcohols. Bioscience,
Biotechnology and Biochemistry, 58(2), 428-429.
Kurane, R., Hatamochi, K., Kakuno, T., Kiyohara, M., Hirano, M., Taniguchi, Y.
1994b. Production of a bioflocculant by Rhodococcus erythropolis S-1
grown on alcohols. Bioscience, Biotechnology and Biochemistry, 58(2), 428-
429.
Kurane, R., Toeda, K., Takeda, K., Suzuki, T. 1986. Culture Conditions for
Production of Microbial Flocculant by Rhodococcus erythropolis.
Agricultural and Biological Chemistry, 50(9), 2309-2313.
Kusumaningtyas, E., Widiastuti, R., Maryam, R. 2006. Reduction of aflatoxin B1 in
chicken feed by using Saccharomyces cerevisiae, Rhizopus oligosporus and
their combination. Mycopathologia(162), 307-311.
Lamb, M., Sternitzke, D. 2001. Cost of aflatoxin to the farmer, buying point, and
sheller segments of the Southeast United States peanut industry. Peanut
Science, 28(2), 59-63.
Lee, L.S., Cucullu, A.F. 1978. Conversion of aflatoxin B1 to aflatoxin D1 in
ammoniated peanut and cottonseed meals. Journal of Agricultural and Food
Chemistry, 26(4), 881-884.
Page 99
79
Lee, L.S., Dunn, J.J., DeLucca, A.J., Ciegler, A. 1981. Role of lactone ring of
aflatoxin B1 in toxicity and mutagenicity. Experientia, 37(1), 16-17.
Lenke, H., Pieper, D.H., Bruhn, C. 1992. Degradation of 2, 4-dinitrophenol by two
Rhodococcus erythropolis strains, HL 24-1 and HL 24-2. Applied and
Environmental Microbiology, 58(9), 2928-2932.
Li, J.-h., Wei, Y.-m., Guo, B.-l., Pan, J.-r., Lu, W. 2009. Decontamination of B-
aflatoxins in Peanut with Citric Acid Treatment. Food Science, 30(13), 37-
40.
Line, J.E., Brackett, R.E., Wilkinson, R.E. 1994. Evidence for Degradation of
Aflatoxin B1 by Flavobacterium aurantiacum. Journal of Food Protection,
57(9), 788-791.
Liu, D.L., Yao, D.S., Liang, R., Ma, L., Cheng, W.Q. 1998. Detoxification of
Aflatoxin B1 by Enzymes Isolated from Armillariella tabescens. Food and
Chemical Toxicology(36), 563-574.
Liu, Y., Wu, F. 2010. Global burden of aflatoxin-induced hepatocellular carcinoma:
a risk assessment. Environmental health perspectives, 118(6), 818-824.
Lowry, O.H., Rosebrough, N.J., Farr, A.L., Randall, R.J. 1951. Protein
measurement with the Folin phenol reagent. Journal of Biological
Chemistry(193), 265-275.
Magan, N., Medina, A., Aldred, D. 2011. Possible climate‐change effects on
mycotoxin contamination of food crops pre‐and postharvest. Plant
Pathology(60), 150-163.
Page 100
80
McLean, M., Dutton, M.F. 1995. Cellular interactions and metabolism of aflatoxin:
an update. Pharmacology & Therapeutics, 65(2), 163-92.
Mehan, V.K., McDonald, D., Haravu, L.J., Jayanthi, S. 1991. The Groundnut
Aflatoxin Problem: Review and Literature Database. International Crops
Research Institute for the Semi-arid Tropics, Patancheru, India.
Meki, A.-R.M.A., Abdel-Ghaffar, S., El-Gibaly, I. 2001. Aflatoxin B1 induces
apoptosis in rat liver: protective effect of melatonin. Neuroendocrinology
Letters, 22(6), 417-426.
Méndez-Albores, A., Del Río-García, J.C., Moreno-Martínez, E. 2007.
Decontamination of aflatoxin duckling feed with aqueous citric acid
treatment. Animal Feed Science and Technology, 135(3–4), 249-262.
Mishra, H.N., Das, C. 2003. A review on biological control and metabolism of
aflatoxin. Critical Reviews in Food Science and Nutrition, 43(3), 245-64.
Motomura, M., Toyomasu, T., Mizuno, K., Shinozawa, T. 2003. Purification and
characterization of an aflatoxin degradation enzyme fromPleurotus
ostreatus. Microbiological Research, 158(3), 237-242.
Moumita, P.P., Bhalchandra, K.V., Kiran, M.D., Renuka, M.J., Sanjay, N.N.,
Bhaskar, D.K. 2009. Media optimization for biosurfactant production by
Rhodococcus erythropolis MTCC 2794: artificial intelligence versus a
statistical approach. Journal of Industrial Microbiology &
Biotechnology(36), 747-756.
Muralidhar, R.V., Chirumamila, R.R., Marchant, R. 2001. A response surface
approach for the comparison of lipase production by Candida cylindracea
Page 101
81
using two different carbon sources. Biochemical Engineering Journal(9),
17-23.
Neal, G., Judah, D., Carthew, P., Verma, A., Latour, I., Weir, L., Coker, R., Nagler,
M., Hoogenboom, L. 2001. Differences detected in vivo between samples of
aflatoxin-contaminated peanut meal, following decontamination by two
ammonia-based processes. Food Additives and Contaminants, 18(2), 137-
149.
Otsuki, T., Wilson, J.S., Sewadeh, M. 2001. Saving two in a billion: quantifying the
trade effect of European food safety standards on African exports. Food
Policy(26), 495-514.
Pirog, T.P., Shevchuk, T.A., Voloshina, I.N. 2004. Production of surfactants by
Rhodococcus erythropolis strain EK-1, grown on hydrophilic and
hydrophobic substrates. Applied Biochemistry and Microbiology, 40(5),
470-475.
Plackett, R.L., Burman, J.P. 1946. The Design of Optimum Multifactorial
Experiments. Biometrika, 33(4), 305-325.
Rayner, E., Dollear, F.G. 1968. Removal of aflatoxins from oilseed meals by
extraction with aqueous isopropanol. Journal of the American Oil Chemists’
Society, 45(9), 622-624.
Reed, G. 1966. Enzymes in Food Processing (1966). Elsevier Science.
Samarajeewa, U., Sen, A.C., Fernando, S.Y. 1991. Inactivation of aflatoxin B1 in
corn meal, copra meal and peanuts by chlorine gas treatment. Food and
Chemical Toxicology, 29(1), 41-47.
Page 102
82
Samuel, M.S., Sivaramakrishna, A., Mehta, A. 2014. Degradation and
detoxification of aflatoxin B1 by Pseudomonas putida. International
Biodeterioration & Biodegradation, 86, 202-209.
Sangare, L., Zhao, Y., Folly, Y., Chang, J., Li, J., Selvaraj, J., Xing, F., Zhou, L.,
Wang, Y., Liu, Y. 2014. Aflatoxin B1 Degradation by a Pseudomonas
Strain. Toxins, 6(10), 3028-3040.
Shetty, P., Jespersen, L. 2006. Saccharomyces cerevisiae and lactic acid bacteria as
potential mycotoxin decontaminating agents. Trends in Food Science &
Technology, 17(2), 48-55.
Smiley, R.D., Draughon, F.A. 2000. Preliminary evidence that degradation of
aflatoxin B1 by Flavobacterium aurantiacum is enzymatic. Journal Of Food
Protection, 63(3), 415-418.
Sojo, M., Bru, R., Lopez-Molina, D. 1997. Cell-linked and extracellular cholesterol
oxidase activities from Rhodococcus erythropolis. Isolation and
physiological characterization. Applied Microbiology and
Biotechnology(47), 583-589.
Strange, R.C., Spiteri, M.A., Ramachandran, S. 2001. Glutathione-S-transferase
family of enzymes. Mutation Research, 408, 21-26.
Suttajit, M. 1991. Prevention and control of mycotoxins. in: Mycotoxin Prevention
and Control in Foodgrains, (Ed.) A.S.F. R.L. Semple, P.A. Hicks and J.V.
Lozare, AGPP Publication. Bangkok, Thailand.
Teniola, O., Addo, P., Brost, I., Färber, P., Jany, K.D., Alberts, J., van Zyl, W.,
Steyn, P., Holzapfel, W. 2005. Degradation of aflatoxin B1 by cell-free
Page 103
83
extracts of Rhodococcus erythropolis and Mycobacterium
fluoranthenivorans sp. nov. DSM44556(T). International Journal of Food
Microbiology, 105(2), 111-117.
Tomioka, N., Uchiyama, H., Yagi, O. 1994. Cesium Accumulation and Growth
Characteristics of Rhodococcus erythropolis CS98 and Rhodococcus sp.
Strain CS402. Applied and Environmental Microbiology, 60(7), 2227-2231.
Tripathi, S., Mishra, H.N. 2009. Modeling and Optimization of Enzymatic
Degradation of Aflatoxin B1 (AFB1) in Red Chili Powder Using Response
Surface Methodology. Food and Bioprocess Technology(4), 770-780.
USDA. 2015. Oilseeds: World Markets and Trade. Foreign Agricultural Service,
United States Department of Agriculture.
van Egmond, H.P., Jonker, M.A. 2004. 3 - Current regulations governing
mycotoxin limits in food. in: Mycotoxins in Food, (Eds.) N. Magan, M.
Olsen, Woodhead Publishing, pp. 49-68.
Wannop, C.C. 1961. The Histopathology of Turkey "X" Disease in Great Britain.
Avian Diseases, 5(4), 371-381.
Waśko, A., Monika, K.-W., Podleśny, M., Magdalena, P.-B., Targoński, Z.,
Agnieszka, K.-K. 2010. The Plackett-Burman design in optimization of
media components for biomass production of Lactobacillus rhamnosus
OXY. Acta Biologica Hungarica, 61(3), 344355.
Werf, M.J.v.d., Swarts, H.J., Bont, J.A.d. 1999. Rhodococcus erythropolis DCL14
contains a novel degradation pathway for limonene. Applied and
Environmental Microbiology, 65(5), 2092-2102.
Page 104
84
Yassin, A.F., Schaal, K.P. 2005. Reclassification of Nocardia corynebacterioides
Serrano et al. 1972 (Approved Lists 1980) as Rhodococcus
corynebacterioides comb. nov. International Journal of Systematic and
Evolutionary Microbiology, 55(3), 1345-1348.
Yiannikouris, A., Jouany, J.-P. 2002. Mycotoxins in feeds and their fate in animals:
a review. Animal Research, 51(2), 81-100.
Yu, F.L. 1977. Mechanism of aflatoxin B1 inhibition of rat hepatic nuclear RNA
synthesis. Journal of Biological Chemistry, 252(10), 3245-3251.
Zhai, C., Kong, Q., Guan, B., Lv, Z., You, Y., Gao, Y., Yang, Y. 2013. Statistical
experimental methods for optimizing the cultivating conditions for
Rhodococcus erythropolis. African Journal of Biotechnology, 10(42), 8502-
8510.
Zhang, C., Sun, J., Yu, L., Bi, J., Feng, J., Yang, Q. 2014. Optimization of
Aflatoxin Production of Aspergillus flavus on Peanuts. Advanced Materials
Research, 887-888, 605-609.
Page 105
85
APPENDIX A
CHEMICALS LIST
Table A.1 Table of chemicals
Chemical Supplier
Aflatoxin B1 from A. flavus Sigma-Aldrich
Acetonitrile (HPLC grade) Merck
Ammonium sulfate Merck
Bovine serum albumin Merck
1-chloro-2,4-dinitrobenzene (CDNB) Acros Organics
Copper sulphate Merck
Dipotassium phosphate Merck
Disodium phospate Merck
Dithiothreitol (DTT) Sigma-Aldrich
Ethanol Merck
Ethylenediaminetetraacetic acid (EDTA) Merck
Folin & Ciocalteu's phenol reagent Sigma-Aldrich
Glucose Merck
Glycerol Sigma-Aldrich
Page 106
86
Hexane Merck
Hydrochloric acid Merck
Lactose Merck
L-glutathione reduced (GSH) Sigma-Aldrich
Methanol (HPLC grade) Merck
Monopotassium phosphate Merck
Nutrient agar Merck
Nutrient broth Merck
Peptone Merck
Potassium chloride Merck
Sodium carbonate Merck
Sodium chloride Merck
Sodium hydroxide Merck
Sodium potassium tartarate Merck
Sucrose Merck
Tryptose Merck
Xylose Merck
Yeast extract Merck
Page 107
87
APPENDIX B
BUFFERS AND SOLUTIONS
Phosphate buffered saline solution – pH 7.4 (PBS)
0.20 g potassium chloride, 0.20 g monopotassium phosphate, 1.16 g
disodium phosphate and 8.00 g sodium chloride was dissolved in 900 mL deionized
water. pH was adjusted to 7.4 with 0.1M hydrochloric acid solution and diluted to
1000 mL.
Potassium phosphate buffer (pH 6.5)
Solution A: 272 g KH2PO4 per 1000mL dissolved in water (2 M final)
Solution B: 348 g K2HPO4 per 1000mL dissolved in water (2 M final)
68.5 mL solution A and 31.5 mL solution B was mixed to final volume 100 mL
and concentration 1M. This stock solution was diluted as needed.
Page 109
89
APPENDIX C
LOWRY’S METHOD FOR PROTEIN DETERMINATION
Solution A: 50 mL 2% Sodium carbonate + 50 mL 0.1N NaOH solution
Solution B: 10 mL of 1.56% Copper sulphate + 10 mL 2.37% Sodium
potassium tartarate
To construct the standard curve bovine serum albumin (BSA)
standard solutions were prepared between concentrations 0.05 and 1 mg/mL.
Samples and standard solutions were mixed with solutions A and B and incubated
with Folin & Ciocalteau’s solution for 30 minutes at room temperature. Optical
densities were measured at 660 nm wavelength after zero adjustment with blank.
Page 110
90
Standard curve
Protein concentration (mg/mL)
0.0 0.2 0.4 0.6 0.8 1.0 1.2
OD
660
0.0
0.1
0.2
0.3
0.4
0.5
0.6
0.7
y= 0.6287x+0.0356R2=0.9977
Figure C.1 Standard curve for Lowry’s method for protein determination
Page 111
91
APPENDIX D
STANDARD CURVE FOR CELL GROWTH
OD600
0 2 4 6
Log
num
ber o
f cel
ls
5
6
7
8
9
10
11
y = 0.7067x + 5.7554R2 = 0.9523
Figure D.1 Standard curve for cell growth monitoring
Page 113
93
APPENDIX E
SAMPLE HPLC CHROMATOGRAM
Figure E.1 Sample HPLC chromatogram for aflatoxin determination
Page 115
95
APPENDIX F
ANOVA TABLES FOR MULTIPLE COMPARISONS
One-way ANOVA: Absorbance versus N trogen source Source DF SS MS F P Nitrogen source 2 1.0298 0.5149 18.43 0.021 Error 3 0.0838 0.0279 Total 5 1.1136 S = 0.1671 R-Sq = 92.47% R-Sq(adj) = 87.46% Grouping Information Using Tukey Method Nitrogen source N Mean Grouping Peptone 2 5.1885 A Tryptose 2 5.0970 A NH42SO4 2 4.2675 B One-way ANOVA: Absorbance versus Carbon Source Source DF SS MS F P Carbon Source 3 9.1372 3.0457 170.09 0.000 Error 4 0.0716 0.0179 Total 7 9.2088 S = 0.1338 R-Sq = 99.22% R-Sq(adj) = 98.64% Grouping Information Using Tukey Method Carbon Source N Mean Grouping Glucose 2 6.1975 A Sucrose 2 4.1980 B Xylose 2 3.7365 B C Lactose 2 3.4745 C
Page 116
96
One-way ANOVA: Reduction versus Type Source DF SS MS F P Type 2 10225.0 5112.5 140.55 0.000 Error 15 545.6 36.4 Total 17 10770.6 S = 6.031 R-Sq = 94.93% R-Sq(adj) = 94.26% Individual 95% CIs For Mean Based on Pooled StDev Level N Mean StDev +---------+---------+---------+--------- Cont 6 6.049 1.297 (--*--) Enz 6 46.358 8.637 (-*--) Ferm 6 62.778 5.732 (-*--) +---------+---------+---------+--------- 0 20 40 60 Pooled StDev = 6.031 Grouping Information Using Tukey Method Type N Mean Grouping Ferm 6 62.778 A Enz 6 46.358 B Cont 6 6.049 C Means that do not share a letter are significantly different.
Page 117
97
One-way ANOVA: C2 versus C1 Source DF SS MS F P C1 2 6177319 3088659 1797.54 0.000 Error 3 5155 1718 Total 5 6182473 S = 41.45 R-Sq = 99.92% R-Sq(adj) = 99.86% Individual 95% CIs For Mean Based on Pooled StDev Level N Mean StDev ------+---------+---------+---------+--- Control 2 2761.0 69.2 (*-) Treated 2 980.9 12.5 (*) Untreated 2 368.9 14.3 (*-) ------+---------+---------+---------+--- 700 1400 2100 2800 Pooled StDev = 41.5 Grouping Information Using Tukey Method C1 N Mean Grouping Control 2 2761.0 A Treated 2 980.9 B Untreated 2 368.9 C Means that do not share a letter are significantly different.
Page 119
99
APPENDIX G
CULTURE GROWTH OPTIMIZATION
Response Surface Regression: Log number versus Temperature; Liquid volum; ... The analysis was done using coded units. Estimated Regression Coefficients for Log number Term Coef SE Coef T P Constant 9.3909 0.08708 107.844 0.000 Temperature -0.4256 0.05332 -7.982 0.000 Liquid volume -0.9888 0.05332 -18.543 0.000 Agitation speed 0.5642 0.05332 10.580 0.000 Temperature*Temperature -0.4751 0.07849 -6.053 0.000 Liquid volume*Liquid volume 0.2621 0.07849 3.339 0.003 Agitation speed*Agitation speed -0.3953 0.07849 -5.037 0.000 Temperature*Liquid volume 0.2218 0.07541 2.941 0.008 Temperature*Agitation speed -0.1854 0.07541 -2.459 0.023 Liquid volume*Agitation speed 0.4081 0.07541 5.412 0.000 S = 0.213297 PRESS = 2.16612 R-Sq = 96.96% R-Sq(pred) = 92.77% R-Sq(adj) = 95.60% Analysis of Variance for Log number Source DF Seq SS Adj SS Adj MS F Regression 9 29.0440 29.0440 3.2271 70.93 Linear 3 23.6347 23.6347 7.8782 173.16 Temperature 1 2.8983 2.8983 2.8983 63.70 Liquid volume 1 15.6438 15.6438 15.6438 343.85 Agitation speed 1 5.0926 5.0926 5.0926 111.93 Square 3 3.4082 3.4082 1.1361 24.97 Temperature*Temperature 1 1.6186 1.6669 1.6669 36.64 Liquid volume*Liquid volume 1 0.6355 0.5072 0.5072 11.15 Agitation speed*Agitation speed 1 1.1542 1.1542 1.1542 25.37 Interaction 3 2.0012 2.0012 0.6671 14.66 Temperature*Liquid volume 1 0.3936 0.3936 0.3936 8.65 Temperature*Agitation speed 1 0.2750 0.2750 0.2750 6.05 Liquid volume*Agitation speed 1 1.3325 1.3325 1.3325 29.29 Residual Error 20 0.9099 0.9099 0.0455 Lack-of-Fit 3 0.2805 0.2805 0.0935 2.53 Pure Error 17 0.6294 0.6294 0.0370 Total 29 29.9539 Source P Regression 0.000 Linear 0.000
Page 120
100
Temperature 0.000 Liquid volume 0.000 Agitation speed 0.000 Square 0.000 Temperature*Temperature 0.000 Liquid volume*Liquid volume 0.003 Agitation speed*Agitation speed 0.000 Interaction 0.000 Temperature*Liquid volume 0.008 Temperature*Agitation speed 0.023 Liquid volume*Agitation speed 0.000 Residual Error Lack-of-Fit 0.092 Pure Error Total Response Optimization Parameters Goal Lower Target Upper Weight Import Log number Maximum 0 11 11 1 1 Global Solution Temperature = 22.4242 Liquid volum = 100 Agitation sp = 134.949 Predicted Responses Log number = 10.9152 , desirability = 0.992288 Composite Desirability = 0.992288
Page 121
101
APPENDIX H
AFB1 DEGRADATION OPTIMIZATION
Response Surface Regression: Reduction versus Solid conc., Innoculum size, Time The analysis was done using uncoded units. Estimated Regression Coefficients for Reduction Term Coef SE Coef T P Constant 44.1816 3.49591 12.638 0.000 Solid conc. 3.6228 0.20134 17.994 0.000 Innoculum size 1.2481 0.87633 1.424 0.170 Time -0.1890 0.08389 -2.253 0.036 Solid conc.*Solid conc. -0.0705 0.00427 -16.517 0.000 Innoculum size*Innoculum size -0.2434 0.10675 -2.280 0.034 Time*Time 0.0034 0.00074 4.536 0.000 Solid conc.*Innoculum size 0.0573 0.02051 2.795 0.011 Solid conc.*Time -0.0022 0.00171 -1.314 0.204 Innoculum size*Time -0.0185 0.00855 -2.169 0.042 S = 1.16040 PRESS = 60.8369 R-Sq = 98.39% R-Sq(pred) = 96.36% R-Sq(adj) = 97.66% Analysis of Variance for Reduction Source DF Seq SS Adj SS Adj MS F P Regression 9 1644.62 1644.62 182.736 135.71 0.000 Linear 3 1209.66 492.61 164.203 121.94 0.000 Solid conc. 1 1199.35 435.97 435.974 323.77 0.000 Innoculum size 1 0.12 2.73 2.732 2.03 0.170 Time 1 10.19 6.84 6.838 5.08 0.036 Square 3 415.78 415.78 138.592 102.92 0.000 Solid conc.*Solid conc. 1 378.70 367.34 367.338 272.80 0.000 Innoculum size*Innoculum size 1 9.36 7.00 7.002 5.20 0.034 Time*Time 1 27.71 27.71 27.709 20.58 0.000 Interaction 3 19.18 19.18 6.394 4.75 0.012 Solid conc.*Innoculum size 1 10.52 10.52 10.519 7.81 0.011 Solid conc.*Time 1 2.33 2.33 2.326 1.73 0.204 Innoculum size*Time 1 6.34 6.34 6.337 4.71 0.042 Residual Error 20 26.93 26.93 1.347 Lack-of-Fit 3 0.75 0.75 0.250 0.16 0.920 Pure Error 17 26.18 26.18 1.540 Total 29 1671.55
Response Surface Regression: Reduction versus Solid conc., Innoculum size, Time The analysis was done using uncoded units.
Page 122
102
Estimated Regression Coefficients for Reduction (Revised table) Term Coef SE Coef T P Constant 46.3382 3.13978 14.758 0.000 Solid conc. 3.5150 0.18701 18.795 0.000 Innoculum size 1.2481 0.89137 1.400 0.176 Time -0.2340 0.07792 -3.003 0.007 Solid conc.*Solid conc. -0.0705 0.00434 -16.238 0.000 Innoculum size*Innoculum size -0.2434 0.10859 -2.242 0.036 Time*Time 0.0034 0.00075 4.460 0.000 Solid conc.*Innoculum size 0.0573 0.02087 2.748 0.012 Innoculum size*Time -0.0185 0.00869 -2.133 0.045 S = 1.18032 PRESS = 60.4448 R-Sq = 98.25% R-Sq(pred) = 96.38% R-Sq(adj) = 97.58% Analysis of Variance for Reduction (Revised table) Source DF Seq SS Adj SS Adj MS F P Regression 8 1642.29 1642.29 205.287 147.35 0.000 Linear 3 1209.66 521.78 173.927 124.84 0.000 Solid conc. 1 1199.35 492.15 492.147 353.26 0.000 Innoculum size 1 0.12 2.73 2.732 1.96 0.176 Time 1 10.19 12.56 12.561 9.02 0.007 Square 3 415.78 415.78 138.592 99.48 0.000 Solid conc.*Solid conc. 1 378.70 367.34 367.338 263.67 0.000 Innoculum size*Innoculum size 1 9.36 7.00 7.002 5.03 0.036 Time*Time 1 27.71 27.71 27.709 19.89 0.000 Interaction 2 16.86 16.86 8.428 6.05 0.008 Solid conc.*Innoculum size 1 10.52 10.52 10.519 7.55 0.012 Innoculum size*Time 1 6.34 6.34 6.337 4.55 0.045 Residual Error 21 29.26 29.26 1.393 Lack-of-Fit 4 3.08 3.08 0.769 0.50 0.737 Pure Error 17 26.18 26.18 1.540 Total 29 1671.55
Response Optimization Parameters Goal Lower Target Upper Weight Import AFB1(ppb) Maximum 60 100 100 1 1 Global Solution Dilution = 27.3737 Innoculum = 4.87879 Time = 24
Page 123
103
APPENDIX I
GST ASSAY
Time (seconds)
0 50 100 150 200 250 300 350
Abs
orba
nce
(OD
340)
-0.2
0.0
0.2
0.4
0.6
0.8
1.0
1.2
1.4
ControlDetoxified sampleContaminated sampleContaminated sample diluted 10xContaminated sample diluted 2x
Figure I.1 Optical density at 340nm for GST assay


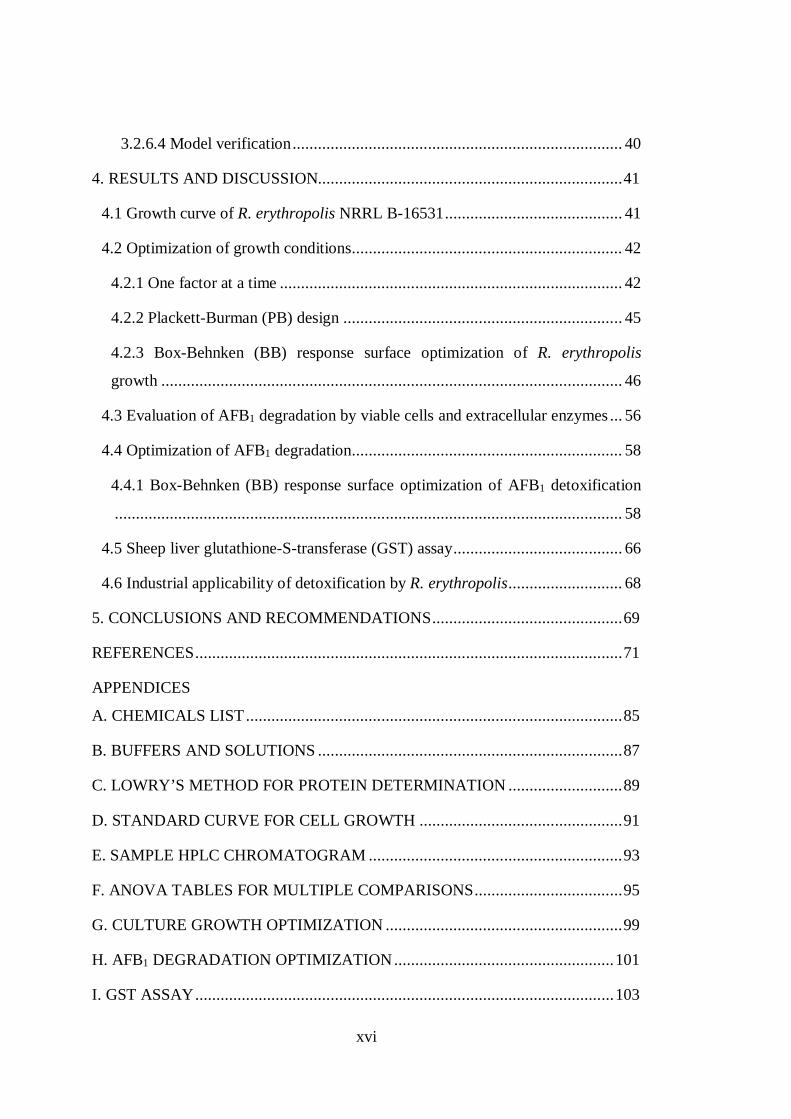

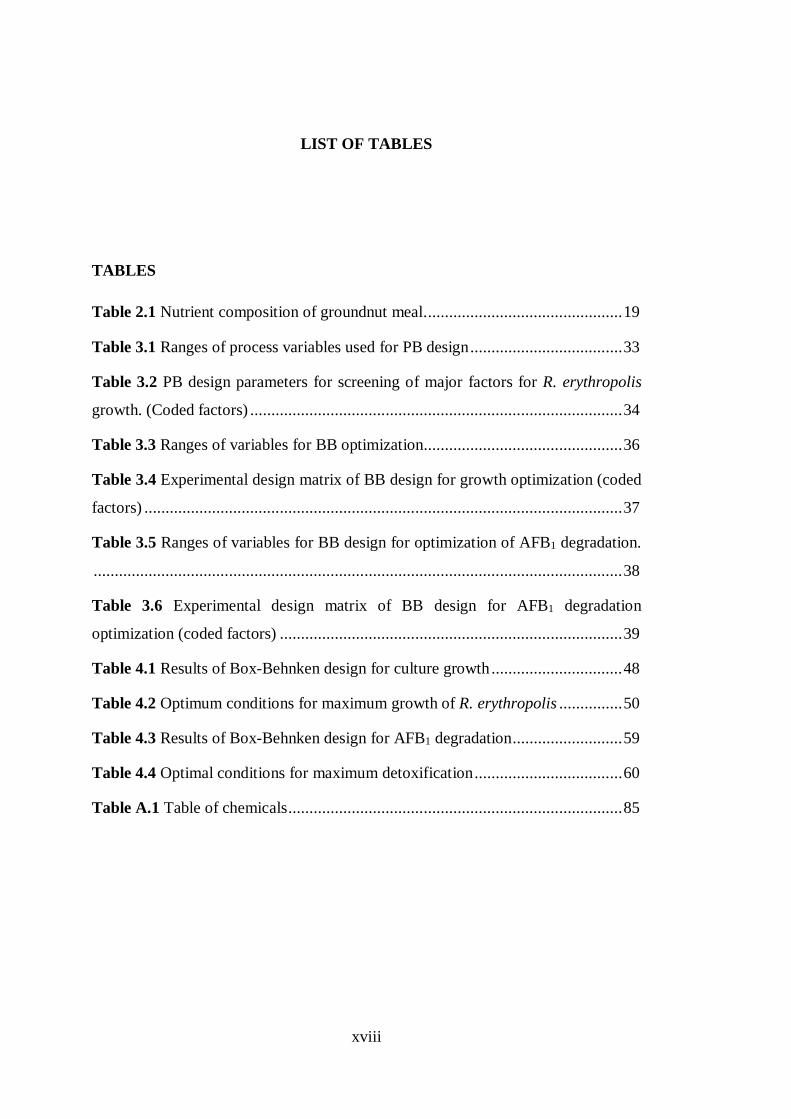


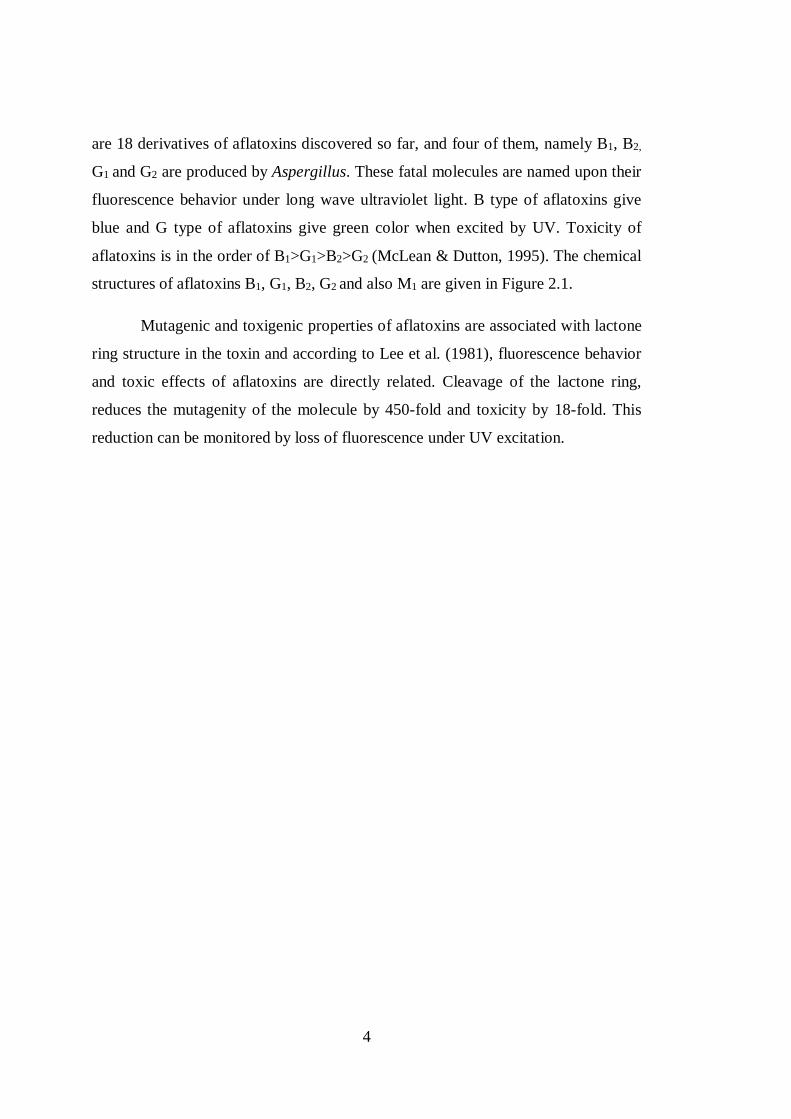


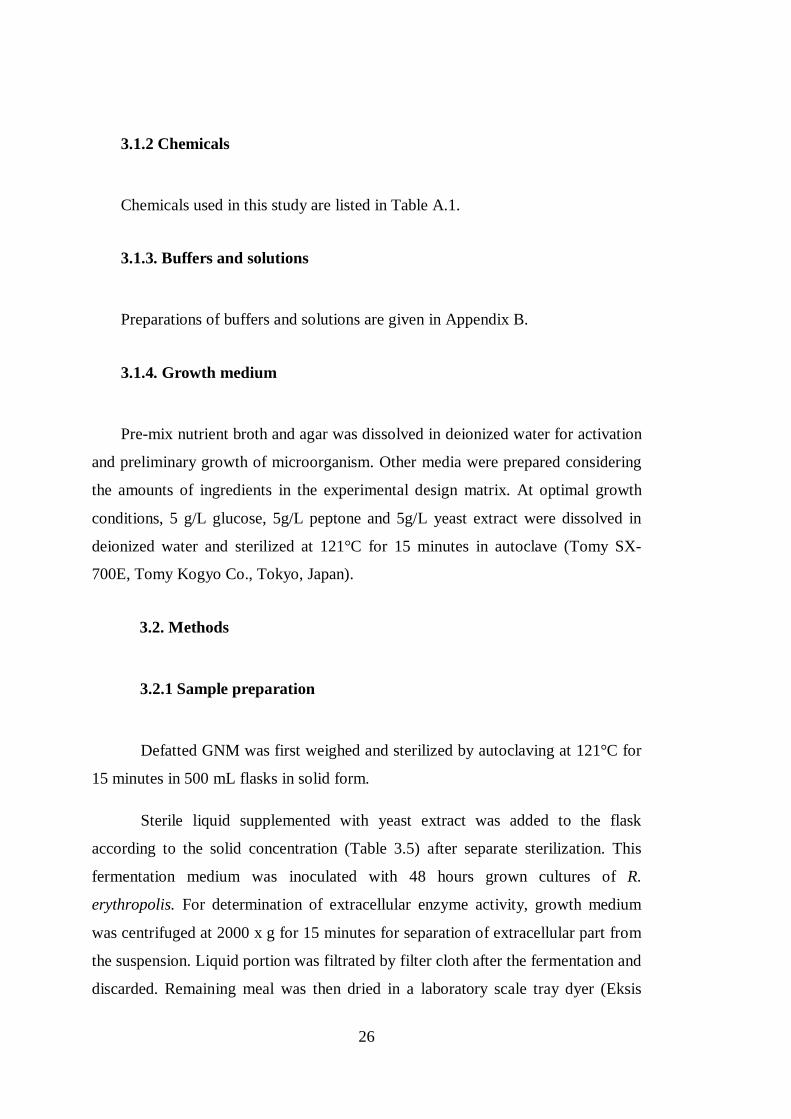


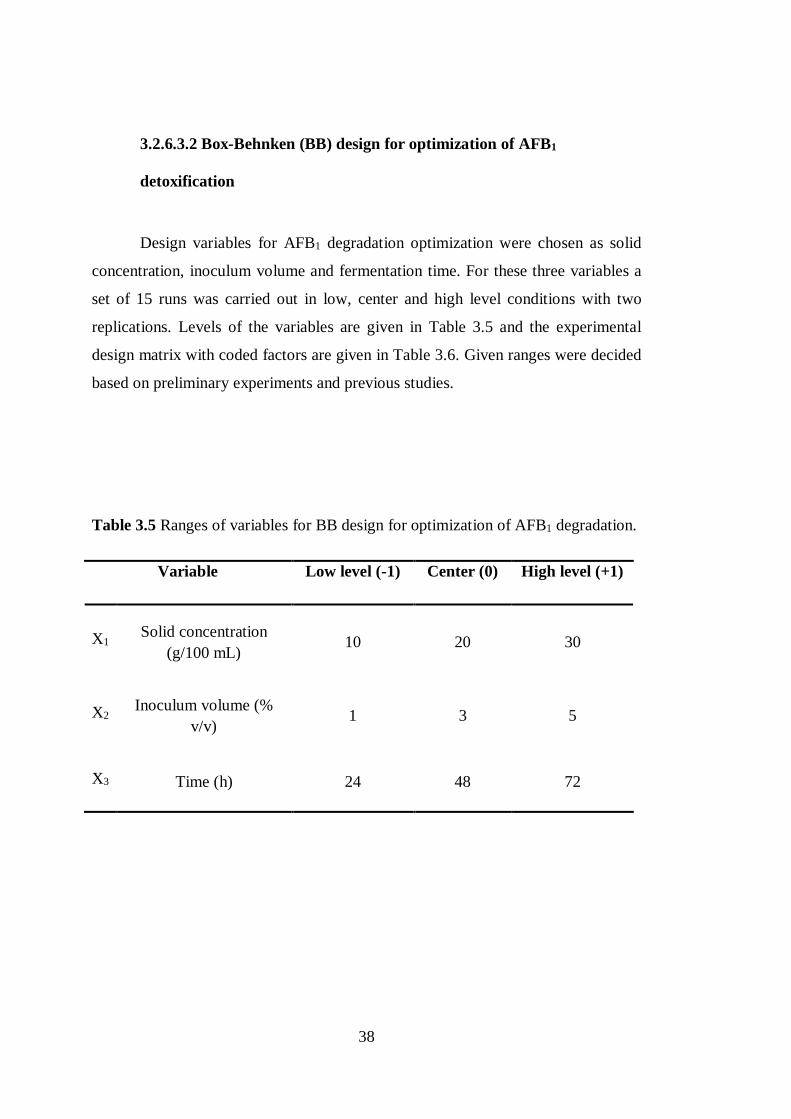

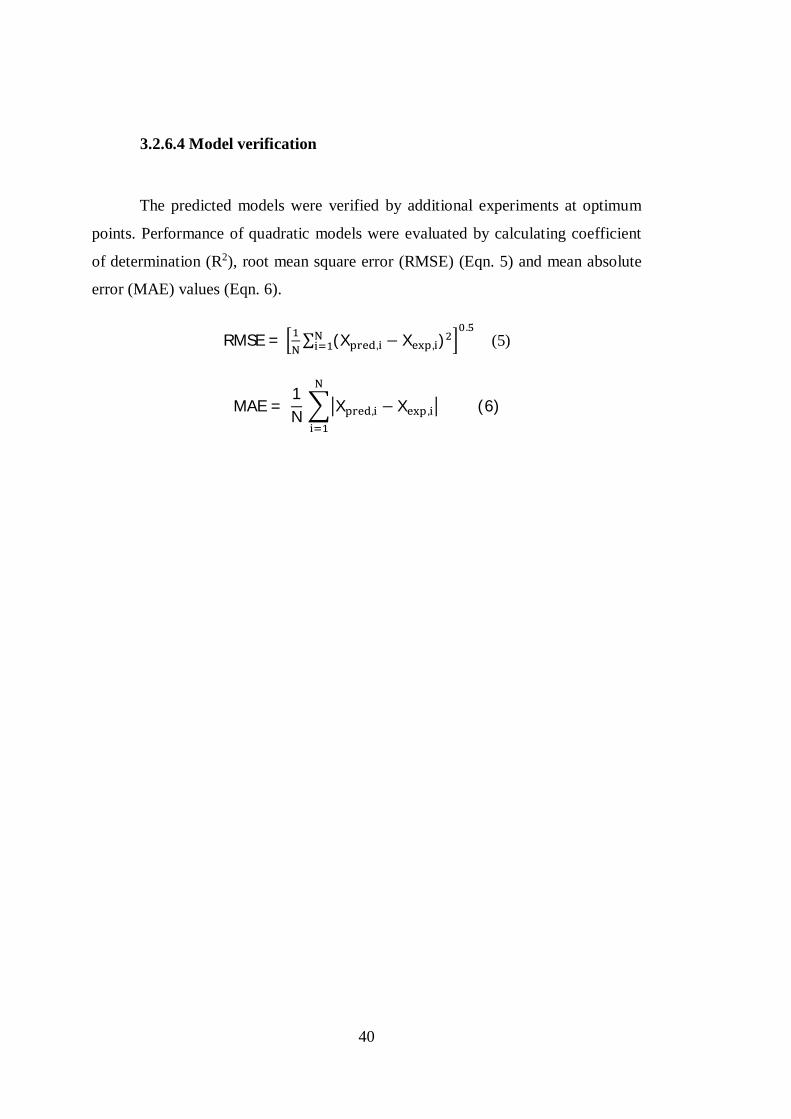


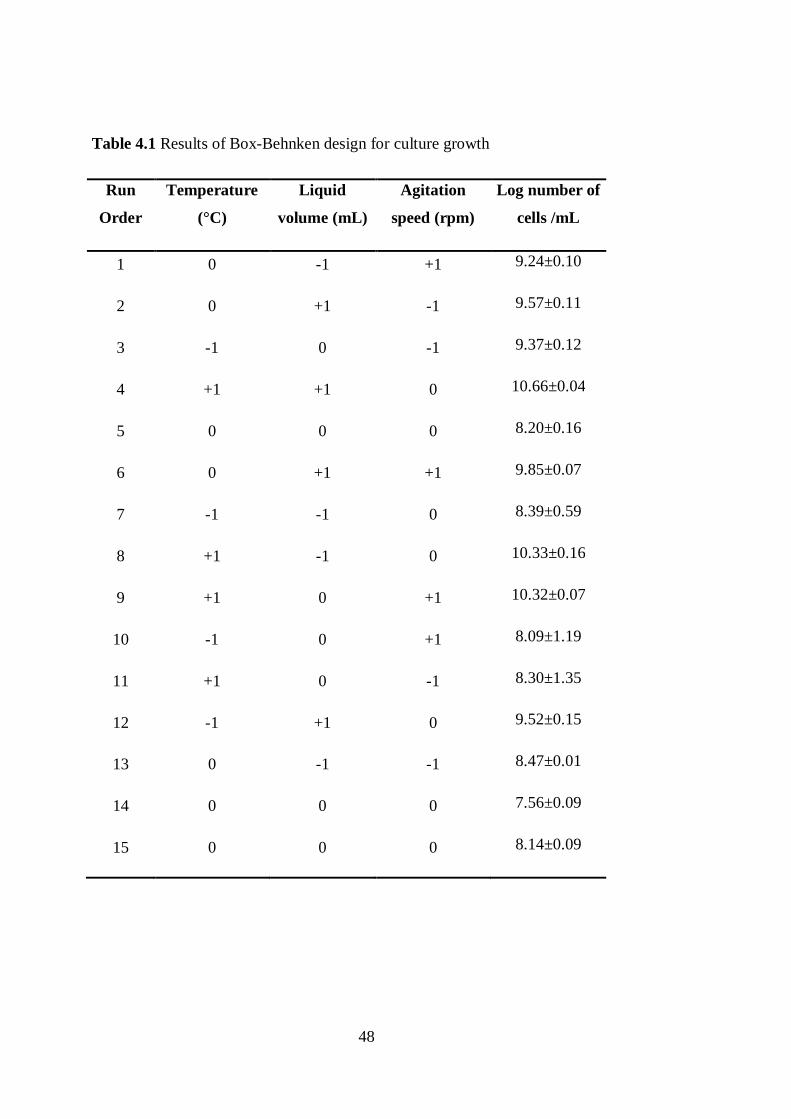


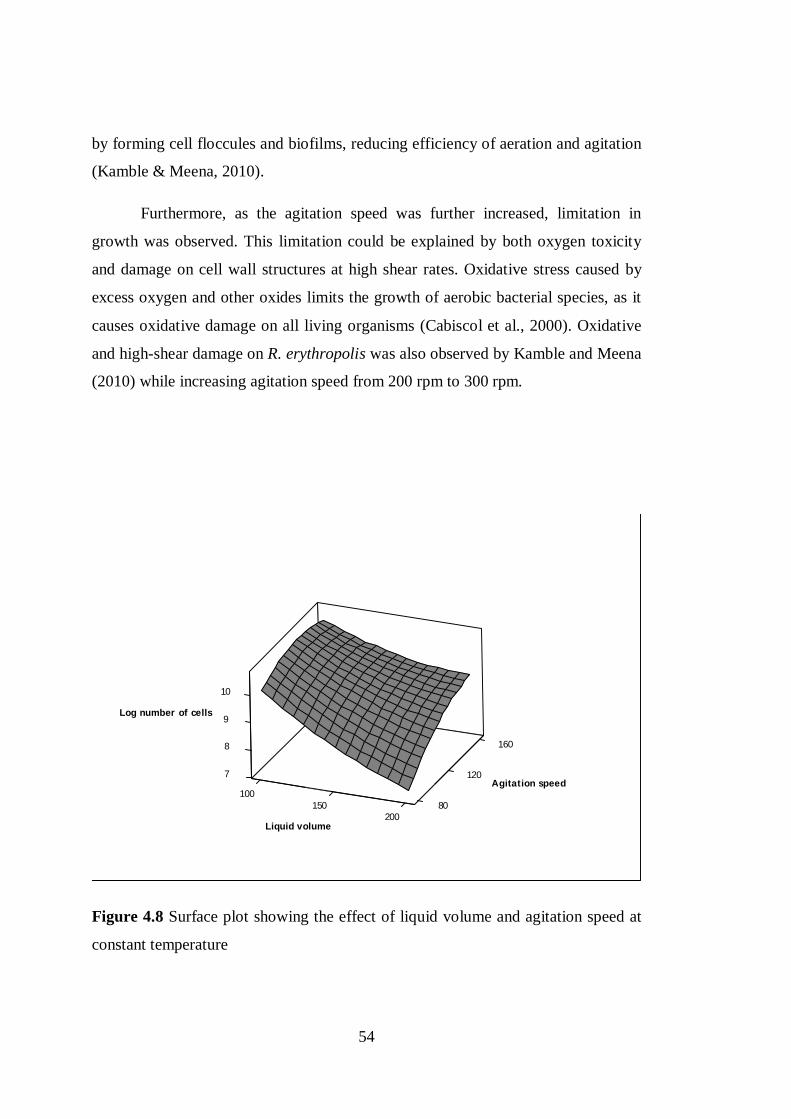
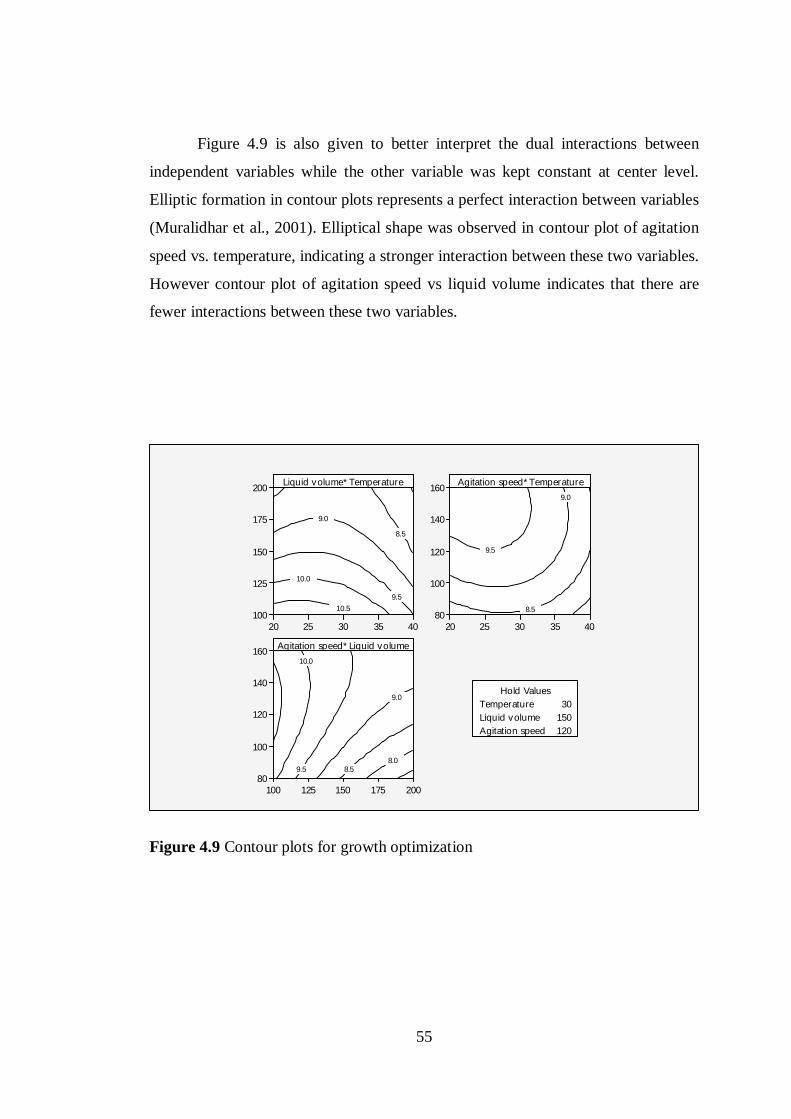


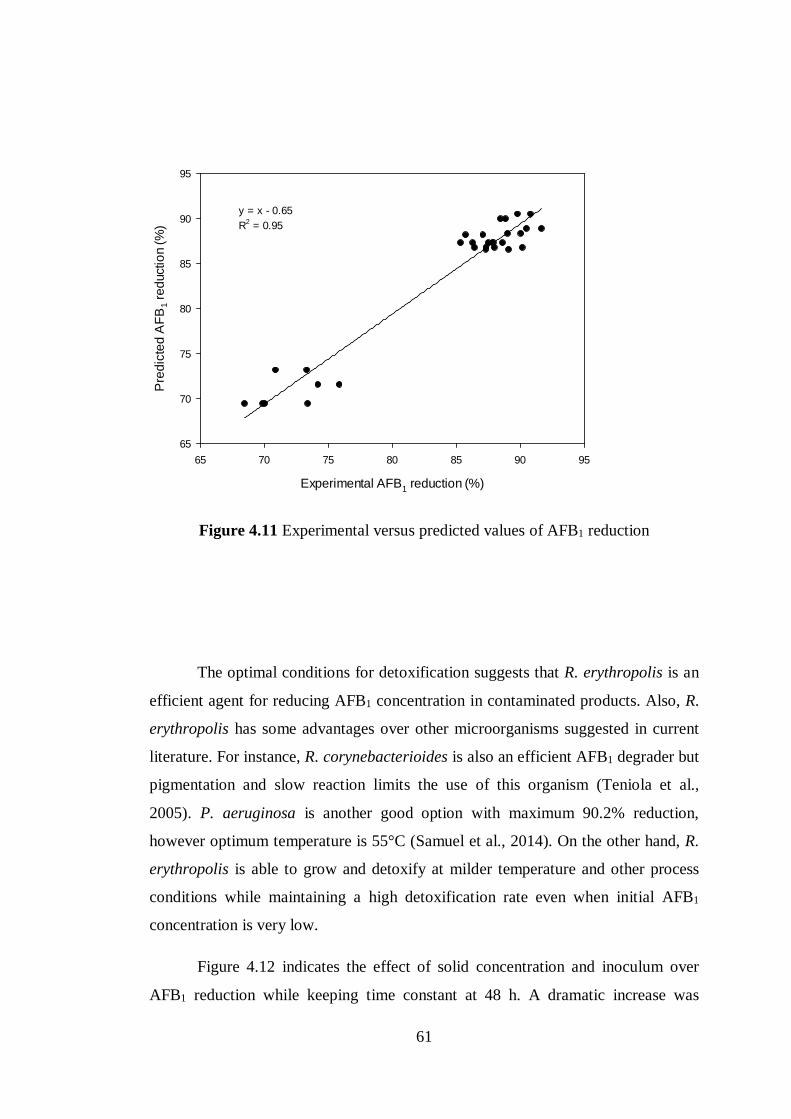

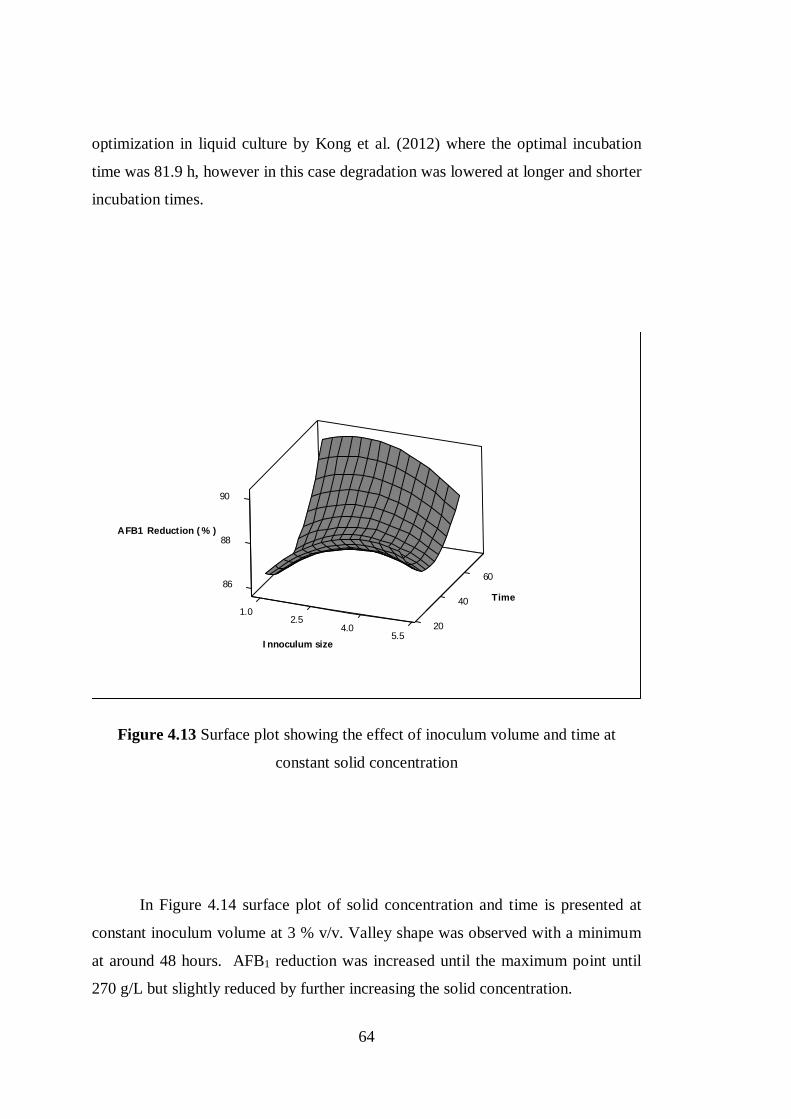
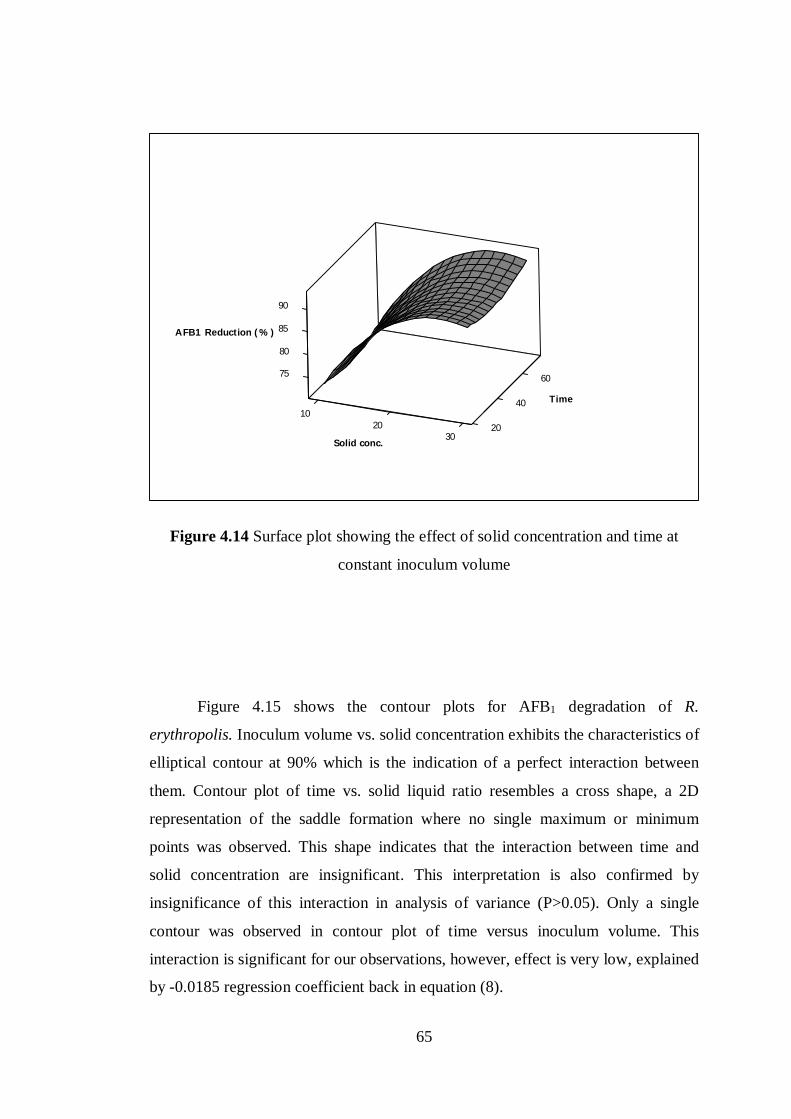
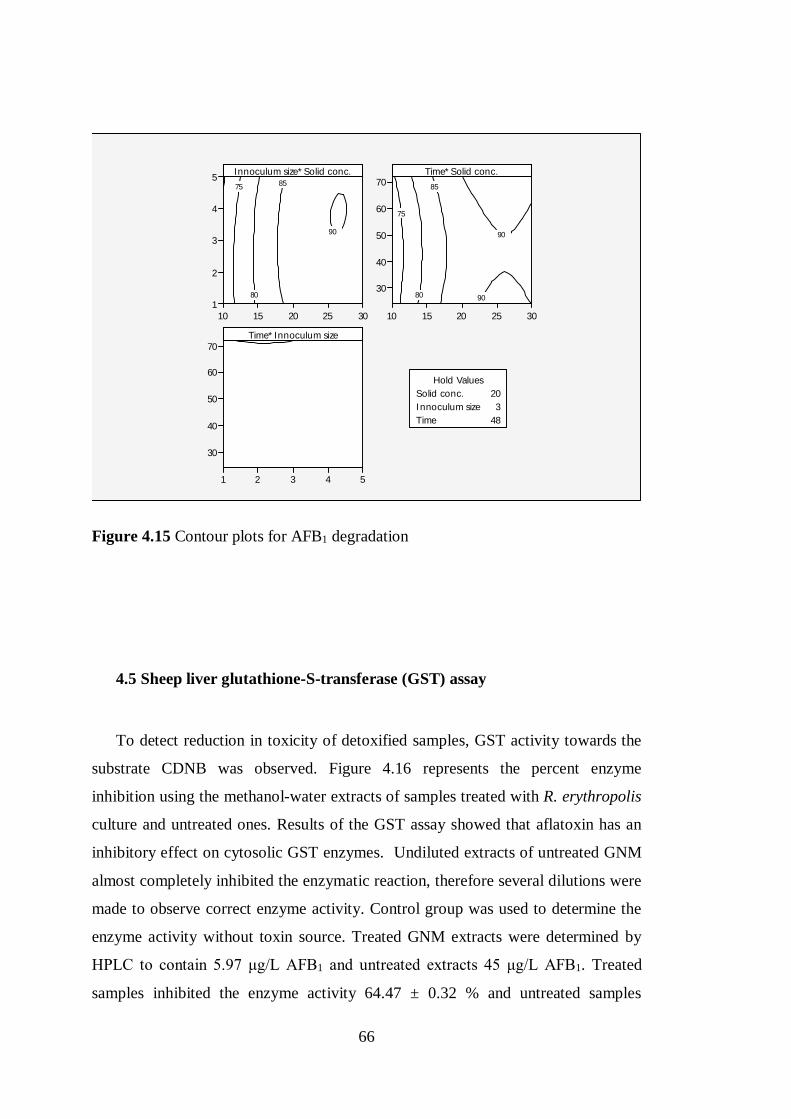


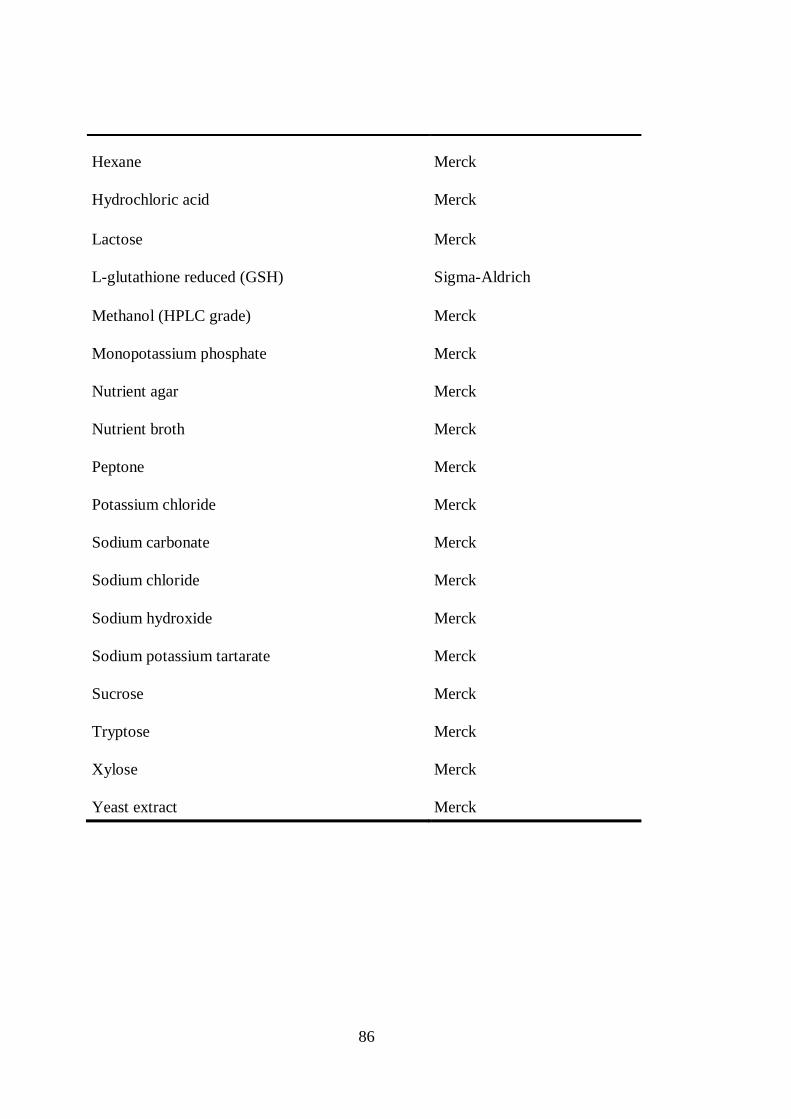


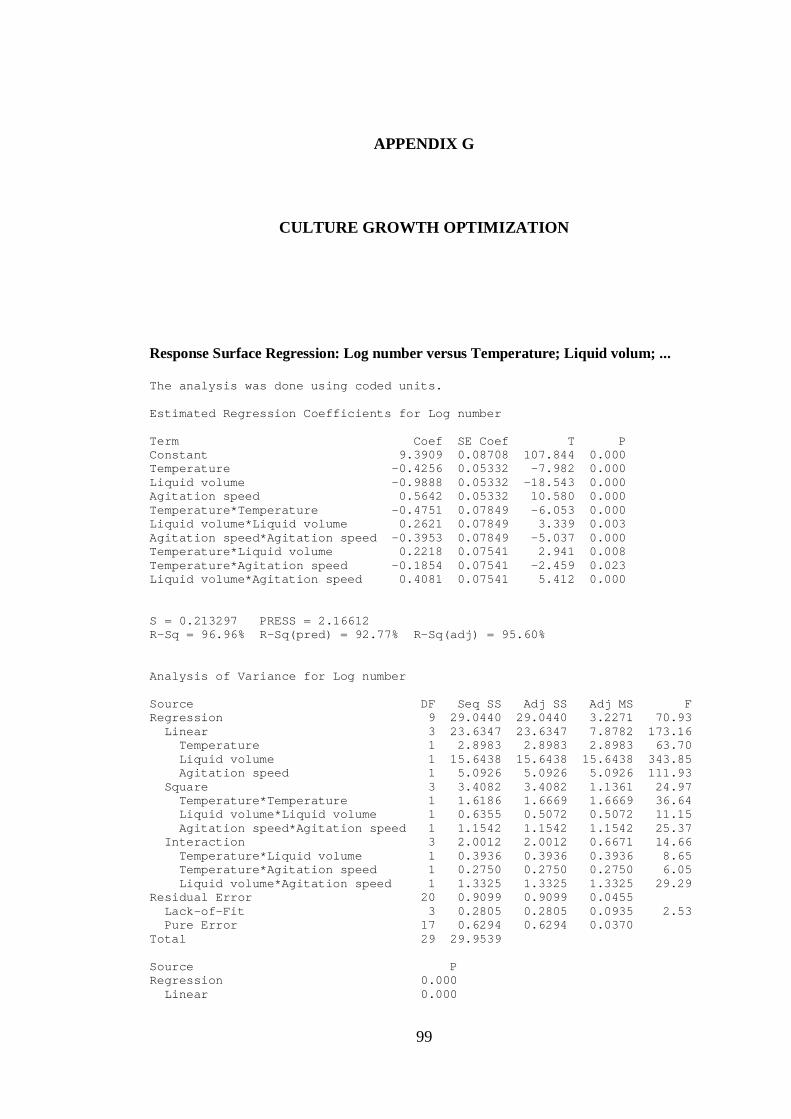

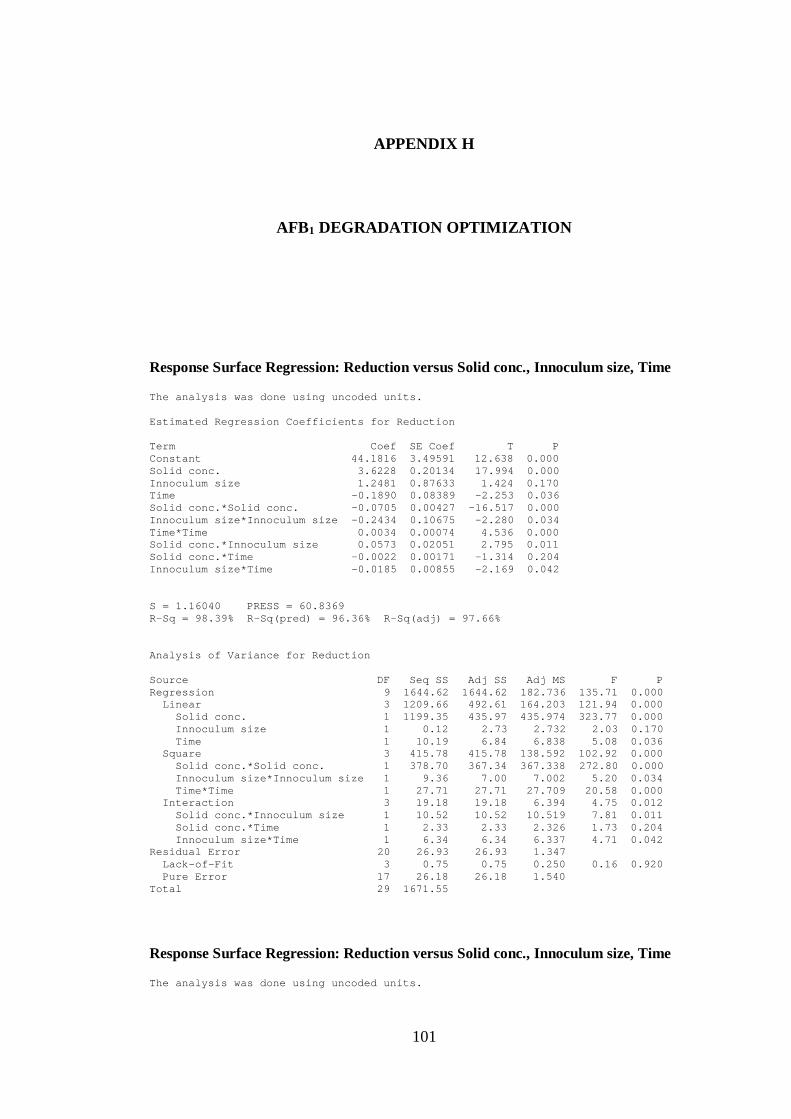
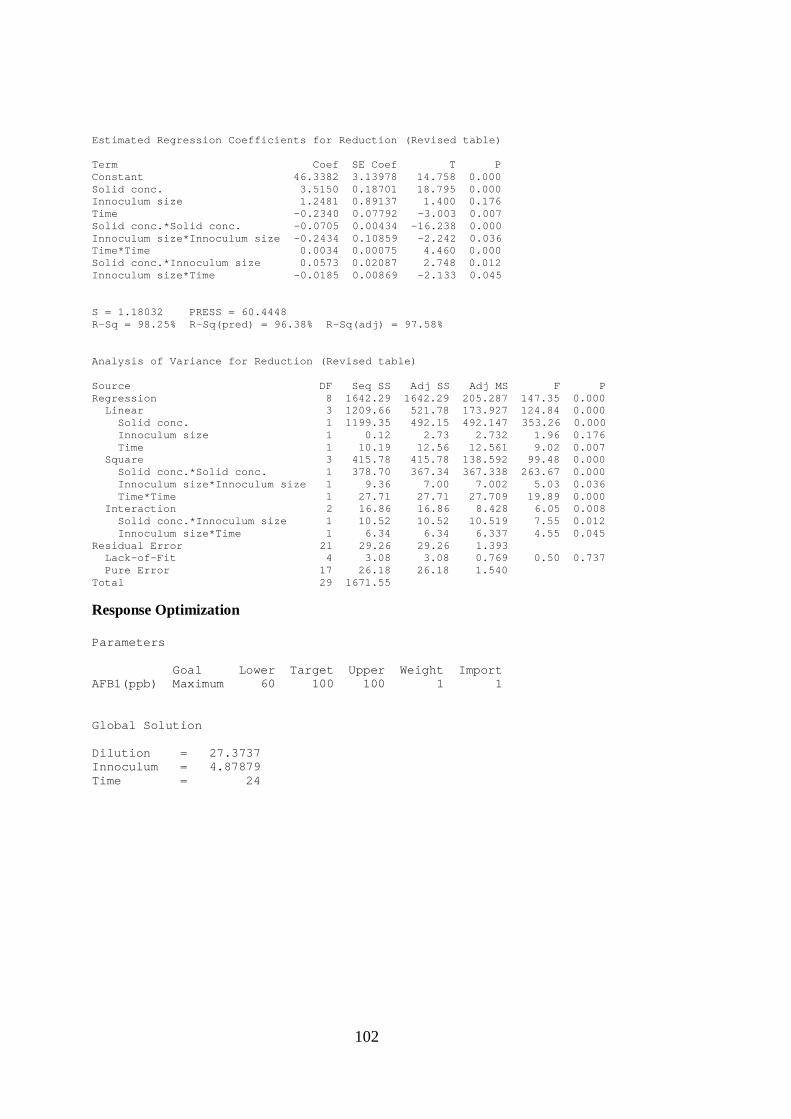
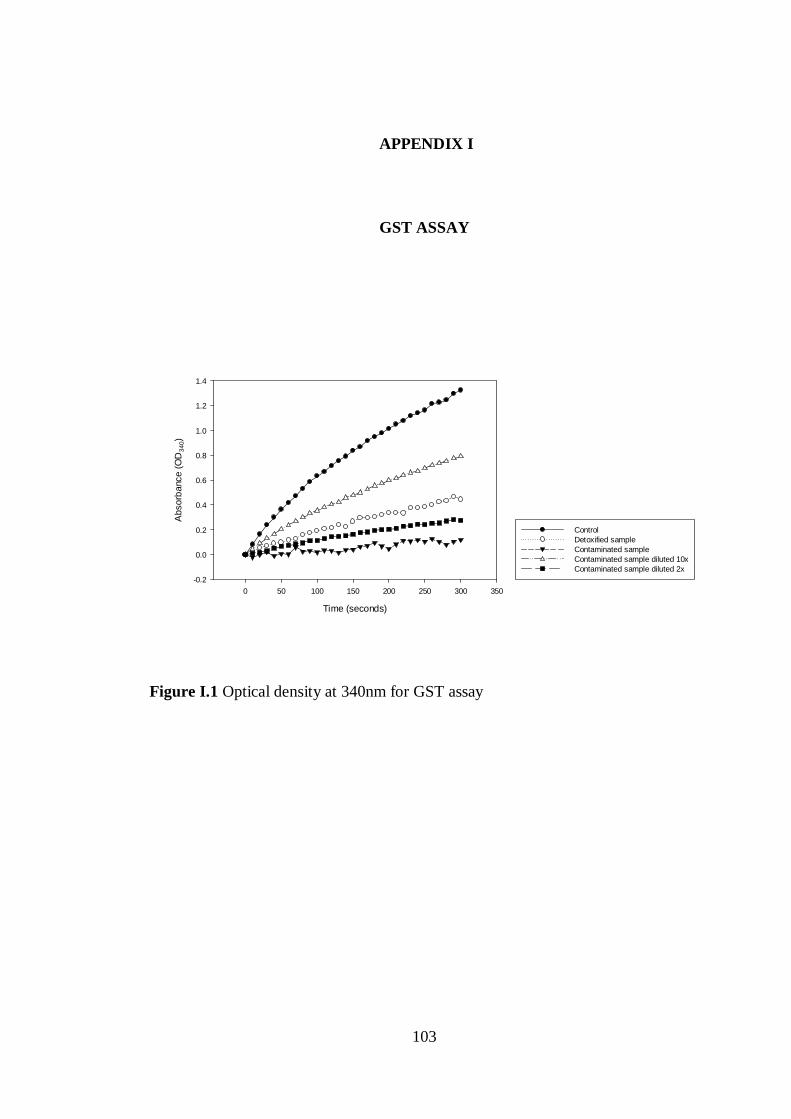


![Welcome! [s3.amazonaws.com]s3.amazonaws.com/iyi-website/other/Webinar-Certificates/... · 2018-09-10 · About IYI Mission: The Indiana Youth Institute promotes the healthy development](https://static.documents.pub/doc/80x56/5e995a3a99a1c0012f438217/welcome-s3-s3-2018-09-10-about-iyi-mission-the-indiana-youth-institute-promotes.jpg)


