21
Microfinance and intra-household management Lessons from rural South-India Isabelle Guérin Institut de recherche pour le Développement French Institute of Pondicherry March 2009
| Date post: | 31-Dec-2015 |
| Category: |
Documents |
| Upload: | laurel-paul |
| View: | 214 times |
| Download: | 0 times |

Microfinance and intra-household management
Lessons from rural South-India
Isabelle Guérin
Institut de recherche pour le Développement
French Institute of Pondicherry
March 2009
Guérin March 2009
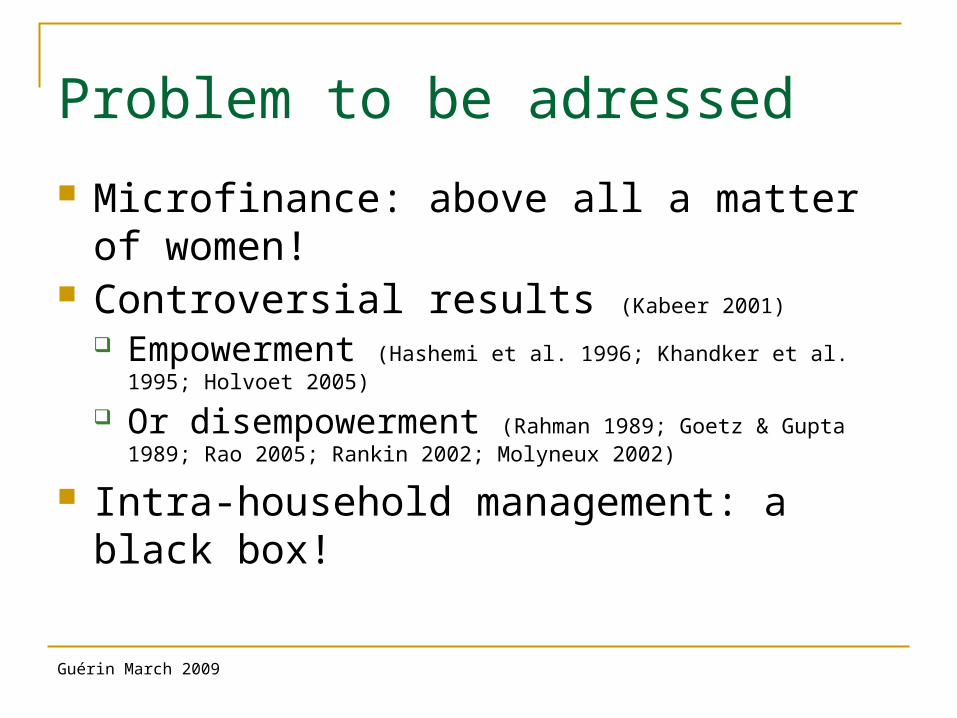
Problem to be adressed
Microfinance: above all a matter of women! Controversial results (Kabeer 2001)
Empowerment (Hashemi et al. 1996; Khandker et al. 1995; Holvoet 2005)
Or disempowerment (Rahman 1989; Goetz & Gupta 1989; Rao 2005; Rankin 2002; Molyneux 2002)
Intra-household management: a black box!

Guérin March 2009
Research Objectives
Opening the household black box Analysis of gender financial responsabilities Analysis of gender financial practices (saving,
borrowing)
→ Better understanding of microfinance effects
Guérin March 2009
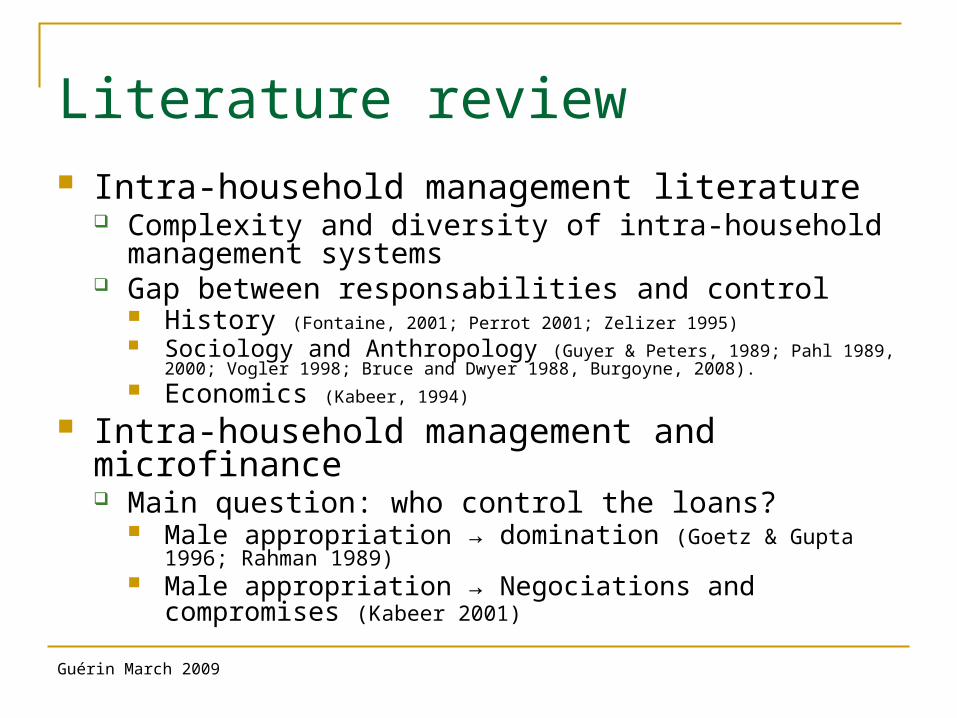
Literature review Intra-household management literature
Complexity and diversity of intra-household management systems
Gap between responsabilities and control History (Fontaine, 2001; Perrot 2001; Zelizer 1995) Sociology and Anthropology (Guyer & Peters, 1989; Pahl 1989, 2000; Vogler 1998;
Bruce and Dwyer 1988, Burgoyne, 2008). Economics (Kabeer, 1994)
Intra-household management and microfinance Main question: who control the loans?
Male appropriation → domination (Goetz & Gupta 1996; Rahman 1989)
Male appropriation → Negociations and compromises (Kabeer 2001)
Guérin March 2009
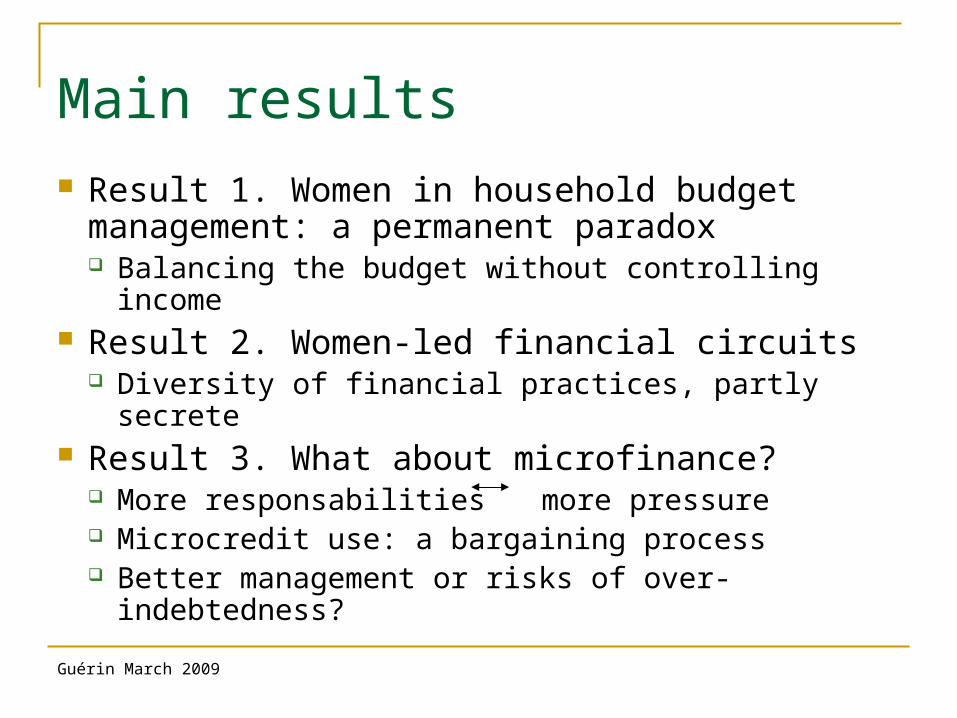
Main results
Result 1. Women in household budget management: a permanent paradox Balancing the budget without controlling income
Result 2. Women-led financial circuits Diversity of financial practices, partly secrete
Result 3. What about microfinance? More responsabilities more pressure Microcredit use: a bargaining process Better management or risks of over-
indebtedness?

Guérin March 2009
Theoretical framework
Intra-household relationships Conflicts and cooperation (Folbre 1990 ; Kabeer
1994; Sen 1990) Patriarchal bargain (Kandioty 1988) Compromise and resistance (Agarwal 1994)
→ hypothesis suggested here: financial circulation within households is at the core of this permanent process of bargaining, compromises and resistance

Guérin March 2009
Methodology
Descriptive statisticsDescriptive statistics 170 households170 households
For specific questions, For specific questions, women women and menand men have been have been interviewedinterviewed
All are microfinance clientsAll are microfinance clients
Qualitative analysisQualitative analysis Semi-structured interviewsSemi-structured interviews Group discussionGroup discussion ObservationObservation Informal discussionsInformal discussions
Guérin March 2009
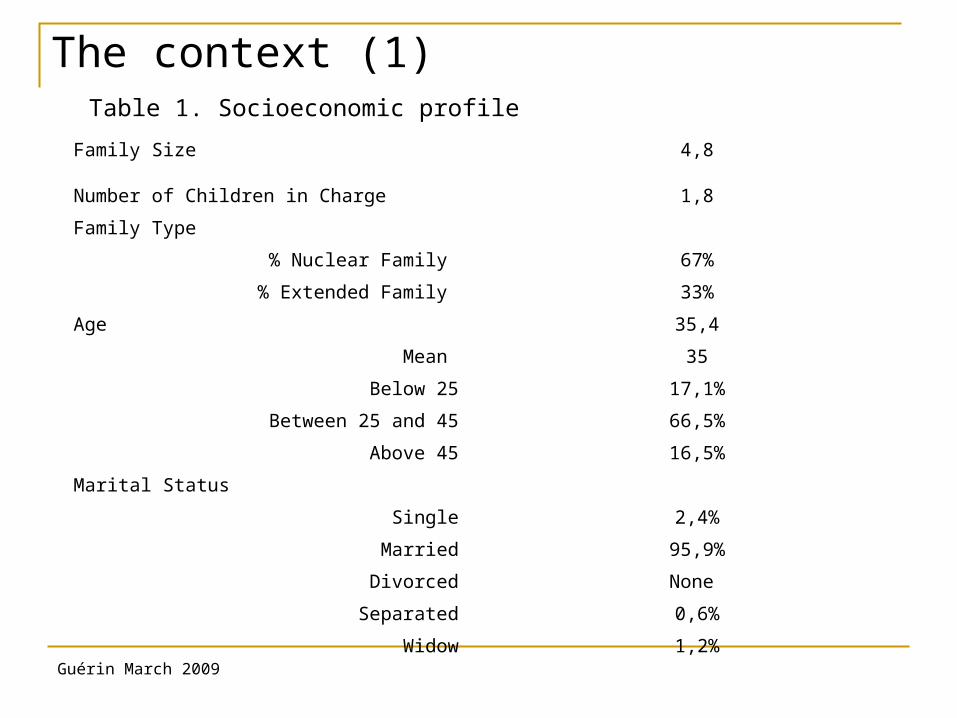
The context (1)
Family Size 4,8
Number of Children in Charge 1,8
Family Type
% Nuclear Family 67%
% Extended Family 33%
Age 35,4
Mean 35
Below 25 17,1%
Between 25 and 45 66,5%
Above 45 16,5%
Marital Status
Single 2,4%
Married 95,9%
Divorced None
Separated 0,6%
Widow 1,2%
Table 1. Socioeconomic profile
Guérin March 2009
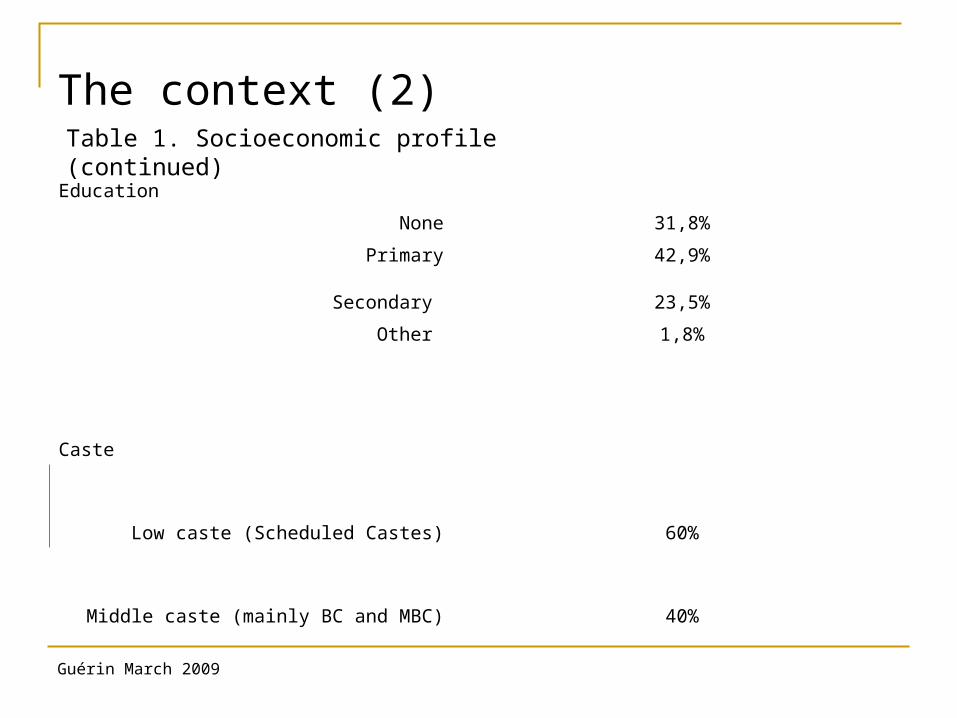
The context (2)
Education
None 31,8%
Primary 42,9%
Secondary 23,5%
Other 1,8%
Caste
Low caste (Scheduled Castes) 60%
Middle caste (mainly BC and MBC) 40%
Table 1. Socioeconomic profile (continued)
Guérin March 2009
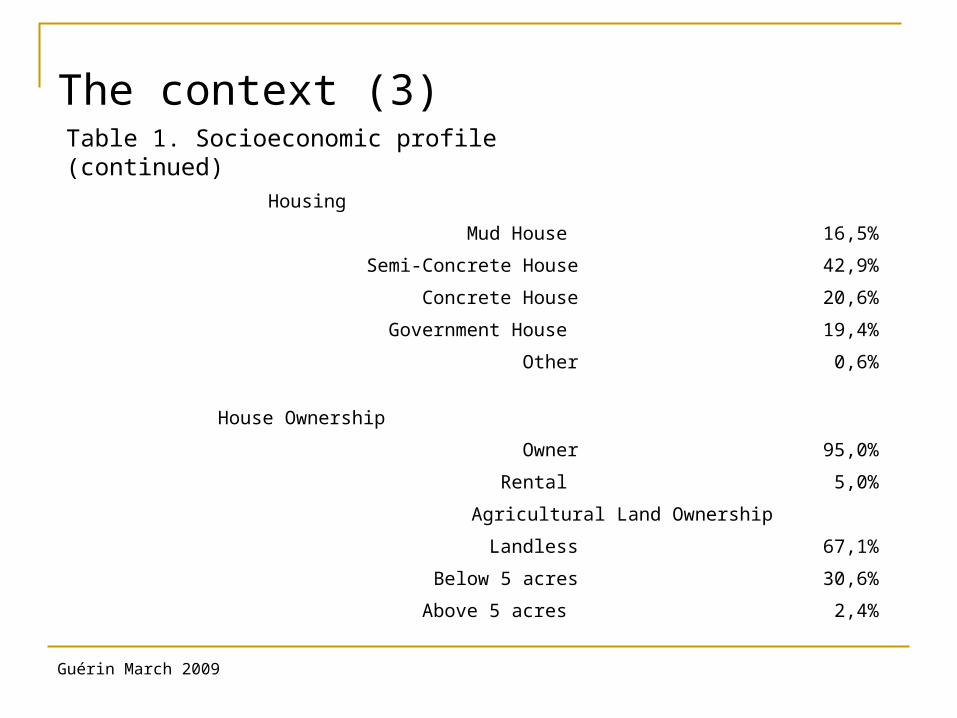
The context (3)
Housing
Mud House 16,5%
Semi-Concrete House 42,9%
Concrete House 20,6%
Government House 19,4%
Other 0,6%
House Ownership
Owner 95,0%
Rental 5,0%
Agricultural Land Ownership
Landless 67,1%
Below 5 acres 30,6%
Above 5 acres 2,4%
Table 1. Socioeconomic profile (continued)
Guérin March 2009
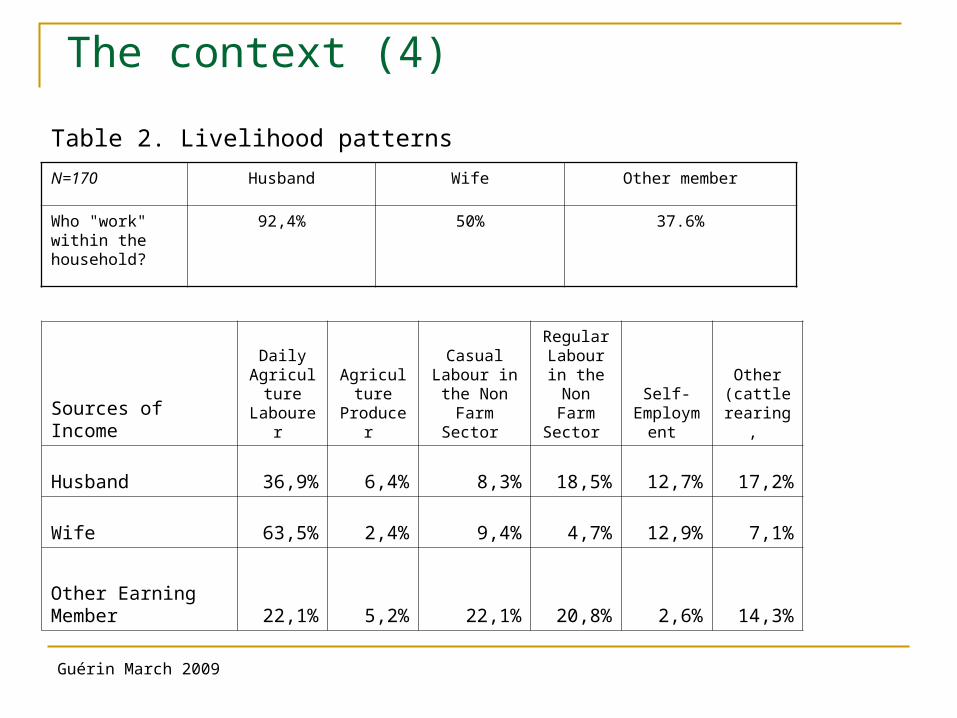
The context (4)
N=170 Husband Wife Other member
Who "work" within the household?
92,4% 50% 37.6%
Sources of Income
Daily Agricultur
e Labourer
Agriculture
Producer
Casual Labour in the Non
Farm Sector
Regular Labour in the Non
Farm Sector
Self-Employm
ent
Other (cattle
rearing,
Husband 36,9% 6,4% 8,3% 18,5% 12,7% 17,2%
Wife 63,5% 2,4% 9,4% 4,7% 12,9% 7,1%
Other Earning Member 22,1% 5,2% 22,1% 20,8% 2,6% 14,3%
Table 2. Livelihood patterns
Guérin March 2009
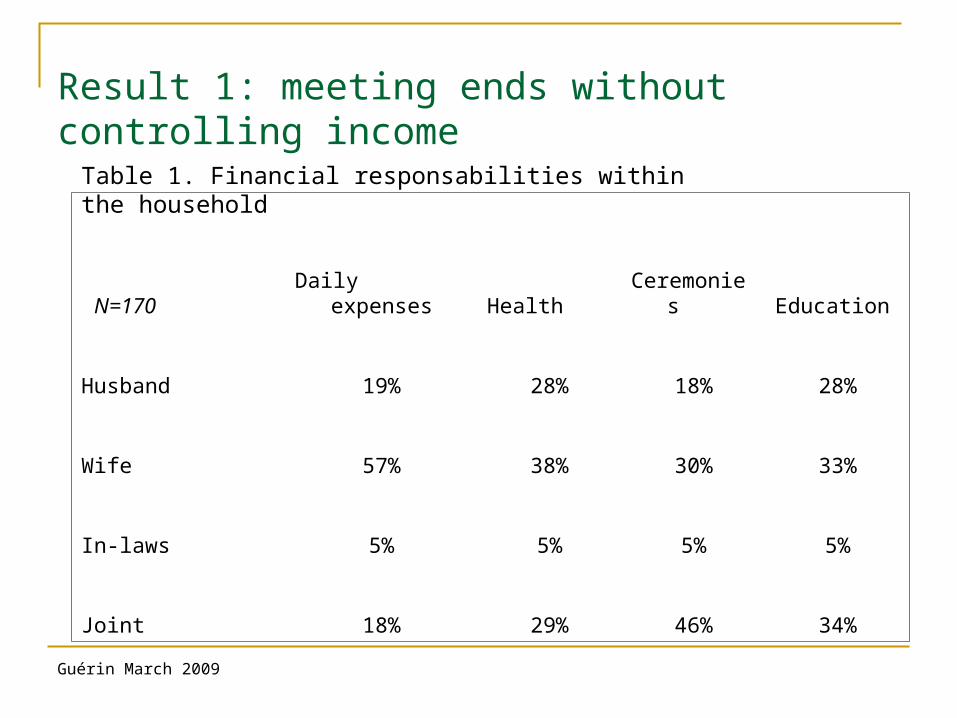
Result 1: meeting ends without controlling income
N=170 Daily expenses Health Ceremonies Education
Husband 19% 28% 18% 28%
Wife 57% 38% 30% 33%
In-laws 5% 5% 5% 5%
Joint 18% 29% 46% 34%
Table 1. Financial responsabilities within the household

Guérin March 2009
Result 1: meeting ends without controlling income → huge responsabilities in terms of saving, borrowing and repayment
N=170% resp income
% resp saving
% resp borrowing % repayment
No role 19% 2% 1% 3%
Minor role (<20%) 46% 46% 51% 62%
Moderate role (20-60%) 28% 34% 25% 18%
Major role (>60%) 6% 17% 23% 16%
Table 2. Women responsabilities in terms of income, saving borrowing and repayment
Guérin March 2009
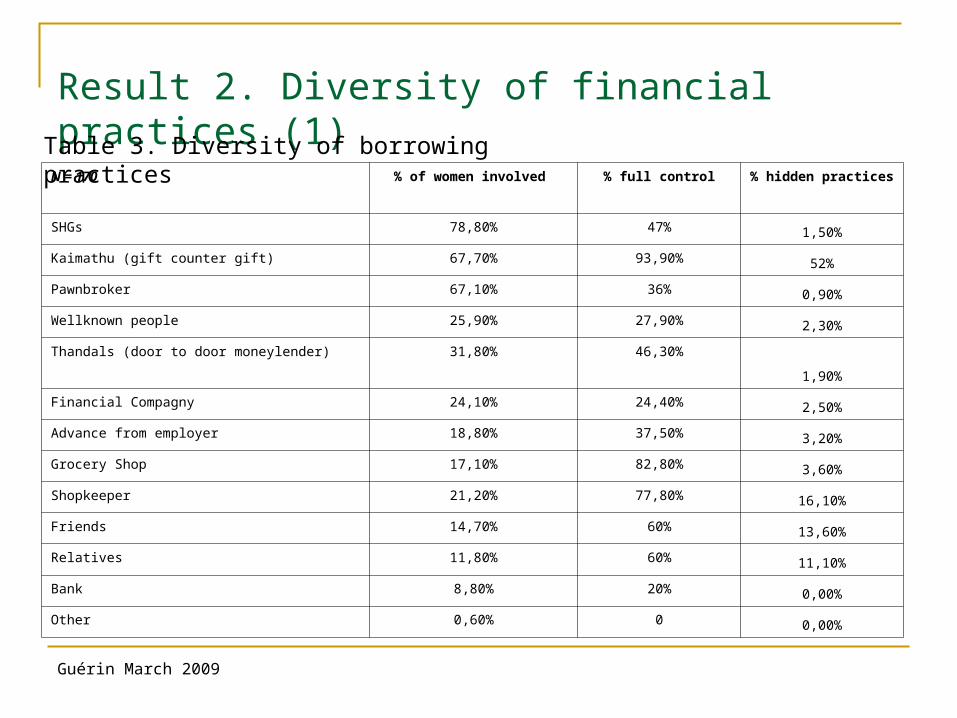
Result 2. Diversity of financial practices (1)
N = 170 % of women involved % full control % hidden practices
SHGs 78,80% 47% 1,50%
Kaimathu (gift counter gift) 67,70% 93,90% 52%
Pawnbroker 67,10% 36% 0,90%
Wellknown people 25,90% 27,90% 2,30%
Thandals (door to door moneylender) 31,80% 46,30%
1,90%
Financial Compagny 24,10% 24,40% 2,50%
Advance from employer 18,80% 37,50% 3,20%
Grocery Shop 17,10% 82,80% 3,60%
Shopkeeper 21,20% 77,80% 16,10%
Friends 14,70% 60% 13,60%
Relatives 11,80% 60% 11,10%
Bank 8,80% 20% 0,00%
Other 0,60% 0 0,00%
Table 3. Diversity of borrowing practices
Guérin March 2009
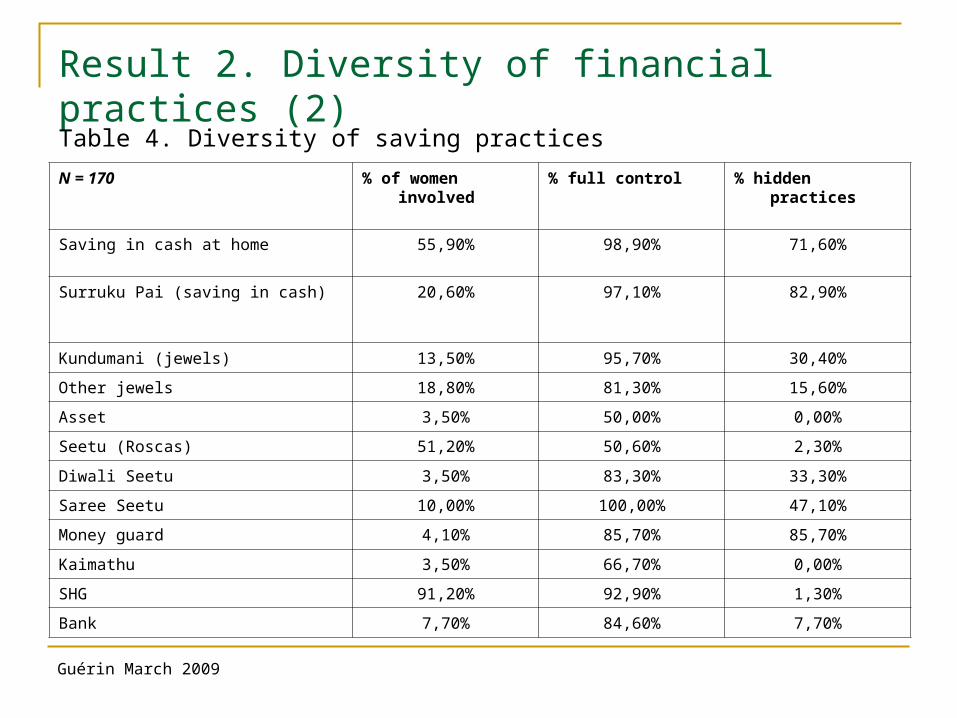
Result 2. Diversity of financial practices (2)
N = 170 % of women involved % full control % hidden practices
Saving in cash at home 55,90% 98,90% 71,60%
Surruku Pai (saving in cash) 20,60% 97,10% 82,90%
Kundumani (jewels) 13,50% 95,70% 30,40%
Other jewels 18,80% 81,30% 15,60%
Asset 3,50% 50,00% 0,00%
Seetu (Roscas) 51,20% 50,60% 2,30%
Diwali Seetu 3,50% 83,30% 33,30%
Saree Seetu 10,00% 100,00% 47,10%
Money guard 4,10% 85,70% 85,70%
Kaimathu 3,50% 66,70% 0,00%
SHG 91,20% 92,90% 1,30%
Bank 7,70% 84,60% 7,70%
Table 4. Diversity of saving practices

Guérin March 2009
Result 2. Diversity of financial practices (3)
0% 10% 20% 30% 40% 50% 60% 70%
Borrow from other women
Exchange jewels
Act as guarantor
Friend act as guarantor
Exchange SHG loans
Figure 1. Women-led financial circuits
Guérin March 2009
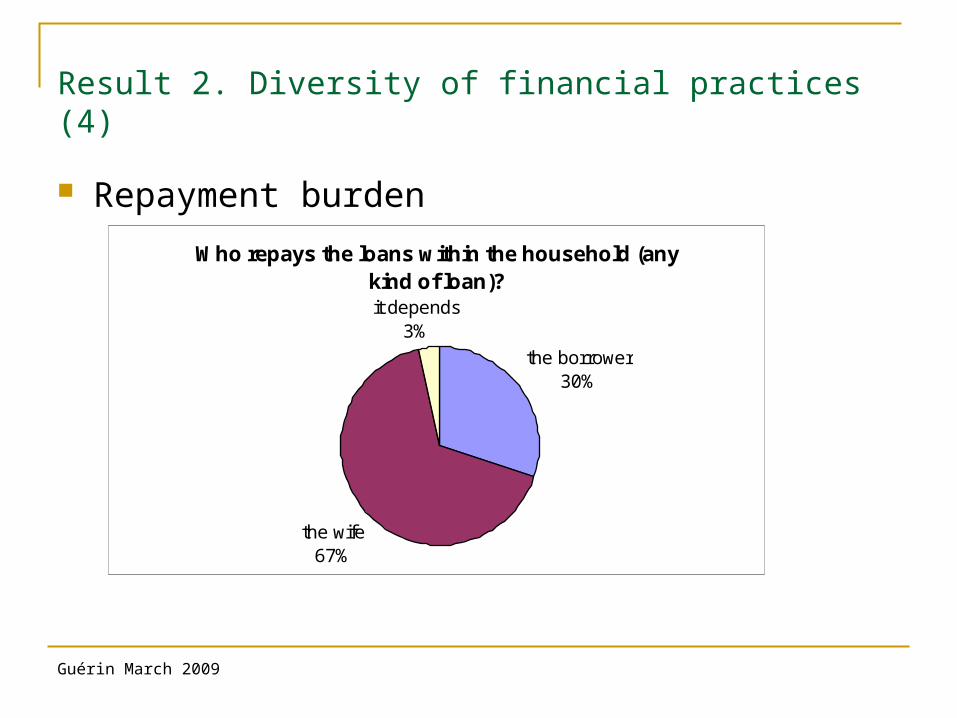
Result 2. Diversity of financial practices (4)
Repayment burden
Who repays the loans within the household (any kind of loan)?
the borrower30%
the wife 67%
it depends3%

Guérin March 2009
Result 3. Microfinance effects on financial management
More responsabilities → more pressure
More involved in financial decisions 40%
Better cashflow management 65%
Better access to the financial market 95%
Less dependant from moneylenders 25%
More pressure 45%

Guérin March 2009
Result 3. Microfinance effects on financial management (2)
N=170 Who controls microcredit?
Husband 17,1%
Wife 47,6%
In-laws 4,1%
Joint 31,2%
Microcredit control: bargaining and compromises
Guérin March 2009
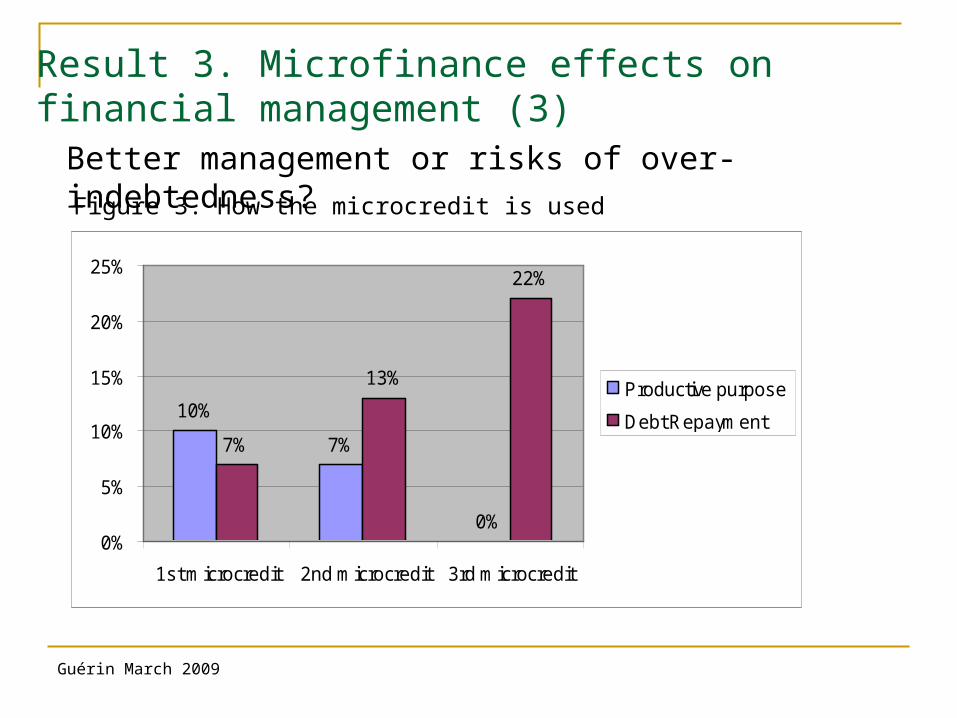
10%
7%
0%
7%
13%
22%
0%
5%
10%
15%
20%
25%
1st microcredit 2nd microcredit 3rd microcredit
Productive purpose
Debt Repayment
Figure 3. How the microcredit is used
Better management or risks of over-indebtedness?
Result 3. Microfinance effects on financial management (3)
Guérin March 2009
Future research
Diversity of women behaviors Diversity of gender practices


