33
Microsoft® SharePoint® Server 2010 Large Farm – Performance Study A Dell Technical White Paper Dell™ | SharePoint Solutions Ravikanth Chaganti and Quocdat Nguyen
Microsoft® SharePoint® Server 2010
Large Farm – Performance Study
A Dell Technical White Paper
Dell™ | SharePoint Solutions
Ravikanth Chaganti and Quocdat Nguyen
SharePoint Server 2010: Large Farm – Performance Study
Page ii
THIS WHITE PAPER IS FOR INFORMATIONAL PURPOSES ONLY, AND MAY CONTAIN TYPOGRAPHICAL
ERRORS AND TECHNICAL INACCURACIES. THE CONTENT IS PROVIDED AS IS, WITHOUT EXPRESS OR
IMPLIED WARRANTIES OF ANY KIND.
© 2011 Dell Inc. All rights reserved. Reproduction of this material in any manner whatsoever without
the express written permission of Dell Inc. is strictly forbidden. For more information, contact Dell.
Dell, the DELL logo, and the DELL badge, and PowerConnect are trademarks of Dell Inc. Big-IP is the
trademark of F5 Networks. Microsoft, Windows, Windows Server, and Active Directory are either
trademarks or registered trademarks of Microsoft Corporation in the United States and/or other
countries. Other trademarks and trade names may be used in this document to refer to either the
entities claiming the marks and names or their products. Dell Inc. disclaims any proprietary interest in
trademarks and trade names other than its own.
September 2011
SharePoint Server 2010: Large Farm – Performance Study
Page iii
Contents Executive Summary ...................................................................................................... iv
Introduction ................................................................................................................ 2
SharePoint 2010 Farm Topologies ...................................................................................... 2
Large Server Farm Topology .......................................................................................... 3
Dell PowerEdge M1000e Blade Enclosure ........................................................................ 4
Dell PowerEdge M910 ............................................................................................... 4
Dell PowerEdge M710HD ............................................................................................ 5
Dell PowerEdge M710 ............................................................................................... 5
Dell EqualLogic PS6000XV Storage Arrays ....................................................................... 5
Dual-Blade Chassis Farm Configuration ............................................................................. 6
Single-Blade Chassis Farm Configuration ........................................................................... 7
Dell EqualLogic PS6100XV Storage Arrays .......................................................................... 9
Farm Architecture and Configuration of Farm Roles ........................................................... 11
Configuration of Web Front-End and Application Servers .................................................. 13
Hardware Load Balancers ........................................................................................ 13
HTTP Request Throttling ......................................................................................... 14
Search Service Application Configuration ..................................................................... 14
Network Configuration ............................................................................................ 15
Configuration of Database servers .............................................................................. 15
SQL Server Memory Configuration .............................................................................. 16
DB Server Network Configuration ............................................................................... 16
Performance Study of a Large Farm ................................................................................. 17
Dell SharePoint Load Generation Framework .................................................................... 17
Content Population Tool .......................................................................................... 17
VSTS Load Testing Framework ................................................................................... 18
Load Testing Workload Test Mix ................................................................................... 19
Test methodology..................................................................................................... 21
Performance Results And Analysis .................................................................................... 22
Summary .................................................................................................................. 29
References ................................................................................................................ 29
SharePoint Server 2010: Large Farm – Performance Study
Page iv
Executive Summary A Microsoft ® SharePoint® Server 2010 farm hosts the core platform services and applications that
provide many different functions for its users. With its multi-tier architecture, sizing of each of the
tiers of a SharePoint farm requires a comprehensive study of the workload requirements and
performance capabilities of each hardware component. It is a Dell priority to provide accurate
guidance to customers when recommending infrastructure elements of a SharePoint implementation.
Dell’s SharePoint engineering team developed a load generation framework to perform SharePoint load
testing so that we would provide guidance on how to choose the best farm architecture to increase
performance and help keep client response times to less than one second. This performance data is
provided to our customers to help them understand the impact of SharePoint collaboration workload,
and how to size and design the best farm architecture to support these workloads.
This white paper includes such a comprehensive study and describes how a large SharePoint farm, built
using Dell PowerEdge™ blade servers and Dell EqualLogic™ PS6100XV and PS6000XV iSCSI storage arrays,
performed under load testing. The key findings from this study are:
The recommended farm architectures were able to support more than 100,000 users with 10 percent concurrency.
Both farm architectures had an average farm response time of 60ms or 0.06 seconds at the maximum supported; which was well below the one second response time target.
The EqualLogic storage backend was capable of supporting a 2TB SharePoint content database with an average disk response time of 2ms and 2600 average disk transfers per second.
Using hardware load balancing solution enabled us to scale the farm beyond 4 WFEs and achieve the maximum desired concurrent user load.
The paper details information on how the farm was configured, some of the factors considered while
designing the farm, how Dell performs SharePoint load testing, and finally provides several
performance metrics of various farm components.
A companion paper, SharePoint Server 2010: An Introduction, is available from
www.dell.com/sharepoint. It offers an overview of SharePoint Server 2010, and provides common
concepts and definitions that form a good basis for understanding the reference architectures
presented in this paper.
Another companion paper, SharePoint 2010: Designing and Implementing a Large Farm, is available
from www.dell.com/SharePoint. This companion paper provides the reference architecture and
infrastructure best practices for implementing a SharePoint 2010 large farm. These reference
architectures formed the basis of the performance study described in this paper.
SharePoint Server 2010: Large Farm – Performance Study
Page 2
Introduction Microsoft SharePoint Server 2010 builds on the capabilities that were offered in Microsoft Office
SharePoint Server 2007 to provide a rich platform for collaboration, information sharing, and document
management. SharePoint 2010 adds several new features, and introduces important architectural
changes and product improvements.
Capacity planning for a SharePoint farm deployment needs a thorough study of the existing
requirements and future growth. A SharePoint implementation can be used in several ways including
custom developed applications. This brings in the complexity factor while sizing the servers and storage
for a SharePoint implementation. There are, however, the six pillars1 that you can use to create clarity
around how SharePoint is used. This performance study paper intends to provide performance capacity
details of two SharePoint 2010 large farms configured with Dell PowerEdge blade servers and Dell
EqualLogic iSCSI storage in the context of SharePoint collaboration2.
SharePoint 2010 Farm Topologies A SharePoint server farm is a set of servers, which collectively provides the services needed by a
SharePoint deployment. Some of these services, or sets of services, comprise predefined roles and must
be configured within the solution. Other services and components are optional, but they provide
additional features and functionality that are often desirable. These optional components may include
some of the service applications such as managed metadata service, Excel services, and so on. There
are some constraints and best practices that help determine which components should be located on
each server in the farm. Also, by considering how the components are distributed, you can design the
farm to more easily accommodate later growth.
NOTE: In SharePoint Server 2010, components generally provide functionality for a given service application. As a
result, this paper may use the terms role and component interchangeably. In this context, SharePoint roles refer
to one or more components that provide a farm service, and should not be confused with Windows Server roles,
which generally include one or more Windows services to provide operating system functionality.
The size and capacity of a SharePoint 2010 implementation varies based on several factors such as
number of concurrent users, service application in the farm, the expected uptime SLA, and so on.
These factors dictate how many servers are needed in the SharePoint farm and how the overall farm
architecture looks. Based on the these factors, SharePoint 2010 farm implementations are classified in
to Small farm3, Medium4 farm and a Large farm5 deployments.
1 SharePoint capabilities - http://sharepoint.microsoft.com/en-
us/product/capabilities/Pages/default.aspx
2 SharePoint collaboration capabilities - http://sharepoint.microsoft.com/en-
us/product/capabilities/communities/Pages/default.aspx
3 SharePoint 2010 – Designing and implementing a small farm
http://www.dell.com/downloads/global/services/dell_small_sharepoint_farm.pdf
SharePoint Server 2010: Large Farm – Performance Study
Page 3
Large Server Farm Topology A typical SharePoint large server farm5 consists of three tiers:
Web front-end
Application
Database
Dedicated servers are used to host each tier to provide process isolation and to allow for future
growth. A server farm deployment model helps make sure that the solution infrastructure is scalable,
flexible, and resilient to hardware failures. To achieve these goals, a large farm implementation uses
multiple servers at all tiers of the farm deployment. In a very large SharePoint deployment, service
applications such as search service are hosted in a central farm. This performance study paper used
SharePoint 2010 large farm architecture to understand how several components of a farm perform at
incrementing user loads.
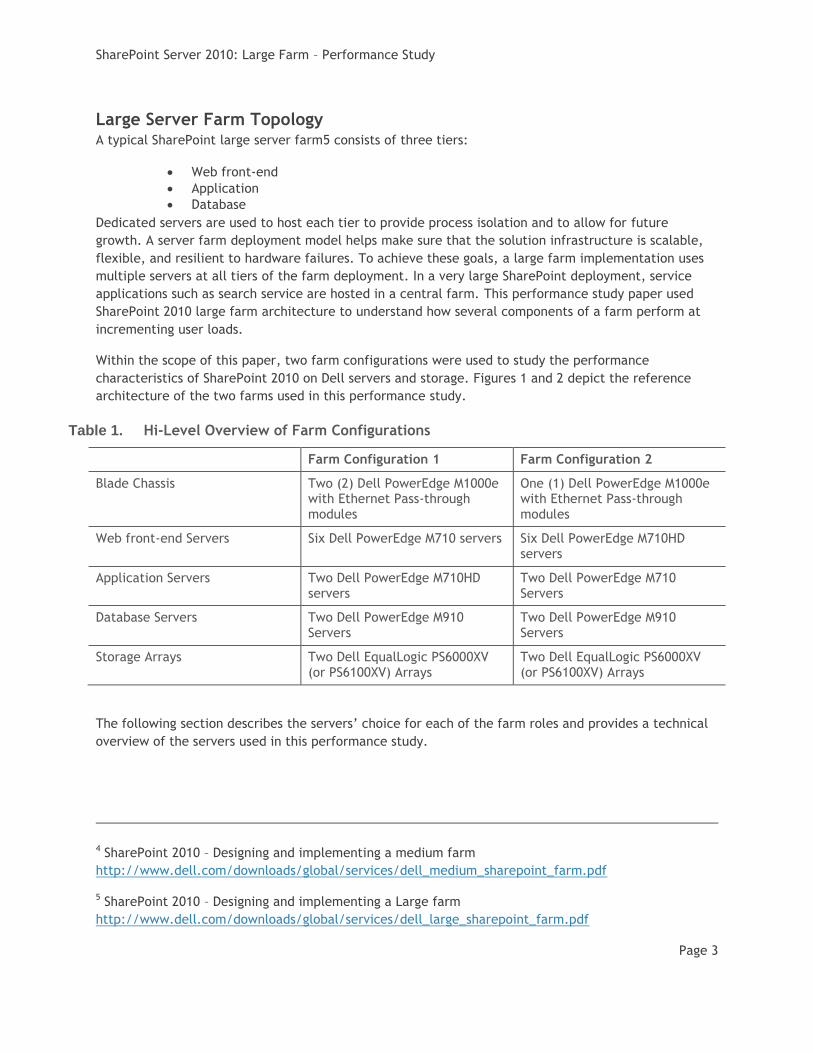
Within the scope of this paper, two farm configurations were used to study the performance
characteristics of SharePoint 2010 on Dell servers and storage. Figures 1 and 2 depict the reference
architecture of the two farms used in this performance study.
Table 1. Hi-Level Overview of Farm Configurations
Farm Configuration 1 Farm Configuration 2
Blade Chassis Two (2) Dell PowerEdge M1000e with Ethernet Pass-through modules
One (1) Dell PowerEdge M1000e with Ethernet Pass-through modules
Web front-end Servers Six Dell PowerEdge M710 servers Six Dell PowerEdge M710HD servers
Application Servers Two Dell PowerEdge M710HD servers
Two Dell PowerEdge M710 Servers
Database Servers Two Dell PowerEdge M910 Servers
Two Dell PowerEdge M910 Servers
Storage Arrays Two Dell EqualLogic PS6000XV (or PS6100XV) Arrays
Two Dell EqualLogic PS6000XV (or PS6100XV) Arrays
The following section describes the servers’ choice for each of the farm roles and provides a technical
overview of the servers used in this performance study.
4 SharePoint 2010 – Designing and implementing a medium farm
http://www.dell.com/downloads/global/services/dell_medium_sharepoint_farm.pdf
5 SharePoint 2010 – Designing and implementing a Large farm
http://www.dell.com/downloads/global/services/dell_large_sharepoint_farm.pdf
SharePoint Server 2010: Large Farm – Performance Study
Page 4
Dell PowerEdge M1000e Blade Enclosure
The PowerEdge M1000e modular blade enclosure is the foundation for Dell’s blade server architecture,
providing one of the most energy efficient, extremely reliable, flexible, and manageable blade server
platforms in the market for building any IT infrastructure. Flexible and scalable, the M1000e is
designed to support future generations of blade technologies regardless of processor/chipset
architecture. The M1000e is optimized for use with all Dell PowerEdge Blades including the M710,
M710HD and M910 blades servers. Features include:
Energy Efficiency M1000e is built on Dell’s energy smart technology, which can help you to increase capacity and to lower operating costs while delivering better performance/watt.
Effortless Scalability: With scale on-demand switch design and additional I/O slots and switch options, the M1000e provides a flexibility to meet the increasing demand for I/O consumption. Plus, Dell’s FlexIO modular switch technology offers a great scalability.
Powerful Management Tool: M1000e includes centralized management controllers, dynamic power management, and real-time reporting service for IT administrators to manage and monitor multiple enclosures and blades from a single console.
Multi Chassis Management The multi chassis management feature6 enables enterprise administrators to monitor and manage multiple blade chassis from a single console without any additional cabling or software agent requirements.
Dell PowerEdge M910
The PowerEdge M910 is a four-socket, full-height blade server with support of up to 512GB of physical
RAM (32 x 16GB DDR3 DIMMs) and the latest six, eight, and 10 core Intel Xeon processors. This server
supports maximum of 2 internal SAS disk drives and hence the maximum internal storage capacity is
1.8TB when using 2 x 900GB, 10K RPM SAS drives in a RAID 0 configuration. Similar to the PowerEdge
M710, the M910 also supports four 1 GB network ports without any additional I/O expansion cards.
Within the scope of this performance study paper, the PowerEdge M910 server was used at the
database tier of both farm configurations. The enormous processing power and physical memory
capacity makes this server the best choice for a database server.
In Farm Configuration 1, two LOMs were used in a network team to connect the database server to the
farm network. Two additional mezzanine network adapters along with two more LOMs were used to
connect the database server to the iSCSI storage network. These 4 network connections were a part of
MPIO configuration for load balancing the storage access.
In Farm Configuration 1, two LOMs were used in a network team to connect the database server to the
farm network. Only two additional mezzanine network adapters in MPIO were used to connect the DB
server to iSCSI storage network.
6 Available from CMC firmware version 3.1 or later http://en.community.dell.com/dell-
blogs/enterprise/b/tech-center/archive/2011/02/23/featured-video-of-the-week-m1000e-multi-
chassis-management-cmc-firmware-3-1.aspx
SharePoint Server 2010: Large Farm – Performance Study
Page 5
Dell PowerEdge M710HD
The PowerEdge M710HD is a two-socket, half-height blade server with support of up to 192GB of
physical RAM (32 x 16GB DDR3 DIMMs) and the latest quad and six core Intel Xeon processors. This
server supports maximum of 2 internal SAS disk drives and hence the maximum internal storage
capacity is 1.2TB when using 2 x 600GB, 10K RPM SAS drives in a RAID 0 configuration. This server
provides four 1 GB network ports without any additional I/O expansion cards.
Within the scope of this performance study, M710HD has been used at the app tier of Farm
Configuration 1 (figure 1) and front-end tier of configuration 2 (figure 2).
One load balancing network team was used to connect the web front-end and app servers to the farm
network in both farm configurations used in this performance study.
Dell PowerEdge M710
The PowerEdge M7107 is a two-socket, full-height blade server with support for up to 288GB of physical
RAM and the latest quad-core and six-core Intel Xeon processors. The M710 supports a maximum
internal disk storage capacity of 3.6TB when using 4 x 900GB, and 10K RPM SAS drives in a RAID 0
configuration. The PowerEdge M710 has more PCIe expansion slots. This server supports up to four 1 GB
network connections without using any additional expansion cards.
Within the scope of this performance study paper, the PowerEdge M710 server which can support up to
4 hard drive bays was used at the web front-end tier of Farm Configuration 1 (Figure 1) and app tier of
Farm Configuration 2 (Figure 2). These additional HDDs were used to contain the SharePoint farm’s
index queries.
A load balancing network team was used to connect the web front-end and app servers to the farm
network in both farm configurations used in this performance study.
Dell EqualLogic PS6000XV Storage Arrays
The Dell EqualLogic PS6000XV is a virtualized iSCSI SAN that combines intelligence and automation with
fault tolerance to provide simplified administration, enterprise performance and reliability, and
seamless scalability.
A PS Series Array provides the following features:
No-single-point-of-failure hardware:
o Redundant, hot-swappable hardware components—disks, control modules, fans, and power supplies.
o Component failover and disk sparing occur automatically without user intervention or disrupting data availability.
o RAID technology is used to provide data protection in each array.
High-performance control modules: The PS6000 control module has four 1 Gigabit Ethernet interfaces and support standard Gigabit Ethernet networks.
The following sections provide more detailed look at the farm configurations (Figure 1 and 2) used in
the performance study and described some best practices and recommendations used while configuring
the farms.
SharePoint Server 2010: Large Farm – Performance Study
Page 6
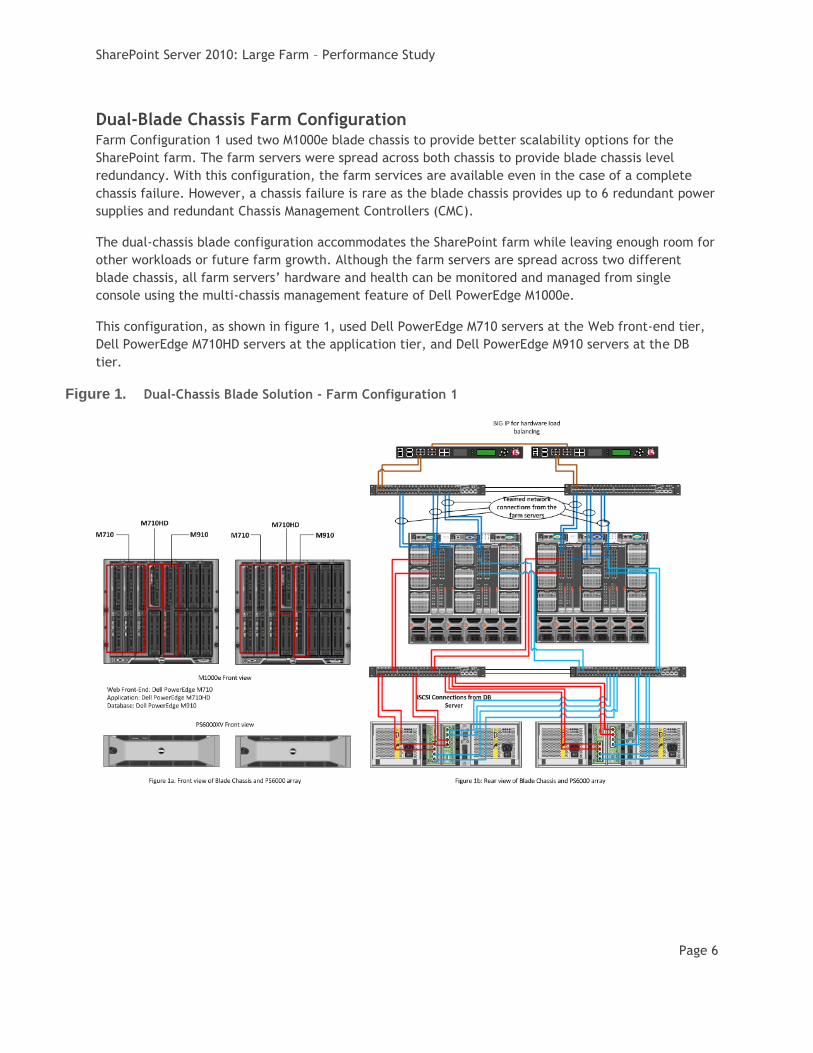
Dual-Blade Chassis Farm Configuration Farm Configuration 1 used two M1000e blade chassis to provide better scalability options for the
SharePoint farm. The farm servers were spread across both chassis to provide blade chassis level
redundancy. With this configuration, the farm services are available even in the case of a complete
chassis failure. However, a chassis failure is rare as the blade chassis provides up to 6 redundant power
supplies and redundant Chassis Management Controllers (CMC).
The dual-chassis blade configuration accommodates the SharePoint farm while leaving enough room for
other workloads or future farm growth. Although the farm servers are spread across two different
blade chassis, all farm servers’ hardware and health can be monitored and managed from single
console using the multi-chassis management feature of Dell PowerEdge M1000e.
This configuration, as shown in figure 1, used Dell PowerEdge M710 servers at the Web front-end tier,
Dell PowerEdge M710HD servers at the application tier, and Dell PowerEdge M910 servers at the DB
tier.
Figure 1. Dual-Chassis Blade Solution - Farm Configuration 1
SharePoint Server 2010: Large Farm – Performance Study
Page 7
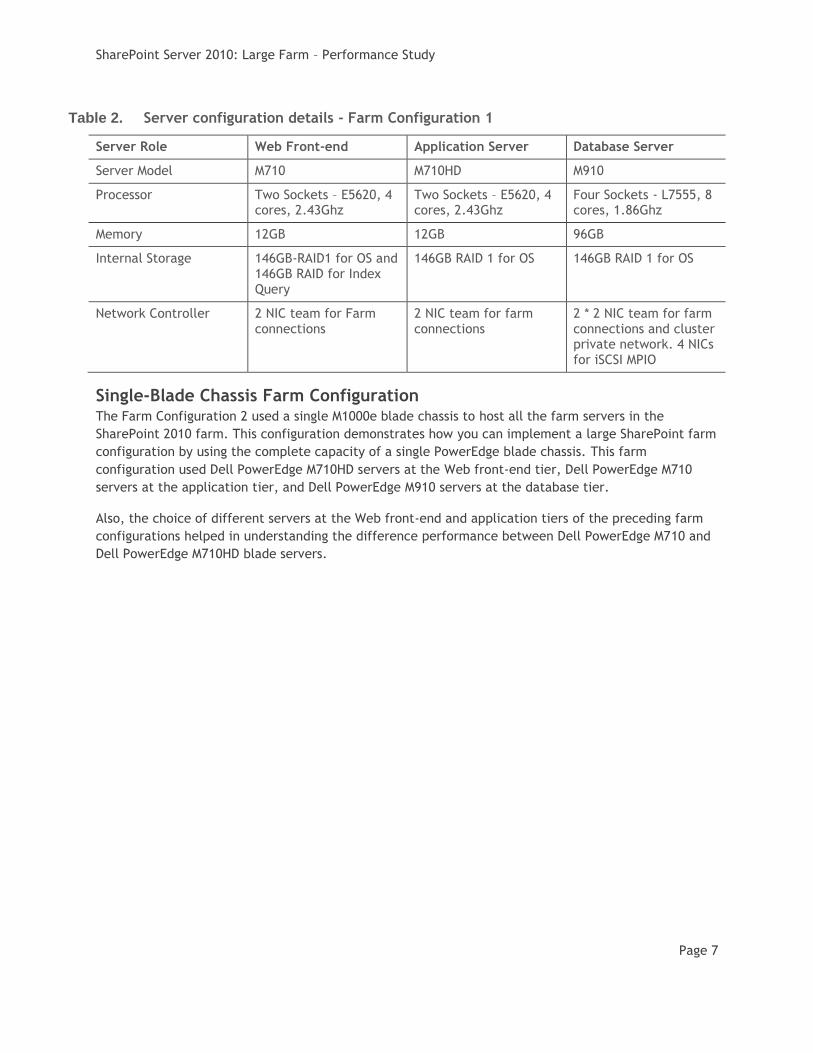
Table 2. Server configuration details - Farm Configuration 1
Server Role Web Front-end Application Server Database Server
Server Model M710 M710HD M910
Processor Two Sockets – E5620, 4 cores, 2.43Ghz
Two Sockets – E5620, 4 cores, 2.43Ghz
Four Sockets - L7555, 8 cores, 1.86Ghz
Memory 12GB 12GB 96GB
Internal Storage 146GB-RAID1 for OS and 146GB RAID for Index Query
146GB RAID 1 for OS 146GB RAID 1 for OS
Network Controller 2 NIC team for Farm connections
2 NIC team for farm connections
2 * 2 NIC team for farm connections and cluster private network. 4 NICs for iSCSI MPIO
Single-Blade Chassis Farm Configuration The Farm Configuration 2 used a single M1000e blade chassis to host all the farm servers in the
SharePoint 2010 farm. This configuration demonstrates how you can implement a large SharePoint farm
configuration by using the complete capacity of a single PowerEdge blade chassis. This farm
configuration used Dell PowerEdge M710HD servers at the Web front-end tier, Dell PowerEdge M710
servers at the application tier, and Dell PowerEdge M910 servers at the database tier.
Also, the choice of different servers at the Web front-end and application tiers of the preceding farm
configurations helped in understanding the difference performance between Dell PowerEdge M710 and
Dell PowerEdge M710HD blade servers.
SharePoint Server 2010: Large Farm – Performance Study
Page 8
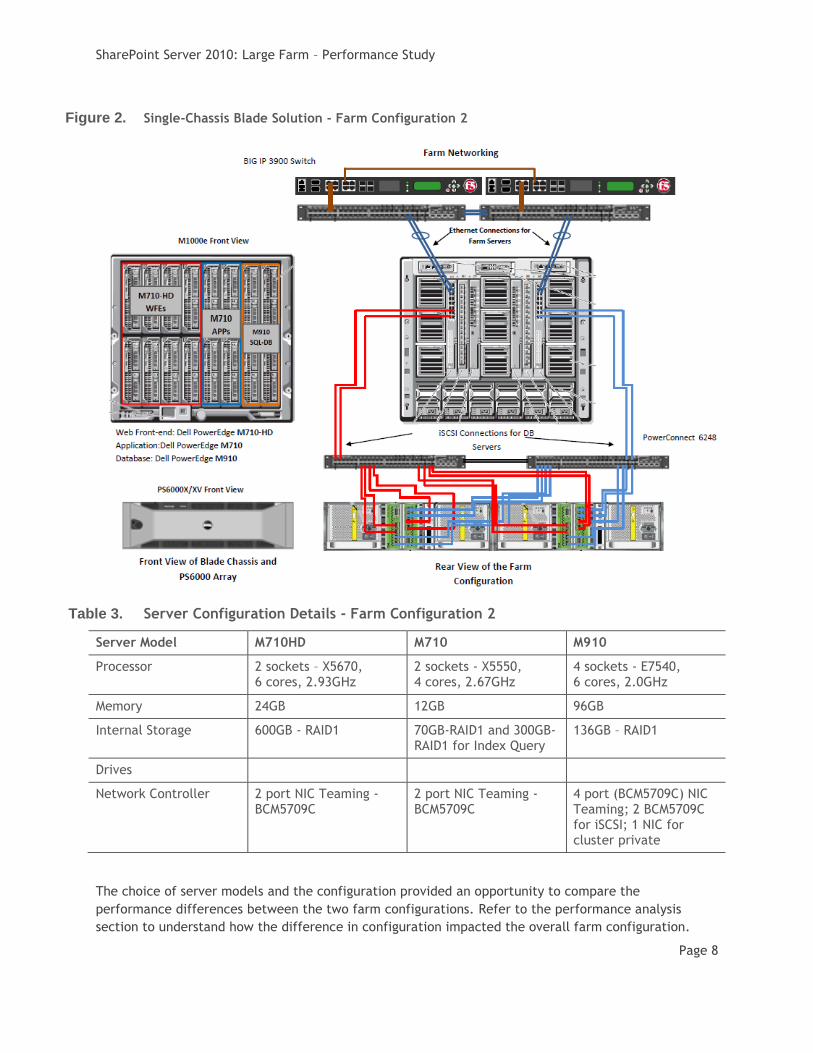
Figure 2. Single-Chassis Blade Solution - Farm Configuration 2
Table 3. Server Configuration Details - Farm Configuration 2
Server Model M710HD M710 M910
Processor 2 sockets – X5670, 6 cores, 2.93GHz
2 sockets - X5550, 4 cores, 2.67GHz
4 sockets - E7540, 6 cores, 2.0GHz
Memory 24GB 12GB 96GB
Internal Storage 600GB - RAID1 70GB-RAID1 and 300GB-RAID1 for Index Query
136GB – RAID1
Drives
Network Controller 2 port NIC Teaming - BCM5709C
2 port NIC Teaming - BCM5709C
4 port (BCM5709C) NIC Teaming; 2 BCM5709C for iSCSI; 1 NIC for cluster private
The choice of server models and the configuration provided an opportunity to compare the
performance differences between the two farm configurations. Refer to the performance analysis
section to understand how the difference in configuration impacted the overall farm configuration.
SharePoint Server 2010: Large Farm – Performance Study
Page 9
In the above farm configurations (Figure 1 and 2), you can replace the EqualLogic PS6000XV arrays with
the more recent EqualLogic PS6100XV arrays while still achieving the same or better level of
performance than the EqualLogic PS6000 arrays. The following section looks at what is new with the
Dell EqualLogic PS6100 arrays and shows modified farm configuration diagrams for Farm 1 and Farm 2
using PS6100XV arrays as the storage backend.
Dell EqualLogic PS6100XV Storage Arrays The Dell EqualLogic PS6100 series is the new addition to the EqualLogic family of virtualized iSCSI SAN
arrays. The new PS6100 arrays build upon the existing capabilities of EqualLogic arrays and some of the
new features include:
Support for 2U enclosure with 2.5” SAS drives and 4U enclosure with 3.5’’ SAS drives.
Support for 2U storage enclosures with up to twenty-four 2.5’’ SAS drives and total
capacity of 7.2TB when using 300GB 15K SAS drives.
Support for 4U storage enclosures with up to twenty-four 3.5’’ SAS drives and total
capacity of 14.4TB when using 600GB 15K SAS drives.
Dual controllers with a total of 8 GB backup cache data to flash memory for data
protection.
High-performance control modules: The PS6100 control module has four 1 Gigabit Ethernet interfaces and support standard Gigabit Ethernet networks. In addition each controller has one 10/100Mb dedicated management port.
New Vertical Port Failover feature is designed to allow user to maintain full bandwidth if a networking port fails. In other scenario the new controller design reduces the overall network connections required for supporting redundant and load balanced network paths required per storage array hence reducing the overall cabling requirements.
These new arrays can co-exist with any of the earlier generation EqualLogic arrays in the same storage
pool. The following diagrams provide reference architectures for using PS6100 series arrays in place of
PS6000 series as shown in figure 1 and 2. These new arrays are capable of delivering similar or better
performance when compared to the previous generation of EqualLogic arrays.

SharePoint Server 2010: Large Farm – Performance Study
Page 10
Figure 3. Farm Configuration 1 With PS6100XV Arrays
SharePoint Server 2010: Large Farm – Performance Study
Page 11
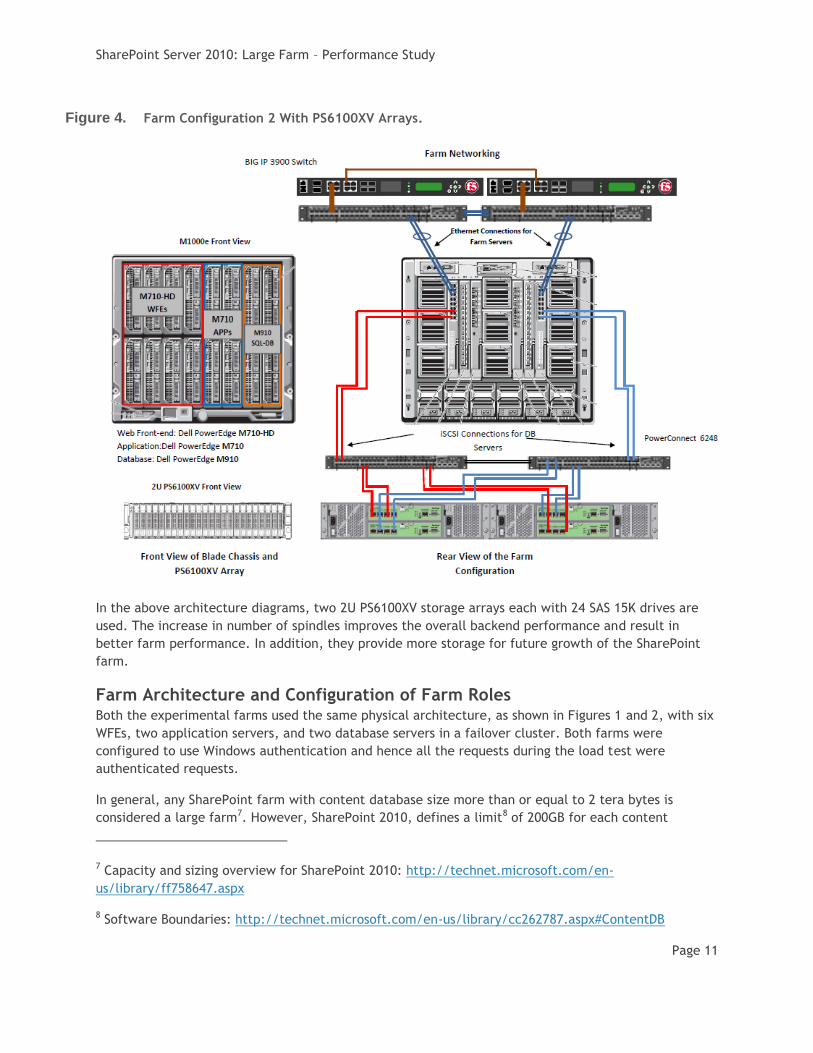
Figure 4. Farm Configuration 2 With PS6100XV Arrays.
In the above architecture diagrams, two 2U PS6100XV storage arrays each with 24 SAS 15K drives are
used. The increase in number of spindles improves the overall backend performance and result in
better farm performance. In addition, they provide more storage for future growth of the SharePoint
farm.
Farm Architecture and Configuration of Farm Roles Both the experimental farms used the same physical architecture, as shown in Figures 1 and 2, with six
WFEs, two application servers, and two database servers in a failover cluster. Both farms were
configured to use Windows authentication and hence all the requests during the load test were
authenticated requests.
In general, any SharePoint farm with content database size more than or equal to 2 tera bytes is
considered a large farm7. However, SharePoint 2010, defines a limit8 of 200GB for each content
7 Capacity and sizing overview for SharePoint 2010: http://technet.microsoft.com/en-
us/library/ff758647.aspx
8 Software Boundaries: http://technet.microsoft.com/en-us/library/cc262787.aspx#ContentDB
SharePoint Server 2010: Large Farm – Performance Study
Page 12
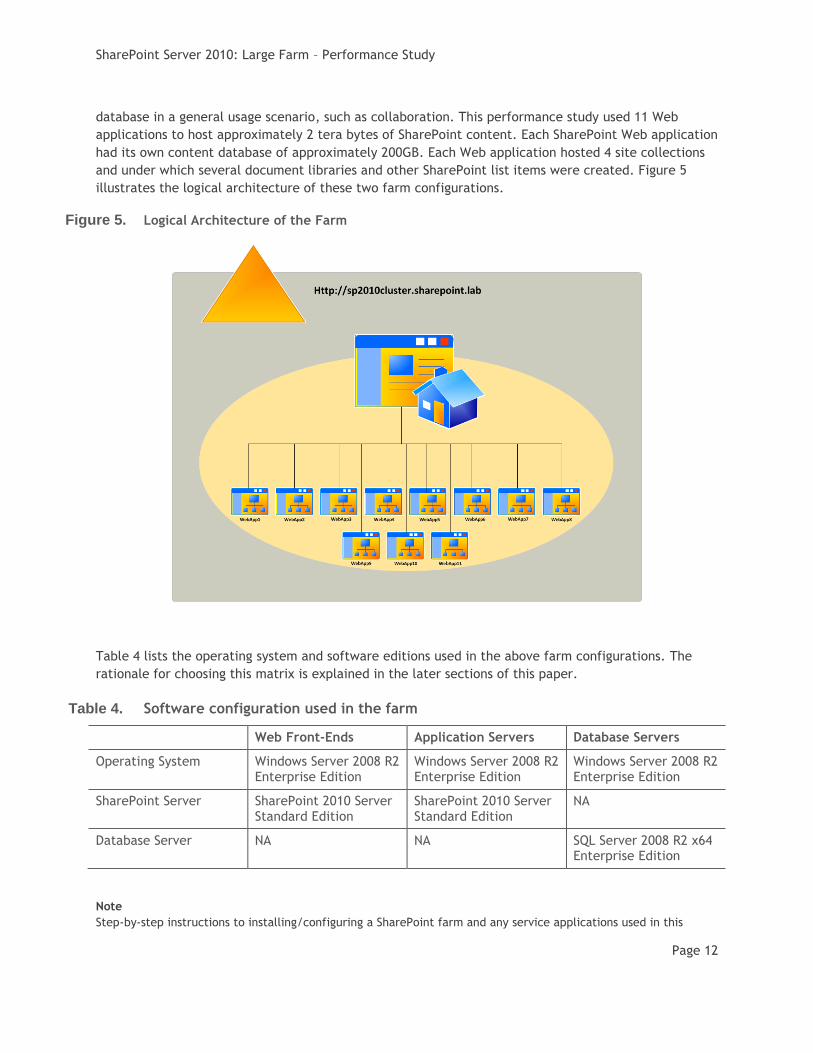
database in a general usage scenario, such as collaboration. This performance study used 11 Web
applications to host approximately 2 tera bytes of SharePoint content. Each SharePoint Web application
had its own content database of approximately 200GB. Each Web application hosted 4 site collections
and under which several document libraries and other SharePoint list items were created. Figure 5
illustrates the logical architecture of these two farm configurations.
Figure 5. Logical Architecture of the Farm
Table 4 lists the operating system and software editions used in the above farm configurations. The
rationale for choosing this matrix is explained in the later sections of this paper.
Table 4. Software configuration used in the farm
Web Front-Ends Application Servers Database Servers
Operating System Windows Server 2008 R2 Enterprise Edition
Windows Server 2008 R2 Enterprise Edition
Windows Server 2008 R2 Enterprise Edition
SharePoint Server SharePoint 2010 Server Standard Edition
SharePoint 2010 Server Standard Edition
NA
Database Server NA NA SQL Server 2008 R2 x64 Enterprise Edition
Note
Step-by-step instructions to installing/configuring a SharePoint farm and any service applications used in this
SharePoint Server 2010: Large Farm – Performance Study
Page 13
performance study are outside the scope of this performance study paper. For more information and resources,
refer to the References section at the end of this paper.
Configuration of Web Front-End and Application Servers
SharePoint 2010 farm design included six Web front-end servers. The software matrix for these Web
front-end servers is as shown in Table 4. SharePoint 2010 Standard Edition was used as the
performance study included only out-of-the-box features of SharePoint and was a collaboration
workload only. As a part of the collaboration workload, only search service application was deployed
and no other service applications such as Excel services, Visio Services were deployed.
On Dell PowerEdge M710 and M710HD, simultaneous multi-threading or logical processor support was
enabled for increased performance. This option is disabled by default in the system BIOS and must be
enabled manually.
Hardware Load Balancers
Within the scope of this paper, both farm configurations used F5 Networks® BIG-IP® Local Traffic
Manager™ (LTM) hardware load balancers to enable load balancing across Web front-end nodes. The
native software network load balancing (NLB) clusters become unstable when there are more than 4 or
5 Web front-ends. Hence, two F5 BIG-IP hardware load balancing switches were used for Web front-end
load balancing.
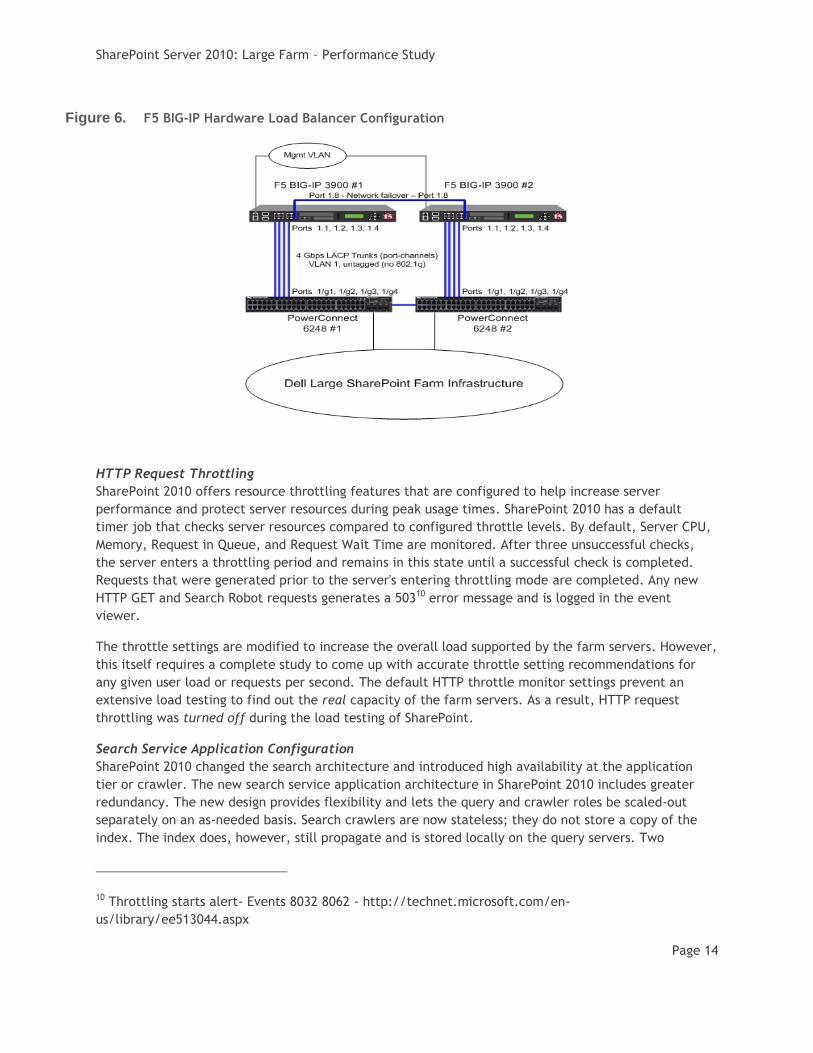
As a part of both farm architectures, two F5 BIG-IP 3900 series switches were used. These load
balancer systems feature high-performance SSL acceleration hardware and software compression9 as
well as advanced connection management to remove processing intensive tasks from application
servers. A BIG-IP 3900 switch system features a Quad core CPU, 8GB of memory, and supports up to
4Gbps of traffic throughput. Using hardware load balancers instead of software NLB enabled both farm
configurations to go beyond four web front-ends and achieve higher concurrent user load without
compromising the farm performance.
As a part of this study, no custom load balancer profiles were defined. Both farms used the out-of-box
acceleration functionality and BIG-IP Application Templates, thereby simplifying the administrative
tasks and shortening the required set up time. The following figure shows how the load balancers were
connected to the SharePoint farm infrastructure.
9 Hardware datasheet: http://www.f5.com/pdf/products/big-ip-platforms-ds.pdf
SharePoint Server 2010: Large Farm – Performance Study
Page 14
Figure 6. F5 BIG-IP Hardware Load Balancer Configuration
HTTP Request Throttling
SharePoint 2010 offers resource throttling features that are configured to help increase server
performance and protect server resources during peak usage times. SharePoint 2010 has a default
timer job that checks server resources compared to configured throttle levels. By default, Server CPU,
Memory, Request in Queue, and Request Wait Time are monitored. After three unsuccessful checks,
the server enters a throttling period and remains in this state until a successful check is completed.
Requests that were generated prior to the server's entering throttling mode are completed. Any new
HTTP GET and Search Robot requests generates a 50310 error message and is logged in the event
viewer.
The throttle settings are modified to increase the overall load supported by the farm servers. However,
this itself requires a complete study to come up with accurate throttle setting recommendations for
any given user load or requests per second. The default HTTP throttle monitor settings prevent an
extensive load testing to find out the real capacity of the farm servers. As a result, HTTP request
throttling was turned off during the load testing of SharePoint.
Search Service Application Configuration
SharePoint 2010 changed the search architecture and introduced high availability at the application
tier or crawler. The new search service application architecture in SharePoint 2010 includes greater
redundancy. The new design provides flexibility and lets the query and crawler roles be scaled-out
separately on an as-needed basis. Search crawlers are now stateless; they do not store a copy of the
index. The index does, however, still propagate and is stored locally on the query servers. Two
10 Throttling starts alert- Events 8032 8062 - http://technet.microsoft.com/en-
us/library/ee513044.aspx
SharePoint Server 2010: Large Farm – Performance Study
Page 15
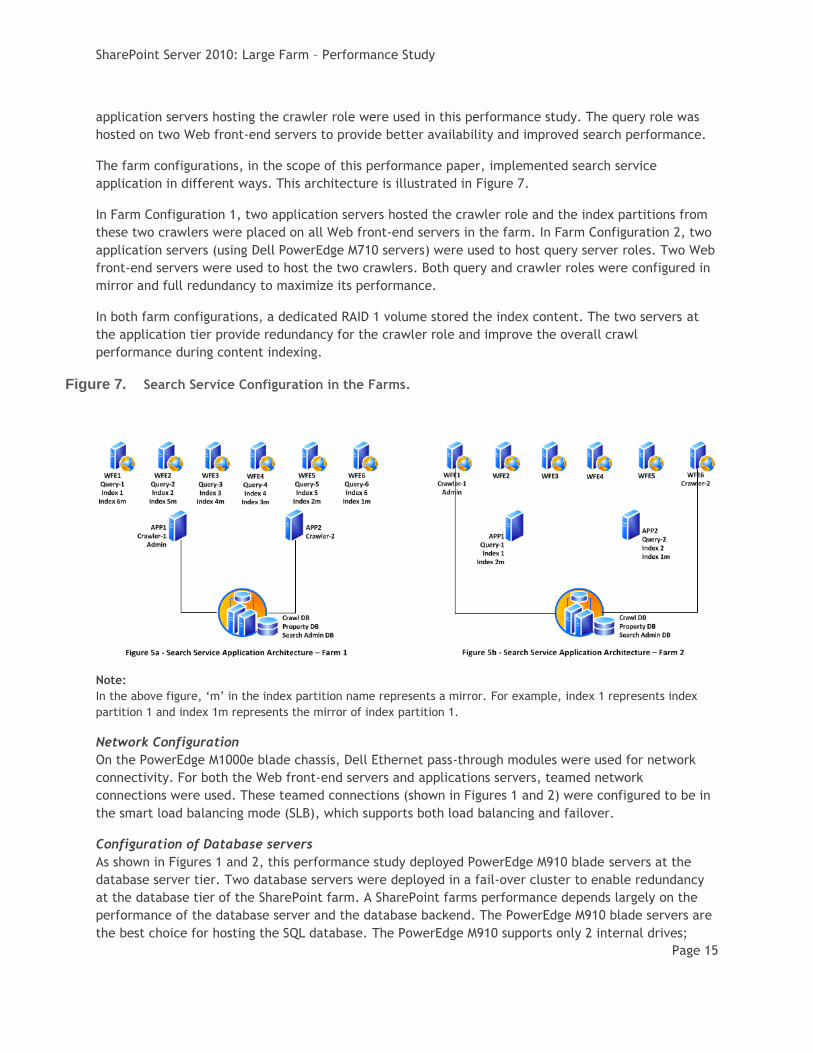
application servers hosting the crawler role were used in this performance study. The query role was
hosted on two Web front-end servers to provide better availability and improved search performance.
The farm configurations, in the scope of this performance paper, implemented search service
application in different ways. This architecture is illustrated in Figure 7.
In Farm Configuration 1, two application servers hosted the crawler role and the index partitions from
these two crawlers were placed on all Web front-end servers in the farm. In Farm Configuration 2, two
application servers (using Dell PowerEdge M710 servers) were used to host query server roles. Two Web
front-end servers were used to host the two crawlers. Both query and crawler roles were configured in
mirror and full redundancy to maximize its performance.
In both farm configurations, a dedicated RAID 1 volume stored the index content. The two servers at
the application tier provide redundancy for the crawler role and improve the overall crawl
performance during content indexing.
Figure 7. Search Service Configuration in the Farms.
Note:
In the above figure, ‘m’ in the index partition name represents a mirror. For example, index 1 represents index
partition 1 and index 1m represents the mirror of index partition 1.
Network Configuration
On the PowerEdge M1000e blade chassis, Dell Ethernet pass-through modules were used for network
connectivity. For both the Web front-end servers and applications servers, teamed network
connections were used. These teamed connections (shown in Figures 1 and 2) were configured to be in
the smart load balancing mode (SLB), which supports both load balancing and failover.
Configuration of Database servers
As shown in Figures 1 and 2, this performance study deployed PowerEdge M910 blade servers at the
database server tier. Two database servers were deployed in a fail-over cluster to enable redundancy
at the database tier of the SharePoint farm. A SharePoint farms performance depends largely on the
performance of the database server and the database backend. The PowerEdge M910 blade servers are
the best choice for hosting the SQL database. The PowerEdge M910 supports only 2 internal drives;
SharePoint Server 2010: Large Farm – Performance Study
Page 16
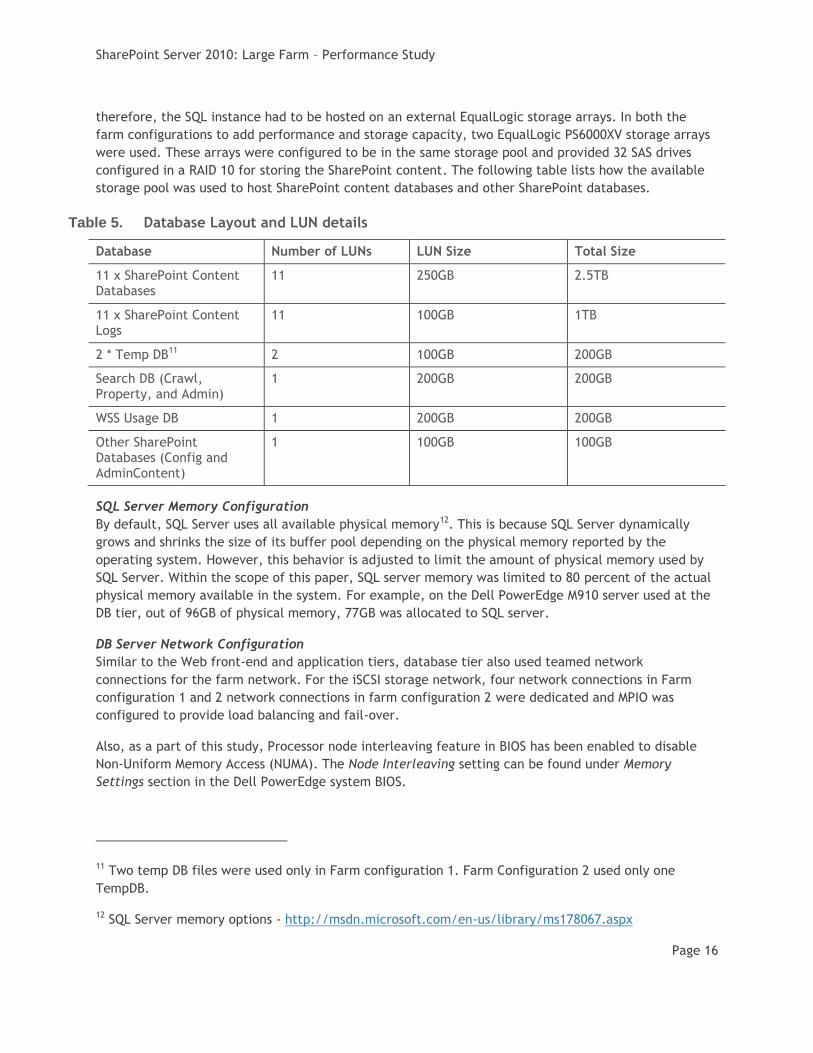
therefore, the SQL instance had to be hosted on an external EqualLogic storage arrays. In both the
farm configurations to add performance and storage capacity, two EqualLogic PS6000XV storage arrays
were used. These arrays were configured to be in the same storage pool and provided 32 SAS drives
configured in a RAID 10 for storing the SharePoint content. The following table lists how the available
storage pool was used to host SharePoint content databases and other SharePoint databases.
Table 5. Database Layout and LUN details
Database Number of LUNs LUN Size Total Size
11 x SharePoint Content Databases
11 250GB 2.5TB
11 x SharePoint Content Logs
11 100GB 1TB
2 * Temp DB11 2 100GB 200GB
Search DB (Crawl, Property, and Admin)
1 200GB 200GB
WSS Usage DB 1 200GB 200GB
Other SharePoint Databases (Config and AdminContent)
1 100GB 100GB
SQL Server Memory Configuration
By default, SQL Server uses all available physical memory12. This is because SQL Server dynamically
grows and shrinks the size of its buffer pool depending on the physical memory reported by the
operating system. However, this behavior is adjusted to limit the amount of physical memory used by
SQL Server. Within the scope of this paper, SQL server memory was limited to 80 percent of the actual
physical memory available in the system. For example, on the Dell PowerEdge M910 server used at the
DB tier, out of 96GB of physical memory, 77GB was allocated to SQL server.
DB Server Network Configuration
Similar to the Web front-end and application tiers, database tier also used teamed network
connections for the farm network. For the iSCSI storage network, four network connections in Farm
configuration 1 and 2 network connections in farm configuration 2 were dedicated and MPIO was
configured to provide load balancing and fail-over.
Also, as a part of this study, Processor node interleaving feature in BIOS has been enabled to disable
Non-Uniform Memory Access (NUMA). The Node Interleaving setting can be found under Memory
Settings section in the Dell PowerEdge system BIOS.
11 Two temp DB files were used only in Farm configuration 1. Farm Configuration 2 used only one
TempDB.
12 SQL Server memory options - http://msdn.microsoft.com/en-us/library/ms178067.aspx
SharePoint Server 2010: Large Farm – Performance Study
Page 17
Performance Study of a Large Farm Microsoft SharePoint 2010 is a versatile platform that is used in a large variety of ways. Some
SharePoint workloads work almost out of the box, others require or allow significant customization,
and still others are the result of completely custom developed applications. This flexibility results in a
multitude of ways of using SharePoint, which makes it almost impossible to accurately size servers and
storage for a SharePoint farm. In addition, there is no standard benchmark for sizing SharePoint
workloads at this time. It is very important to provide proper guidance to customers when it comes to
recommending infrastructure elements of a SharePoint implementation. This led to the development of
the Dell SharePoint Load Generation framework used to perform load testing of a SharePoint farm.
Dell SharePoint Load Generation Framework An internally developed load generation framework was used to understand the performance
characteristics of the SharePoint farm. This framework includes load testing of SharePoint out of the
box usage profiles such as collaboration and publishing.
The Dell SharePoint load generation framework has two components – a content population tool and
Visual Studio Team Suite (VSTS) Web test framework.
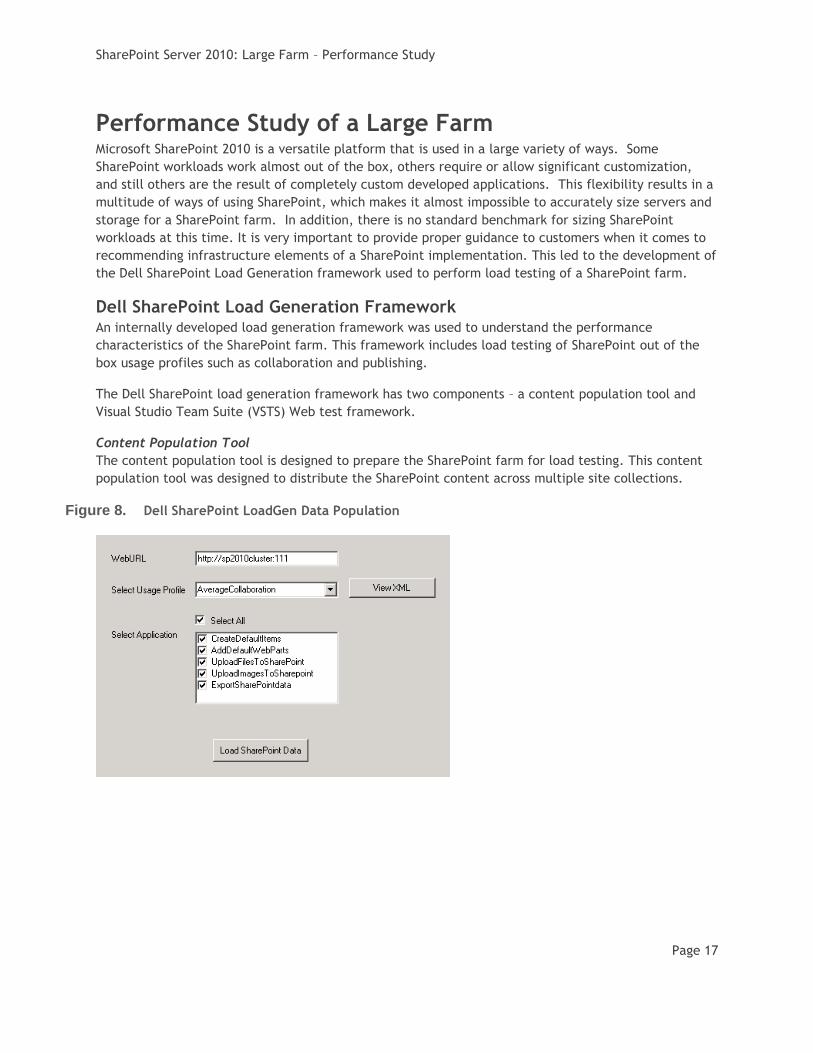
Content Population Tool
The content population tool is designed to prepare the SharePoint farm for load testing. This content
population tool was designed to distribute the SharePoint content across multiple site collections.
Figure 8. Dell SharePoint LoadGen Data Population
SharePoint Server 2010: Large Farm – Performance Study
Page 18
The content population tool was developed to:
Create SharePoint web applications
Create site collections
Add web parts to home pages
Create document libraries
Create SharePoint list items
Upload documents/images and so on.
This utility is capable of populating hundreds of gigabytes of SharePoint content in few hours. The size
of SharePoint content Database and other aspects such as number of site collections, and so on, vary
based on the usage profile selection. A usage profile is a collection of use cases closely mapped to real
world SharePoint usage. To some extent, these usage profiles were mapped in to SharePoint Capacity
Planner13 and other Microsoft recommendations. Although SharePoint capacity planner was intended for
MOSS 2007, there are several aspects of these recommendations14 that still apply to SharePoint 2010
out of the box workloads. The content generated and uploaded by the content population tool serves
as a baseline for SharePoint 2010 load testing using Visual Studio test framework.
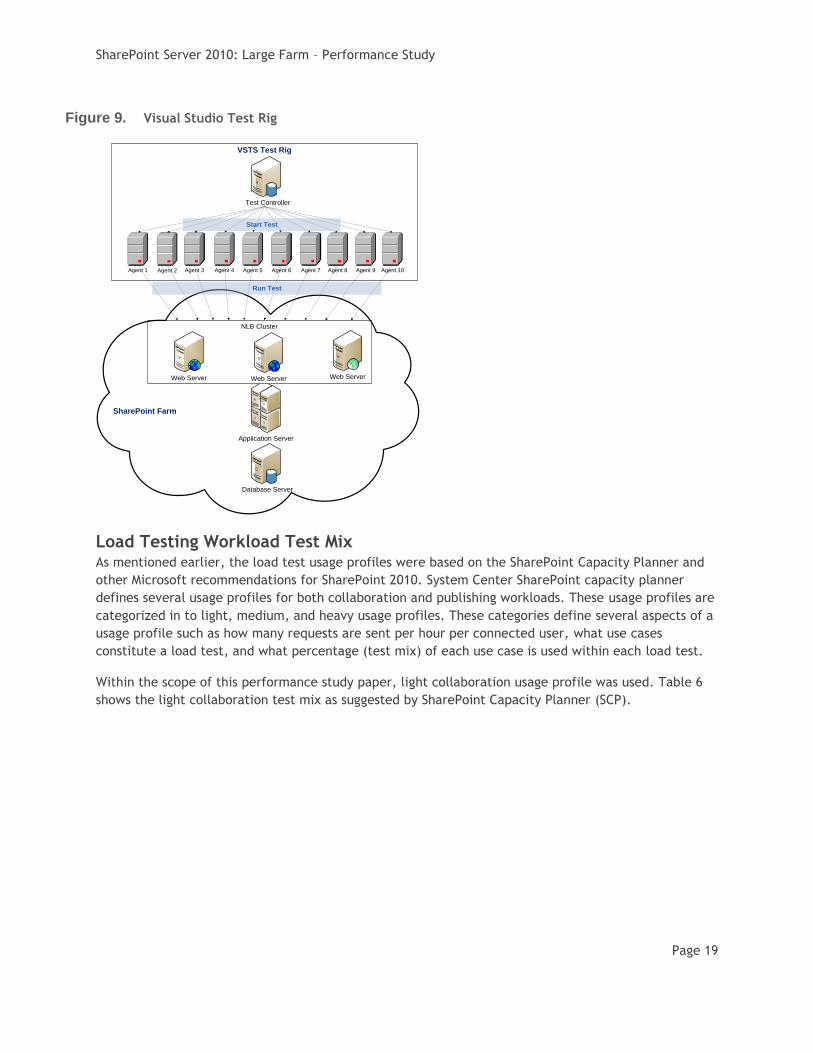
VSTS Load Testing Framework
Dell’s SharePoint load generation framework uses VS 2010 to perform load testing. Within Visual
Studio, each load test directly maps in to a SharePoint usage profile and each usage profile defines a
list of use cases and how may use cases are run per hour per connected user. Using VSTS 2008 helps in
rapid creation of use cases and parameterize those use cases. SharePoint load testing is performed
using a test rig – shown in Figure 9 -- of several physical test agents and the results are captured in to a
SQL database on the test controller. Figure 9 represents only a portion of the actual farm and test rig.
The actual test rig used for the study included 45 test agents and the farm as depicted in Figures 1 and
2.
13 SharePoint capacity planner -
http://www.microsoft.com/downloads/details.aspx?FamilyID=dbee0227-d4f7-48f8-85f0-
e71493b2fd87&displaylang=en
14 Microsoft SharePoint 2010 performance and capacity management -
http://technet.microsoft.com/en-us/library/cc262971.aspx
SharePoint Server 2010: Large Farm – Performance Study
Page 19
Figure 9. Visual Studio Test Rig
VSTS Test Rig
Test Controller
Agent 1 Agent 2 Agent 3 Agent 4 Agent 5 Agent 6 Agent 7 Agent 8 Agent 9 Agent 10
Database Server
Application Server
NLB Cluster
Web Server
SharePoint Farm
Web Server Web Server
Start Test
Run Test
Load Testing Workload Test Mix As mentioned earlier, the load test usage profiles were based on the SharePoint Capacity Planner and
other Microsoft recommendations for SharePoint 2010. System Center SharePoint capacity planner
defines several usage profiles for both collaboration and publishing workloads. These usage profiles are
categorized in to light, medium, and heavy usage profiles. These categories define several aspects of a
usage profile such as how many requests are sent per hour per connected user, what use cases
constitute a load test, and what percentage (test mix) of each use case is used within each load test.
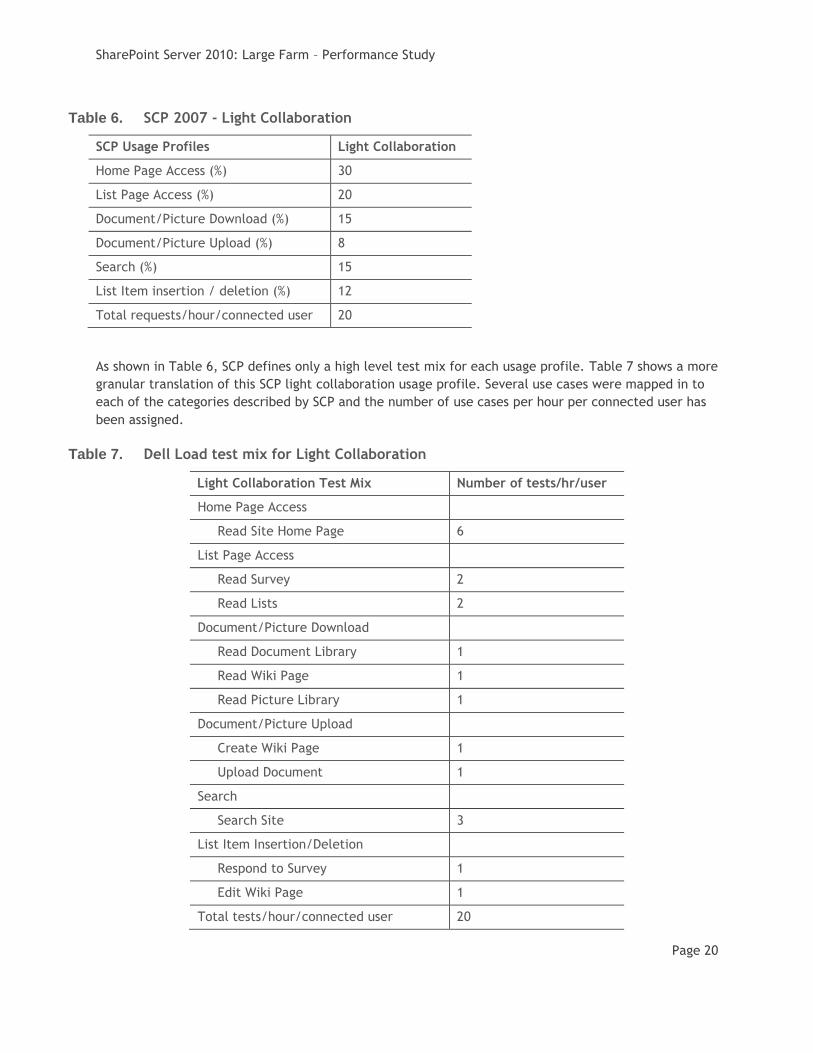
Within the scope of this performance study paper, light collaboration usage profile was used. Table 6
shows the light collaboration test mix as suggested by SharePoint Capacity Planner (SCP).
SharePoint Server 2010: Large Farm – Performance Study
Page 20
Table 6. SCP 2007 - Light Collaboration
SCP Usage Profiles Light Collaboration
Home Page Access (%) 30
List Page Access (%) 20
Document/Picture Download (%) 15
Document/Picture Upload (%) 8
Search (%) 15
List Item insertion / deletion (%) 12
Total requests/hour/connected user 20
As shown in Table 6, SCP defines only a high level test mix for each usage profile. Table 7 shows a more
granular translation of this SCP light collaboration usage profile. Several use cases were mapped in to
each of the categories described by SCP and the number of use cases per hour per connected user has
been assigned.
Table 7. Dell Load test mix for Light Collaboration
Light Collaboration Test Mix Number of tests/hr/user
Home Page Access
Read Site Home Page 6
List Page Access
Read Survey 2
Read Lists 2
Document/Picture Download
Read Document Library 1
Read Wiki Page 1
Read Picture Library 1
Document/Picture Upload
Create Wiki Page 1
Upload Document 1
Search
Search Site 3
List Item Insertion/Deletion
Respond to Survey 1
Edit Wiki Page 1
Total tests/hour/connected user 20
SharePoint Server 2010: Large Farm – Performance Study
Page 21
Dell’s test mix, shown in Table 7 is not a one-to-one mapping in to the above SCP and MS
recommendations. For example, SCP defines total requests per hour per connected user. However,
within Dell’s test mix for the light collaboration profile, this translates in to more requests than 20 per
hour as the usage profile uses 20 tests per hour for each connected user. And, one test could mean
more than one request. Hence, the results published in this paper may or may not map directly in to
SharePoint capacity planner recommendations directly and are specific to the workload mix defined in
Table 7.
Test methodology The intent of the experiments conducted as a part of this performance study was to understand the
capacity of a large SharePoint farm as shown in Figures 1 and 2 with the configuration described in
Table 2. Several load test iterations were conducted with incrementing user load. For example, an
initial user load of 500 virtual users was used and the same had been incremented by 500 users until
the farm resources reached an optimal level of usage. The overall goal of the load test was to make
sure that the processor usage is below 60 percent and the average farm response time is sub one
second.
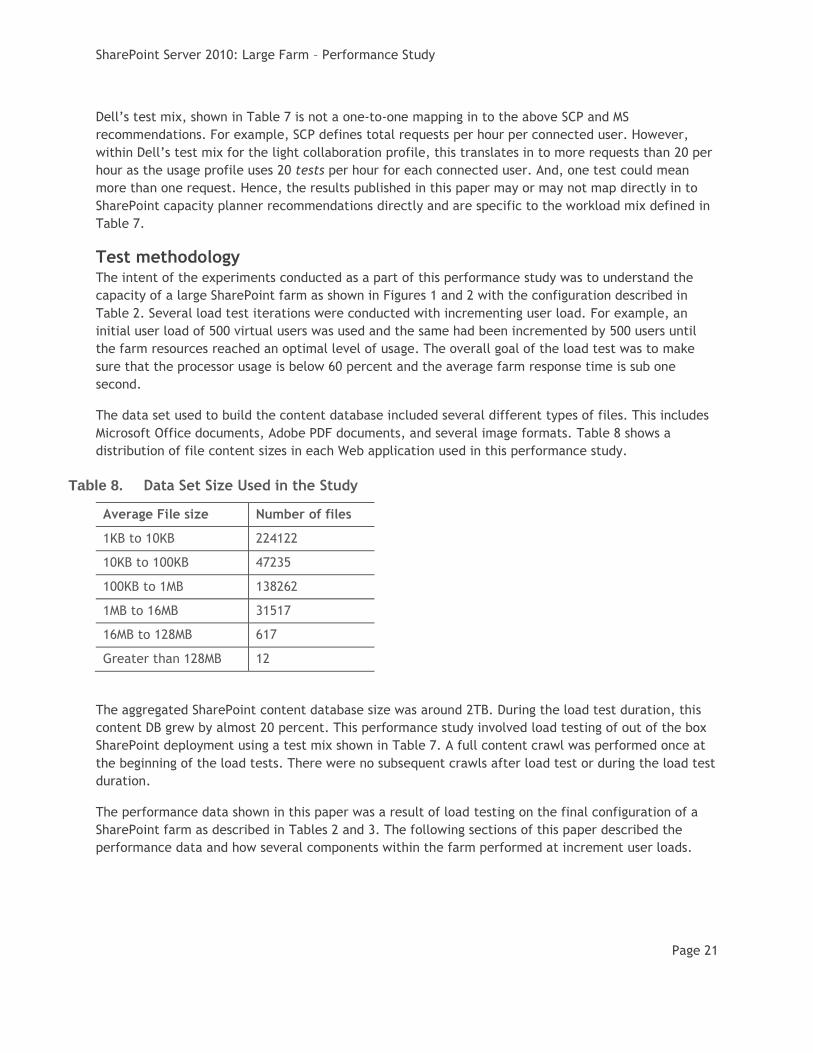
The data set used to build the content database included several different types of files. This includes
Microsoft Office documents, Adobe PDF documents, and several image formats. Table 8 shows a
distribution of file content sizes in each Web application used in this performance study.
Table 8. Data Set Size Used in the Study
Average File size Number of files
1KB to 10KB 224122
10KB to 100KB 47235
100KB to 1MB 138262
1MB to 16MB 31517
16MB to 128MB 617
Greater than 128MB 12
The aggregated SharePoint content database size was around 2TB. During the load test duration, this
content DB grew by almost 20 percent. This performance study involved load testing of out of the box
SharePoint deployment using a test mix shown in Table 7. A full content crawl was performed once at
the beginning of the load tests. There were no subsequent crawls after load test or during the load test
duration.
The performance data shown in this paper was a result of load testing on the final configuration of a
SharePoint farm as described in Tables 2 and 3. The following sections of this paper described the
performance data and how several components within the farm performed at increment user loads.
SharePoint Server 2010: Large Farm – Performance Study
Page 22
Performance Results and Analysis As a part of this performance study, several performance metrics were collected and analyzed. Based
on the results, the farm configurations were tweaked to reach the final farm configuration shown in
Figures 1 and 2. This section describes the performance data and how the two farm configurations
differ in overall performance.
As mentioned earlier, this study included only collaboration workload. So, all the results shown here
are relative to the workload used and may differ with any other implementation outside of the test mix
shown in Table 8. The following table shows how the two farm configurations differed in performance
metrics such as overall concurrent user load and requests per second.
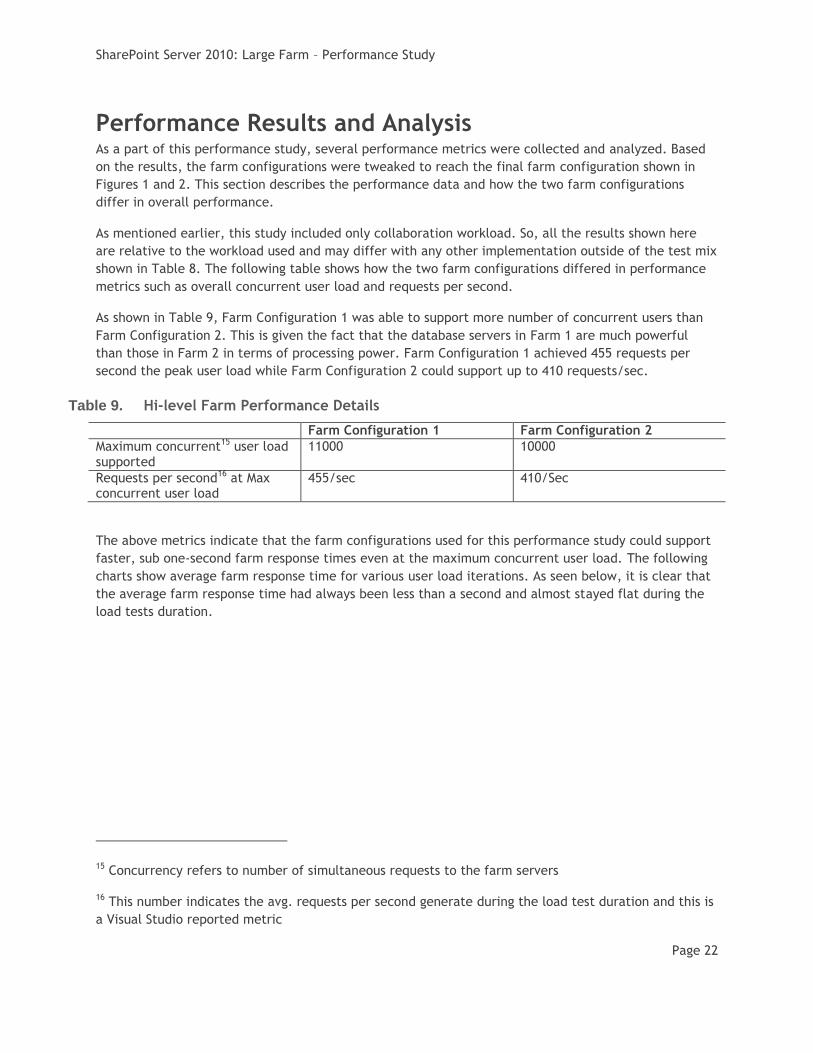
As shown in Table 9, Farm Configuration 1 was able to support more number of concurrent users than
Farm Configuration 2. This is given the fact that the database servers in Farm 1 are much powerful
than those in Farm 2 in terms of processing power. Farm Configuration 1 achieved 455 requests per
second the peak user load while Farm Configuration 2 could support up to 410 requests/sec.
Table 9. Hi-level Farm Performance Details
Farm Configuration 1 Farm Configuration 2
Maximum concurrent15 user load supported
11000 10000
Requests per second16 at Max concurrent user load
455/sec 410/Sec
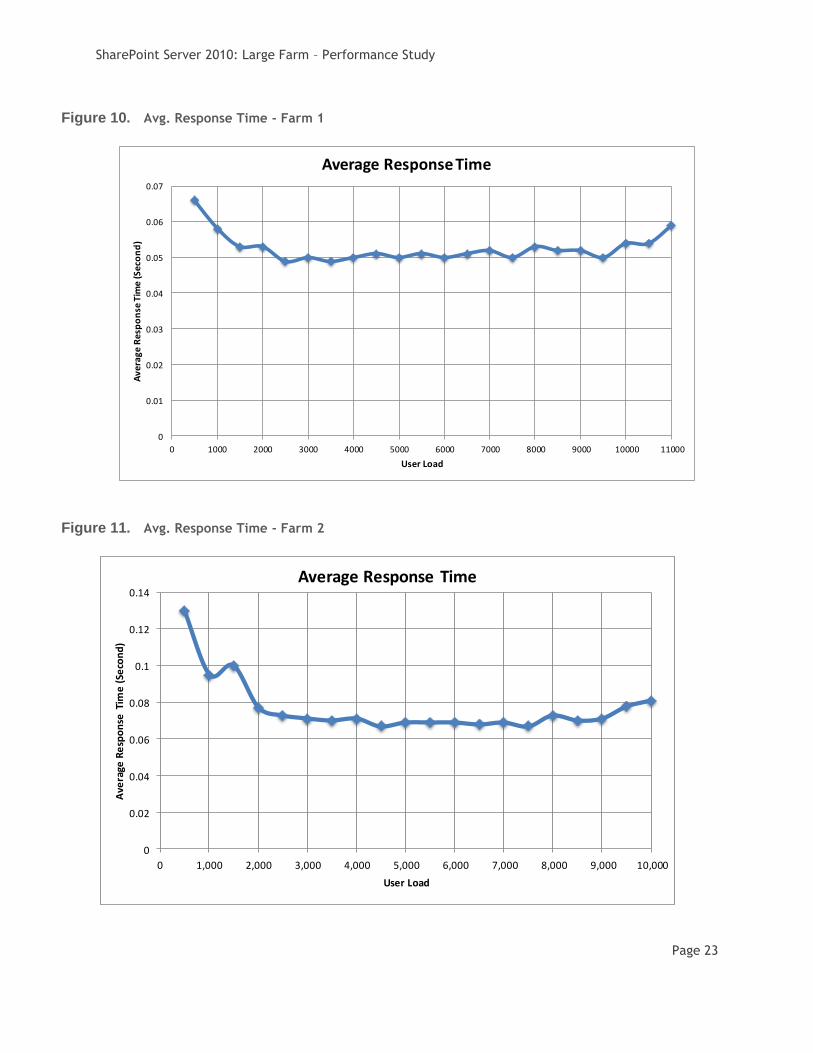
The above metrics indicate that the farm configurations used for this performance study could support
faster, sub one-second farm response times even at the maximum concurrent user load. The following
charts show average farm response time for various user load iterations. As seen below, it is clear that
the average farm response time had always been less than a second and almost stayed flat during the
load tests duration.
15 Concurrency refers to number of simultaneous requests to the farm servers
16 This number indicates the avg. requests per second generate during the load test duration and this is
a Visual Studio reported metric
SharePoint Server 2010: Large Farm – Performance Study
Page 23
Figure 10. Avg. Response Time - Farm 1
0
0.01
0.02
0.03
0.04
0.05
0.06
0.07
0 1000 2000 3000 4000 5000 6000 7000 8000 9000 10000 11000
Av
era
ge
Re
spo
nse
Tim
e (
Se
con
d)
User Load
Average Response Time
Figure 11. Avg. Response Time - Farm 2
0
0.02
0.04
0.06
0.08
0.1
0.12
0.14
0 1,000 2,000 3,000 4,000 5,000 6,000 7,000 8,000 9,000 10,000
Ave
rage
Re
spo
nse
Tim
e (
Seco
nd
)
User Load
Average Response Time
SharePoint Server 2010: Large Farm – Performance Study
Page 24
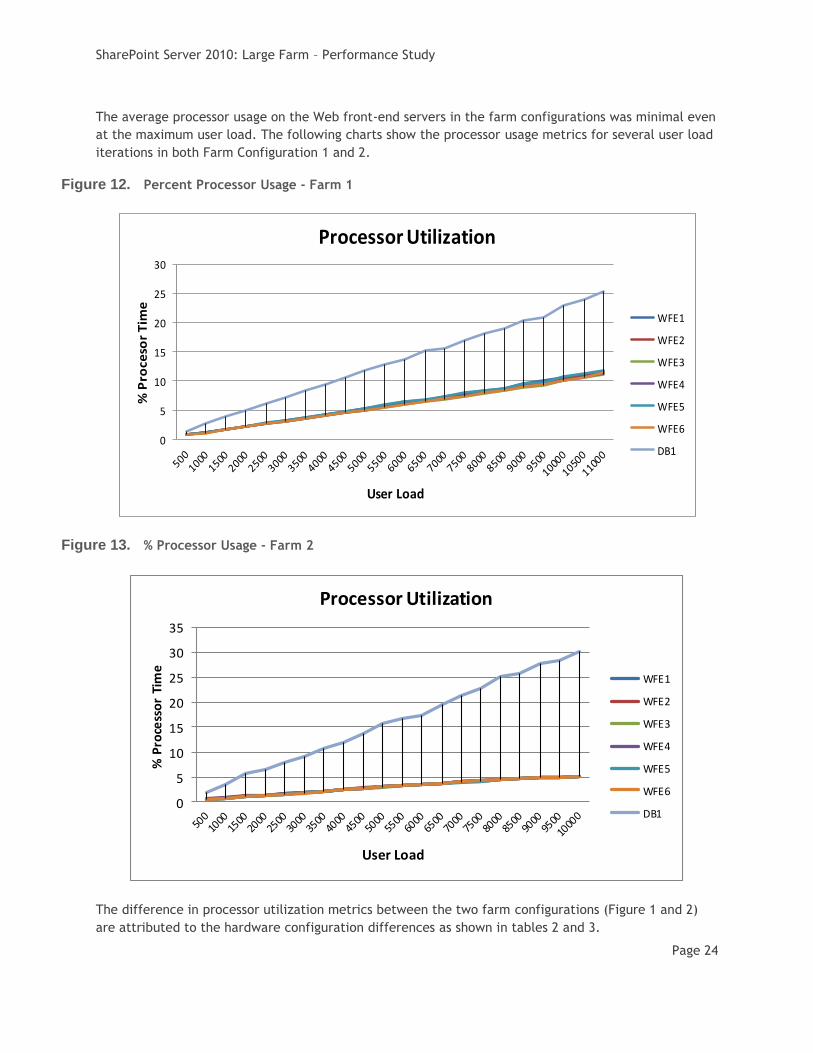
The average processor usage on the Web front-end servers in the farm configurations was minimal even
at the maximum user load. The following charts show the processor usage metrics for several user load
iterations in both Farm Configuration 1 and 2.
Figure 12. Percent Processor Usage - Farm 1
0
5
10
15
20
25
30
% P
roce
sor
Tim
e
User Load
Processor Utilization
WFE1
WFE2
WFE3
WFE4
WFE5
WFE6
DB1
Figure 13. % Processor Usage - Farm 2
0
5
10
15
20
25
30
35
% P
roce
sso
r Ti
me
User Load
Processor Utilization
WFE1
WFE2
WFE3
WFE4
WFE5
WFE6
DB1
The difference in processor utilization metrics between the two farm configurations (Figure 1 and 2)
are attributed to the hardware configuration differences as shown in tables 2 and 3.
SharePoint Server 2010: Large Farm – Performance Study
Page 25
From the above processor usage metrics, it may seem that fewer than six front-end may be sufficient
to support the desired maximum concurrent user load of 11000 users.
However, in a heavily loaded scenario, even though the average processor usage is below 15 percent,
the SharePoint farm configurations 1 and 2 may not support a larger number of users than what is
shown in table 9.This is mainly because of the AP.NET and IIS request queue length limitations. The
out-of-the-box IIS and ASP.NET queue length settings can be tweaked to go beyond the concurrent user
load shown in this performance study paper. However, this is outside the scope of this paper and may
require an in-depth study in itself.
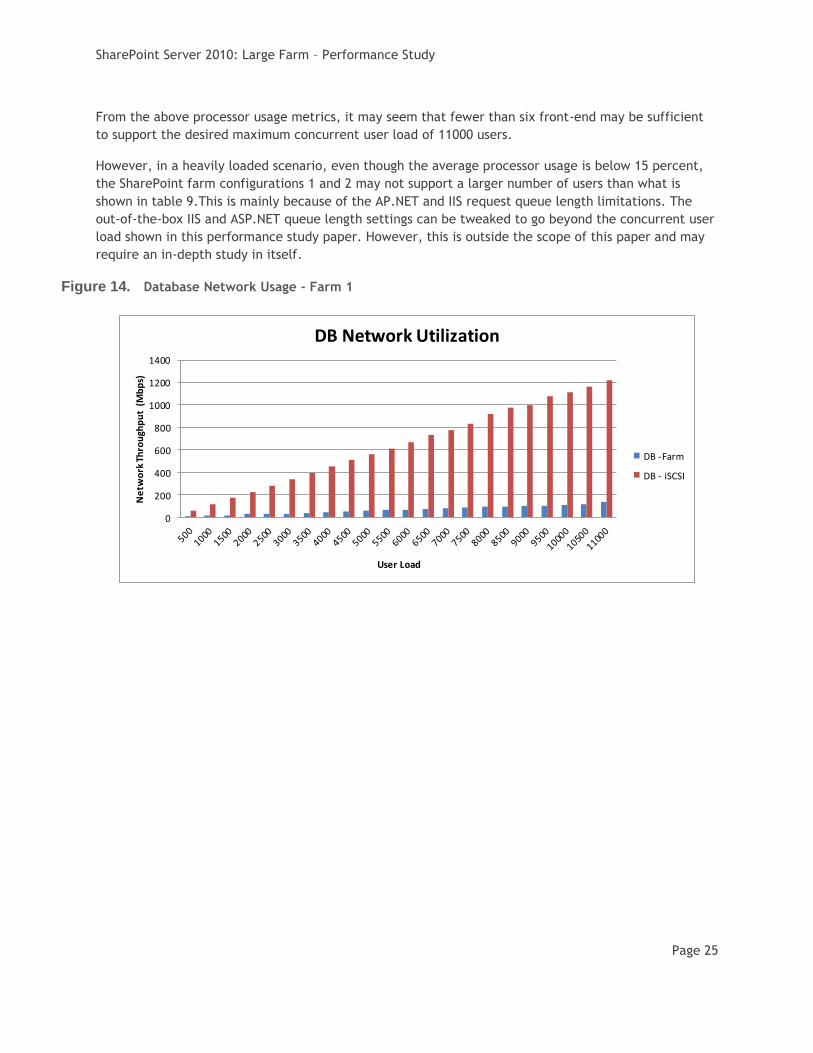
Figure 14. Database Network Usage - Farm 1
0
200
400
600
800
1000
1200
1400
Ne
two
rk T
hro
ugh
pu
t (M
bp
s)
User Load
DB Network Utilization
DB -Farm
DB - iSCSI
SharePoint Server 2010: Large Farm – Performance Study
Page 26
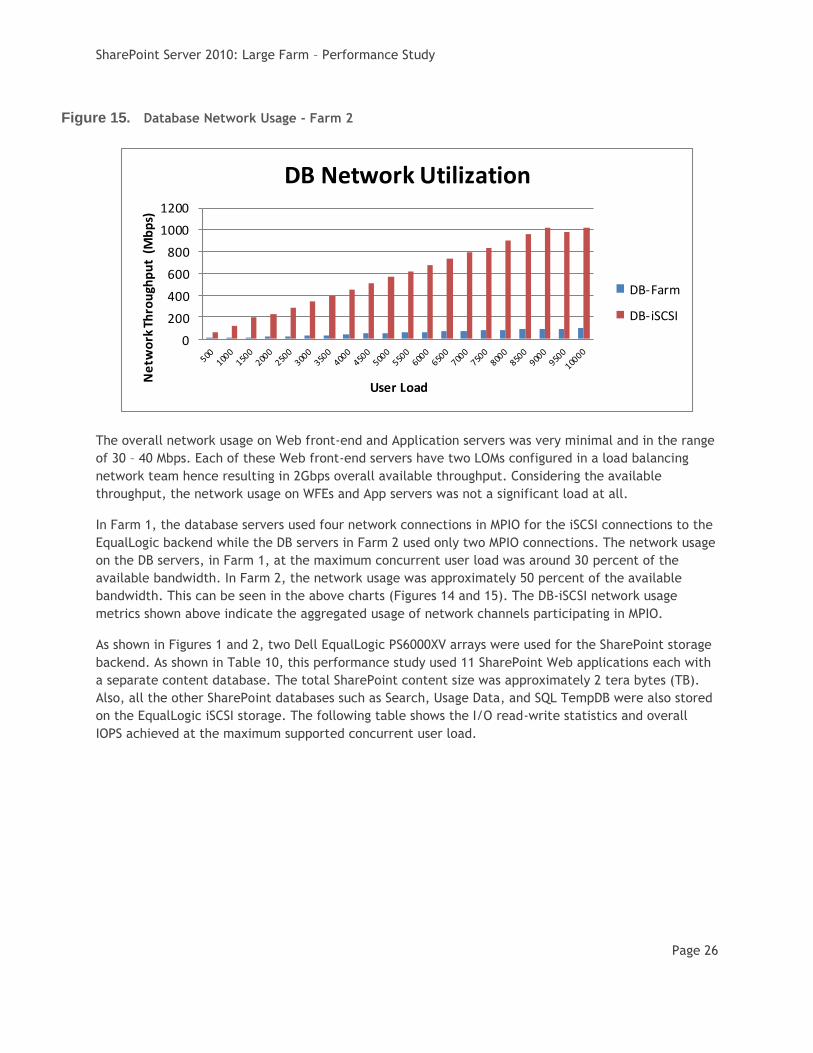
Figure 15. Database Network Usage - Farm 2
0
200
400
600
800
1000
1200
Ne
two
rk T
hro
ugh
pu
t (M
bp
s)
User Load
DB Network Utilization
DB-Farm
DB-iSCSI
The overall network usage on Web front-end and Application servers was very minimal and in the range
of 30 – 40 Mbps. Each of these Web front-end servers have two LOMs configured in a load balancing
network team hence resulting in 2Gbps overall available throughput. Considering the available
throughput, the network usage on WFEs and App servers was not a significant load at all.
In Farm 1, the database servers used four network connections in MPIO for the iSCSI connections to the
EqualLogic backend while the DB servers in Farm 2 used only two MPIO connections. The network usage
on the DB servers, in Farm 1, at the maximum concurrent user load was around 30 percent of the
available bandwidth. In Farm 2, the network usage was approximately 50 percent of the available
bandwidth. This can be seen in the above charts (Figures 14 and 15). The DB-iSCSI network usage
metrics shown above indicate the aggregated usage of network channels participating in MPIO.
As shown in Figures 1 and 2, two Dell EqualLogic PS6000XV arrays were used for the SharePoint storage
backend. As shown in Table 10, this performance study used 11 SharePoint Web applications each with
a separate content database. The total SharePoint content size was approximately 2 tera bytes (TB).
Also, all the other SharePoint databases such as Search, Usage Data, and SQL TempDB were also stored
on the EqualLogic iSCSI storage. The following table shows the I/O read-write statistics and overall
IOPS achieved at the maximum supported concurrent user load.
SharePoint Server 2010: Large Farm – Performance Study
Page 27
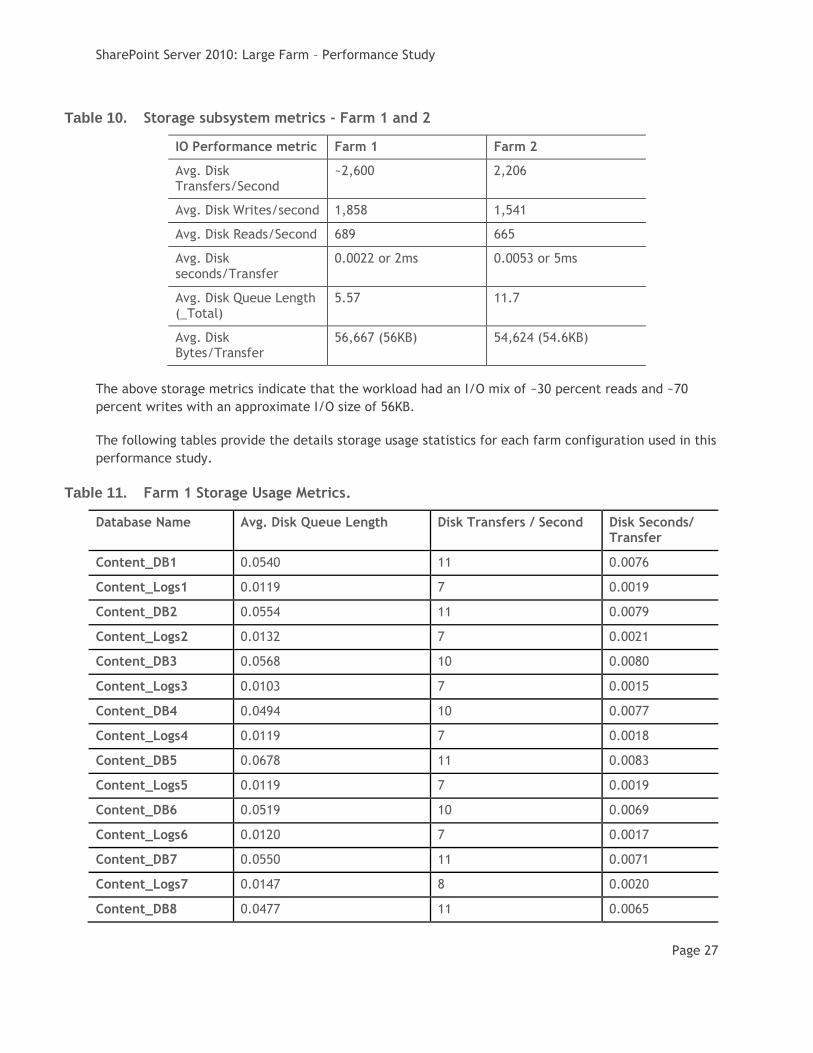
Table 10. Storage subsystem metrics - Farm 1 and 2
IO Performance metric Farm 1 Farm 2
Avg. Disk Transfers/Second
~2,600 2,206
Avg. Disk Writes/second 1,858 1,541
Avg. Disk Reads/Second 689 665
Avg. Disk seconds/Transfer
0.0022 or 2ms 0.0053 or 5ms
Avg. Disk Queue Length (_Total)
5.57 11.7
Avg. Disk Bytes/Transfer
56,667 (56KB) 54,624 (54.6KB)
The above storage metrics indicate that the workload had an I/O mix of ~30 percent reads and ~70
percent writes with an approximate I/O size of 56KB.
The following tables provide the details storage usage statistics for each farm configuration used in this
performance study.
Table 11. Farm 1 Storage Usage Metrics.
Database Name Avg. Disk Queue Length Disk Transfers / Second Disk Seconds/ Transfer
Content_DB1 0.0540 11 0.0076
Content_Logs1 0.0119 7 0.0019
Content_DB2 0.0554 11 0.0079
Content_Logs2 0.0132 7 0.0021
Content_DB3 0.0568 10 0.0080
Content_Logs3 0.0103 7 0.0015
Content_DB4 0.0494 10 0.0077
Content_Logs4 0.0119 7 0.0018
Content_DB5 0.0678 11 0.0083
Content_Logs5 0.0119 7 0.0019
Content_DB6 0.0519 10 0.0069
Content_Logs6 0.0120 7 0.0017
Content_DB7 0.0550 11 0.0071
Content_Logs7 0.0147 8 0.0020
Content_DB8 0.0477 11 0.0065
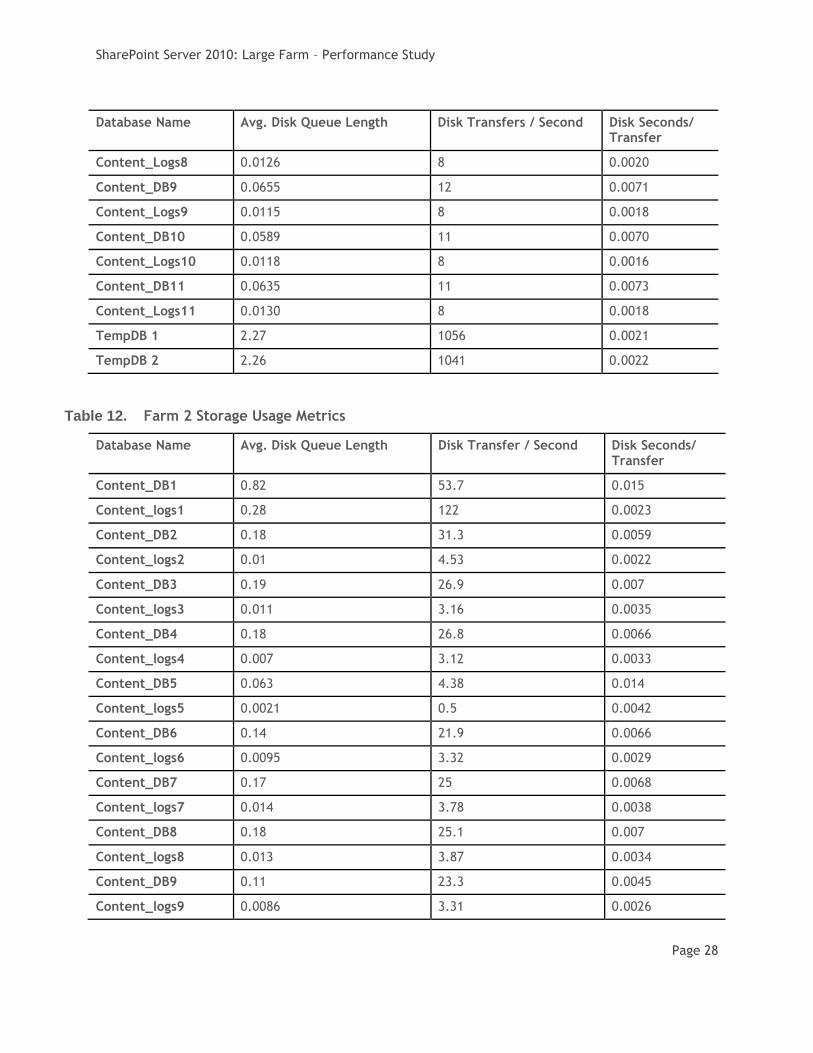
SharePoint Server 2010: Large Farm – Performance Study
Page 28
Database Name Avg. Disk Queue Length Disk Transfers / Second Disk Seconds/ Transfer
Content_Logs8 0.0126 8 0.0020
Content_DB9 0.0655 12 0.0071
Content_Logs9 0.0115 8 0.0018
Content_DB10 0.0589 11 0.0070
Content_Logs10 0.0118 8 0.0016
Content_DB11 0.0635 11 0.0073
Content_Logs11 0.0130 8 0.0018
TempDB 1 2.27 1056 0.0021
TempDB 2 2.26 1041 0.0022
Table 12. Farm 2 Storage Usage Metrics
Database Name Avg. Disk Queue Length Disk Transfer / Second Disk Seconds/ Transfer
Content_DB1 0.82 53.7 0.015
Content_logs1 0.28 122 0.0023
Content_DB2 0.18 31.3 0.0059
Content_logs2 0.01 4.53 0.0022
Content_DB3 0.19 26.9 0.007
Content_logs3 0.011 3.16 0.0035
Content_DB4 0.18 26.8 0.0066
Content_logs4 0.007 3.12 0.0033
Content_DB5 0.063 4.38 0.014
Content_logs5 0.0021 0.5 0.0042
Content_DB6 0.14 21.9 0.0066
Content_logs6 0.0095 3.32 0.0029
Content_DB7 0.17 25 0.0068
Content_logs7 0.014 3.78 0.0038
Content_DB8 0.18 25.1 0.007
Content_logs8 0.013 3.87 0.0034
Content_DB9 0.11 23.3 0.0045
Content_logs9 0.0086 3.31 0.0026
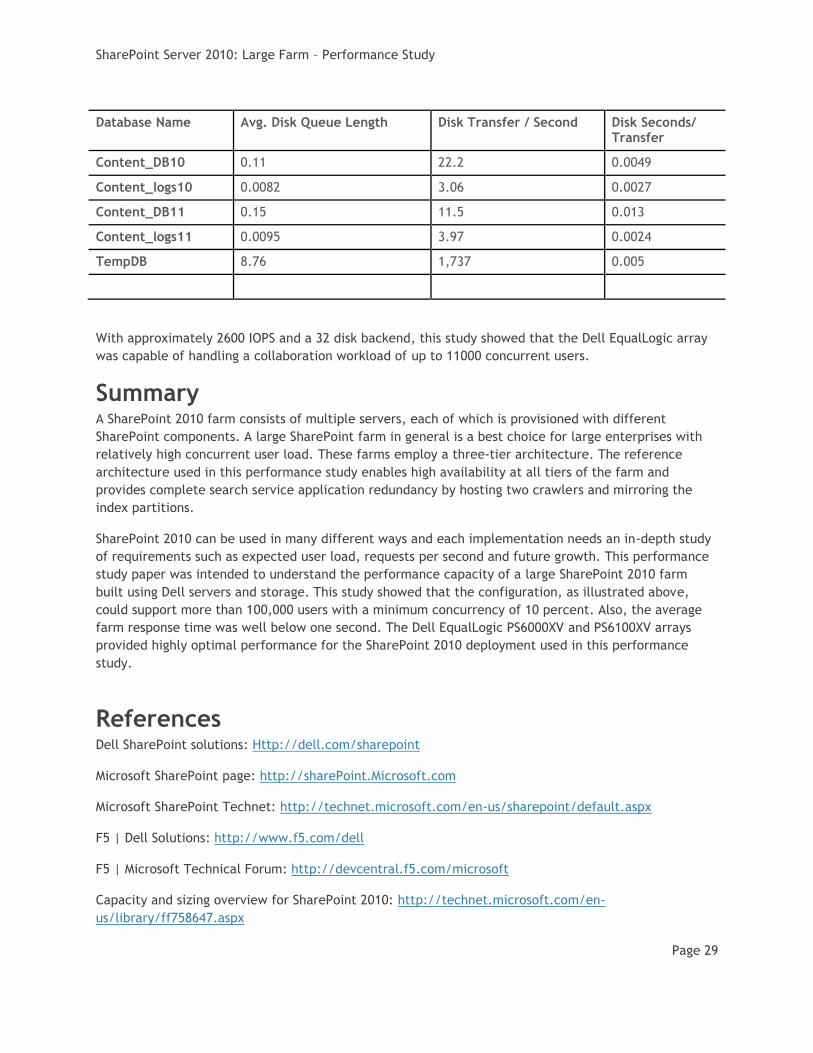
SharePoint Server 2010: Large Farm – Performance Study
Page 29
Database Name Avg. Disk Queue Length Disk Transfer / Second Disk Seconds/ Transfer
Content_DB10 0.11 22.2 0.0049
Content_logs10 0.0082 3.06 0.0027
Content_DB11 0.15 11.5 0.013
Content_logs11 0.0095 3.97 0.0024
TempDB 8.76 1,737 0.005
With approximately 2600 IOPS and a 32 disk backend, this study showed that the Dell EqualLogic array
was capable of handling a collaboration workload of up to 11000 concurrent users.
Summary A SharePoint 2010 farm consists of multiple servers, each of which is provisioned with different
SharePoint components. A large SharePoint farm in general is a best choice for large enterprises with
relatively high concurrent user load. These farms employ a three-tier architecture. The reference
architecture used in this performance study enables high availability at all tiers of the farm and
provides complete search service application redundancy by hosting two crawlers and mirroring the
index partitions.
SharePoint 2010 can be used in many different ways and each implementation needs an in-depth study
of requirements such as expected user load, requests per second and future growth. This performance
study paper was intended to understand the performance capacity of a large SharePoint 2010 farm
built using Dell servers and storage. This study showed that the configuration, as illustrated above,
could support more than 100,000 users with a minimum concurrency of 10 percent. Also, the average
farm response time was well below one second. The Dell EqualLogic PS6000XV and PS6100XV arrays
provided highly optimal performance for the SharePoint 2010 deployment used in this performance
study.
References Dell SharePoint solutions: Http://dell.com/sharepoint
Microsoft SharePoint page: http://sharePoint.Microsoft.com
Microsoft SharePoint Technet: http://technet.microsoft.com/en-us/sharepoint/default.aspx
F5 | Dell Solutions: http://www.f5.com/dell
F5 | Microsoft Technical Forum: http://devcentral.f5.com/microsoft
Capacity and sizing overview for SharePoint 2010: http://technet.microsoft.com/en-
us/library/ff758647.aspx
SharePoint Server 2010: Large Farm – Performance Study
Page 30


