23
Dell™ | SharePoint Solutions Ravikanth Chaganti and Quocdat Nguyen August 2010 Microsoft ® SharePoint ® Server 2010 Medium Farm Solution – Performance Study
Dell™ | SharePoint Solutions
Ravikanth Chaganti and Quocdat Nguyen
August 2010
Microsoft® SharePoint® Server 2010
Medium Farm Solution – Performance Study
2
THIS WHITE PAPER IS FOR INFORMATIONAL PURPOSES ONLY, AND MAY CONTAIN TYPOGRAPHICAL
ERRORS AND TECHNICAL INACCURACIES. THE CONTENT IS PROVIDED AS IS, WITHOUT EXPRESS OR
IMPLIED WARRANTIES OF ANY KIND.
© 2010 Dell Inc. All rights reserved. Reproduction of this material in any manner whatsoever without
the express written permission of Dell Inc. is strictly forbidden. For more information, contact Dell.
Dell, the DELL logo, PowerEdge, and EqualLogic are trademarks of Dell Inc. Microsoft, Windows,
Windows Server, Visual Studio and SharePoint are either trademarks or registered trademarks of
Microsoft Corporation in the United States and/or other countries. Intel and Xeon are registered
trademarks of Intel Corporation. Other trademarks and trade names may be used in this document to
refer to either the entities claiming the marks and names or their products. Dell Inc. disclaims any
proprietary interest in trademarks and trade names other than its own.
August 2010
3
Executive Summary A Microsoft ® SharePoint® Server 2010 farm hosts the core platform services and applications that provide many different functions for its users. A classical three-tier (Web, Application, Database) model, or farm, architecture is usually used for SharePoint Server 2010. Understanding sizing of each of the tiers of a SharePoint farm requires a comprehensive study of the workload requirements and performance capabilities of each hardware component. This white paper includes such a comprehensive study and describes how a medium SharePoint farm, built using Dell™ PowerEdge™ blade servers and Dell EqualLogic™ storage, performed under load testing. It is a priority for Dell to be able to provide accurate guidance to customers when recommending infrastructure elements of a SharePoint implementation. Through our testing, we have provided guidance on how to increase performance and help keep client response times under one second. Dell’s SharePoint engineering team developed a load generation framework to perform this load testing so that we would be able to share these results with our customers. This data is being provided to our customers to help them understand the performance impact of several SharePoint workloads, and how to size and design the best farm architecture to support these workloads. The paper details information on how the farm was configured, some of the factors considered while designing the farm, how Dell performs SharePoint load testing, and finally provides several performance metrics of various farm components. This paper also details information on how the recommended farm architectures could support more than 50000 users and achieve sub one second response times. Performance benefits of the new generation of full-height blade servers – Dell PowerEdge M910 – and its Nehalem EX series processors are also highlighted. A companion paper, SharePoint Server 2010: An Introduction, is available from www.dell.com/sharepoint. This paper offers an overview of SharePoint Server 2010, and provides common concepts and definitions that form a good basis for understanding the reference architecture presented in this paper. Another companion paper, SharePoint 2010: Designing and Implementing a Medium Farm, is also
available from www.dell.com/SharePoint. This companion paper provides the reference architecture
and infrastructure best practices for implementing a SharePoint 2010 medium farm. These reference
architectures formed the basis of the performance study described in this paper.
4
Table of Contents Executive Summary ....................................................................................................... 3
Introduction ................................................................................................................ 5
SharePoint 2010 Farm Topologies ...................................................................................... 5
Medium Farm Topology ................................................................................................ 6
Dell PowerEdge M1000e Blade Enclosure ........................................................................ 8
Dell PowerEdge M610 ............................................................................................... 9
Dell PowerEdge M710 ............................................................................................. 10
Dell PowerEdge M910 ............................................................................................. 10
Dell EqualLogic PS6000XV Storage Arrays ..................................................................... 10
Farm Architecture and Configuration of Farm Roles ........................................................ 11
Configuration of Web Front-end and Application Servers .................................................. 11
HTTP Request Throttling ....................................................................................... 12
Search Service Application Configuration .................................................................. 12
Network Configuration ......................................................................................... 13
Configuration of Database Servers .............................................................................. 13
SQL Server Memory Configuration ............................................................................ 14
DB Server Network Configuration ............................................................................... 14
Performance Study of a Medium Farm ............................................................................... 14
Dell SharePoint Load Generation Framework .................................................................... 14
Content Population Tool .......................................................................................... 14
VSTS Load Testing Framework ................................................................................... 15
Load Testing Workload Test Mix ................................................................................... 16
Test Methodology ..................................................................................................... 17
Performance Results & Analysis ...................................................................................... 18
Summary .................................................................................................................. 22
References ................................................................................................................ 23
5
Introduction Microsoft SharePoint Server 2010 builds on the capabilities that were offered in Microsoft Office
SharePoint Server 2007 to provide a rich platform for collaboration, information sharing, and document
management. SharePoint 2010 adds several new features and introduces important architectural
changes and product improvements.
Capacity planning for a SharePoint farm deployment needs a thorough study of the existing
requirements and future growth. A SharePoint implementation can be used in several ways including
custom developed applications. This brings in the complexity factor while sizing the servers and storage
for a SharePoint implementation. There are, however, the six pillars1 that can be used to create clarity
around how SharePoint will be used. This performance study paper intends to provide performance
capacity details of two SharePoint 2010 medium farms configured with Dell PowerEdge blade servers
and Dell EqualLogic iSCSI storage in the context of SharePoint collaboration2.
SharePoint 2010 Farm Topologies A SharePoint server farm is a set of servers which collectively provide the services needed by a
SharePoint deployment. Some of these services, or sets of services, comprise predefined roles and must
be configured within the solution. Other services and components are optional, but they provide
additional features and functionality that are often desirable. These optional components may include
some of the service applications such as managed meta data service, Excel services, and etc. There are
some constraints and best practices that help determine which components should be located on each
server in the farm. Also, by considering how the components are distributed, the farm can be designed
to more easily accommodate later growth.
NOTE: In SharePoint Server 2010, components generally provide functionality for a given service
application. As a result, this paper may use the terms ―role‖ and ―component‖ interchangeably. In this
context, SharePoint roles refer to one or more components that provide a farm service, and should not
be confused with Windows Server® roles, which generally include one or more Windows services to
provide operating system functionality.
The size and capacity of a SharePoint 2010 implementation can vary based on several factors such as
number of concurrent users, service application in the farm, the expected uptime service level
agreement (SLA), and etc. These factors dictate how many servers are needed in the SharePoint farm
and how the overall farm architecture looks. Based on the these factors, SharePoint 2010 farm
implementations can be classified in to small farm3, medium farm and a large farm4 deployments.
1 SharePoint capabilities - http://sharepoint.microsoft.com/en-us/product/capabilities/Pages/default.aspx 2 SharePoint collaboration capabilities - http://sharepoint.microsoft.com/en-us/product/capabilities/communities/Pages/default.aspx 3 SharePoint 2010 – Designing and Implementing a Small Server Farm http://www.dell.com/downloads/global/services/dell_small_sharepoint_farm.pdf 4 SharePoint 2010 – Designing and Implementing a Large Farm http://www.dell.com/downloads/global/services/dell_large_sharepoint_farm.pdf
6
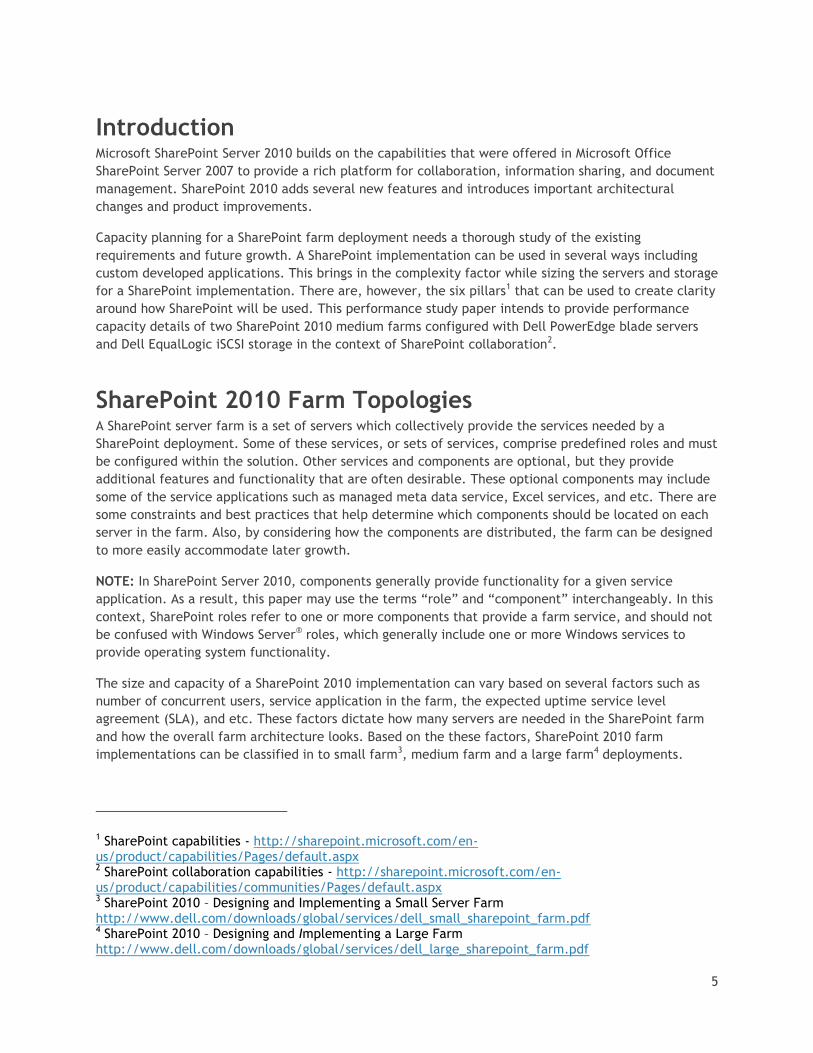
Medium Farm Topology A typical SharePoint medium server farm5 consists of three tiers: Web front-end, application, and
database. Dedicated servers are used to host each tier to provide process isolation and to allow for
future growth. A server farm deployment model helps ensure that the solution infrastructure is
scalable, flexible, and resilient to hardware failures. To achieve these goals, a medium farm
implementation uses multiple servers at all tiers of the farm deployment. The farm model uses a
dedicated database server, employs one or more application servers, and generally distributes Web
front-end server roles across multiple hosts. This performance study paper used the SharePoint 2010
medium farm architecture to understand how several components of a farm perform at incrementing
user loads.
Within the scope of this paper, two farm configurations were used to study the performance
characteristics of SharePoint 2010 on Dell servers and storage. Figures 1 and 2 depict the reference
architecture of the two farms used in this performance study.
Figure 1 Farm Configuration 1 – M710 as DB Server (For Illustration Only)
5 SharePoint 2010 – Designing and Implementing a Medium Farm http://www.dell.com/downloads/global/services/dell_medium_sharepoint_farm.pdf
7
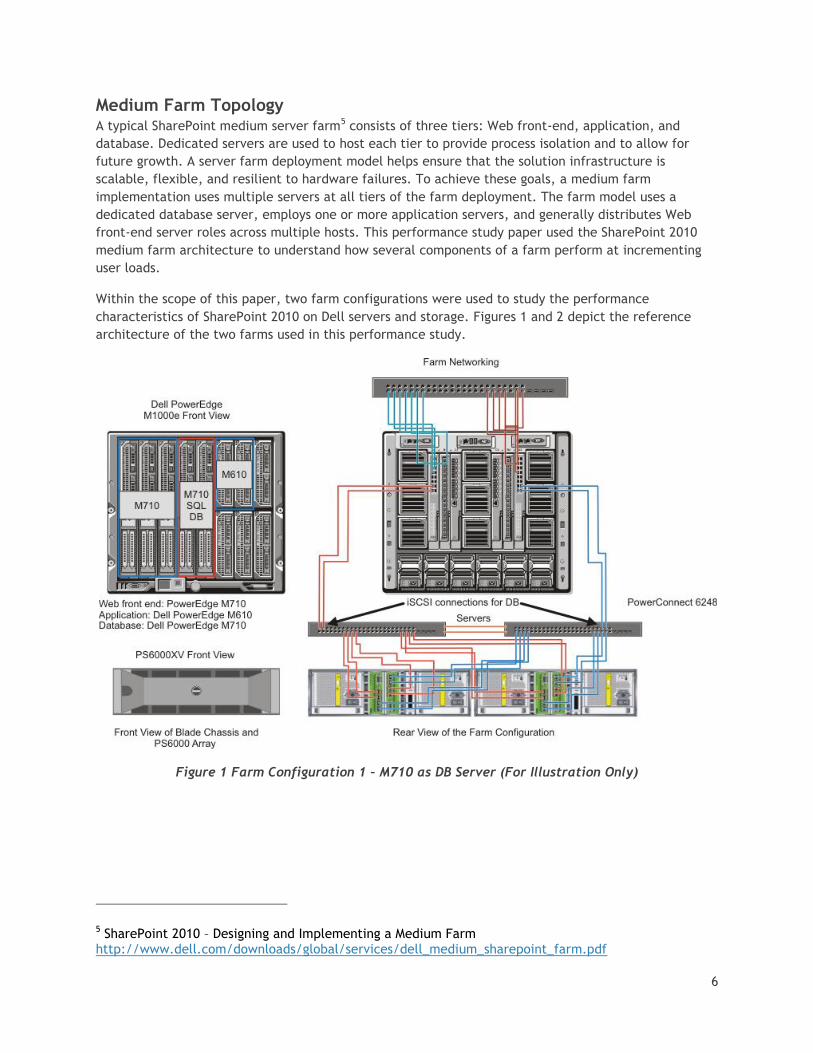
Figure 2 Farm Configuration 2 – M910 as DB Server (For Illustration Only)
As shown in Figures 1 and 2, the two farm configuration used in the performance study employed Dell
PowerEdge blade servers in a Dell PowerEdge M1000e blade enclosure at all tiers and Dell EqualLogic
storage arrays for the database backend. These two SharePoint farms are identical at all tiers except
the database tier. Farm configuration 1 (Figure 1) used Dell PowerEdge M710 for the DB backend and
Dell PowerEdge M910 server was used in farm configuration 2 (Figure 2) for the DB backend.
The choice of two server models for database tier provides an opportunity to compare the performance
differences when using Dell PowerEdge M710 and Dell PowerEdge M910. These two are full-height blade
servers designed for performance intensive applications and compute-intensive business critical
applications. In addition, the M910 blade server is equipped with 4 socket Intel® Xeon® 7500/6500
Series processors which include up to 8 cores per CPU. This provides great scalability for future growth
of the farm.
Table 1 provides an overview of server and storage hardware used in these two farm deployments.
Table 2 provides complete configuration details of each server used within the two farm configurations
shown in Table 1.

8
Table 1 Overview of Farm Configuration
Farm Configuration 1 Farm Configuration 2
Blade Chassis (1) M1000e with (2) Ethernet pass-through modules
(1) M1000e with (2) Ethernet pass-through modules
Web front-end Servers Three Dell PowerEdge M710 Servers
Three Dell PowerEdge M710 Servers
Application Servers Two Dell PowerEdge M610 Servers
Two Dell PowerEdge M610 Servers
Database Servers Two Dell PowerEdge M710 Servers
Two Dell PowerEdge M910 Servers
Storage Arrays Two Dell EqualLogic PS6000XV Arrays
Two Dell EqualLogic PS6000XV Arrays
Table 2 Blade Server Configuration Details
Blade Server Configuration
Server Role Web front-End Application Server Database Server (Farm 1)
Database Server (Farm 2)
Server Model
M710 M610 M710 M910
Processor Two Intel Xeon X5570 2.93GHz, 12MB cache
Two Intel Xeon X5570 2.93GHz, 12MB cache
Two Intel Xeon X5570 2.93GHz, 12MB cache
Two Intel Xeon L7545 1.86GHz, 18MB cache (Nehalem EX, 4S)
Memory 12GB (6 x 2GB, DDR3)
12GB (6 x 2GB, DDR3) 24GB (6 x 4GB, DDR3) 32GB (8 x 4GB, DDR3)
Local storage
2 x RAID 1 connected to SAS 6i
1 x RAID 1 connected to SAS 6i
2 x RAID 1 connected to SAS 6i
1 x RAID 1 connected to SAS 6i
Drives 4 x 146GB, 15K RPM SAS Drives
2 x 146GB, 15K RPM drives
4 x 146GB, 15K RPM SAS Drives
2 x 146GB, 15K RPM SAS Drives
Network Controller
Two Broadcom LOMs in a load balancing team
Two Broadcom LOMs in a load balancing team
2 x Two Broadcom LOMs for Public and iSCSI network connections
2 x Two Broadcom LOMs for Public and iSCSI network connections
The following sections describe the servers chosen for each of the farm roles and provide a technical
overview of the servers used in this performance study.
Dell PowerEdge M1000e Blade Enclosure
The PowerEdge M1000e modular blade enclosure is the foundation for Dell’s blade server architecture,
providing one of the most energy efficient, extremely reliable, flexible, and manageable blade server
platforms in the market for building any IT infrastructure. Flexible and scalable, the M1000e is
designed to support future generations of blade technologies regardless of processor/chipset
architecture. The M1000e is optimized for use with all Dell PowerEdge Blades including the M610, M710
and M910 blades servers. Features include:
9
Energy Efficiency: M1000e is built on Dell’s energy smart technology which can help customers
to increase capacity and to lower operating costs while delivering better performance/watt.
Effortless Scalability: with scale on-demand switch design and additional I/O slots and switch
options, the M1000e provides a flexibility to meet the increasing demand for I/O consumption.
Plus, Dell’s FlexIO modular switch technology offers a great scalability.
Powerful Management Tool: M1000e includes centralized management controllers, dynamic
power management, and real-time reporting service for IT administrators to manage and
monitor multiple enclosures and blades from a single console.
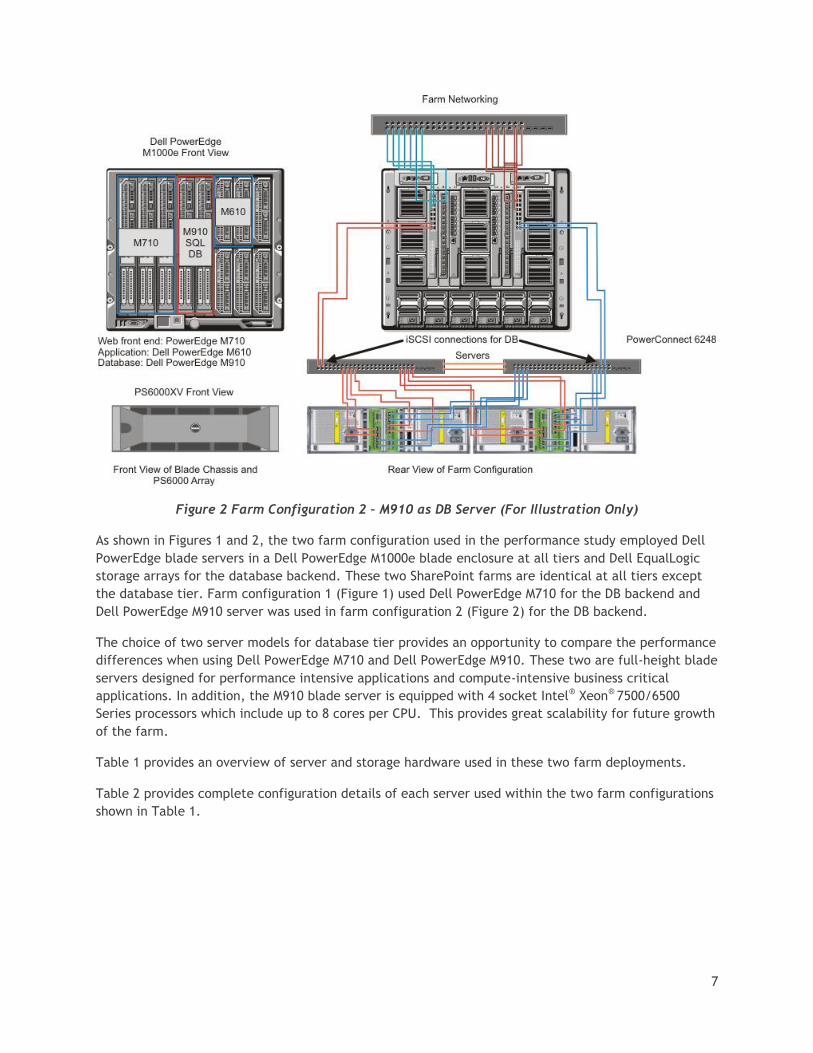
As shown in Figure 1, this performance study paper used a PowerEdge M1000e blade enclosure with five
PowerEdge M710 full-height blades, two PowerEdge M610 half-height blades, and two Dell Ethernet
pass-through IO modules for network connectivity. Figure 3, which is not an actual representation of
blade server, shows how the network connections map from the blade servers to the I/O modules at
the rear of the chassis.
Figure 3 Blade Server to I/O Module Mapping
As shown in Figure 3, two network connections from each blade were configured in a team to increase
the overall network bandwidth and to provide failover. The database server used two LOM connections
with MPIO for the iSCSI storage network and two more LOMs in a team for the farm network.
Dell PowerEdge M610
The PowerEdge M6106 is a two-socket, half-height blade server that supports up to 192GB of physical
RAM with 12 x 16GB DDR3 DIMMs. The M610 blade server supports the latest quad-core and six-core
Intel Xeon processors and up to two internal SAS disk drives. This server supports a maximum internal
disk storage capacity of 600GB when using 2 x 300GB, 10K RPM SAS drives in a RAID 0 configuration.
6 Dell PowerEdge M610 blade server spec sheet - http://www.dell.com/downloads/global/products/pedge/en/server-poweredge-m610-m710-specs-en.pdf
10
Within the scope of this performance study paper, the M610 blade server was used for the application
server role running the crawler service. Both the farm configurations (as shown in Figures 1 and 2) used
2 x 146GB, 15K RPM SAS drives connected to a SAS 6iR controller and configured in a RAID 1 for the OS
disk. With the new search architecture, SharePoint 2010 does not store the index content on the
application server and hence reduces the needs for disk space on the application server. This along
with higher processor and memory capacity makes the PowerEdge M610 the best choice for an
application server running crawler role.
Dell PowerEdge M710
The PowerEdge M7107 is a two-socket, full-height blade server with support for up to 192GB of physical
RAM and the latest quad-core and six-core Intel Xeon processors. The M710 supports a maximum
internal disk storage capacity of 1.2TB when using 4 x 300GB, 10K RPM SAS drives in a RAID 0
configuration. The PowerEdge M710 has more PCIe expansion slots (4) than M610 (2). This server
supports up to four 1GB network connections without using any additional expansion cards.
Within the scope of this performance study paper, the PowerEdge M710 server was used at the web
front-end, database tiers of farm configuration 1 (Figure 1) and web front-end tier of farm
configuration 2 (Figure 2). At all tiers and in both farm configurations, 4 x 146GB, 15K RPM drives were
used and configured as two RAID 1 volumes.
Dell PowerEdge M910
The PowerEdge M9108 is a four-socket, full-height blade server with support of up to 512GB of physical
RAM (32 x 16GB DDR3 DIMMs) and the latest quad, six and eight core Intel Xeon 7500/6500 series
processors. This server supports maximum of 2 internal SAS disk drives and hence the maximum
internal storage capacity is 600GB when using 2 x 300GB, 10K RPM SAS drives in a RAID 0 configuration.
Similar to the PowerEdge M710, the M910 also supports four 1GB network ports without any additional
I/O expansion cards.
Within the scope of this performance study paper, the PowerEdge M910 server was used at the
database tier of farm configuration 2 (Figure 2). The enormous processing power and physical memory
capacity makes this server the best choice for a database server.
Dell EqualLogic PS6000XV Storage Arrays
The Dell EqualLogic PS6000XV is a virtualized iSCSI storage area network (SAN) that combines
intelligence and automation with fault tolerance to provide simplified administration, enterprise
performance and reliability, and seamless scalability.
A PS Series array provides the following features:
No-single-point-of-failure hardware: o Redundant, hot-swappable hardware components—disks, control modules, fans, and
power supplies. o Component failover and disk sparing occur automatically without user intervention or
disrupting data availability. o RAID technology provides data protection in each array.
7 Dell PowerEdge M710 blade server spec sheet - http://www.dell.com/downloads/global/products/pedge/en/server-poweredge-m610-m710-specs-en.pdf 8 Dell PowerEdge M910 blade server spec sheet - http://www.dell.com/downloads/global/products/pedge/m910_spec_sheet_pt.pdf
11
High-performance control modules: The PS6000 control module has four 1 Gigabit Ethernet
interfaces.
Support for standard Gigabit Ethernet networks.
9.In this SharePoint 2010 farm configuration, two PS6000XV arrays each with sixteen 15K RPM, 300GB SAS drives were used. These 32 drives in a single RAID10 storage pool provide sufficient I/O bandwidth and capacity for the SharePoint databases9 in a medium SharePoint farm.
Farm Architecture and Configuration of Farm Roles
Both the experimental farms used the same physical architecture, as shown in Figures 1 and 2, with
three WFEs, two application servers and two database servers in a failover cluster. Both farms were
configured to use Windows authentication and hence all the requests during the load test were
authenticated requests.
The farm servers at all tiers used teamed network connections to provide load balancing and failover
capabilities.
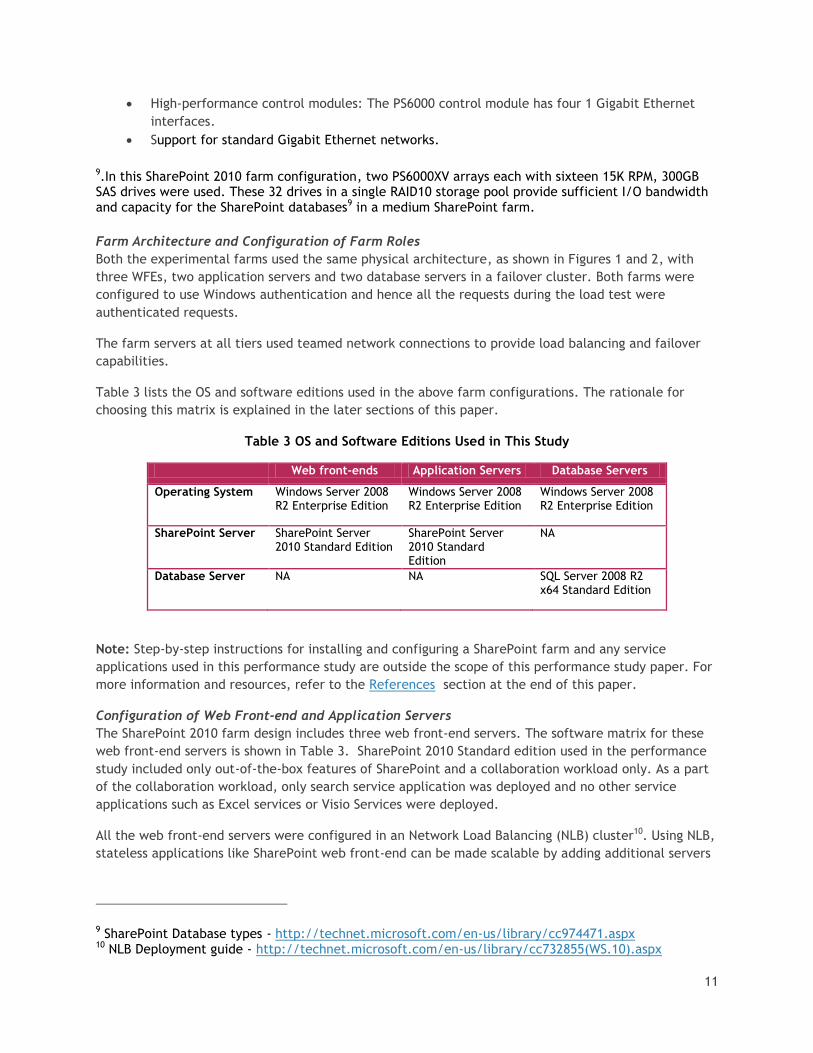
Table 3 lists the OS and software editions used in the above farm configurations. The rationale for
choosing this matrix is explained in the later sections of this paper.
Table 3 OS and Software Editions Used in This Study
Web front-ends Application Servers Database Servers
Operating System Windows Server 2008 R2 Enterprise Edition
Windows Server 2008 R2 Enterprise Edition
Windows Server 2008 R2 Enterprise Edition
SharePoint Server SharePoint Server 2010 Standard Edition
SharePoint Server 2010 Standard Edition
NA
Database Server NA NA SQL Server 2008 R2 x64 Standard Edition
Note: Step-by-step instructions for installing and configuring a SharePoint farm and any service
applications used in this performance study are outside the scope of this performance study paper. For
more information and resources, refer to the References section at the end of this paper.
Configuration of Web Front-end and Application Servers
The SharePoint 2010 farm design includes three web front-end servers. The software matrix for these
web front-end servers is shown in Table 3. SharePoint 2010 Standard edition used in the performance
study included only out-of-the-box features of SharePoint and a collaboration workload only. As a part
of the collaboration workload, only search service application was deployed and no other service
applications such as Excel services or Visio Services were deployed.
All the web front-end servers were configured in an Network Load Balancing (NLB) cluster10. Using NLB,
stateless applications like SharePoint web front-end can be made scalable by adding additional servers
9 SharePoint Database types - http://technet.microsoft.com/en-us/library/cc974471.aspx 10 NLB Deployment guide - http://technet.microsoft.com/en-us/library/cc732855(WS.10).aspx

12
when the load increases. Since the network connections were redundant by using Broadcom NIC
teaming, NLB was configured to use multicast mode to avoid IP address conflicts11 in the farm.
On both the PowerEdge M710 and M610 blade servers, simultaneous multi-threading or logical processor
support was enabled for increased performance. This option is disabled by default in the system BIOS
and needs to be enabled manually.
HTTP Request Throttling
SharePoint 2010 offers resource throttling features that can be configured to help increase server
performance and protect server resources during peak usage times. SharePoint 2010 has a default
timer job that checks server resources compared to configured throttle levels. By default, Server CPU,
Memory, Request in Queue, and Request Wait Time are monitored. After three unsuccessful checks,
the server enters a throttling period and remains in this state until a successful check is completed.
Requests generated prior to the server's entering throttling mode are completed. Any new HTTP GET
and Search Robot requests generate a 50312 error message and are logged in the event viewer.
The throttle settings can be modified to increase the overall load supported by the farm servers.
However, this itself requires a complete study to be able to determine accurate throttle setting
recommendations for any given user load or requests per second. The default HTTP throttle monitor
settings prevent an extensive load testing to find out the ―real‖ capacity of the farm servers. Hence,
HTTP request throttling was turned off during the load testing of SharePoint.
Search Service Application Configuration
SharePoint 2010 changed the search architecture and introduced high availability at the application
tier or crawler. The new search service application architecture in SharePoint 2010 includes greater
redundancy. The new design provides flexibility and allows the query and crawler roles to be scaled-
out separately on an as-needed basis. Search crawlers are now stateless; they do not store a copy of
the index. The index does, however, still propagate and is stored locally on the query servers. Two
application servers hosting the crawler role were used in this performance study. The query role was
hosted on two web front-end servers to provide better availability and improved search performance.
Both farm configurations used the same search service application configuration as shown in Figure 4.
Two application servers hosted the crawler role and the index partitions from these two crawlers were
placed on two web front-end servers. On all web front-ends, a dedicated RAID 1 volume stored the
index content. The two servers at the application tier provide redundancy for the crawler role and
improve the overall crawl performance during content indexing.
11 Using teaming adapters with network load balancing may cause network problems - http://support.microsoft.com/kb/278431 12 Throttling starts alert- Events 8032 8062 - http://technet.microsoft.com/en-us/library/ee513044.aspx
13
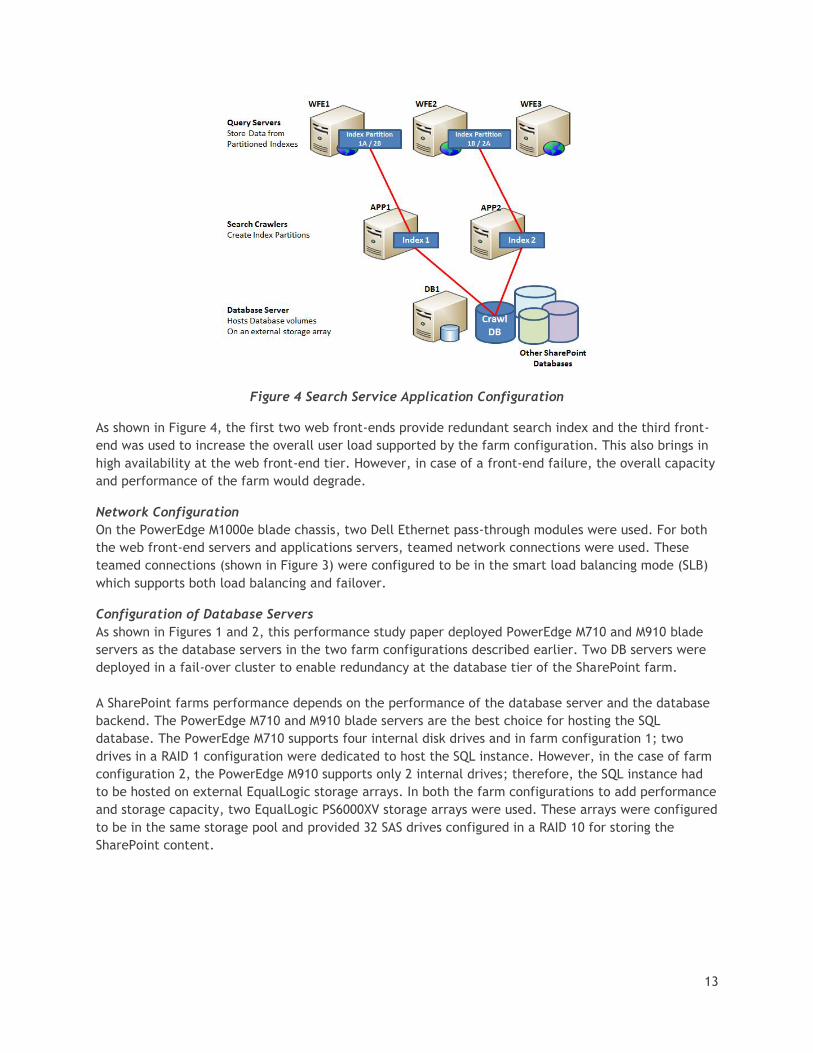
Figure 4 Search Service Application Configuration
As shown in Figure 4, the first two web front-ends provide redundant search index and the third front-
end was used to increase the overall user load supported by the farm configuration. This also brings in
high availability at the web front-end tier. However, in case of a front-end failure, the overall capacity
and performance of the farm would degrade.
Network Configuration
On the PowerEdge M1000e blade chassis, two Dell Ethernet pass-through modules were used. For both
the web front-end servers and applications servers, teamed network connections were used. These
teamed connections (shown in Figure 3) were configured to be in the smart load balancing mode (SLB)
which supports both load balancing and failover.
Configuration of Database Servers
As shown in Figures 1 and 2, this performance study paper deployed PowerEdge M710 and M910 blade
servers as the database servers in the two farm configurations described earlier. Two DB servers were
deployed in a fail-over cluster to enable redundancy at the database tier of the SharePoint farm.
A SharePoint farms performance depends on the performance of the database server and the database
backend. The PowerEdge M710 and M910 blade servers are the best choice for hosting the SQL
database. The PowerEdge M710 supports four internal disk drives and in farm configuration 1; two
drives in a RAID 1 configuration were dedicated to host the SQL instance. However, in the case of farm
configuration 2, the PowerEdge M910 supports only 2 internal drives; therefore, the SQL instance had
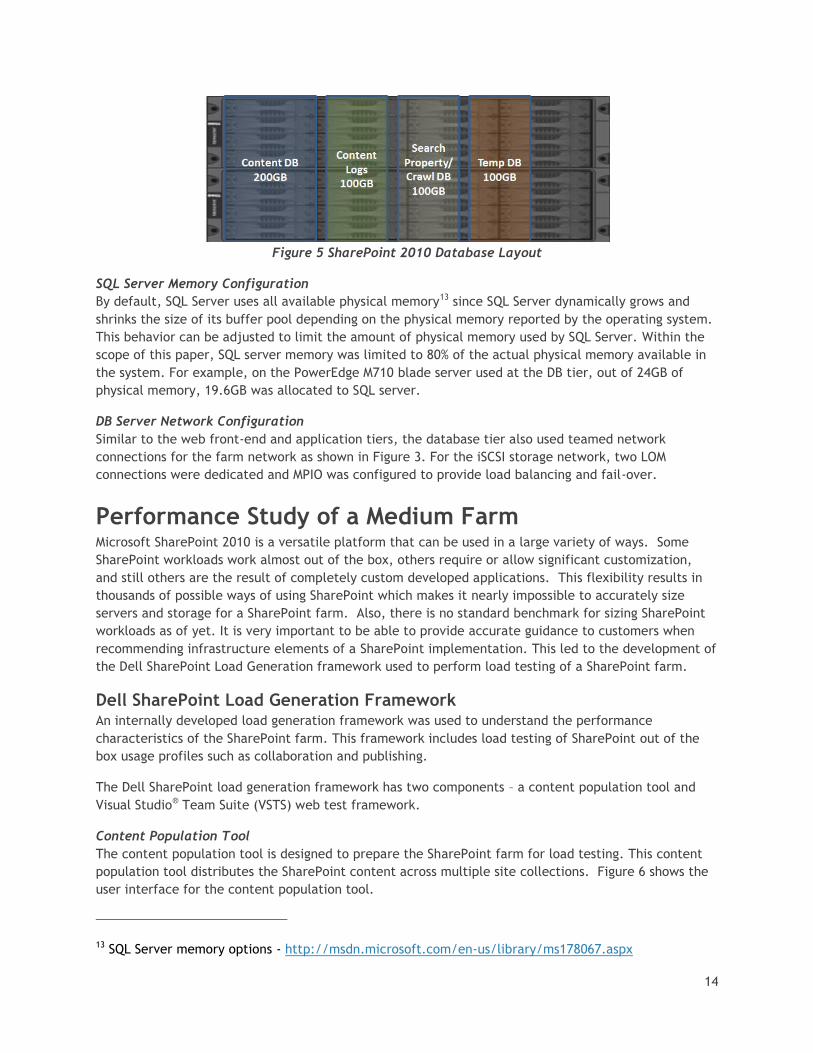
to be hosted on external EqualLogic storage arrays. In both the farm configurations to add performance
and storage capacity, two EqualLogic PS6000XV storage arrays were used. These arrays were configured
to be in the same storage pool and provided 32 SAS drives configured in a RAID 10 for storing the
SharePoint content.
14
Figure 5 SharePoint 2010 Database Layout
SQL Server Memory Configuration
By default, SQL Server uses all available physical memory13 since SQL Server dynamically grows and
shrinks the size of its buffer pool depending on the physical memory reported by the operating system.
This behavior can be adjusted to limit the amount of physical memory used by SQL Server. Within the
scope of this paper, SQL server memory was limited to 80% of the actual physical memory available in
the system. For example, on the PowerEdge M710 blade server used at the DB tier, out of 24GB of
physical memory, 19.6GB was allocated to SQL server.
DB Server Network Configuration
Similar to the web front-end and application tiers, the database tier also used teamed network
connections for the farm network as shown in Figure 3. For the iSCSI storage network, two LOM
connections were dedicated and MPIO was configured to provide load balancing and fail-over.
Performance Study of a Medium Farm Microsoft SharePoint 2010 is a versatile platform that can be used in a large variety of ways. Some
SharePoint workloads work almost out of the box, others require or allow significant customization,
and still others are the result of completely custom developed applications. This flexibility results in
thousands of possible ways of using SharePoint which makes it nearly impossible to accurately size
servers and storage for a SharePoint farm. Also, there is no standard benchmark for sizing SharePoint
workloads as of yet. It is very important to be able to provide accurate guidance to customers when
recommending infrastructure elements of a SharePoint implementation. This led to the development of
the Dell SharePoint Load Generation framework used to perform load testing of a SharePoint farm.
Dell SharePoint Load Generation Framework An internally developed load generation framework was used to understand the performance
characteristics of the SharePoint farm. This framework includes load testing of SharePoint out of the
box usage profiles such as collaboration and publishing.
The Dell SharePoint load generation framework has two components – a content population tool and
Visual Studio® Team Suite (VSTS) web test framework.
Content Population Tool
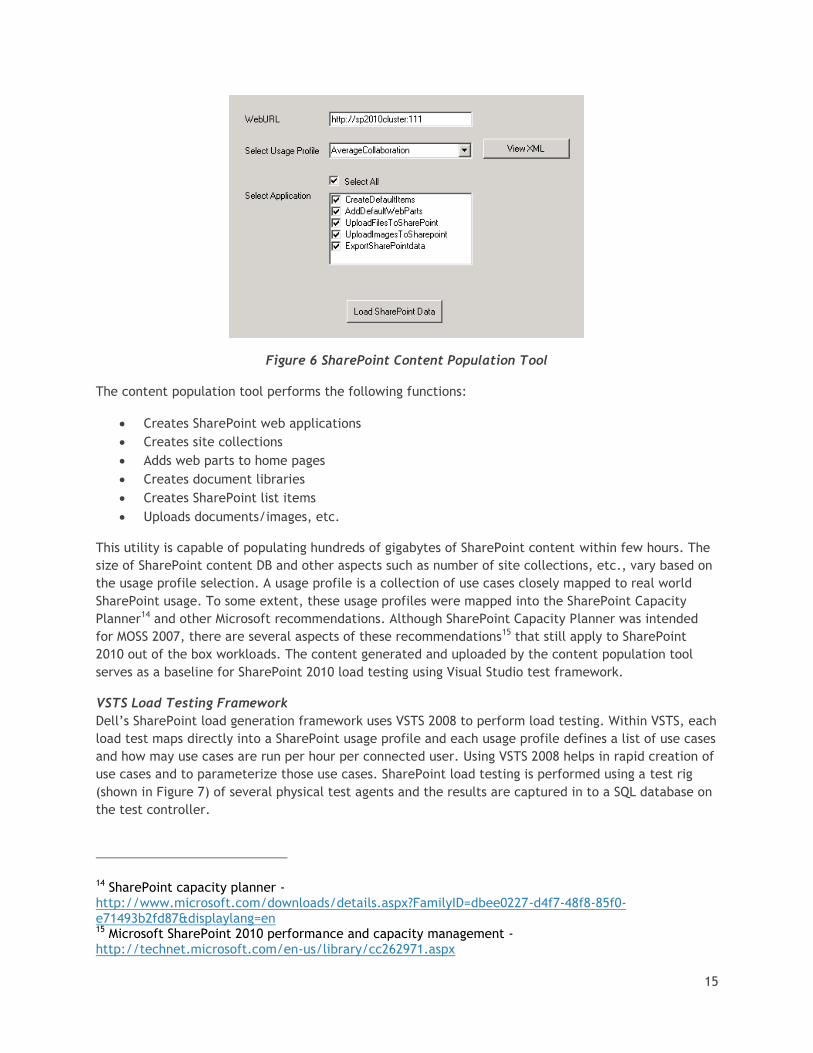
The content population tool is designed to prepare the SharePoint farm for load testing. This content
population tool distributes the SharePoint content across multiple site collections. Figure 6 shows the
user interface for the content population tool.
13 SQL Server memory options - http://msdn.microsoft.com/en-us/library/ms178067.aspx
15
Figure 6 SharePoint Content Population Tool
The content population tool performs the following functions:
Creates SharePoint web applications
Creates site collections
Adds web parts to home pages
Creates document libraries
Creates SharePoint list items
Uploads documents/images, etc.
This utility is capable of populating hundreds of gigabytes of SharePoint content within few hours. The
size of SharePoint content DB and other aspects such as number of site collections, etc., vary based on
the usage profile selection. A usage profile is a collection of use cases closely mapped to real world
SharePoint usage. To some extent, these usage profiles were mapped into the SharePoint Capacity
Planner14 and other Microsoft recommendations. Although SharePoint Capacity Planner was intended
for MOSS 2007, there are several aspects of these recommendations15 that still apply to SharePoint
2010 out of the box workloads. The content generated and uploaded by the content population tool
serves as a baseline for SharePoint 2010 load testing using Visual Studio test framework.
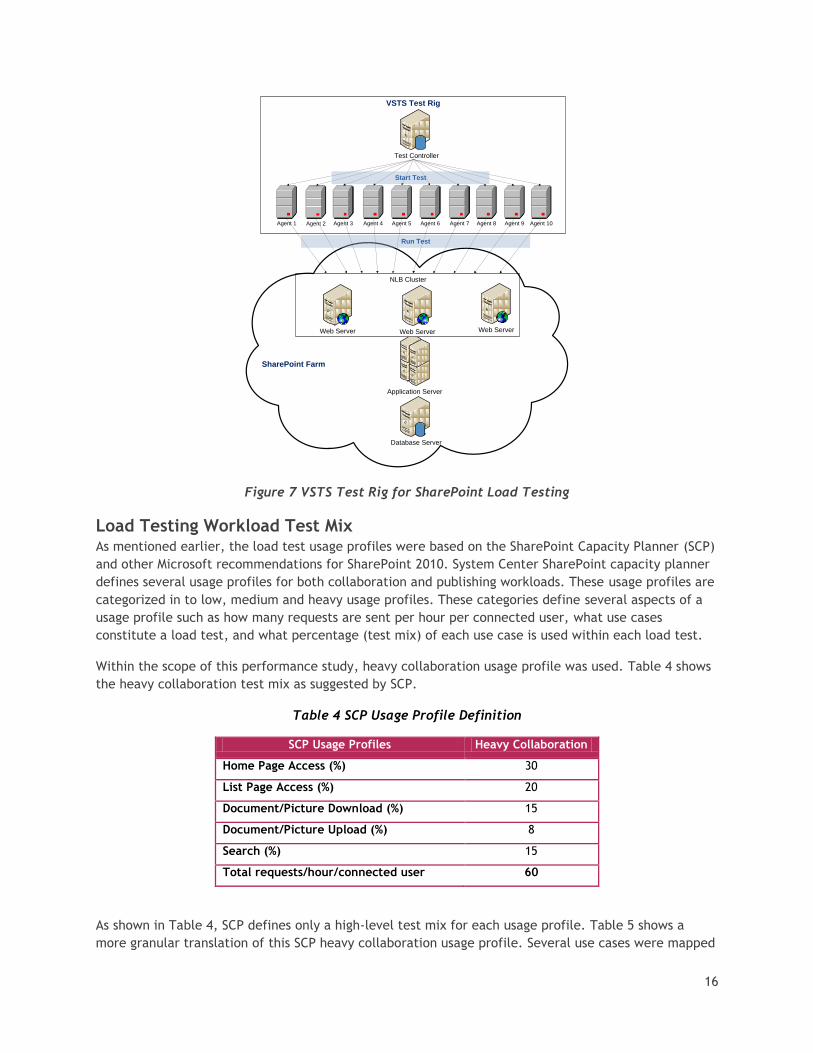
VSTS Load Testing Framework
Dell’s SharePoint load generation framework uses VSTS 2008 to perform load testing. Within VSTS, each
load test maps directly into a SharePoint usage profile and each usage profile defines a list of use cases
and how may use cases are run per hour per connected user. Using VSTS 2008 helps in rapid creation of
use cases and to parameterize those use cases. SharePoint load testing is performed using a test rig
(shown in Figure 7) of several physical test agents and the results are captured in to a SQL database on
the test controller.
14 SharePoint capacity planner - http://www.microsoft.com/downloads/details.aspx?FamilyID=dbee0227-d4f7-48f8-85f0-e71493b2fd87&displaylang=en 15 Microsoft SharePoint 2010 performance and capacity management - http://technet.microsoft.com/en-us/library/cc262971.aspx
16
VSTS Test Rig
Test Controller
Agent 1 Agent 2 Agent 3 Agent 4 Agent 5 Agent 6 Agent 7 Agent 8 Agent 9 Agent 10
Database Server
Application Server
NLB Cluster
Web Server
SharePoint Farm
Web Server Web Server
Start Test
Run Test
Figure 7 VSTS Test Rig for SharePoint Load Testing
Load Testing Workload Test Mix As mentioned earlier, the load test usage profiles were based on the SharePoint Capacity Planner (SCP)
and other Microsoft recommendations for SharePoint 2010. System Center SharePoint capacity planner
defines several usage profiles for both collaboration and publishing workloads. These usage profiles are
categorized in to low, medium and heavy usage profiles. These categories define several aspects of a
usage profile such as how many requests are sent per hour per connected user, what use cases
constitute a load test, and what percentage (test mix) of each use case is used within each load test.
Within the scope of this performance study, heavy collaboration usage profile was used. Table 4 shows
the heavy collaboration test mix as suggested by SCP.
Table 4 SCP Usage Profile Definition
SCP Usage Profiles Heavy Collaboration
Home Page Access (%) 30
List Page Access (%) 20
Document/Picture Download (%) 15
Document/Picture Upload (%) 8
Search (%) 15
Total requests/hour/connected user 60
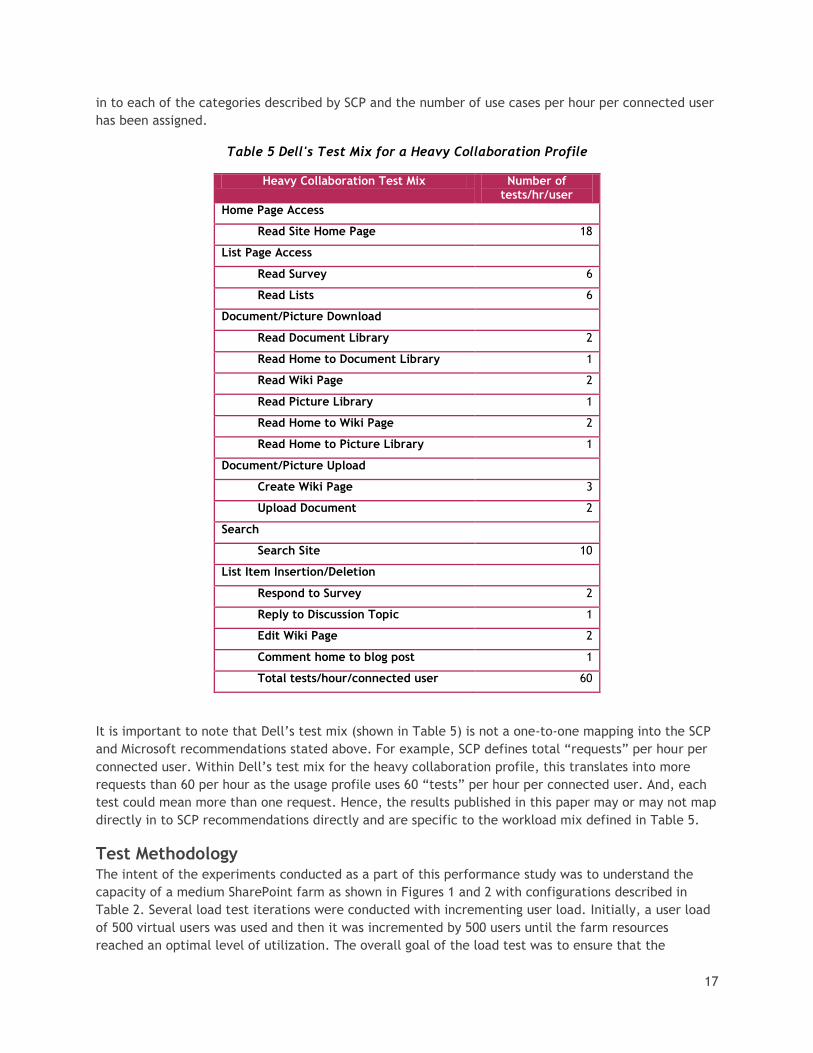
As shown in Table 4, SCP defines only a high-level test mix for each usage profile. Table 5 shows a
more granular translation of this SCP heavy collaboration usage profile. Several use cases were mapped
17
in to each of the categories described by SCP and the number of use cases per hour per connected user
has been assigned.
Table 5 Dell's Test Mix for a Heavy Collaboration Profile
Heavy Collaboration Test Mix Number of tests/hr/user
Home Page Access
Read Site Home Page 18
List Page Access
Read Survey 6
Read Lists 6
Document/Picture Download
Read Document Library 2
Read Home to Document Library 1
Read Wiki Page 2
Read Picture Library 1
Read Home to Wiki Page 2
Read Home to Picture Library 1
Document/Picture Upload
Create Wiki Page 3
Upload Document 2
Search
Search Site 10
List Item Insertion/Deletion
Respond to Survey 2
Reply to Discussion Topic 1
Edit Wiki Page 2
Comment home to blog post 1
Total tests/hour/connected user 60
It is important to note that Dell’s test mix (shown in Table 5) is not a one-to-one mapping into the SCP
and Microsoft recommendations stated above. For example, SCP defines total ―requests‖ per hour per
connected user. Within Dell’s test mix for the heavy collaboration profile, this translates into more
requests than 60 per hour as the usage profile uses 60 ―tests‖ per hour per connected user. And, each
test could mean more than one request. Hence, the results published in this paper may or may not map
directly in to SCP recommendations directly and are specific to the workload mix defined in Table 5.
Test Methodology The intent of the experiments conducted as a part of this performance study was to understand the
capacity of a medium SharePoint farm as shown in Figures 1 and 2 with configurations described in
Table 2. Several load test iterations were conducted with incrementing user load. Initially, a user load
of 500 virtual users was used and then it was incremented by 500 users until the farm resources
reached an optimal level of utilization. The overall goal of the load test was to ensure that the
18
processor utilization remained below 60% and the average farm response time was less than one
second.
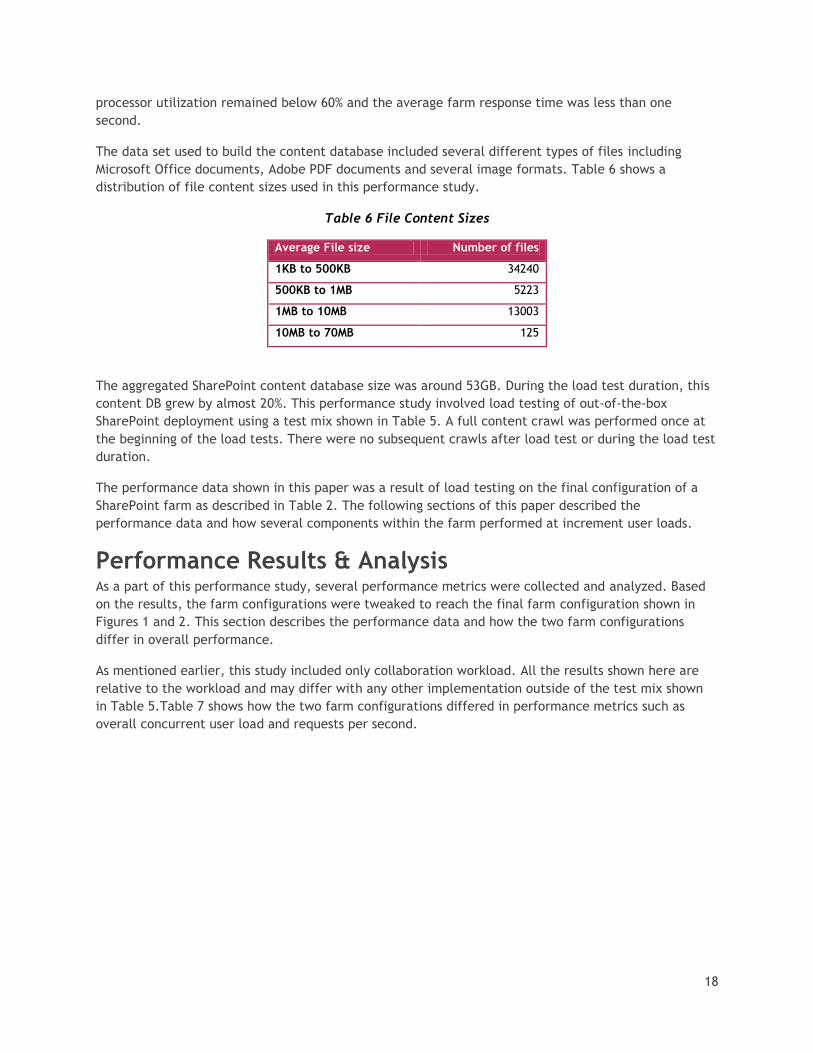
The data set used to build the content database included several different types of files including
Microsoft Office documents, Adobe PDF documents and several image formats. Table 6 shows a
distribution of file content sizes used in this performance study.
Table 6 File Content Sizes
Average File size Number of files
1KB to 500KB 34240
500KB to 1MB 5223
1MB to 10MB 13003
10MB to 70MB 125
The aggregated SharePoint content database size was around 53GB. During the load test duration, this
content DB grew by almost 20%. This performance study involved load testing of out-of-the-box
SharePoint deployment using a test mix shown in Table 5. A full content crawl was performed once at
the beginning of the load tests. There were no subsequent crawls after load test or during the load test
duration.
The performance data shown in this paper was a result of load testing on the final configuration of a
SharePoint farm as described in Table 2. The following sections of this paper described the
performance data and how several components within the farm performed at increment user loads.
Performance Results & Analysis As a part of this performance study, several performance metrics were collected and analyzed. Based
on the results, the farm configurations were tweaked to reach the final farm configuration shown in
Figures 1 and 2. This section describes the performance data and how the two farm configurations
differ in overall performance.
As mentioned earlier, this study included only collaboration workload. All the results shown here are
relative to the workload and may differ with any other implementation outside of the test mix shown
in Table 5.Table 7 shows how the two farm configurations differed in performance metrics such as
overall concurrent user load and requests per second.
19
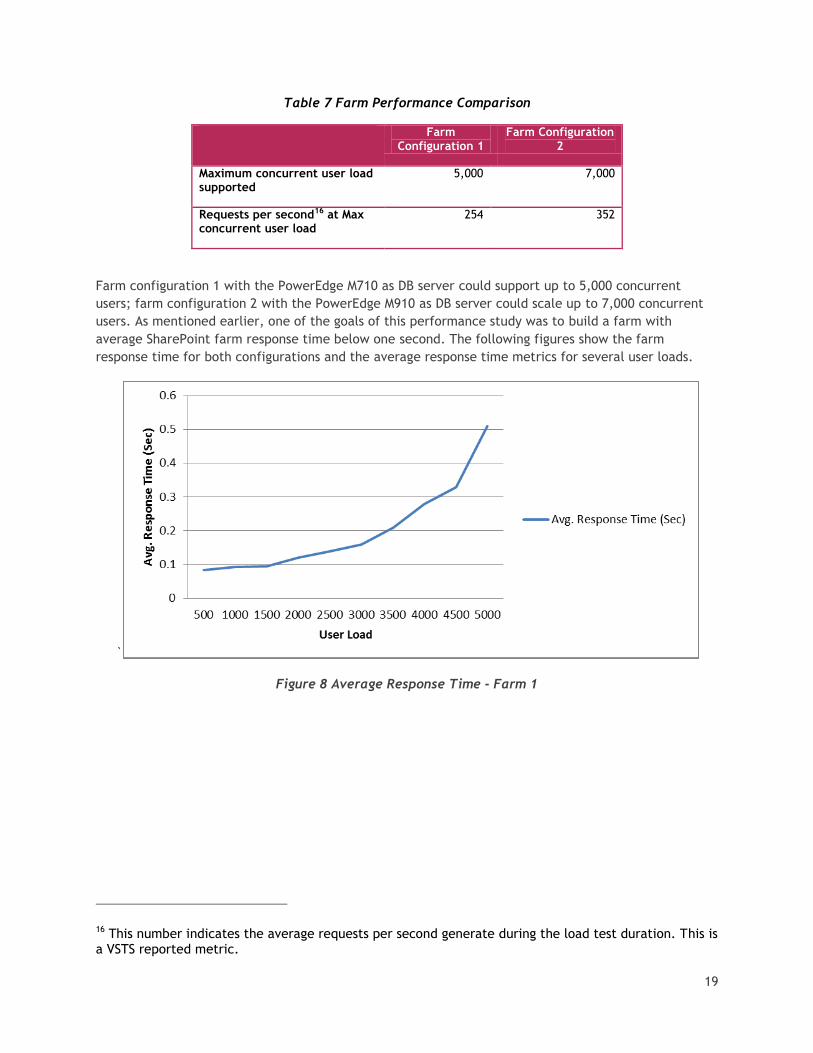
Table 7 Farm Performance Comparison
Farm Configuration 1
Farm Configuration 2
Maximum concurrent user load supported
5,000 7,000
Requests per second16 at Max concurrent user load
254 352
Farm configuration 1 with the PowerEdge M710 as DB server could support up to 5,000 concurrent
users; farm configuration 2 with the PowerEdge M910 as DB server could scale up to 7,000 concurrent
users. As mentioned earlier, one of the goals of this performance study was to build a farm with
average SharePoint farm response time below one second. The following figures show the farm
response time for both configurations and the average response time metrics for several user loads.
`
Figure 8 Average Response Time - Farm 1
16 This number indicates the average requests per second generate during the load test duration. This is a VSTS reported metric.

20
Figure 9 Average Response time - Farm 2
The average processor utilization on the web front-end servers in both farm configurations was below
50% even at the maximum user load. Since NLB was used at the web front-end tier, all WFEs were more
or less equally loaded.
Figure 10 Percentage of Processor Utilization - Farm 1
21
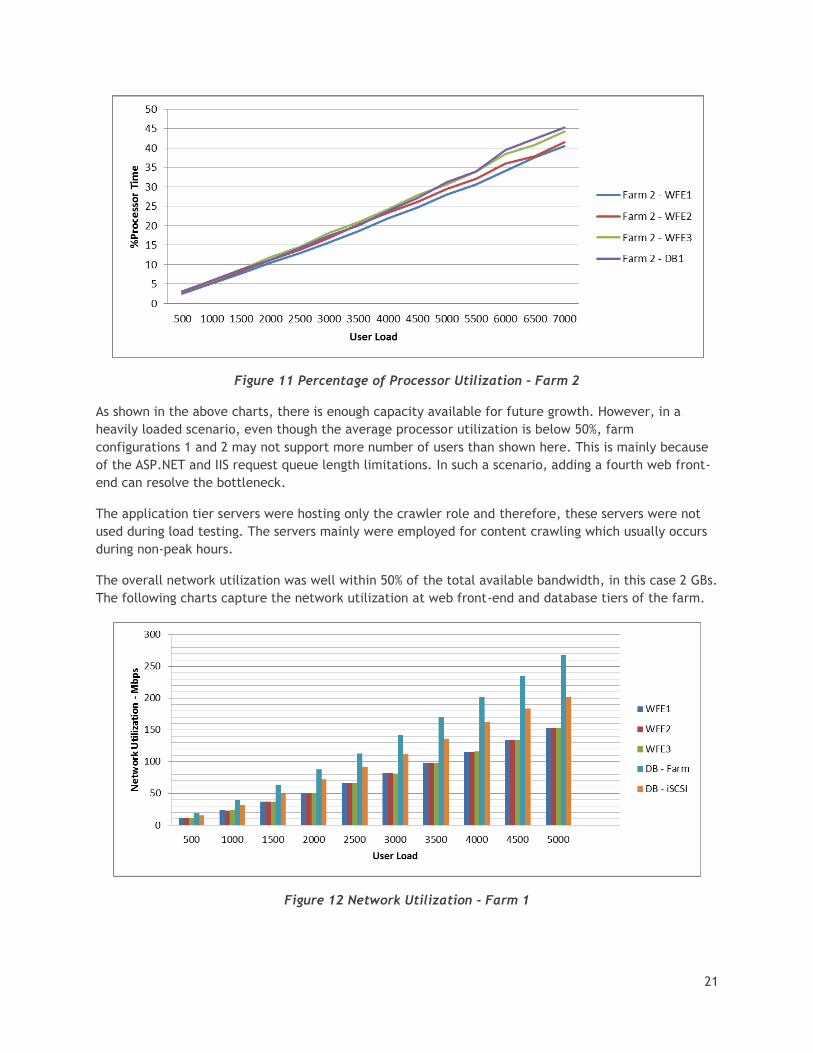
Figure 11 Percentage of Processor Utilization - Farm 2
As shown in the above charts, there is enough capacity available for future growth. However, in a
heavily loaded scenario, even though the average processor utilization is below 50%, farm
configurations 1 and 2 may not support more number of users than shown here. This is mainly because
of the ASP.NET and IIS request queue length limitations. In such a scenario, adding a fourth web front-
end can resolve the bottleneck.
The application tier servers were hosting only the crawler role and therefore, these servers were not
used during load testing. The servers mainly were employed for content crawling which usually occurs
during non-peak hours.
The overall network utilization was well within 50% of the total available bandwidth, in this case 2 GBs.
The following charts capture the network utilization at web front-end and database tiers of the farm.
Figure 12 Network Utilization - Farm 1
22
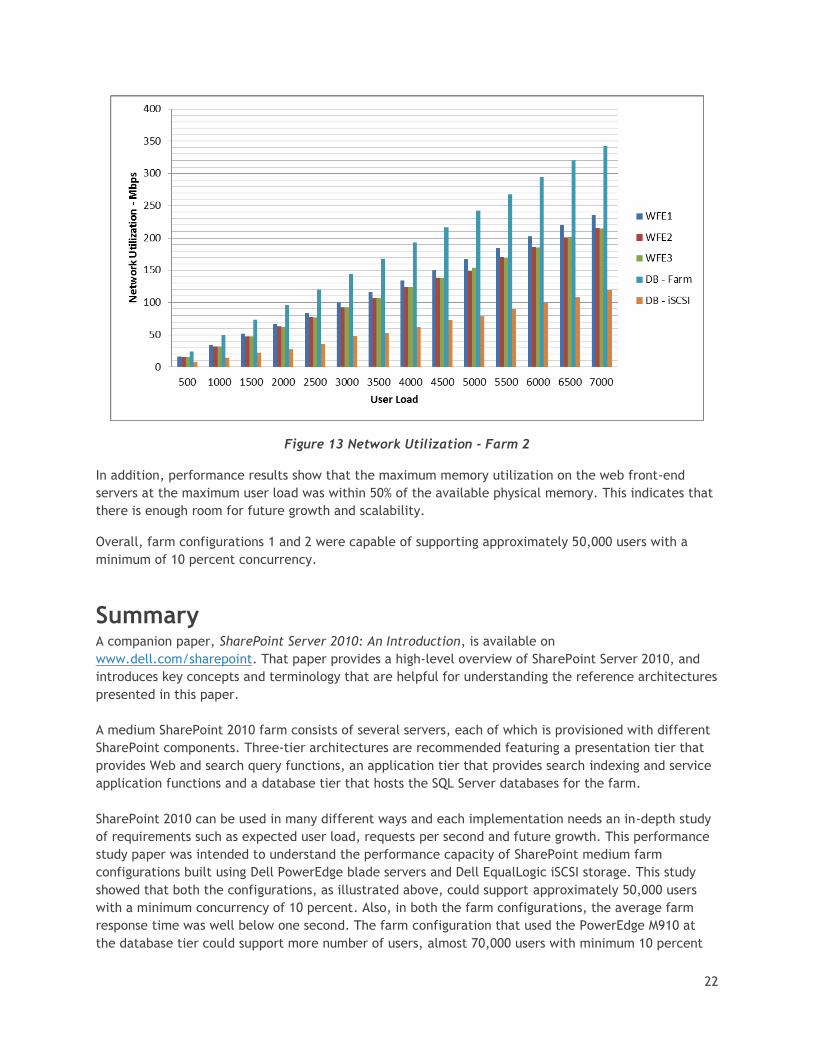
Figure 13 Network Utilization - Farm 2
In addition, performance results show that the maximum memory utilization on the web front-end
servers at the maximum user load was within 50% of the available physical memory. This indicates that
there is enough room for future growth and scalability.
Overall, farm configurations 1 and 2 were capable of supporting approximately 50,000 users with a
minimum of 10 percent concurrency.
Summary A companion paper, SharePoint Server 2010: An Introduction, is available on
www.dell.com/sharepoint. That paper provides a high-level overview of SharePoint Server 2010, and
introduces key concepts and terminology that are helpful for understanding the reference architectures
presented in this paper.
A medium SharePoint 2010 farm consists of several servers, each of which is provisioned with different
SharePoint components. Three-tier architectures are recommended featuring a presentation tier that
provides Web and search query functions, an application tier that provides search indexing and service
application functions and a database tier that hosts the SQL Server databases for the farm.
SharePoint 2010 can be used in many different ways and each implementation needs an in-depth study
of requirements such as expected user load, requests per second and future growth. This performance
study paper was intended to understand the performance capacity of SharePoint medium farm
configurations built using Dell PowerEdge blade servers and Dell EqualLogic iSCSI storage. This study
showed that both the configurations, as illustrated above, could support approximately 50,000 users
with a minimum concurrency of 10 percent. Also, in both the farm configurations, the average farm
response time was well below one second. The farm configuration that used the PowerEdge M910 at
the database tier could support more number of users, almost 70,000 users with minimum 10 percent
23
concurrency, than the farm with M710 as the DB server. This is essentially because of the performance
benefits of a four socket Nehalem EX and the memory architecture improvements in Dell PowerEdge
M910.
References Dell SharePoint solutions: http://dell.com/sharepoint
Microsoft SharePoint page: http://sharePoint.Microsoft.com
Microsoft SharePoint Technet: http://technet.microsoft.com/en-us/sharepoint/default.aspx
For EqualLogic documents: http://support.dell.com/support/edocs/SYSTEMS/equallogic/ For PowerEdge blade server documents: http://support.dell.com/support/edocs/systems/pem/ Updates for SharePoint 2010 products: http://technet.microsoft.com/en-us/sharepoint/ff800847.aspx Deploying multiple servers in a three-tier farm: http://technet.microsoft.com/en-us/library/ee805948.aspx


