11
Software tools used in Word & Excel
| Date post: | 25-Jul-2015 |
| Category: |
Presentations & Public Speaking |
| Upload: | mollywellz |
| View: | 284 times |
| Download: | 0 times |

Software tools used in Word & Excel

MICROSOFT WORD:
Creating the questionnaire:
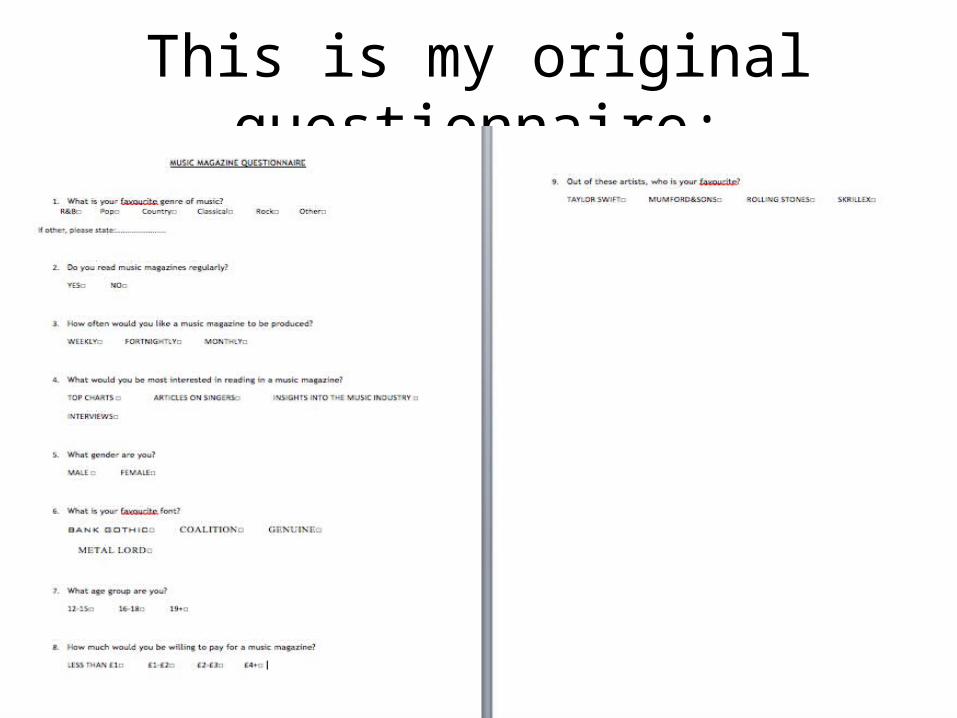
This is my original questionnaire:
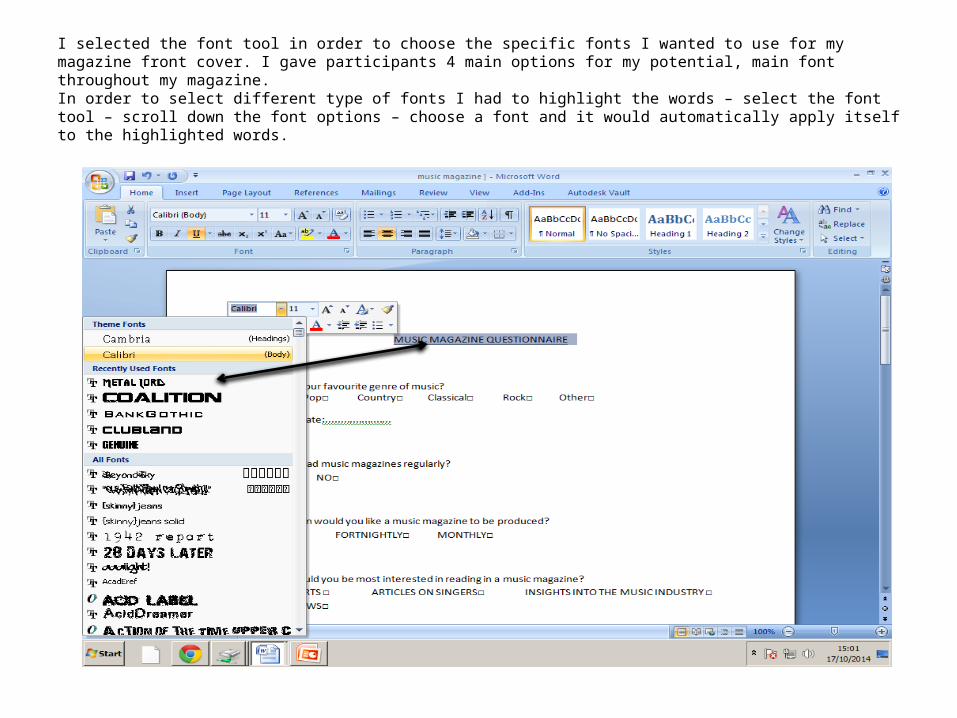
I selected the font tool in order to choose the specific fonts I wanted to use for my magazine front cover. I gave participants 4 main options for my potential, main font throughout my magazine. In order to select different type of fonts I had to highlight the words – select the font tool – scroll down the font options – choose a font and it would automatically apply itself to the highlighted words.
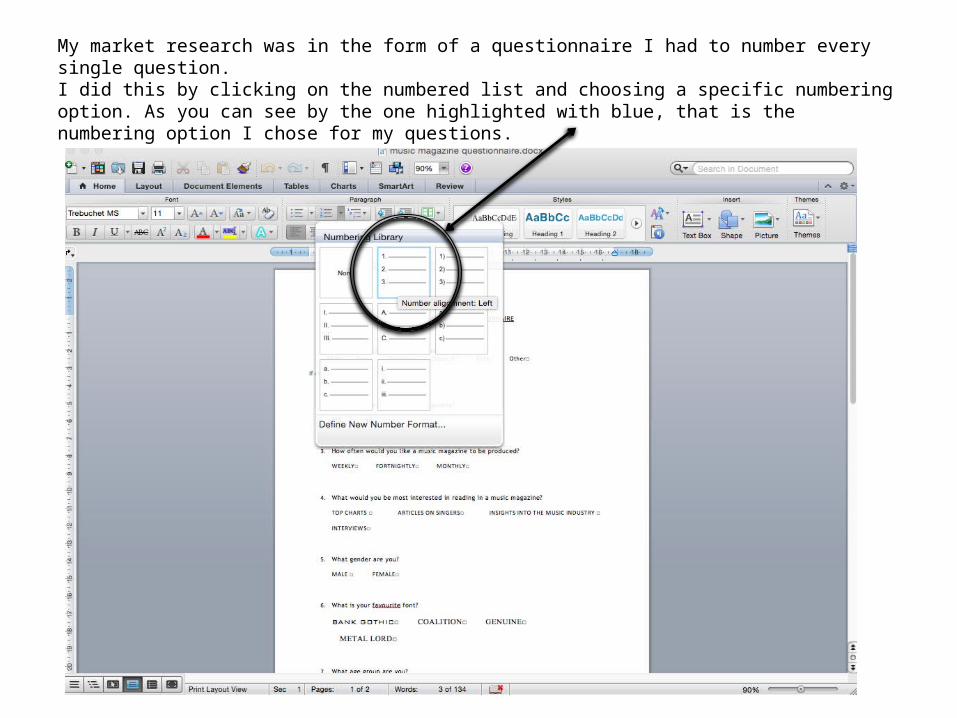
My market research was in the form of a questionnaire I had to number every single question. I did this by clicking on the numbered list and choosing a specific numbering option. As you can see by the one highlighted with blue, that is the numbering option I chose for my questions.

Because it was a questionnaire I also had to create spaces for participants to mark their answers so I could see their answers easily. I decided to create little boxes next to potential answers so that they could tick the ones they wanted to choose. As you can see via the screenshot all I had to do was go on to the symbol option and select which one I wanted. The one I wanted is in the navy blue box.

MICROSOFT EXCEL:
Analysing the results:
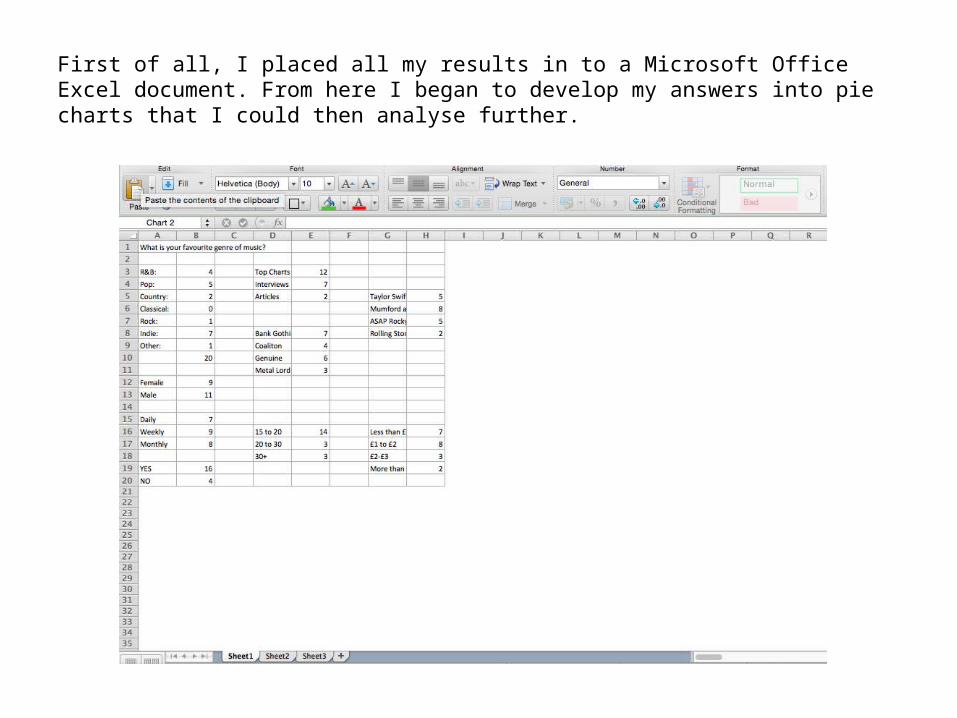
First of all, I placed all my results in to a Microsoft Office Excel document. From here I began to develop my answers into pie charts that I could then analyse further.
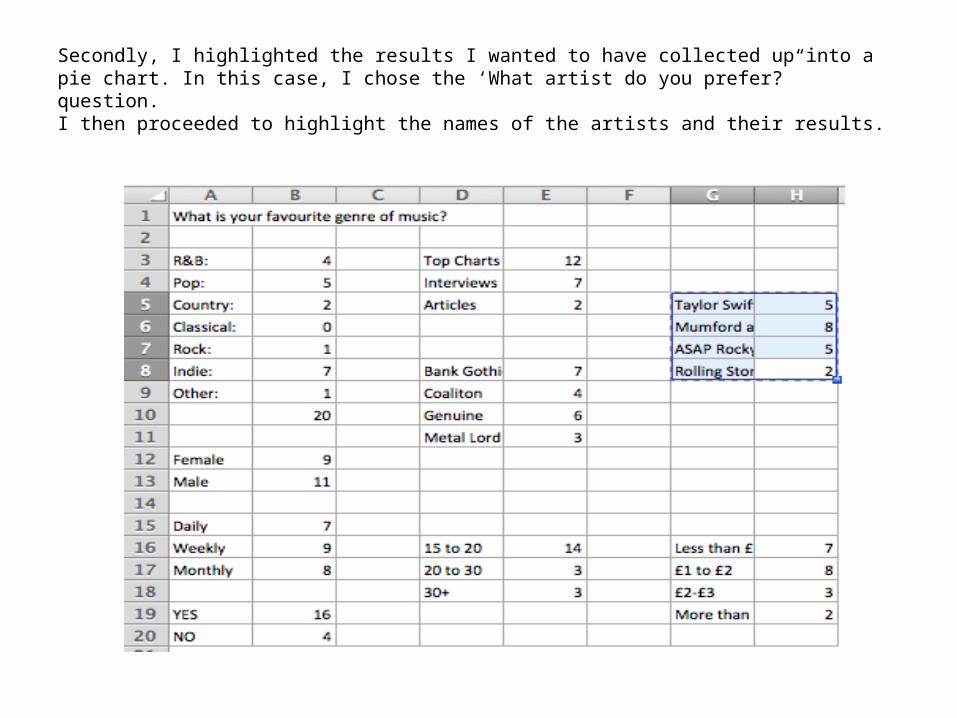
Secondly, I highlighted the results I wanted to have collected up into a pie chart. In this case, I chose the ‘What artist do you prefer?” question. I then proceeded to highlight the names of the artists and their results.

From there I clicked the ‘Charts’ option. Then I clicked ‘pie’ – and clicked the normal pie option (the one highlighted in green) – once I had clicked that button my pie chart was automatically made. (Refer to next slide in order to see completed pie chart)
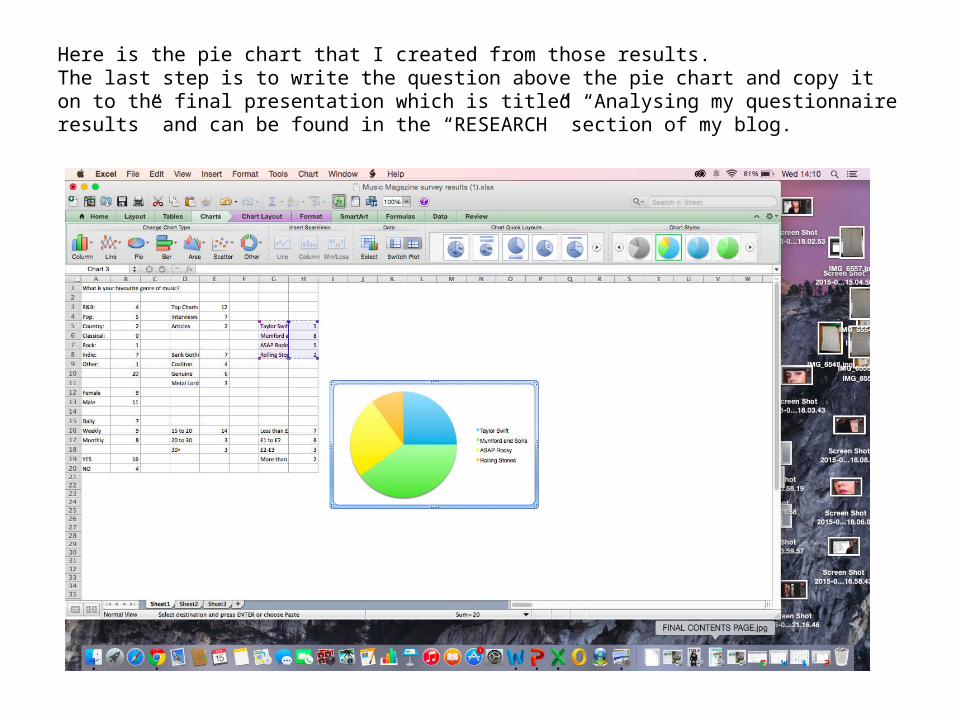
Here is the pie chart that I created from those results.The last step is to write the question above the pie chart and copy it on to the final presentation which is titled “Analysing my questionnaire results” and can be found in the “RESEARCH” section of my blog.


