Page 1
1
Microtopography matters for CH4 formation in a peat soil: a
combined inhibitor and 13C study
Johannes Krohn1, Ivana Lozanovska1,3, Yakov Kuzyakov1,2 and Maxim Dorodnikov1
1Department of Soil Science of Temperate Ecosystems, Faculty of Forest Sciences and Forest Ecology, Georg-August
University Göttingen, Büsgenweg 2, 37077 Göttingen, Germany 5 2Department of Agricultural Soil Science, Georg-August University Göttingen, Büsgenweg 2, 37077 Göttingen, Germany 3Present adress: Macedonian Ecological Society, Arhimedova 5, 1000 Skopje, Macedonia
Correspondence to: Dr. Maxim Dorodnikov ([email protected] )
Abstract. Peatlands’ microtopography units – hummocks and hollows – are mainly differing by hydrological characteristics 10
(water table level, i.e. oxic-anoxic conditions) and vegetation communities. These factors affect the fluxes of key greenhouse
gases (GHG) - methane (CH4) and carbon dioxide (CO2). However, the effects of microrelief forms on belowground CO2 and
CH4 production and pathways of methanogenesis need deeper understanding. We hypothesized increasing CH4 and CO2
production potentials from naturally drier hummocks to more wet hollows during anaerobic incubation. GHG production in
peat was expected to decrease with depth (decreasing inputs of recent plant-derived deposits) but the contribution of 15
hydrogenotrophic vs. acetoclastic pathway to the total methanogenesis should be higher in deeper peat layers as compared to
upper layers. To test the hypotheses, we measured CH4 and CO2 productions together with the respective δ13C values under
controlled anaerobic conditions with- and without addition of specific inhibitor of methanogenesis (2-bromo-ethane sulfonate,
BES) in a peat soil of hummocks and hollows of five depths (15, 50, 100, 150 and 200 cm). The concentration of BES (1 mM)
aimed to block acetoclastic but not the hydrogenotrophic pathway of methanogenesis. 20
As expected, CH4 production was ca. 2 times higher in hollows than in hummocks, though no differences in CO2 were
measured between the microforms. With depth, CO2 production rates decreased by 77% (15 cm vs. 200 cm) in both
microforms, whereby the highest CH4 production was measured at 15 cm in hollows (91% of total produced CH4) and at 50
cm in hummocks (82%). Noteworthy, at 15 cm of hummocks less than 1% of total CH4 production was observed. Decreasing
GHG production rates with depth positively correlated to an increase in the extractable total N and NH4+ concentrations. The 25
hydrogenotrophic pathway of methanogenesis in deep vs. surface layers was depicted by lower (more negative) δ13C-CH4 and
higher δ13C-CO2 values, respectively. Between the microforms, overall higher contribution of hydrogenotrophic vs.
Biogeosciences Discuss., doi:10.5194/bg-2016-162, 2016Manuscript under review for journal BiogeosciencesPublished: 30 May 2016c© Author(s) 2016. CC-BY 3.0 License.
Page 2
2
acetoclastic methanogenesis corresponded to hollows as compared to hummocks. Contrary to the expectation, the addition of
1mM BES was not selective and inhibited both pathways of methanogenesis. Concluding, peatlands’ microrelief is an
important factor regulating the GHG fluxes. However, the effects of microforms on the production of CH4 and pathways of 30
methanogenesis were pronounced for the upper 50 cm layer. Finally, inhibition with BES appeared to be less effective tool for
the partitioning between pathways of methanogenesis as compared with the isotope method.
Key words: Greenhouse gases, boreal peatland, microtopography, stable carbon isotope method, methanogenesis inhibitor, 2-
bromo-ethane sulfonate 35
1 Introduction
Northern peatlands historically have been a sink of atmospheric carbon dioxide (CO2) but also revealed their potential of
releasing large CO2 and methane (CH4) fluxes to the atmosphere as a result of environmental or anthropogenic forcing
(Limpens et al., 2008). Both are important greenhouse gases (GHG, IPCC, 2014) which balance in peatland ecosystems is 40
regulated by multiple environmental factors. Among them the water table level, which controls the aeration status of the peat
(Moore and Knowles, 1989; Moore and Roulet, 1993; Kettunen 2003), the peat quality, which reflects the decomposability of
constituent substances (Svensson and Sundh 1992; Yavitt et al., 2000), the vegetation, which regulates the peat quality, transfer
of gases belowground and to the atmosphere (Whiting and Chanton, 1993; Bubier et al., 1995) and the temperature, which
controls the metabolic rate of microorganisms (Crill et al., 1993; Granberg et al., 2001). Another important factor is the 45
peatlands’ microtopography, which highlights the role of location with specific physical and biochemical conditions, and
stipulates the interaction between the atmosphere, vegetation and the subjacent peat (Dorodnikov et al., 2011). Thus, depending
on a surface elevation three microrelief forms (microforms) are distinguished: elevated hummocks, depressed lawns and
intermediate lawns (Bubier et al., 1993). Two contrasting microforms – hummocks and hollows – distinctly differ by the water
table level, i.e. subsurface of water logged hollows is typically anaerobic as compared to drier hummocks thereby stressing the 50
difference in redox processes between two microforms (Kettunen, 2003). Furthermore, the plant species composition is closely
connected with the water table and moisture conditions (Waddington and Roulet, 1997). This controls the input of plant-
Biogeosciences Discuss., doi:10.5194/bg-2016-162, 2016Manuscript under review for journal BiogeosciencesPublished: 30 May 2016c© Author(s) 2016. CC-BY 3.0 License.
Page 3
3
derived deposits in the microforms, hence affects the carbon turnover and the formation and emission of GHG (Ström et al.,
2005). Most studies so far focused on aboveground GHG flux measurements to the atmosphere as related to the types of
microforms (Bubier et al., 1993; Dalva and Moore, 2001; Baird et al., 2009). But there is still not enough understanding of the 55
mechanisms controlling belowground CH4 and CO2 dynamics in profile layers below subsurface of microforms.
Generally, the CH4 cycling in peatlands consists of CH4 production (methanogenesis) in the anoxic parts of the soil by
microorganisms of the archaea type (methanogens) and CH4 oxidation (methanotrophy) in presumably oxic layers (Lai, 2009).
The process of methanogenesis involves two main pathways: (1) acetate cleavage (acetoclastic pathway), which mostly occurs
in the presence of fresh SOM and (2) CO2 reduction with hydrogen (H2) (hydrogenotrophic pathway) when other substrates 60
for methanogenesis are scarce (Hornibrook et al., 1997; Popp et al., 1999). CO2 production occurs during both anaerobic SOM
fermentation and methanogenesis, as well as in the oxic part of the soil by plant- and microbial respiration, together with
methanotrophy. As described above, peatland’s microforms are distinct by the thickness of aeration zone of peat and plant
communities which supply microorganisms with organic substrates. This in turn may affect the proportion of two
methanogenesis types between, e.g. hummocks and hollows and especially with depth (Dorodnikov et al., 2013). 65
Among other factors controlling CO2 and CH4 production in peatlands, deposition of some anions, such as ammonium (NH4+),
nitrate (NO3-), sulfate (SO4
2-), metals (Fe) could alter GHG fluxes (Eriksson et al., 2010; Sutton-Grier et. al., 2011). Supply of
peatlands with N and S compounds occurs mainly through the anthropogenic eutrophication of inland waters and/or acidic
deposition from the atmosphere (Sutton-Grier et. al., 2011). Along with the nutrition effect of N, S, Fe compounds for the
plant- and microbial communities, they participate in redox reactions as alternative electron acceptors (AEAs) when oxygen 70
availability is low. The presence of AEAs can reduce CH4 production due to a combination of inhibition and competitive
effects between methanotrophs and methanogens for electron donors (Bodegom and Stams, 1999; Eriksson et al., 2010).
Under laboratory conditions, the mechanisms involved in CH4 and related CO2 dynamics can be studied using an approach
involving a specific inhibitor of methanogenesis, 2-bromo-ethane sulfonate (BES). BES is known to inhibit the reductive
demethylation of methyl-Coenzyme M (Müller et al., 1993), a coenzyme responsible for methanogenesis. BES added at a 75
certain concentration reportedly inhibits the acetoclastic – but not the hydrogenotrophic pathway – of CH4 production (Zinder
et al., 1984). Therefore, amendment of peat soil with BES may help to reveal the distribution of methanogenesis pathways
Biogeosciences Discuss., doi:10.5194/bg-2016-162, 2016Manuscript under review for journal BiogeosciencesPublished: 30 May 2016c© Author(s) 2016. CC-BY 3.0 License.
Page 4
4
between microforms and with the depth. Another method is based on stable C isotope signatures (represented as δ13C values)
of CH4 and CO2 which reflect the CH4 pathway formation (Whiticar, 1999; Conrad, 2005). Thus, CH4 produced by the
acetoclactic pathway is less 13C depleted (e.g. shows higher δ13C values) than CH4 produced by the hydrogenotrophic pathway 80
(lower δ13C values) because of stronger discrimination against heavier 13C during the latter process (Whiticar et al., 1986;
Avery et al., 1999). The combination of both methods is assumed to provide strong evidence for the respective methanogenic
pathway. If the inhibitor BES is blocking CH4 production by the acetoclastic pathway, then the respective δ13C-CH4 signature
should decrease due to a higher contribution of 13C-depleted CH4 produced by the hydrogenotrophic pathway as compared to
the control (without inhibitor). Nonetheless, other important factors influencing δ13C in CO2 and CH4 (e.g. the δ13C value of 85
the organic substrate) have to be considered. Avery et al. (1999) and Steinmann et al. (2008) gained valuable information about
vertical and seasonal changes in isotopic composition of CH4 in peat profiles. We still, however, have very little information
about the effect of peatland microtopography on the patterns of CH4 and CO2 isotopic signatures (Dorodnikov et al., 2013).
This study was designed to cover two aspects. Firstly, to estimate the production potential of CH4 and CO2 in depth profiles
down to 200 cm below two contrasting microforms – wet hollows and dry hummocks. Secondly, to identify the contribution 90
of the two pathways of methanogenesis in peat depth layers below both microforms by adding BES and measuring δ13C in
CH4, CO2 and peat soil. The following hypotheses were tested:
I. Naturally more wet hollows will show a higher CH4 and CO2 production potential (microbial communities will be better
adapted to in vitro anaerobic conditions) as compared with drier hummocks.
II. Upper peat layers, which contain less decomposed organic matter, will show higher CH4 and CO2 production potentials in 95
contrast to deeper, more decomposed layers.
III. Peat layers of hollows and hummocks will be dominated by different pathways of methanogenesis due to differences in
substrate quality.
Finally, our research question was, whether the CO2 and CH4 production potentials of the tested peat soils could be linked to
their intrinsic chemical composition. 100
Biogeosciences Discuss., doi:10.5194/bg-2016-162, 2016Manuscript under review for journal BiogeosciencesPublished: 30 May 2016c© Author(s) 2016. CC-BY 3.0 License.
Page 5
5
2 Materials and Methods
2.1 Experimental site and peat soil collection
The experimental site is a central part of a natural minerogenic, oligotrophic low-sedge pine fen Salmisuo, located in the North
Karelian Biosphere Reserve (62°47´N, 30°56`E) in eastern Finland. A detailed description of the site is provided by several 105
authors (Saarnio et al., 1997; Alm et al., 1999; Becker et al., 2008; Jager et al., 2009). The surface of the sampling sites was
subdivided into three main microforms: 1) elevated dry hummocks, 2) depressed wet hollows and 3) intermediate lawns
(Becker et al., 2008), whereby the two contrasting microform types – hummocks and hollows – were tested in this study. Peat
samples were taken with a peat auger (Eijkelkamp Agrisearch Equipment, Giesbeek, Netherlands) – a stainless steel half-
cylindrical sampler (50 cm long, 6 cm wide) with a massive cone and a cutting edge, sealed off by a hooked blade. Soil was 110
sampled from both microform types and five depths: 15, 50, 100, 150 and 200 cm. Each true replicate consisted of a minimum
of three randomly picked cores, of which a middle 10 cm section was collected and aggregated. Each microform type and
depth horizon was sampled in triplicate.
2.2 CH4, CO2 production measurements and inhibition of methanogenesis
Aggregated peat soil samples from each depth and microform type (true replicates, n=3) were split for 5-6 pseudo replicates 115
of 15 g fresh weight and placed together with anaerobic indicator stripes (Microbiology Anaerotest, Merck, Darmstadt,
Germany) in 150 ml Mason jars, which were closed by butyl rubber septa and screw caps.
To create anaerobic conditions, the jars were connected to an evacuation line via needles with 3-way-stopcocks and flushed
with pure N2 for 20-30 min. After flushing, the jars were equilibrated to atmospheric pressure through a water lock and
immediately filled with 15 ml pure N2 to prevent air diffusion into the headspace and to enable subsequent sampling. The same 120
procedure was repeated every time before gas production measurements.
To collect gas samples, a 60-ml gas-tight syringe was used to sample ca. 20 ml headspace gas, which was immediately
transferred to a 12-ml pre-evacuated glass vial with overpressure. For a gas production measurement, four gas samples were
Biogeosciences Discuss., doi:10.5194/bg-2016-162, 2016Manuscript under review for journal BiogeosciencesPublished: 30 May 2016c© Author(s) 2016. CC-BY 3.0 License.
Page 6
6
taken with time intervals of 30-60 min after “zeroing” (headspace flush with N2). The overall sampling period lasted 49 days
for hollow and 79 days for hummock, with eight measurements for each microform type. 125
After the first four gas production measurements (at day 37 for microform type hollow and at day 54 for hummock), 2 ml of
the inhibitor BES (predissolved in O2-free milli-Q water) were added to respective BES-treated jars, whereas the rest of jars
served as controls. The effective BES concentration was determined prior in a testing experiment of CH4 production from the
same soil amended with 1, 10 and 100, mM of BES after Zinder et al. (1984) and Smemo and Yavitt (2007). The suppression
of CH4 formation with 1 mM concentration of BES was comparatively effective as by 10 and 100 mM (data not shown). Thus, 130
the lowest BES concentration was chosen in the main experiment. 1 mM BES was added through the 3-way-stopcocks (without
opening the jars) to three replicates of each depth. The same volume (2 ml) of O2-free milli-Q water was added to the remaining
control. The subsequent gas production measurements were performed in the same manner as before addition of inhibitor and
milli-Q water. Within the first days after BES amendment of hollows, no detectable difference in CH4 production was
observed; therefore, for hummocks, the GHG measurements started 9 days after adding BES. 135
During the experiment, all jars were stored at room temperature (about 22°C) in the dark to avoid any possible production of
oxygen by algae. CH4 and CO2 concentrations were measured on a gas chromatograph GC 6000 VEGASERIES 2 (Carlo Erba
Instruments) equipped with a flame ionization detector, an electron capture detector and a pressure-controlled autosampler for
64 samples. Detailed information on the equipment can be found in Loftfield et al. (1997).
2.3 δ13C analyses 140
To measure the stable C isotope composition in CO2 (shown as δ13C-CO2), 1 ml headspace gas sample was taken as described
above and diluted with pure N2 to obtain suitable concentrations for the analysis. The number of measurements was three for
hollow (all after addition of BES) and four for hummock (two before adding and two after adding BES). The diluted gas
samples were measured for δ13C-CO2 with a Cavity ring-down spectroscope (CRDS), Picarro G2131-i (Picarro, Inc., Santa
Clara, CA, USA). 145
Due to the requirements of the Isotope Ratio Mass Spectrometer (IRMS) for certain minimal CH4 concentrations, δ13C-CH4
could be measured only in three soil layers (15, 50 and 100 cm) of both microform types. A headspace gas sample of 15 ml
Biogeosciences Discuss., doi:10.5194/bg-2016-162, 2016Manuscript under review for journal BiogeosciencesPublished: 30 May 2016c© Author(s) 2016. CC-BY 3.0 License.
Page 7
7
was taken as described above and transferred to a 12-ml pre-evacuated glass vial for δ13C-CH4 measurement on a IRMS Delta
C with a Conflo III interface (both from Thermo Fischer Scientific, Bremen, Germany) at the Centre for Stable Isotope
Research and Analysis (KOSI), Büsgen-Institute, Georg August University Göttingen, Germany. 150
To measure δ13C in solid samples, the peat soil was dried at 40°C during several days, ball milled and weighed in tin caps.
Samples were combusted in a Flash 2000 elemental analyzer (Thermo Fisher Scientific, Cambridge, UK) and the 13C/12C ratio
was measured on a Delta V Advantage IRMS with the Conflo III interface (Thermo Electron, Bremen, Germany) at KOSI.
2.4 Measurement of dissolved total N, NO3- and NH4
+
Peat samples from both microforms and all depths were amended with DI-H2O in a proportion of 2:1 and shaken for 1.5 h. 155
The obtained peat extracts were thoroughly filtrated several times: first, through a coarse paper filter (595 ½, Whatman) into
50 ml centrifuge tubings. Then, to increase the output of solution from solid remnants, the latter were centrifuged at 2000 rpm
for 5 min in containers with porous bottom and glass fiber filters. The extra solution was filtrated again through a paper filter
and mixed with previously filtrated solution. The second filtration was done through fine syringe filters (Sartorius 0.20 μm
pore size with Luer lock, Göttingen, Germany) into 15-ml plastic centrifuge tubings. All filtrates were kept in a cold storage 160
room at a temperature of 4-6 °C prior to analysis. The concentrations of extractable N, NO3- and NH4
+ were measured
photometrically via Continuous-Flow-Analysis using multichannel peristaltic pumps (Cenco Instrumenten, Mij. N.V.Breda,
Netherlands).
2.5 Calculation of gas production, effects of BES and statistical analysis
To calculate a gas production rate, four CH4 and CO2 concentrations (as ppm and ppb values) measured in each soil sample 165
within 240-250 min were linearly approximated and the Ideal Gas Law was used to convert the concentration from ppm/ppb
to mass units per gram soil on a dry weight basis (ng g soil-1). The BES effect was determined for each microform and depth
by calculating the difference (in %) of the mean CH4 production rate before and after adding BES. The difference was then
corrected with respective control treatments and “weighted” against each other according to their contribution to the overall
CH4 production. 170
Biogeosciences Discuss., doi:10.5194/bg-2016-162, 2016Manuscript under review for journal BiogeosciencesPublished: 30 May 2016c© Author(s) 2016. CC-BY 3.0 License.
Page 8
8
The differences in CH4 productions between microforms and depths, as well as before and after adding BES, were evaluated
with two-way ANOVA and Fischer´s LSD test using STATISTICA 10.0 (StatSoft, USA). The required normality and
homogeneity of the data were checked with the Kolmogorov-Smirnov and the Levene´s test, respectively. The variables were
treated as independent for all depths below a microform type and for a certain depth between microforms. The significance of
differences was determined at P<0.05 level. 175
3 Results
3.1 CH4 and CO2 production depending on microforms and depth
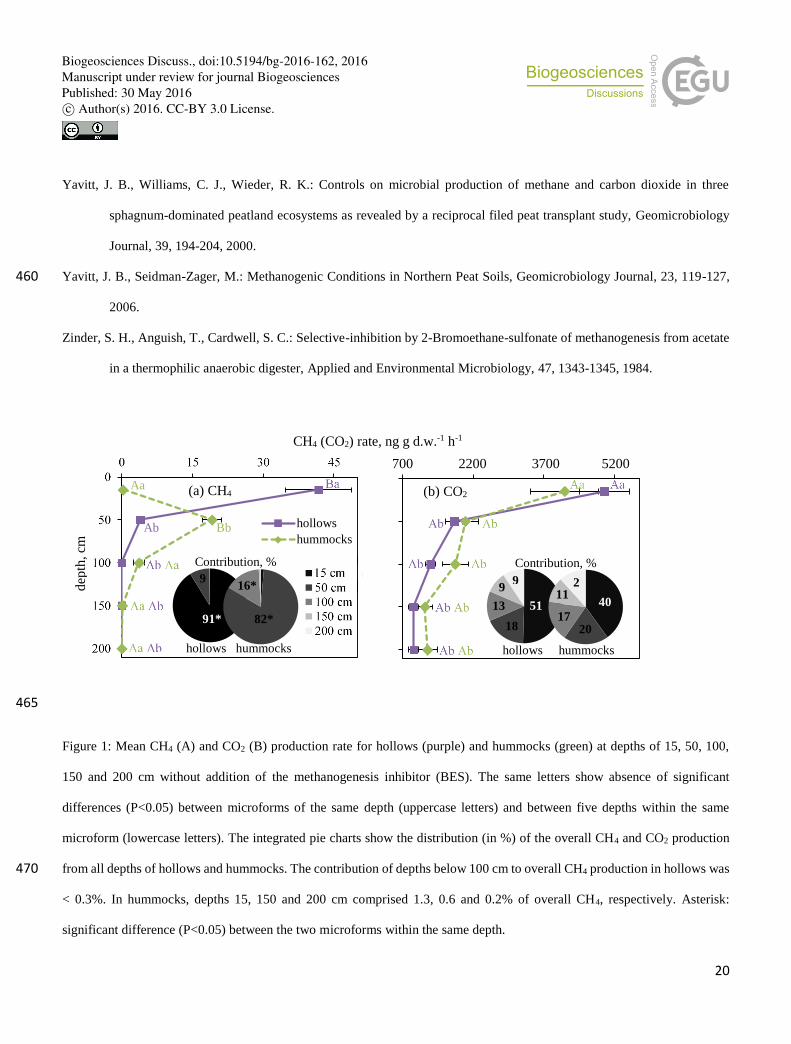
Based on the sum of CH4 production from all depths, hollows showed a significantly higher CH4 production than hummocks.
The top soil layer of hollow and the 50 cm depth of hummocks were the main locations for CH4 production (Fig. 1a). The CH4 180
production was 10.6 fold lower at 50 cm depth (3.9 ng CH4 g d.w.-1 h-1) as compared to the top 15 cm (41.7) in hollow, whereas
in hummocks, it was 64 fold lower at 15 cm (0.3) than at 50 cm (19.2) (Fig. 1a). Below 50 cm, CH4 production substantially
decreased to a minimum of <0.1 ng CH4 g d.w.-1 h-1 and there were no differences either between microforms or between
depths.
CO2 production did not differ between the two microforms at each depth, and the surfacesoil of both microforms contributed 185
40-51% to the overall CO2 production (Fig. 1b). The rate of CO2 production substantially decreased under both microforms
by ca. 77% from the top (15 cm: 4153-4997 ng CO2 g d.w.-1 h-1) to the bottom soil layer (200 cm: 923-1216 ng CO2 g d.w.-1
h-1). A significant decrease was observed from the top soil layer to a depth of 50 cm. The contribution of deeper soil layers
(50-200 cm) to the overall CO2 production varied between 9 and 20% (Fig. 1b).
3.2 Effects of BES on CH4 and CO2 production 190
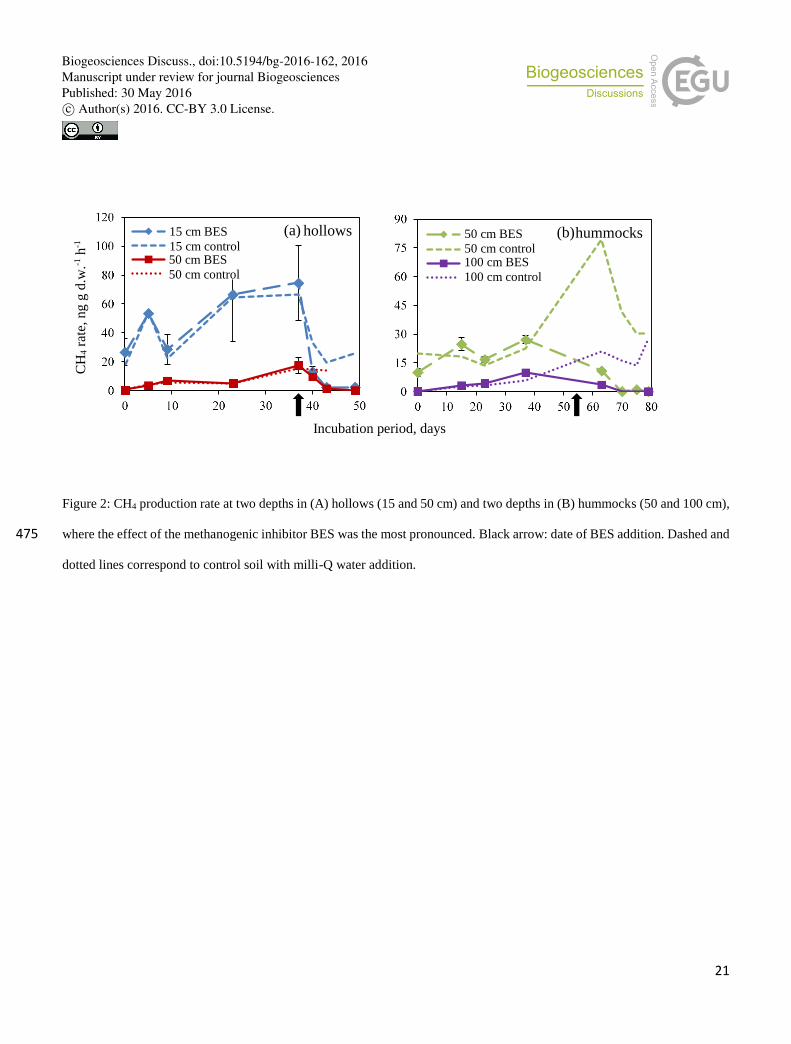
Soil layers which had the highest CH4 production prior adding the inhibitor BES, e.g. hollows 15, 50 cm and hummocks 50,
100 cm, generally showed an increasing trend of CH4 production over time (Fig. 2). The addition of BES substantially
suppressed CH4 production (Fig. 2; arrow: addition date).
Biogeosciences Discuss., doi:10.5194/bg-2016-162, 2016Manuscript under review for journal BiogeosciencesPublished: 30 May 2016c© Author(s) 2016. CC-BY 3.0 License.
Page 9
9
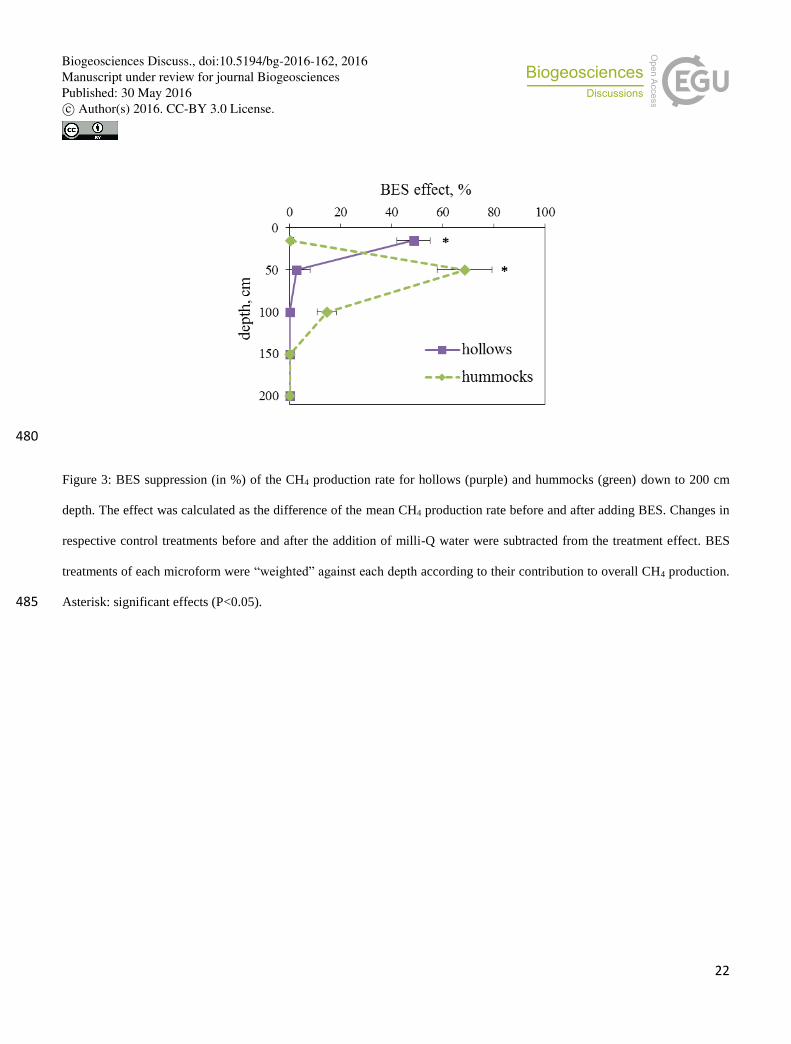
Among all depths and microforms, the suppressing effect of BES varied from 0 up to 68% (Fig. 3). Remarkably, adding milli-
Q water in control treatments yielded a decrease of CH4 production similar to BES (Fig. 2). This is probably due to trace 195
amounts of dissolved oxygen left after N2-bubbling. Therefore, the decrease of CH4 production after (versus before) BES
treatment was statistically significant solely at 50 cm depth in hummocks and at 15 cm depth in hollows (Fig. 3). In contrast
to the control treatments, however, BES effectively suppressed methanogenesis until the end of the incubation period (Fig. 2).
Contrary to CH4, the CO2 production did not change after adding BES (data not shown).
3.3 δ13C of CH4, CO2 and SOM 200
Generally, δ13C of CO2 substantially varied between depths, but the difference was less pronounced between microforms (Fig.
4a). CO2 from the top soil layer was the most depleted in 13C (δ13C-CO2 = -24‰ for hummocks and -29‰ for hollows), whereas
at 50 cm depth the δ13C-CO2 values were the highest (ca. -17‰). From 50 to 200 cm, a gradual depletion down to -21 to -24‰
occurred (Fig. 4a). Among microforms, δ13C-CO2 values were lower in hummocks than in hollows, although the pattern of
δ13C-CO2 change with depth was similar in both microforms. Differences between microforms were significant at depths of 205
15 and 150 cm (Fig. 4a).
In both microforms, δ13C-CH4 values strongly decreased with depth, ranging from -59‰ at 15 cm to -91‰ at 100 cm (Fig.
4b). The available data (for 50 and 100 cm) indicated significantly more depleted 13C-CH4 in hollows than in hummocks.
The stable C composition of peat SOM (δ13C-peat values) was measured at the 15, 50 and 200 cm layers of the two microforms
(Fig. 4c). The δ13C-peat values in the surface soil were higher in hollows (-24.5‰) than in hummocks (-26.9‰). At 50 cm, 210
there was either a decrease (in hollows) or increase (in hummocks) to ca. -26‰. In the deepest (200 cm) layer, δ13C-peat values
further decreased (to -26.1‰ in hummocks and -28.0‰ in hollows) (Fig. 4c).
3.4 Total extractable nitrogen, ammonium and nitrate in soil
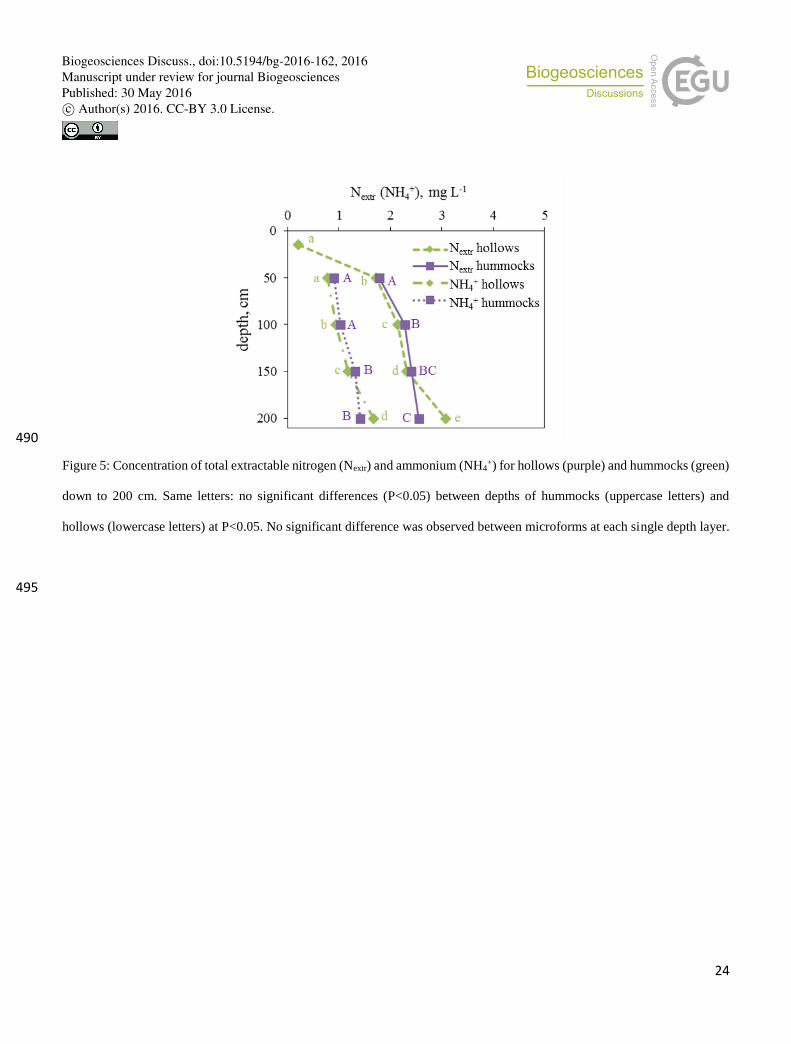
In general, both microforms showed an increasing trend of total extractable nitrogen (Nextr) and ammonium (NH4+)
concentrations in peat-water extracts with depth (Fig. 5). Nextr in hollows ranged from 0.21±0.01 to 3.08±0.03 mg L-1 and in 215
hummocks from “0” (measurement below the detection limit) to 2.55±0.02 mg L-1 from the top to the bottom soil layer,
Biogeosciences Discuss., doi:10.5194/bg-2016-162, 2016Manuscript under review for journal BiogeosciencesPublished: 30 May 2016c© Author(s) 2016. CC-BY 3.0 License.
Page 10
10
respectively. The measured NH4+ concentration was approximately half of Nextr within each depth and microform (Fig. 5). The
nitrate (NO3-) concentration was below the detection limit in all microforms and depths. Therefore, the difference between Ntot
and NH4+ presumably corresponds to disolved organic N (DON).
220
4 Discussion
4.1 CH4 and CO2 dynamics in microforms and with peat depth
4.1.1 CO2 production potential
The CO2 production potential under anaerobic conditions was similar between hummocks and hollows at each of the depth
layer (Fig. 1b). This finding contradicts the hypothesized lower CO2 production from hummocks vs. hollows under anaerobic 225
conditions due to the overall in situ lower watertable level in the former (hence better aeration and adaptation of microbial
communities to the O2-rich environment). Nonetheless, similar non-significant differences in CO2 production between
hummocks and hollows, albeit under aerobic conditions, were reported for the same soil (Lozanovska, personal
communication). This and Lozanovska´s incubation studies contradict in situ measurements reporting more than 3-times-
higher CO2 production from hummocks as compared to hollows (Becker et al., 2008). Such inconsistency may reflect either 230
lower in situ soil respiration of hollows due to the higher watertable level (decreased aeration) than in hummocks and/or an
onsite higher contribution of root or rhizosphere respiration to the total soil CO2 flux (Kuzyakov, 2006) in hummocks. In
contrast, under controlled conditions, the lack of the regulatory effect of microform-specific plant communities on native soil
CO2 flux compensated the differences in SOM properties between the two microforms, resulting in similar CO2 production
rates. 235
Another mechanism is related to the properties of soil microbial communities developing below microforms. The naturally
greater seasonal variations due to watertable fluctuations in hummocks vs. permanently water-logged hollows promote the
presence of aerobe and facultative anaerobe microbial species which can switch between fermentation and aerobic SOM
decomposition (Cord-Ruwisch et al., 1988). Therefore, incubation of hummock surface soil under anaerobic conditions showed
Biogeosciences Discuss., doi:10.5194/bg-2016-162, 2016Manuscript under review for journal BiogeosciencesPublished: 30 May 2016c© Author(s) 2016. CC-BY 3.0 License.
Page 11
11
similar CO2 production rates as from the respective hollow samples. This interpretation must be tested by applying molecular 240
biology methods to the community structure in soils of the two microforms.
Peat soil from both microtopographic positions showed decreasing rates of CO2 production with increasing depth. CO2
production from the top soil strongly decreased to a depth of 50 cm, followed by a further slow decrease to 200 cm (Fig. 1b).
The decreasing CO2 production rates with depth were similar to those reported in other peat soils studies under in vitro
anaerobic and aerobic conditions (Moore and Dalva, 1997; Glatzel et al., 2004). These authors explained depth-dependent CO2 245
patterns by a decreasing availability of fresh SOM and by the degree of decomposition (according to the Von Post Humification
Index). Although the SOM decomposition of the deep peat is retarded, it is sustained year round in northern peatlands, in
contrast to the surface soil, which freezes during the cold season (Maljanen et al., 2010). Considering the low hydraulic
conductivity, porosity and higher soil density (Quinton et al., 2008; Morris and Waddington, 2011; Branham and Strack, 2014)
of deep peat, there is a continuous accumulation of CO2 belowground in peatlands (Beer et al., 2008). Therefore, this C stock 250
should be considered in studies on GHG turnover in peatland ecosystems and when modelling regional to global C balances.
4.1.2 Methanogenic potential
The overall higher CH4 production from hollows vs. hummocks (Fig. 1a) depends on SOM quality, which in turn is affected
by aboveground plant communities. Greater rates of CH4 production in peat soil from hollows as compared to hummocks were 255
also found in a labeling study of plant-soil cores from the same peatland (Dorodnikov et al., 2011). Thus, the hollows-
dominating Scheuchzeria palustris contributed 2-4 times more to methanogenesis than the hummocks-dominating
Eriophoprum vaginatum. This mainly reflected differences in rhizodeposition. CH4 emission rates from closed chamber
experiments at the surface of the same peatland revealed a similar pattern of higher emissions from hollows (Becker et al.,
2008; Dorodnikov et al., 2013). The trend of a decreasing CH4 production rate from the top soil layer to a depth of 100 cm 260
(Fig. 1a) agrees with the hypothesized higher CH4 production rates in upper vs. deeper layers. Similar to CO2 production, this
highlights the importance of specific depth-dependent biochemical and physical parameters, such as peat quality and nutrient
availability, which influence microbial composition and activity, driving methanogenesis (Lai, 2009).
Biogeosciences Discuss., doi:10.5194/bg-2016-162, 2016Manuscript under review for journal BiogeosciencesPublished: 30 May 2016c© Author(s) 2016. CC-BY 3.0 License.
Page 12
12
The surface soil of hollows was responsible for the overall highest CH4 production (ca. 91%) between all depths, whereas the
surface soil of hummocks surprisingly contributed almost “0” to the total CH4 production (Fig. 1a). The in situ high O2 265
availability in the hummocks surface soil, among other factors, controls the abundance of methanogens. Oxygen acts as an
inhibitor or toxic agent for strictly anaerobic microorganisms such as methanogens (Shen and Guiot, 1996). Hence, hummocks
surface soil may not contain a sufficient amount of obligatory anaerobic methanogens, resulting in low CH4 production even
under controlled anaerobic conditions. This assumption, in turn, is supported by high net CH4 production in the surface soil of
hollows, which naturally provides mostly anoxic and therefore more suitable conditions. Also a greater frequency and duration 270
of anaerobic conditions are responsible for a larger active biomass of methanogens in hollows than in hummocks (Yavitt and
Seidman-Zager, 2006).
According to another mechanism, methanogens could be outcompeted by microorganisms, which primarily perform more
energetically favorable reactions with higher Free Gibbs Energy (ΔG) (Schink, 1997; Beer et al., 2008). Thus, reactions such
as denitrification (NO3-) (Rubol et al., 2012; Schlesinger and Bernhart, 2013), sulfate (SO4
2-) reduction (Lovley and Klug, 275
1983; Pester et al., 2012) or iron (Fe) transformation (Lovley et al., 1996; Cervantes et al., 2002) provide higher ΔG than
methanogenesis, when oxygen is not available. We therefore correlated the content of macro- and microelements from the
same soil samples to the CH4 production rates (Fig. 6). In hollows, the depletion of sulfur (S), Fe and NH4+ was strongly
accompanied by an increasing CH4 production rate, whereas in hummocks a surprisingly weak correlation was observed. As
no other anaerobic processes except of methanogenesis were followed in the study, the mentioned mechanism should be tested 280
in additional experiments by measuring the anion and cation concentrations as well as gaseos products (e.g. N2O for
nitrification/denitrification) in the dynamics.
4.2 Estimation of methanogenic pathways based on δ13C and by inhibition with BES
The use of specific inhibitors in combination with stable isotopes is a reliable method for the determination of CH4 sources
(Conrad, 2005). Among inhibitors for methanogenesis, 2-bromo-ethane sulfonate (BES) at a concentration of 1 mM was 285
proposed to distinguish between two pathways – hydrogenotrophic (CO2 reduction with H2) and acetoclastic (acetate splitting)
(Zinder et al., 1984). It was hypothesized that the adding BES inhibits the acetoclastic pathway (Whiticar et al., 1986).
Biogeosciences Discuss., doi:10.5194/bg-2016-162, 2016Manuscript under review for journal BiogeosciencesPublished: 30 May 2016c© Author(s) 2016. CC-BY 3.0 License.
Page 13
13
The CH4 production was strongly inhibited in the two microforms and at all depths by BES (Fig. 3). Unfortunately, very low
CH4 concentrations hindered the δ13C-CH4 analyses in samples with BES. Thus, the hypothesis about partitioning between
methanogenic pathways could not be rigorously proven. However, 13C-CH4 depletion with depth in a treatment without BES 290
(Fig. 4b) reflected an increasing contribution of the hydrogenotrophic pathway to total methanogenesis (Whiticar et al., 1986).
Since the suppression of CH4 production with BES was substantial in all samples with the hydrogenotrophic pathway
dominating before the addition, its inhibition was not selective, i.e. both hydrogenotrophic and acetoclastic pathways were
blocked. Therefore, the hypothesized selective inhibition of the acetoclastic pathway by BES was not supported in the studied
soil. Importantly, the reported concentration (1 mM) was tested in pure culturs of microorganisms and thus may vary in soils. 295
In general, the acetoclastic methanogenesis corresponds to δ13C-CH4 values between -65 and -50‰ (Whiticar et al., 1986).
The current experiment showed that the most intensive CH4 production took place in the hollows surface soil (Fig. 1a), where
the value was -59‰ (Fig. 4b). Simultaneously, the released δ13C-CO2 was close to native peat organic matter (Fig. 4a,c). This
indicated both the restricted CH4 oxidation (in this case δ13C-CO2 should be closer to the δ13C-CH4 source) and relatively low
CO2-reduction pathway of methanogenesis. In the latter case, 13C-CO2 becomes more enriched due to discrimation by 300
methanogens against heavier 13CO2, while 12CO2 is consumed during the methanogenesis (Popp et al., 1999). Therefore, we
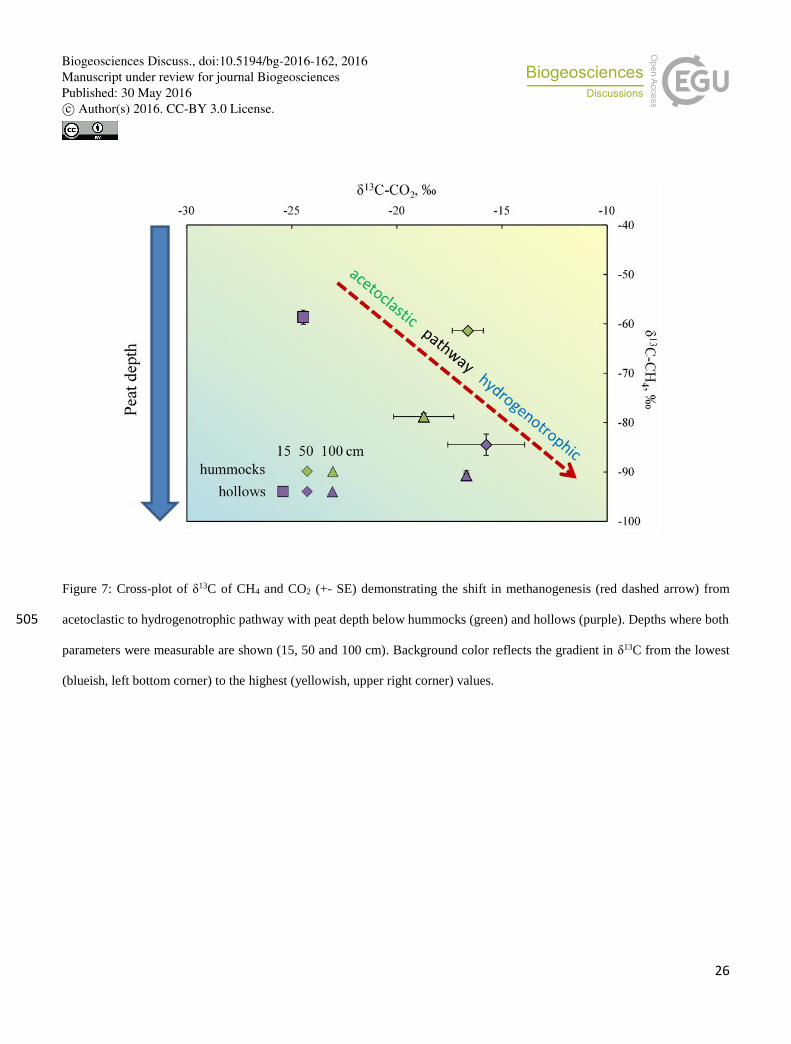
conclude that methanogenesis in the surface soil of hollows was dominated by the acetoclastic pathway (Fig. 7). Significantly
lower δ13C-CO2 values in hummocks vs. hollows (Fig. 4a) reflected the difference in C isotopic characteristics between the
respective peat-SOM of the two microforms (Fig. 4c). This, in turn, is connected with the δ13C signature of initial plant residues
because different species dominated the two microforms (Becker et al., 2008; Dorodnikov et al., 2011). 305
The strongly negative δ13C-CO2 values in the deeper soil layers may indicate the occurrence of so-called anaerobic oxidation
of methane – AOM (Smemo and Yavitt, 2011). The C source for microorganisms conducting AOM is a strongly 13C-depleted
CH4, and its utilization should dilute the total 13C-CO2, resulting in an overall decrease of δ13C-CO2 values. This issue must be
tested in separate experiments using 13C-labeled CH4 and analyzing the 13C in released CO2 as an end-product of oxidation
under strictly anaerobic conditions. 310
In contrast to the surface soil, δ13C values of SOM at 50 cm depth were similar for both microforms but the released CO2 was
30-40% more enriched than SOM (Fig. 4a,c). As described above, the CO2 enrichment occurs during the hydrogenothrophic
Biogeosciences Discuss., doi:10.5194/bg-2016-162, 2016Manuscript under review for journal BiogeosciencesPublished: 30 May 2016c© Author(s) 2016. CC-BY 3.0 License.
Page 14
14
pathway of methanogenesis (Popp et al., 1999). However, δ13C-CH4 at 50 cm was ca. 23% higher in hummocks than in hollows
(Fig. 4b), indicating that the acetoclastic pathway may co-exist with the hydrogenotrophic one. Both, the low δ13C-CH4 and
the high δ13C-CO2 values in hollows, provided evidence for the increased contribution of the hydrogenotrophic pathway to 315
total methanogenesis (Fig. 7).
At the deepest soil layers (100, 150 and 200 cm) the CH4 production was very low (Fig. 1a). Where measurable, δ13C-CH4
values ranged from -79 to -91‰ (Fig. 4b), coinciding with the reported range of δ13C-CH4 due to hydrogenotrophic
methanogenesis (Whiticar et al., 1986) (Fig. 7). This finding corroborates the in situ domination of the hydrogenotrophic
pathway at deep peat layers of the same peatland (Dorodnikov et al., 2013). Interestingly, the measured “0” production under 320
anaerobic conditions along with δ13C-CO2 depletion with depth (Fig. 4a) may reflect the AOM.
5 Conclusions
The CH4, CO2 production and δ13C of CH4, CO2 and SOM before and after the addition of BES to peat soil at five depths (15-
200 cm) below two contrasting microforms – naturally dry hummocks and wet hollows – revealed the following: (i) CH4 325
production was significantly higher at hollows compared to hummocks but CO2 production did not differ between microform
types (Hypothesis I conditionally supported); (ii) production of CH4 and CO2 was significantly higher in the surface peat soil
compared to deeper soil layers (Hypothesis II supported); (iii) overall higher contribution of hydrogenotrophic vs. acetoclastic
methanogenesis corresponded to hollows as compared to hummocks (Hypothesis III supported).
330
Acknowledgements
Authors' are thankful to technical staff of the Department of Soil Science of Temperate Ecosystems - Anita Kriegel, the
Department of Agricultural Science - Ingrid Ostermeyer, Karin Schmidt, Susann Enzmann and the Centre for Stable Isotope
Research and Analysis (KOSI) - Dr. Jens Dyckmans and Reinhard Langel from the Georg-August University of Göttingen for
invaluable help in laboratory work and instrumental measurements. The study was done with the support of the project “Stable 335
Biogeosciences Discuss., doi:10.5194/bg-2016-162, 2016Manuscript under review for journal BiogeosciencesPublished: 30 May 2016c© Author(s) 2016. CC-BY 3.0 License.
Page 15
15
carbon composition of methane in Eurasian peatlands: CH4 production, transport and oxidation” sponsored by German
Research Foundation (Deutsche Forschung Gemeinschaft, DFG). Project number DFG DO 1533/1-1.
References
Alm, J., Saarnio, S., Nykänen, H., Silvola, J., Martikainen, P. J.: Winter CO2, CH4 and N2O fluxes on some natural and drained 340
boreal peatlands, Biogeochemistry, 44, 163-186, 1999.
Avery, G. B. Jr., Shannon, R. D., White, J. R., Martens, C. S., Alperin, M. J.: Effect of seasonal changes in the pathways of
methane production on the δ13C values of pore water methane in a Michigan peatland, Global Biogeochemical Cycles,
13, 475-484, 1999.
Baird, A. J., Belyea, L.R., Morris, P. J.: Up scaling of peatland-atmosphere fluxes of methane: small scale heterogeneity in 345
process rates and the pitfalls of ‘Bucket-and-Slab’ models, Geophysical Monograph, 184, 37-53, 2009.
Becker, T., Kutzbach, L., Forbrich, I., Schneider, J., Jager, D., Thees, B., Wilmking, M.: Do we miss hotspots? The use of
very high- resolution aerial photographs to quantify carbon fluxes in peatlands, Biogeosciences, 5, 1387-1393, 2008.
Beer, J., Lee, K., Whiticar, M., Blodau, C.: Geochemical controls on anaerobic organic matter decomposition in a northern
peatland, Limnology and Oceanography, 53, 1393-1407, 2008. 350
Bodegom, P.M., Stams, A.J,M.: Effect of alternative electron acceptors and temperature on methanogenesis in rice paddy soils,
Chemosphere, 39, 167-182, 1999.
Branham, J. E., Strack, M.: Saturated hydraulic conductivity in Sphagnum-dominated peatlands: do microforms matter?
Hydrological Processes, 27, 4352-4362, 2014.
Bubier, J. L., Costello, A., Moore, T. R.: Microtopography and methane flux in boreal peatlands, northern Ontario, Canada, 355
Canadian Journal of Botany, 71, 1056-1063, 1993.
Bubier, J. L., Moore, T. R., Juggings, S.: Predicting methane emission from bryophyte distribution in northern Canadian
peatlands, Ecology, 76, 677-693, 1995.
Cervantes, F. J., de Bok, F. A. M., Duong-Dac, T., Stams, A. J. M., Lettinga, G., Field, J. A.: Reduction of humic substances
by halorespiring, sulphate-reducing and methanogenic microorganisms, Environmental Microbiology, 4, 51-57, 2002. 360
Biogeosciences Discuss., doi:10.5194/bg-2016-162, 2016Manuscript under review for journal BiogeosciencesPublished: 30 May 2016c© Author(s) 2016. CC-BY 3.0 License.
Page 16
16
Conrad, R.: Quantification of methanogenic pathways using stable carbon isotopic signatures: a review and proposal, Organic
Geochemistry, 36, 739-752, 2005.
Cord-Ruwisch, R., Seitz, H. J., Conrad, R.: The capacity of hydrogenothrophic anaerobic- bacteria to compete for traces
ofhydrogen depends on the redox potential of the terminal elector acceptor, Archives of Microbiology, 149, 350-357,
1988. 365
Crill, P., Bartlett, K., Roulet, N.: Methane flux from boreal peatlands, Suo, 43, 173-182, 1993.
Dalva, M., Moore, T. R.: Methane and soil and plant community respiration from wetlands, Kejimkujik National Park, Nova
Scotia: Measurements, predictions, and climatic change, 2001, Journal of Geophysical Research, 106, 2955-2962,
2001.
Dise, P., Verry, E.S.: Suppression of peatland methane emission by cumulative sulfate deposition in simulated acid rain, 370
Biogeochemistry, 53, 143-160, 2001.
Dorodnikov, M., Knorr, K.-H., Kuzyakov, Y., Wilmking, M.: Plant-mediated CH4 transport and contribution of photosynthates
to methanogenesis at a boreal mire: a 14C pulse-labeling study, Biogeosciences, 8, 2365-2375, 2011.
Dorodnikov, M., Marushchak, M., Biasi, C., Wilmking, M.: Effect of microtopography on isotopic composition of methane in
porewater and efflux at a boreal peatland, Boreal Environmental Research, 18, 269-279, 2013. 375
Eriksson, T., Oquist, M.G., Nilsson, M.B.: Production and oxidation of methane in a boreal mire after a decade of increased
temperature and nitrogen and sulfur deposition, Global Change Biology, 16, 2130-2144, 2010.
Gauci, V., Dise, N., Fowler, D.: Controls on suppression of methane flux from a peat bog subjected to simulated acid rain
sulfate deposition, Global Biogeochemistry Cycles, 16, 1-12, 2002.
Glatzel, S., Basiliko, N., Moore, T.: Carbon dioxide and methane production potentials of peats from natural harvested and 380
restored sites, Eastern Quebec – Canada, Wetlands, 24, 261-267, 2004.
Granberg, G., Sundh, I., Svensson, B. H., Nilsson, M.: Effects of temperature, nitrogen and sulfur deposition on methane
emission from a boreal mire, Ecology, 82, 1982-1998, 2001.
Biogeosciences Discuss., doi:10.5194/bg-2016-162, 2016Manuscript under review for journal BiogeosciencesPublished: 30 May 2016c© Author(s) 2016. CC-BY 3.0 License.
Page 17
17
Hornibrook, E. R. C., Longstaffe, F. J., Fyfe, W. S.: Spatial distribution of microbial methane production pathways in temperate
zone wetland soils: Stable carbon and hydrogen isotope evidence, Geochimica et Cosmochimica acta, 61, 745-753, 385
1997.
IPCC: Climate Change 2014: Synthesis Report. Contribution of Working Groups I, II and III to the Fifth Assessment Report
of the Intergovernmental Panel on Climate Change [Core Writing Team, R.K. Pachauri and L.A. Meyer (eds.)]. IPCC,
Geneva, Switzerland, 151 pp., 2014.
Jager, D. F., Wilmking M., Kukkonen, J. V. K.: The influence of summer seasonal extremes on dissolved organic carbon 390
export from a boreal peatland catchment: Evidence from one dry and one wet growing season, Science of the total
Environment, 407, 1373-1382, 2009.
Jarrel, K. F., Kalmokoff, M. L.: Nutritional requirements of the methanogenic archaebacterial, Canadian Journal of
Microbiology, 34, 557-576, 1988.
Kettunen, A.: Connecting methane fluxes to vegetation cover and water table fluctuations at microsite level: A modeling study, 395
Global Biochemical Cycles, 17, 1051, 2003.
Kluber, H. D., Conrad, R.: Effects of nitrate, nitrite, NO and N2O on methanogenesis and other redox processes in anoxic rice
field soil, Microbiology Ecology, 25, 301-318, 1998.
Kuzyakov, Y.: Sources of CO2 efflux from soil and review of partitioning methods, Soil Biology & Biochemistry, 38, 425-
448, 2006. 400
Lai, D. Y. F.: Methane dynamics in northern peatlands: A review, Pedosphere, 19, 409-421, 2009.
Limpens, J., Berendse, F., Blodau, F., Canadell, J.G., Freeman, C., Holden, J., Roulet, N., Rydin, H., Schaepman-Strub, G.:
Peatlands and the carbon cycle: from local processes to global implications – a synthesis, Biogeosciences, 5, 1475-
1491, 2008.
Lovley, D. R., Klug, M. J.: Sulfate reducers can out-compete methanogens at fresh-water sulfate concentrations, Applied and 405
Environmental Microbiology, 45, 187-192, 1983.
Lovley, D. R., Coates, J. D., Blunt-Harris, E. L., Phillips, J.P., Woodward, J. C.: Humic substances as electron acceptors for
microbial respiration, Nature, 382, 445-448, 1996.
Biogeosciences Discuss., doi:10.5194/bg-2016-162, 2016Manuscript under review for journal BiogeosciencesPublished: 30 May 2016c© Author(s) 2016. CC-BY 3.0 License.
Page 18
18
Loftfield, N., Flessa, H., Augustin, J., Beese, F.: Automated gas chromatographic system for rapid analysis of the atmospheric
trace gases methane, carbon dioxide and nitrous oxide, Journal of Environmental Quality, 26, 560-564, 1997. 410
Maljanen, M., Sigurdsson, B. D., Guðmundsson, J., Óskarsson, H., Huttunen, J. T., Martikainen, P. J.: Greenhouse gas balances
of managed peatlands in the Nordic countries – present knowledge and gaps, Biogeosciences, 7, 2711–2738, 2010.
Moore, T. R., Knowles, R.: The influence of water table levels on methane and carbon dioxide emissions from peatland soils,
Canadian Journal of Microbiology, 69, 33-38, 1989.
Moore, T. R., Roulet, N. T.: Methane flux: water table relations in northern wetlands, Geophysical Research Letters, 20, 587-415
590, 1993.
Moore, T. R., Dalva, M.: Methane and carbon dioxide exchange potentials of peat soils in aerobic and anaerobic laboratory
incubations, Soil Biology and Biochemistry, 29, 1157-1164, 1997.
Morris, O. J., Waddington, J. M.: Groundwater residence time distributions in peatlands: Implications for peat decomposition
and accumulation, Water Ressources Research, 47, W02511, 2011. 420
Müller, V., Blaut, M., Gottschalk, G.: Bioenergetics of methanogenesis, In: Ferry JG, editor, Methanogenesis: Ecology,
Physiology, Biochemistry and Genetics, New York: Chapman & Hall, 360-406, 1993.
Pester, M., Knorr, K.-H., Friedrich, M. W., Wagner, M., Loy, A.: Sulfate-reducing microorganisms in wetlands – fameless
actors in carbon cycling and climate change, Frontiers in Microbiology, 3, 72, 2012.
Popp, T. J., Chanton, J. P., Whiting, G. J., Grant, N.: Methane stable isotope distribution at a Carex dominated fen in north 425
central Alberta, Global Biogeochemical Cycles, 13, 1063-1077, 1999.
Quinton, W. L., Hayashi, M., Carey, S. K.: Peat hydraulic conductivity in cold regions and its relation to pore size and
geometry, Hydrological Processes, 22, 2829-2837, 2008.
Rubol, S., Silver, L., Bellin, A.: Hydrologic control on redox and nitrogen dynamics in a peatland soil, Science of the Total
Environment, 432, 37-46, 2012. 430
Saarnio, S., Alm, J., Silvola, J., Lohila, A., Nykänen, H., Martikainen, P.J.: Seasonal variation in CH4 emissions and production
and oxidation potentials at microsites on an oligotrophic pine fen, Oecologica, 110, 414-422, 1997.
Biogeosciences Discuss., doi:10.5194/bg-2016-162, 2016Manuscript under review for journal BiogeosciencesPublished: 30 May 2016c© Author(s) 2016. CC-BY 3.0 License.
Page 19
19
Schink, B.: Energetics of Syntrophic Cooperation in Methanogenic Degradation, Microbiology and Molecular Biology, 61,
262-280, 1997.
Schlesinger, W. H., Bernhart, E. S.: Biogeochemistry: an analysis of global change, 3rd edition, Wetland ecosystems, 233-435
274, Academic Press, USA, Oxford, UK, 2013.
Shen, C. F., Guiot, S. R.: Long term impact of dissolved O2 on the activity of anaerobic granules, Biotechnology and
Bioengineering, 49, 611-620, 1995.
Smemo, K. A., Yavitt, J. B.: Evidence for anaerobic CH4 oxidation in freshwater peatlands, Geomicrobiology Journal, 24,
583-597, 2007. 440
Smemo, K. A., Yavitt, J. B.: Anaerobic oxidation of methane: an underappreciated aspect of methane cycling in peatland
ecosystems?, Biogeosciences, 8, 779-793, 2011.
Steinmann, P., Eilrich, B., Leuenberger, M., Burns, S. J.: Stable carbon isotope composition and concentrations of CO2 and
CH4 in deep catotelm of a peat bog, Geochimica et Cosmochimica acta, 72, 6015-6026, 2008.
Ström, L., Mastepanov, M., Christensen, R.: Species-specific effects of vascular plants on carbon turnover and methane 445
emissions from wetlands, Biogeochemistry, 75, 65-82, 2005.
Sutton-Grier, A. E., Keller, J. K., Koch, R., Gilmour, C., Megonigal, J. K.: Electron donors and acceptors influence anaerobic
soil organic matter mineralization in tidal marshe, Soil Biology & Biochemistry, 43, 1576-1583, 2011.
Svensson, B. H., Sundh, I.: Factors affecting methane production in peat soils, Suo, 43, 183-190, 1992.
Waddington, J.M., Roulet, N.T.: Groundwater flow and dissolved carbon movement in a boreal peatland, Journal of 450
Hydrology, 191, 122-138, 1997.
Whiticar, M. J., Faber, E., Schoell, M.: Biogenic methane formation in marine and freshwater environments: CO2 reduction
vs. acetate fermentation - isotopic evidence, Geochimica et Cosmochimica acta, 50, 693-709, 1986.
Whiticar, M. J.: Carbon and hydrogen isotope systematics of bacterial formation and oxidation of methane, Chemical Geology,
161, 291-314, 1999. 455
Whiting, G. J., Chanton, J. P.: Primary production control of methane emission from wetlands, Nature, 364, 794-795, 1993.
Biogeosciences Discuss., doi:10.5194/bg-2016-162, 2016Manuscript under review for journal BiogeosciencesPublished: 30 May 2016c© Author(s) 2016. CC-BY 3.0 License.
Page 20
20
Yavitt, J. B., Williams, C. J., Wieder, R. K.: Controls on microbial production of methane and carbon dioxide in three
sphagnum-dominated peatland ecosystems as revealed by a reciprocal filed peat transplant study, Geomicrobiology
Journal, 39, 194-204, 2000.
Yavitt, J. B., Seidman-Zager, M.: Methanogenic Conditions in Northern Peat Soils, Geomicrobiology Journal, 23, 119-127, 460
2006.
Zinder, S. H., Anguish, T., Cardwell, S. C.: Selective-inhibition by 2-Bromoethane-sulfonate of methanogenesis from acetate
in a thermophilic anaerobic digester, Applied and Environmental Microbiology, 47, 1343-1345, 1984.
465
Figure 1: Mean CH4 (A) and CO2 (B) production rate for hollows (purple) and hummocks (green) at depths of 15, 50, 100,
150 and 200 cm without addition of the methanogenesis inhibitor (BES). The same letters show absence of significant
differences (P<0.05) between microforms of the same depth (uppercase letters) and between five depths within the same
microform (lowercase letters). The integrated pie charts show the distribution (in %) of the overall CH4 and CO2 production
from all depths of hollows and hummocks. The contribution of depths below 100 cm to overall CH4 production in hollows was 470
< 0.3%. In hummocks, depths 15, 150 and 200 cm comprised 1.3, 0.6 and 0.2% of overall CH4, respectively. Asterisk:
significant difference (P<0.05) between the two microforms within the same depth.
dep
th, cm
(a) CH4
(b) CO2
Ab Bb
Aa
hollows hummocks
91*
9
51
18
13
9 9
hollows hummocks
40
20 17
11 2
CH4 (CO2) rate, ng g d.w.-1 h-1
Contribution, % Contribution, %
82*
16*
hollows
hummocks
700 2200 3700 5200
Biogeosciences Discuss., doi:10.5194/bg-2016-162, 2016Manuscript under review for journal BiogeosciencesPublished: 30 May 2016c© Author(s) 2016. CC-BY 3.0 License.
Page 21
21
Figure 2: CH4 production rate at two depths in (A) hollows (15 and 50 cm) and two depths in (B) hummocks (50 and 100 cm),
where the effect of the methanogenic inhibitor BES was the most pronounced. Black arrow: date of BES addition. Dashed and 475
dotted lines correspond to control soil with milli-Q water addition.
(a) hollow
CH
4 r
ate,
ng
g d
.w.-1
h-1
(b) hummock
Incubation period, days
15 cm BES
15 cm control 50 cm BES
50 cm control
50 cm BES
50 cm control 100 cm BES
100 cm control
hollows hummocks
Biogeosciences Discuss., doi:10.5194/bg-2016-162, 2016Manuscript under review for journal BiogeosciencesPublished: 30 May 2016c© Author(s) 2016. CC-BY 3.0 License.
Page 22
22
480
Figure 3: BES suppression (in %) of the CH4 production rate for hollows (purple) and hummocks (green) down to 200 cm
depth. The effect was calculated as the difference of the mean CH4 production rate before and after adding BES. Changes in
respective control treatments before and after the addition of milli-Q water were subtracted from the treatment effect. BES
treatments of each microform were “weighted” against each depth according to their contribution to overall CH4 production.
Asterisk: significant effects (P<0.05). 485
Biogeosciences Discuss., doi:10.5194/bg-2016-162, 2016Manuscript under review for journal BiogeosciencesPublished: 30 May 2016c© Author(s) 2016. CC-BY 3.0 License.
Page 23
23
Figure 4: Delta (δ) 13C of CO2 (A), CH4 (B) and peat soil organic matter (C) depending on depths of hollows and hummocks.
Same letters: no significant differences (P<0.05) between microforms of the same depth (uppercase letters) and between five
depths within the same microform (lowercase letters).
Biogeosciences Discuss., doi:10.5194/bg-2016-162, 2016Manuscript under review for journal BiogeosciencesPublished: 30 May 2016c© Author(s) 2016. CC-BY 3.0 License.
Page 24
24
490
Figure 5: Concentration of total extractable nitrogen (Nextr) and ammonium (NH4+) for hollows (purple) and hummocks (green)
down to 200 cm. Same letters: no significant differences (P<0.05) between depths of hummocks (uppercase letters) and
hollows (lowercase letters) at P<0.05. No significant difference was observed between microforms at each single depth layer.
495
Biogeosciences Discuss., doi:10.5194/bg-2016-162, 2016Manuscript under review for journal BiogeosciencesPublished: 30 May 2016c© Author(s) 2016. CC-BY 3.0 License.
Page 25
25
Figure 6: Relationship between mean CH4 production rate (without inhibitor BES) and concentrations of total peat sulfur (S,
blue), iron (Fe, green) in mg g d.w.-1 (left y-axis) and extractable ammonium (purple) in mg L-1 (right y-axis) for 15, 50 and
200 cm depths below hollows (A) and hummocks (B). 500
CH4 rate, ng g d.w.-1 h-1
NH4+
(NH4+)
Biogeosciences Discuss., doi:10.5194/bg-2016-162, 2016Manuscript under review for journal BiogeosciencesPublished: 30 May 2016c© Author(s) 2016. CC-BY 3.0 License.
Page 26
26
Figure 7: Cross-plot of δ13C of CH4 and CO2 (+- SE) demonstrating the shift in methanogenesis (red dashed arrow) from
acetoclastic to hydrogenotrophic pathway with peat depth below hummocks (green) and hollows (purple). Depths where both 505
parameters were measurable are shown (15, 50 and 100 cm). Background color reflects the gradient in δ13C from the lowest
(blueish, left bottom corner) to the highest (yellowish, upper right corner) values.
Biogeosciences Discuss., doi:10.5194/bg-2016-162, 2016Manuscript under review for journal BiogeosciencesPublished: 30 May 2016c© Author(s) 2016. CC-BY 3.0 License.