22
Middle Distillates in CEE An operator’s perspective Marcus Lippold Vice President Business Strategy and Regulatory and Public Affairs MOL Group 30 January 2014
| Date post: | 03-Dec-2018 |
| Category: |
Documents |
| Upload: | truongdang |
| View: | 216 times |
| Download: | 0 times |

Middle Distillates in CEE An operator’s perspective
Marcus Lippold Vice President
Business Strategy and Regulatory and Public Affairs
MOL Group
30 January 2014

AGENDA
MOL Group Downstream at a glance
European drivers of middle distillates
CEE situation
Potential answers
2

Mantova*
Bratislava
Danube
Sisak
Rijeka
MOL Group Downstream BU: Integrated Operator in CEE Markets
• Complex, diesel geared refineries
• Integrated petrochemical units to handle surplus
gasoline/naphtha pool
• Strong land-locked market presence – 21% motor fuel
market share in the CEE; market leader in 4 countries
• Region-wide Logistics, Wholesale and Retail network
serve the market - above 55% end-user share
Refinery Mtpa kbpd NCI
MOL Group 23.5 470 9.9
Danube 8.1 161 10.6
Bratislava 6.1 122 11.5
Rijeka 4.5 90 9.1
Sisak 2.2 44 6.1
Refinery yield 2013E
over 80%
white prd.
► 19 Mt refined product &
petrochemical sales
► Retail: 1.700+ FS w . 2.6
Mtpa
► Petchem: 1.2 Mt ext. sales
2012 Figures Refinery capacity & complexity
*Transformed into a products logistics hub
3% 10%
19%
51%
3% 5%
4% 5% LPGNaphthaMotor GasolineMiddle DistillatesFuel OilBitumenOtherOther chemical prds.
3

AGENDA
MOL Group Downstream at a glance
European drivers of middle distillates
CEE situation
Potential answers
4

Cost disadvantage makes Europe the weakest link in global refining Under strong import pressure further consolidation is inevitable in Europe • As shipping costs are marginal vs. product value, European refiners need to be able to compete globally, with
increasing pressure coming from other regions
• However, with its ageing refining fleet, Europe struggles as other regions’ competitive advantage grows: 1. stronger demand, hence higher utilizations (Asia)
2. quality and scale of the assets (U.S., and new in Asia and ME)
3. favorable feedstock economics (U.S., ME)
• On top of falling local demand, the U.S. market for taking up some of the European gasoline surplus has also disappeared…
• … and although rising demand in Latin America requires significant import growth, European refiners will not be able to compete with U.S. refineries
Scale Average refinery size (kbpd)
Refinery number evolution Configuration Average Nelson complexity
4. lower costs of energy and labour (Asia, ME, U.S.)
5. More favourable regulations (developing world)
5 Source: IEA, IHS CERA
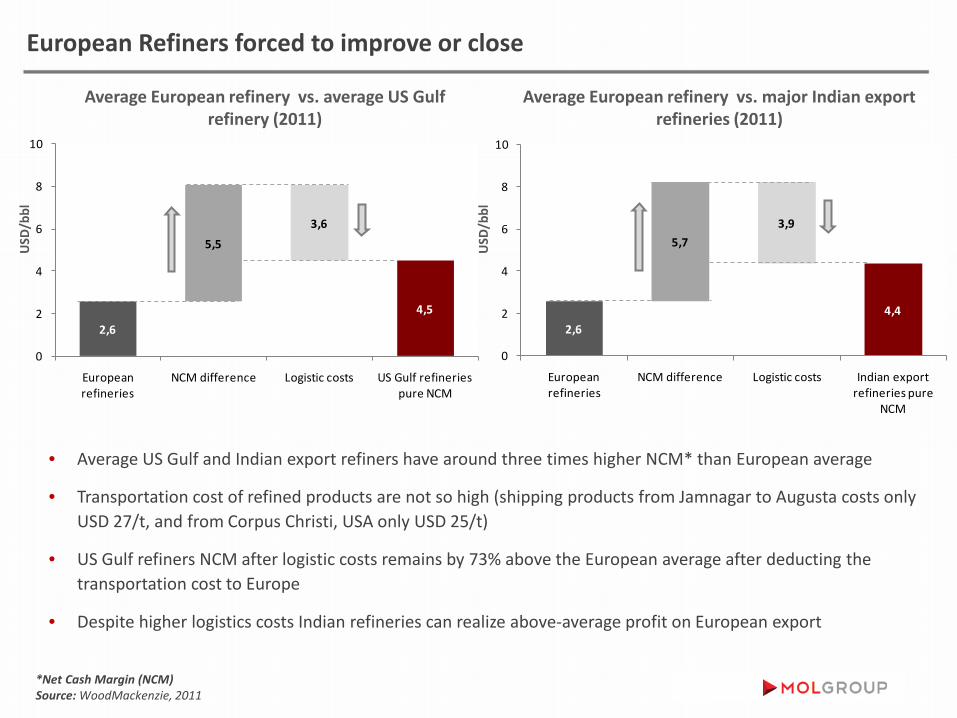
Average European refinery vs. major Indian export refineries (2011)
Average European refinery vs. average US Gulf refinery (2011)
2,64,5
5,53,6
0
2
4
6
8
10
European refineries
NCM difference Logistic costs US Gulf refineries pure NCM
2,64,4
5,73,9
0
2
4
6
8
10
European refineries
NCM difference Logistic costs Indian export refineries pure
NCM
• Average US Gulf and Indian export refiners have around three times higher NCM* than European average
• Transportation cost of refined products are not so high (shipping products from Jamnagar to Augusta costs only USD 27/t, and from Corpus Christi, USA only USD 25/t)
• US Gulf refiners NCM after logistic costs remains by 73% above the European average after deducting the transportation cost to Europe
• Despite higher logistics costs Indian refineries can realize above-average profit on European export
USD
/bbl
USD
/bbl
European Refiners forced to improve or close
*Net Cash Margin (NCM) Source: WoodMackenzie, 2011

• Imbalances will remain in the future
• Traded amounts of refined products will gain further ground
• Role of trading will further strengthen
Source: WoodMackenzie, IHS CERA
Dieselisation continues, while oversupply of gasoline remains
• Refinery yield does not match consumption patterns
• Gasoline – diesel rate in demand is 1:3, however in total production is 1:2
• Refinery configuration (gasoline/diesel) yield cannot be changed dramatically; refinery mismatch is rather a capability than a variable feature
Gasoline and diesel share of total refinery supply and demand in Europe
Source: WoodMackenzie, 2012
Net import
Net export
European net product trade (Mt)
Source: IHS CERA
The market is long in gasoline, and short in diesel… … and it does not seem to change in the medium run
7
Net import
Net export

Source: JBC
Russian refinery upgrades will have an impact on product flows
• In 2016 fuel oil yield will equal 20%, falling by 22% from 2012 levels (to below 1.1 mbpd in 2016)
• Significant hydrocracking, FCC and coking capacities will come on-stream by 2015 (in 2013 alone a 36% increase in hydrocracking capacity)
• Additional Russian upgrade capacities will absorb VGO supply and a part of fuel oil • Intermediate products share will significantly drop, quality product inflow from Russia
to Europe expected to increase after 2015
8
Russian refinery expansion

North America intends to become self-sufficient in gasoline due to: • Declining gasoline demand (by ~5% in 2009-
2011) • Increasing proportion of non-refinery
ethanol blending (39.7Mt in 2011 from 5.2Mt in 2001)
• Ethanol blending to increase further (bio component will further increase by 50% until 2020, reaching almost 14% of total gasoline demand)
Europe will face growing challenges, where to place excess gasoline barrels …
• 53% of NWE 19Mt gasoline surplus landed in North America in 2011
• According to WoodMackenzie estimations, with more than 40Mt/y Europe will face excessive amount of gasoline by 2020
9 Sources: WoodMackenzie, EIA
Europe losing its main gasoline outlet, as the leading export market dries out
US Gasoline Trade (1990 – Jul 2013)
North American Gasoline Supply-Demand Balance

… and its effects on European refiners • Regulation will result in significant shift towards
middle distillates from LSFO and HSFO (additional diesel demand will be ~ 0.3mbpd by 2016)
• The significant shift in fuel quality will put pressure on how to handle the 11-12% HSFO yield by 2020
Shipping: IMO regulation will further boost middle distillate consumption
Source: WoodMackenzie, www.imo.org , ClEP, OPEC NOTE: (1) IMO – the International Maritime Organization – is the United Nations specialized agency with responsibility for the safety and security of shipping and the prevention of marine pollution by ships. (2) SECA – sulphur emissions-control areas, incl. Baltic Sea, North Sea and English Channel 10
The regulation… • IMO regulates emission from international shipping, it
aims to create stricter marine fuel regulations
• Latest regulation – approved by the EU in September 2012 – requires all ships
o To use 0.1% -sulphur bunker fuel in SECA as of 2015
o Outside SECA waters to use a maximum 0.5% sulphur content fuel after 2020
How to overcome the problem ?
Existing SECA (Sulphur Emission Control Areas)
SECA under consideration
Possible solution Pros/ConsChanging the production process via investing in desulphurisation
Requires huge investments
Choosing lighter (and also more expensive) crudes to decrease fuel oil yield
Overall supply sources became heavier in the last decades
Finding another way, where to place the excess barrels of fuel oil
The market is oversupplied with heavy residues
Residue conversion Significant capex need
can be
Global crude slate is moving to lighter sources
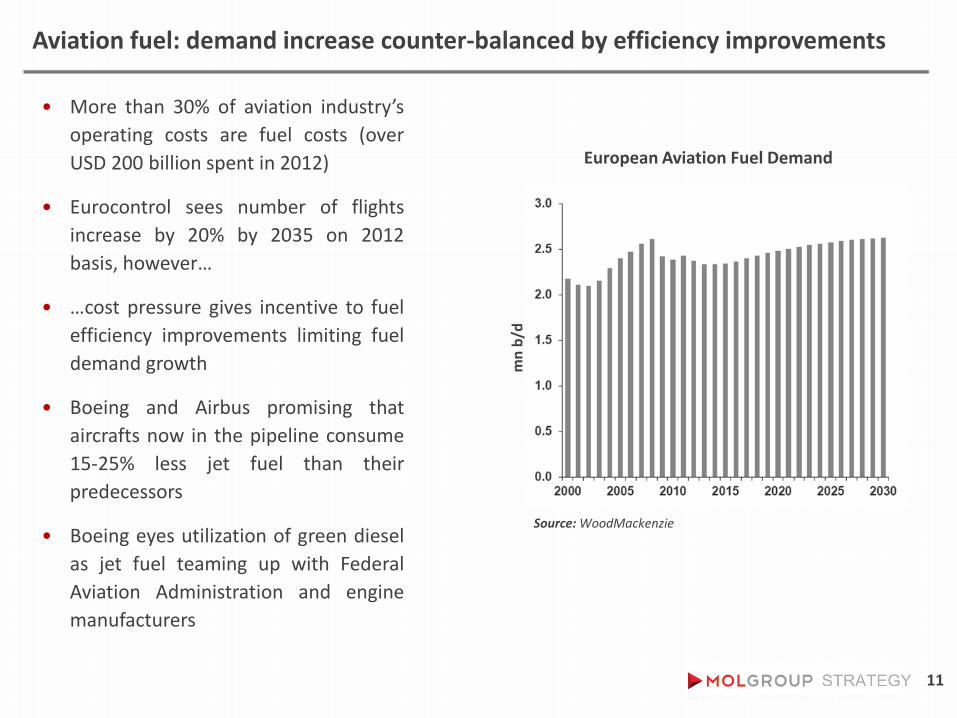
Aviation fuel: demand increase counter-balanced by efficiency improvements
11
Source: WoodMackenzie
• More than 30% of aviation industry’s operating costs are fuel costs (over USD 200 billion spent in 2012)
• Eurocontrol sees number of flights increase by 20% by 2035 on 2012 basis, however…
• …cost pressure gives incentive to fuel efficiency improvements limiting fuel demand growth
• Boeing and Airbus promising that aircrafts now in the pipeline consume 15-25% less jet fuel than their predecessors
• Boeing eyes utilization of green diesel as jet fuel teaming up with Federal Aviation Administration and engine manufacturers
European Aviation Fuel Demand
mn
b/d

12
• Substitution of refined oil products in transport with alternative energy including biofuels (ethanol and biodiesel) puts pressure on the industry
• Regulations becoming more and more strict in the European Union
o Share of biofuels is continuously increasing, putting growing volumes of biofuels on the market is the obligation of oil companies (at wholesalers’ level)
o Total biofuels supply in Europe would have to reach up to 20Mt by 2020 (equal to 4 average size European refineries’ yearly distillate and gasoline production*)
• The impact of 6% lifecycle GHG-emission reduction obligation of oil companies depends on upcoming Commission Directive
EU Policy: EU biofuel and GHG regulation strengthened further „Biofuels are eroding the need for distillation capacity” (Argus)
EU proposal on Biofuel targets
2010 2020
Renewable Target (share of renewable energy in road fuels)
5,75% 10% 6-7.5% cap for biofuels
+1-2.5% min for advanced biofuels
UNDER DEBATE
Source: IHS, CIEP NOTE: * calculation based on: refinery size – 166kbpd, distillate and gasoline yield – 67%
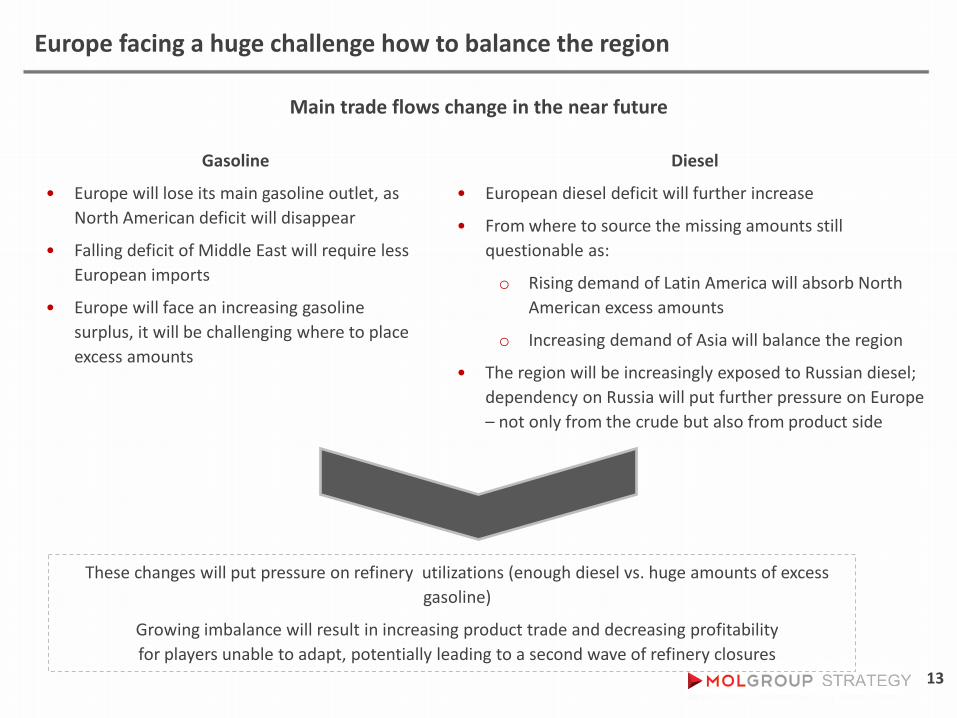
Europe facing a huge challenge how to balance the region
13
Gasoline
• Europe will lose its main gasoline outlet, as North American deficit will disappear
• Falling deficit of Middle East will require less European imports
• Europe will face an increasing gasoline surplus, it will be challenging where to place excess amounts
Main trade flows change in the near future
Diesel
• European diesel deficit will further increase
• From where to source the missing amounts still questionable as:
o Rising demand of Latin America will absorb North American excess amounts
o Increasing demand of Asia will balance the region
• The region will be increasingly exposed to Russian diesel; dependency on Russia will put further pressure on Europe – not only from the crude but also from product side
These changes will put pressure on refinery utilizations (enough diesel vs. huge amounts of excess gasoline)
Growing imbalance will result in increasing product trade and decreasing profitability for players unable to adapt, potentially leading to a second wave of refinery closures

AGENDA
MOL Group Downstream at a glance
European drivers of middle distillates
CEE situation
Potential answers
14

15
Despite low car penetration rate, demand upside in CEE might be limited
Source: Eurostat, EIA
Passenger cars/1000 population
GDP
/Cap
ita (E
UR)
Car penetration v.s. GDP per Capita in Europe (2011)
• Europe’s car park is expected to continue to grow by 1.5% pa out to 2015 and beyond
• Given a relatively low car penetration rate in CEE compared to Western European countries, the car fleet is expected to grow faster in this region
• Being slow adopters of technological developments in the past, alternative drivetrains will likely not start booming in CEE in the mid-term
• EU environmental legislation is forcing car manufacturers to improve vehicle fuel efficiency. Recent improvement in mileage has been substantial, fuel consumption of new cars is expected to fall by 24% by 2020
• Demographic changes and changing attitudes towards vehicles can also moderate fuel consumption growth

16
Supply-Demand Balance in the CEE region
Dieselization is still ongoing in CEE region, driving product market imbalance
• Favorable long-term regional GDP growth supports diesel demand, increasing shortage of supply
• Gasoline outlook to remain flat in the long-term resulting in further deterioration of surplus in the market
• Favorable duties and taxes incentivize dieselization of passenger cars reinforcing gasoline-diesel imbalance
mn
t
Excise duties in Central-Eastern European Countries

Changing demand patterns set serious challenges ahead for CEE refiners
• Small and mid-size refineries are competing in the region
• Local companies became regional players after privatisation of assets (Austrian OMV – Romania, Hungarian MOL – Slovakia & Croatia, Polish PKN – Czech Republic, Lithuania)
• Russian companies privatized assets in South Eastern Europe
• Demand decline, upgraded refinery capacities and lack of refinery closures result in overcapacity
• Consolidation still going on: e.g. OMV reducing presence in marginal countries of its business (sold retail business in Bosnia-Herzegovina, Serbia, Croatia, quit Bayernoil)
• Strong competition putting pressure on margins
• Practically flat diesel demand
• Gasoline oversupply
• Huge black product surplus
Survival of refineries depends on effective adaptation to demand
patterns
17
> 200 kbbl/d
Refinery capacity:
100 - 200 kbbl/d < 100 kbbl/d

AGENDA
MOL Group Downstream at a glance
European drivers of middle distillates
CEE situation
Potential answers
18

19
Retail is valuable asset in balancing due to favorable gasoline/diesel ratio
Retail Total Market
Gasoline/diesel ratio*
• Gasoline : Diesel ratio above 1:2 can hardly be handled by refinery configuration
• Besides refinery technology solutions also marketing strategies need to be adjusted to be able cope with further increasing share of diesel in fuel sales
Note: Gasoline/diesel ratio of CEE countries (Hungary, Slovakia, Czech Republic, Austria, Poland, Romania, Croatia, Serbia) 2012 Source: PFC

Petchem integration can offer synergy opportunities for refiners
Non-Ethylene derivatives (production based on heavier feedstock – naphtha, gasoil)
● A switch to lighter feedstocks has reduced the amount of butadiene and propylene available
● Naptha-based petchem products can have significant value added to downstream operations
● Recent and ongoing capacity additions in Central Europe
● PTA/PX:
● Mixed xylene:
● Butadiene:
change in % 2007-2013
Non-ethylene derivatives – naphtha spread Product yields from 1 tonne of feedstock
Source: Nexant, Bloomberg BTX: Benzene, Toluene, Xylene
20
21
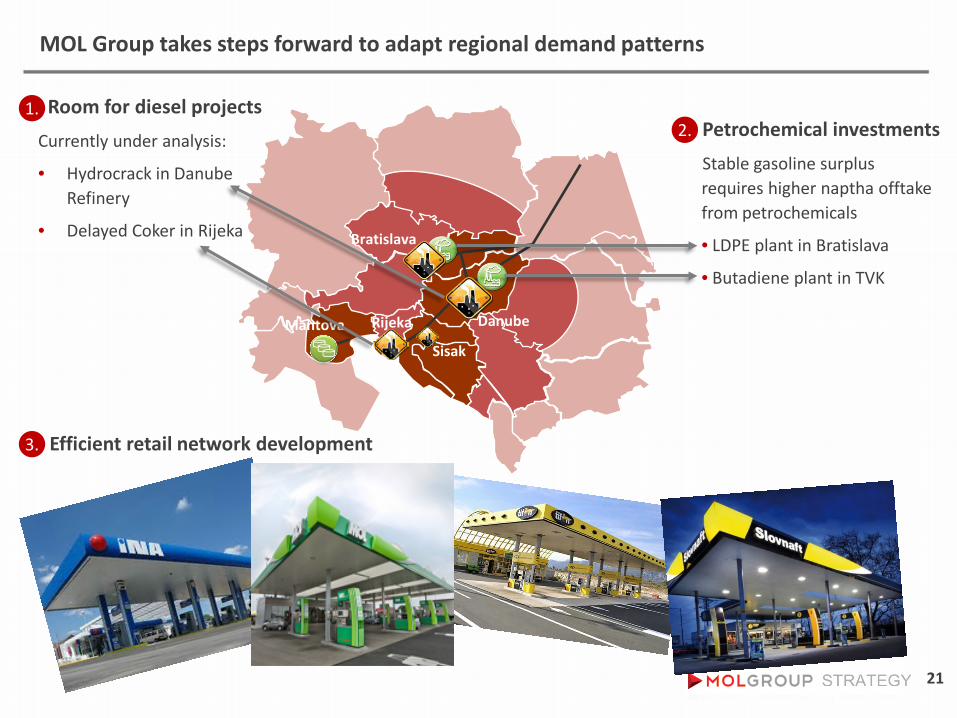
MOL Group takes steps forward to adapt regional demand patterns
Room for diesel projects Currently under analysis:
• Hydrocrack in Danube Refinery
• Delayed Coker in Rijeka
Bratislava
Danube
Sisak
Rijeka Mantova
Petrochemical investments Stable gasoline surplus requires higher naptha offtake from petrochemicals
• LDPE plant in Bratislava
• Butadiene plant in TVK
Efficient retail network development
1. 2.
3.