GSA Bulletin; October 2000; v. 112; no. 11; p. 000–000; 14 figures; 3 tables. Middle Miocene tectonic development of the Transition Zone, Salta Province, northwest Argentina: Magnetic stratigraphy from the Meta ´n Subgroup, Sierra de Gonza ´lez J.H. Reynolds* Division of Environmental Studies, Mathematics, and Natural Sciences, Brevard College, Brevard, North Carolina 28712, USA C.I. Galli R.M. Herna ´ndez XR Exploracionistas y Servicios Regionales, s.r.l., Manzana N—Casa 14-1Etapa, BGeneral Belgrano, Salta 4400, Argentina B.D. Idleman Department of Earth and Environmental Sciences, Lehigh University, 30 Williams Drive, Bethlehem, Pennsylvania 18015, USA J.M. Kotila R.V. Hilliard Department of Geosciences and Natural Resources Management, Western Carolina University, Cullowhee, North Carolina 28723, USA C.W. Naeser U.S. Geological Survey, M.S. 926A, National Center, Reston, Virginia 20192, USA ABSTRACT Magnetostratigraphy, isotopic dating, and sandstone petrography establish age limits on the depositional history of 2100 m of foreland basin strata in the Neogene Meta ´n Subgroup of northwest Argentina. The strata were deposited between ca. 15.1 and 9.7 Ma in the eastern Sistema de Santa Ba ´rbara. The region is positioned above the Cretaceous Salta rift basin, in the Transi- tion Zone between modern relatively steep and flat subducting segments of the Nazca plate. Formations within the subgroup are shown to be diachronous over a 60 km dis- tance; the younger ages are in the east. Changes in paleocurrent flow directions and the lithic clast component of sandstones collected from the Arroyo Gonza ´lez section suggest that basal fluvial strata were de- rived from the craton to the east beginning in middle Miocene time, just prior to 15.1 Ma. By ca. 14.5 Ma, the paleocurrent flowed from a source in the west and sedi- *Second address: Magstrat, LLC, P.O. Box 300, Webster, North Carolina 28788, USA; e-mail: [email protected]. ment accumulation rates increased dramat- ically. These changes correlate with con- temporaneous tectonism in the west. A local increase in basin accommodation may be partly related to a zone of weakness near the eastern boundary of the Salta rift. Uplift in the western Cordillera Oriental apparently began by 13.7 Ma and thrusting rapidly migrated eastward. The eastern Cordillera Oriental ranges began to rise be- tween 25and 26S ca. 10 Ma. As thrusting migrated eastward, low-energy depositional environments were overwhelmed ca. 13.7 Ma. Above an erosional unconformity that removed strata to an age of ca. 9.7 Ma, bas- al strata from the overlying Jujuy Sub- group were deposited beginning after 9 Ma. Sandstones from Rı ´o Yacones suggest that the Cordillera Oriental uplift contin- ued for several million years longer be- tween 24and 25S. Uplift of the Sistema de Santa Ba ´rbara, in the distal portion of the foreland, did not begin until after ca. 9 Ma. Keywords: Argentine Andes, magnetostra- tigraphy, Neogene, Salta Argentina, tecton- ics, transition zones. INTRODUCTION The Central Andes are frequently cited as a type example for mountain ranges generated from the subduction of oceanic lithosphere be- neath a continent (e.g., Moores and Twiss, 1995; van der Pluijm and Marshak, 1997). The foreland deformational style between Peru and northwest Argentina may behave as a classic Davis et al. (1983) type of orogenic wedge, but surprisingly little is known about the chronology of deformation in the foreland region to confirm that the strata deformed in the classic fashion. The Subandean zone (Fig. 1) is host to hy- drocarbon production and exploration along most of its length in Bolivia and north of 27S in Argentina, but few numerically dated ho- rizons exist in the foreland basin strata. Pub- lished interpretations of structural history, tec- tonic reconstructions, and petroleum genesis models that are applied today lack a concise chronological foundation. To rectify this situ- ation we are attempting to determine the age of basin-filling strata from the best-exposed stratigraphic sections in the foreland region to understand their relationships to the structures and to determine the provenance of their sed- iment. This will allow the construction of new
Transcript
GSA Bulletin; October 2000; v. 112; no. 11; p. 000–000; 14 figures; 3 tables.
Middle Miocene tectonic development of the Transition Zone,Salta Province, northwest Argentina: Magnetic stratigraphy from the
Metan Subgroup, Sierra de Gonza´lez
J.H. Reynolds*Division of Environmental Studies, Mathematics, and Natural Sciences, Brevard College, Brevard, North Carolina 28712, USA
C.I. GalliR.M. HernandezXR Exploracionistas y Servicios Regionales, s.r.l., Manzana N—Casa 14-1� Etapa, B� General Belgrano, Salta 4400, Argentina
B.D. IdlemanDepartment of Earth and Environmental Sciences, Lehigh University, 30 Williams Drive, Bethlehem, Pennsylvania 18015, USA
J.M. KotilaR.V. HilliardDepartment of Geosciences and Natural Resources Management, Western Carolina University, Cullowhee, North Carolina28723, USA
C.W. NaeserU.S. Geological Survey, M.S. 926A, National Center, Reston, Virginia 20192, USA
ABSTRACT
Magnetostratigraphy, isotopic dating,and sandstone petrography establish agelimits on the depositional history of �2100m of foreland basin strata in the NeogeneMetan Subgroup of northwest Argentina.The strata were deposited between ca. 15.1and 9.7 Ma in the eastern Sistema de SantaBarbara. The region is positioned above theCretaceous Salta rift basin, in the Transi-tion Zone between modern relatively steepand flat subducting segments of the Nazcaplate.
Formations within the subgroup areshown to be diachronous over a 60 km dis-tance; the younger ages are in the east.Changes in paleocurrent flow directionsand the lithic clast component of sandstonescollected from the Arroyo Gonzalez sectionsuggest that basal fluvial strata were de-rived from the craton to the east beginningin middle Miocene time, just prior to 15.1Ma. By ca. 14.5 Ma, the paleocurrentflowed from a source in the west and sedi-
ment accumulation rates increased dramat-ically. These changes correlate with con-temporaneous tectonism in the west. A localincrease in basin accommodation may bepartly related to a zone of weakness nearthe eastern boundary of the Salta rift.
Uplift in the western Cordillera Orientalapparently began by 13.7 Ma and thrustingrapidly migrated eastward. The easternCordillera Oriental ranges began to rise be-tween 25� and 26�S ca. 10 Ma. As thrustingmigrated eastward, low-energy depositionalenvironments were overwhelmed ca. 13.7Ma. Above an erosional unconformity thatremoved strata to an age of ca. 9.7 Ma, bas-al strata from the overlying Jujuy Sub-group were deposited beginning after 9 Ma.
Sandstones from Rı´o Yacones suggestthat the Cordillera Oriental uplift contin-ued for several million years longer be-tween 24� and 25�S. Uplift of the Sistema deSanta Barbara, in the distal portion of theforeland, did not begin until after ca. 9 Ma.
The Central Andes are frequently cited as atype example for mountain ranges generatedfrom the subduction of oceanic lithosphere be-neath a continent (e.g., Moores and Twiss,1995; van der Pluijm and Marshak, 1997).The foreland deformational style betweenPeru and northwest Argentina may behave asa classic Davis et al. (1983) type of orogenicwedge, but surprisingly little is known aboutthe chronology of deformation in the forelandregion to confirm that the strata deformed inthe classic fashion.
The Subandean zone (Fig. 1) is host to hy-drocarbon production and exploration alongmost of its length in Bolivia and north of 27�Sin Argentina, but few numerically dated ho-rizons exist in the foreland basin strata. Pub-lished interpretations of structural history, tec-tonic reconstructions, and petroleum genesismodels that are applied today lack a concisechronological foundation. To rectify this situ-ation we are attempting to determine the ageof basin-filling strata from the best-exposedstratigraphic sections in the foreland region tounderstand their relationships to the structuresand to determine the provenance of their sed-iment. This will allow the construction of new
Geological Society of America Bulletin, October 2000
REYNOLDS et al.
Figure 1. Map illustrating the structural provinces in northwest Argentina (adapted fromGrier et al., 1991). The boundary between the Transition Zone and the inclined subductionarea to the north is located at �24�S, where the Cordillera Oriental narrows. Cross-sectionX–X� is shown in Figure 2. The area illustrated in Figure 3 is outlined by the openrectangle. The Arroyo Gonzalez area (Fig. 4) is shown by the white rectangle. The Su-bandean zone boundary between the Sierras Subandinas and the Sistema de Santa Bar-bara follows the trend of the Santa Barbara Ranges (Fig. 3B). The irregular southernlimit of the Transition Zone is marked by the boundary with the Sierras Pampeanas.Heavy dashed lines denote the approximate boundaries of the Salta rift (white arrows ondownthrown side). Rıo Iruya (IR) is located in the Sierras Subandinas.
models that describe the paleogeographic evo-lution of the basins and mountain ranges.
The work reports the chronologic develop-ment of middle Miocene sedimentation in theSistema de Santa Barbara portion (Fig. 1) ofthe Transition Zone at the southern end of theSubandean zone. Using dating from magneticpolarity stratigraphy aided by a fission-trackage and chronologic information from otherareas in the Transition Zone, crosscutting re-lations, and changes in the lithic content of thesandstones, we interpret the middle Miocenetectonic development of the region.
Nazca plate subduction is characterized bysignificant along-strike subduction anglechanges beneath the western margin of SouthAmerica (Jordan et al., 1983). Foreland struc-tural provinces of northwest Argentina devel-oped in three tectonic domains characterizedby differences in the subduction angle and theorientation of preexisting structural fabrics.An area of inclined subduction where the Naz-ca plate descends at an angle of about 30� tothe east is between 18� and 24�S. Farther tothe south, between 28� and 33�S, is an area ofsubhorizontal (�5�) subduction (Barazangiand Isacks, 1976). The Transition Zone is sit-uated between these subduction domains(24�–28�S).
TRANSITION ZONE PROVINCES
Our work focuses on the middle Miocenetectonic history of the northern part of theTransition Zone (24�–26�S). Structural aspectsof the Neogene foreland provinces to the northof the Transition Zone continue along strikethrough the Transition Zone but undergomarked changes before terminating at thesouthern margin (Barazangi and Isacks, 1976;Jordan et al., 1983; Allmendinger et al., 1983).Bevis and Isacks (1984) proposed that thesubducting plate is deformed by a broad gen-tle flexure through the Transition Zone.
Salta Rift Basin
Grier et al. (1991) demonstrated that the ge-ometries of Andean tectonism in the Transi-tion Zone are consistent with the inversion ofthe Cretaceous Salta rift basin and with Neo-gene shortening by thrust reactivation of Cre-taceous listric normal faults. Westward ver-gence in the western Cordillera Oriental por-tion of the Transition Zone (Fig. 2) is localizednear the western boundary of the Salta rift ba-sin, where the Puna and the western CordilleraOriental meet (Grier et al., 1991). The easternpart of the Sistema de Santa Barbara (dis-cussed in the following) is located above the
eastern boundary of the rift. The northern lim-it of the Sierras Pampeanas is located roughlyalong the southern rift margin.
The rift is partitioned into six named sub-basins: the Lomas de Olmedo, Tres Cruces,Sey, Alemanıa, El Rey, and Metan (Fig. 3).The subbasins are grouped around the centralSalta-Jujuy structural high (Fig. 3; Marquillasand Salfity, 1988; Mon and Salfity, 1995) andare filled with Salta Group strata (Table 1).
Compressional regional stresses were initi-ated by Neogene time. Continental clasticstrata of the Oran Group buried the rift duringthe Quechua phase of the Andean orogeny as
a foreland basin developed eastward acrossthe area (Comınguez and Ramos, 1995).
Puna
The Puna Plateau is situated along the Ar-gentina-Chile border between the main rangeof the Andes and the Cordillera Oriental. Itrepresents the southern extension of the broad-er Altiplano that is to the north in Bolivia andPeru. The Puna-Altiplano is characteristic ofthe inclined subduction region. It continuesthrough the Transition Zone, tapering to itsterminus at the southern margin. Mean basin
Geological Society of America Bulletin, October 2000
MIDDLE MIOCENE TECTONIC DEVELOPMENT OF THE TRANSITION ZONE
Figure 2. Balanced cross section of the Transition Zone at 25�30�S (modified from Grier et al., 1991).
TABLE 1. STRATIGRAPHY OF THE ORAN ANDSALTA GROUPS
Group Subgroup Formation Age
Oran Jujuy Piquete Pliocene–Pleistocene
Guanaco Miocene–PlioceneMetan Jesus Marıa Middle–upper
elevations of �3400 m characterize this inter-nally draining region. Hundreds of Pleistocenevolcanoes with summit elevations above 5000m are present across the plateau system. Van-dervoort et al. (1995) dated Neogene evaporitedeposits on the Puna and concluded that in-ternal drainage was probably established byca. 15 Ma, suggesting a similar age for theinitiation of uplift.
A wide range of lithologies is present onthe Puna (Cladouhos et al., 1994). The oldeststrata are Neoproterozoic–Cambrian shallow-marine metasedimentary rocks of the Puncov-iscana Formation. Ordovician metasedimen-tary and metavolcanic rocks are the mostabundant rocks exposed on the Puna. Creta-ceous and Tertiary continental strata of theSalta Group fill the Tres Cruces subbasin ofthe Salta rift. Neogene sedimentary and vol-canic strata cover large areas.
Cordillera Oriental
The Cordillera Oriental is a predominantlyeastward-verging fold-thrust belt bounding theeastern edge of the Puna (Fig. 1) in the in-clined subduction region. Vergence in the
Transition Zone varies from predominantlywestward verging in the west to eastwardverging in the east (Fig. 2), resulting from re-activation of the rift-bounding faults (Grier etal., 1991). The Cordillera Oriental is wider inthe Transition Zone than it is in the inclinedsubduction area (Fig. 1). Grier and Dallmeyer(1990) suggested that eastward progression ofdeformation in the Cordillera Oriental at theselatitudes was faster than that in the SierrasPampeanas immediately to the south.
Many peaks rise above 5000 m along steep-ly dipping fault planes. Rapid Neogene upliftcaused significant unroofing of these ranges.In many ranges, greenish phyllites are ex-posed along with the Phanerozoic strata. Likethe Puna, the Cordillera Oriental and Suban-dean zone also terminate along the irregularsouthern boundary of the Transition Zone(Jordan et al., 1983). Uplift of the CordilleraOriental began in the late Oligocene in Bolivia(Horton, 1998) but appears to have started inthe middle Miocene in northern Argentina(Reynolds et al., 1996; Hernandez et al., 1996,1999).
In the southern Transition Zone, two rangesof the Sierras Pampeanas are wedged betweenthe Puna and Cordillera Oriental, extending tothe north of 26�S. The Sierras Pampeanas areLaramide-style basement uplifts found in theeastern foreland region of the flat subductiondomain (Jordan and Allmendinger, 1986).
Sistema de Santa Barbara
The Subandean zone in the Transition Zoneis defined by the Sistema de Santa Barbara,the only structural province confined exclu-sively to the Transition Zone (Fig. 1). The re-gion is densely vegetated and humid, subtrop-ical conditions cause deep weathering profiles.Exposure is limited to arroyos incised into theflanks of Neogene mountains, where rapid
downcutting provides fresh, relatively contin-uous exposures along select streams.
Structures in this province exhibit affinitieswith the basement block uplifts of the SierrasPampeanas immediately to their south. Thebasement cores of the Sistema de Santa Bar-bara ranges have not been unroofed due to athick sedimentary cover provided by infillingof the Salta rift basin thrusting (Allmendingeret al., 1983). Like the Sierras Pampeanas, theSistema de Santa Barbara is characterized bypredominantly broad, low-amplitude foldsgenerated by predominantly westward-vergentthrusting (Allmendinger et al., 1983).
Gebhard et al. (1974) summarized the Ter-tiary lithostratigraphic units and published agood regional geologic map. Other strati-graphic contributions by Russo and Serraiotto(1978) and Mingramm and Russo (1972) con-stitute the basis of the stratigraphic work inthe region. Jordan and Alonso (1987) includedthe province in their regional analysis of theSubandean zone.
To the north of the Transition Zone, the Su-bandean zone on the east side of the CordilleraOriental is occupied by the Sierras Subandi-nas. The Sierras Subandinas arose along pre-dominantly eastward-verging thrust faults, be-ginning in the late Miocene (Hernandez et al.,1996, 1999; Reynolds et al., 1993, 1996).Nearly all of the rocks exposed in this regionare Neogene foreland basin-filling strata.These rocks were uplifted and exposed aseastward-migrating thrusting progressedthrough western parts of the Subandean basin.Older strata are exposed in Bolivia. The re-gion has recently received much attentionfrom the petroleum industry (Belotti et al.,1995; Hernandez et al., 1996, 1999; Morettiet al., 1996; Giraudo et al, 1999), but is stillrelatively unknown in the geologic literature.
Field Area
Our work was conducted in the El Rey sub-basin area of the Salta rift (Fig. 3A). Arroyo
Geological Society of America Bulletin, October 2000
REYNOLDS et al.
Figure 3. Location maps of localities referred to in this work. (A) Map of the Salta rift, modified from Marquillas and Salfity (1988),showing Salta rift subbasins and the Salta-Jujuy high. Isopachs (in km) denote the thickness of Salta Group strata in the varioussubbasins. The Tres Cruces subbasin (not shown) trends northward north of Jujuy (Fig. 1). (B) Map showing the location of mountainranges, rivers, valleys, and paleomagnetic sections. The mountain ranges are: CC—Cumbres Calchaquıes, SC—Sierra de Carahuasi,SCa—Sierra de Candelaria, SGA—Sierra de Gallo, SG—Sierra de Gonzalez, SLM—Sierra del Leon Muerto, SL—Sierra de Lumbrera,SMG—Sierra de Maız Gordo, SM—Sierra de Metan–Sierra del Creston, SMO—Sierra de Mojotoro, SQ—Sierra de Quilmes, SSB—Sierra de Santa Barbara. VL—Valle de Lerma. The paleomagnetic sections (white circles) are: AG—Angastaco, AM—Alemanıa, MT—Rıo Metan, RP—Rıo Piedras, RY—Rıo Yacones. A map of the Arroyo Gonzalez (GZ) area (white rectangle) is shown in Figure 4. Whiteareas are lowlands and valleys. Light gray areas are relative highlands, generally at elevations between 1500 and 3000 m. Dark grayareas are highlands with elevations above 3000 m, including a basin outlined in the northwest corner high on the Puna.
Gonzalez is located on the eastern flank of theSierra de Gonzalez in the eastern Sistema deSanta Barbara (Fig. 3B). It is one of manytributaries of the Rıo Juramento, the trunkstream in the region. Headwaters of the ante-cedent Rıo Juramento flow from the easternflank of the Puna, northern Sierras Pampeanas,and Cordillera Oriental (Fig. 3B). Located inthe eastern portion of the Transition Zone, theArroyo Gonzalez section provides the best-ex-posed and thickest record of middle Miocenedistal foreland basin sedimentation at �25�S.
The Sierra de Gonzalez is located in theeastern part of the Salta rift and was upliftedalong a westward-verging fault. Mon and Salf-ity (1995) attributed the westward vergence toa backthrust splaying off an eastward-vergingfault that probably is a reactivated Cretaceousnormal fault. The Sierra de Gonzalez is abroad anticlinal structure that exposes Devo-
nian, Upper Cretaceous, Paleogene, and Neo-gene strata (Fig. 4). Most of the mountains inthis region strike north-northeast, but the Si-erra de Gonzalez and the ranges immediatelyto the west have a northerly strike.
STRATIGRAPHY
Pre-Neogene Strata
The subbasins filled with synrift continentalclastic sediment and basalt flows of the UpperCretaceous Pirgua Subgroup at the base of theSalta Group (Table 1). The Salta Group con-tinued infilling with postrift strata throughoutthe Late Cretaceous and Paleogene. The onlysignificant departure from clastic sedimenta-tion was the deposition of limestone and marlin the Maastrichtian Yacoraite Formation. TheYacoraite limestone is the major source and
reservoir rock for the hydrocarbon resourcesin this area. Above the Yacoraite Formation isthe Lumbrera Formation, which consists ofdark reddish sandstones, siltstones, and mud-stones deposited in Paleocene and Eocenetime (Sempere et al., 1997).
Oran Group
We investigated the Oran Group, a packageof Neogene, continental, foreland basin-fillingunits distributed unevenly across the Transi-tion Zone above the Salta Group. A discon-formable relationship exists between the Lum-brera Formation and the overlying OranGroup (Gebhard et al., 1974; Russo and Ser-raiotto, 1978), where our work took place.
Oran Group strata in the Arroyo Gonzalezsection are �5000 m thick (Gebhard et al.,1974). They provide the distal record of oro-
Geological Society of America Bulletin, October 2000
MIDDLE MIOCENE TECTONIC DEVELOPMENT OF THE TRANSITION ZONE
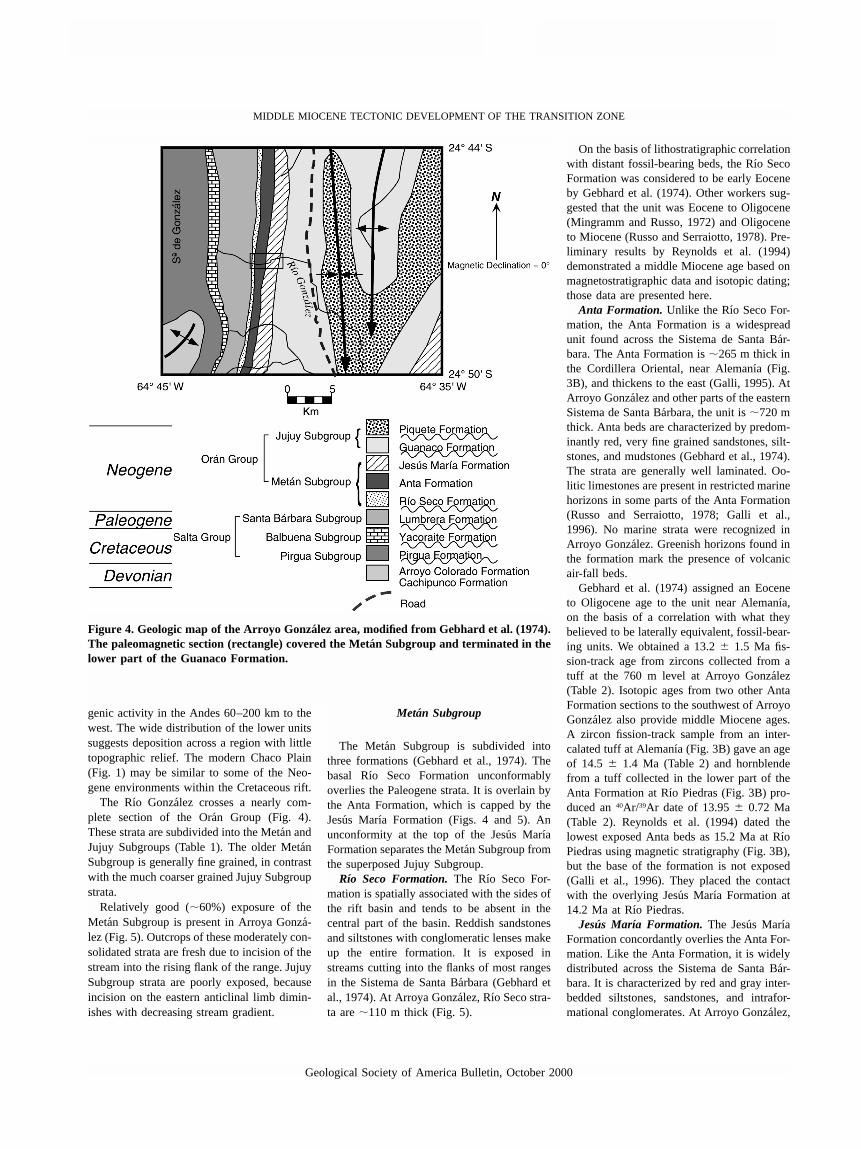
Figure 4. Geologic map of the Arroyo Gonzalez area, modified from Gebhard et al. (1974).The paleomagnetic section (rectangle) covered the Metan Subgroup and terminated in thelower part of the Guanaco Formation.
genic activity in the Andes 60–200 km to thewest. The wide distribution of the lower unitssuggests deposition across a region with littletopographic relief. The modern Chaco Plain(Fig. 1) may be similar to some of the Neo-gene environments within the Cretaceous rift.
The Rıo Gonzalez crosses a nearly com-plete section of the Oran Group (Fig. 4).These strata are subdivided into the Metan andJujuy Subgroups (Table 1). The older MetanSubgroup is generally fine grained, in contrastwith the much coarser grained Jujuy Subgroupstrata.
Relatively good (�60%) exposure of theMetan Subgroup is present in Arroya Gonza-lez (Fig. 5). Outcrops of these moderately con-solidated strata are fresh due to incision of thestream into the rising flank of the range. JujuySubgroup strata are poorly exposed, becauseincision on the eastern anticlinal limb dimin-ishes with decreasing stream gradient.
Metan Subgroup
The Metan Subgroup is subdivided intothree formations (Gebhard et al., 1974). Thebasal Rıo Seco Formation unconformablyoverlies the Paleogene strata. It is overlain bythe Anta Formation, which is capped by theJesus Marıa Formation (Figs. 4 and 5). Anunconformity at the top of the Jesus MarıaFormation separates the Metan Subgroup fromthe superposed Jujuy Subgroup.
Rıo Seco Formation.The Rıo Seco For-mation is spatially associated with the sides ofthe rift basin and tends to be absent in thecentral part of the basin. Reddish sandstonesand siltstones with conglomeratic lenses makeup the entire formation. It is exposed instreams cutting into the flanks of most rangesin the Sistema de Santa Barbara (Gebhard etal., 1974). At Arroya Gonzalez, Rıo Seco stra-ta are �110 m thick (Fig. 5).
On the basis of lithostratigraphic correlationwith distant fossil-bearing beds, the Rıo SecoFormation was considered to be early Eoceneby Gebhard et al. (1974). Other workers sug-gested that the unit was Eocene to Oligocene(Mingramm and Russo, 1972) and Oligoceneto Miocene (Russo and Serraiotto, 1978). Pre-liminary results by Reynolds et al. (1994)demonstrated a middle Miocene age based onmagnetostratigraphic data and isotopic dating;those data are presented here.
Anta Formation. Unlike the Rıo Seco For-mation, the Anta Formation is a widespreadunit found across the Sistema de Santa Bar-bara. The Anta Formation is �265 m thick inthe Cordillera Oriental, near Alemanıa (Fig.3B), and thickens to the east (Galli, 1995). AtArroyo Gonzalez and other parts of the easternSistema de Santa Barbara, the unit is �720 mthick. Anta beds are characterized by predom-inantly red, very fine grained sandstones, silt-stones, and mudstones (Gebhard et al., 1974).The strata are generally well laminated. Oo-litic limestones are present in restricted marinehorizons in some parts of the Anta Formation(Russo and Serraiotto, 1978; Galli et al.,1996). No marine strata were recognized inArroyo Gonzalez. Greenish horizons found inthe formation mark the presence of volcanicair-fall beds.
Gebhard et al. (1974) assigned an Eoceneto Oligocene age to the unit near Alemanıa,on the basis of a correlation with what theybelieved to be laterally equivalent, fossil-bear-ing units. We obtained a 13.2 � 1.5 Ma fis-sion-track age from zircons collected from atuff at the 760 m level at Arroyo Gonzalez(Table 2). Isotopic ages from two other AntaFormation sections to the southwest of ArroyoGonzalez also provide middle Miocene ages.A zircon fission-track sample from an inter-calated tuff at Alemanıa (Fig. 3B) gave an ageof 14.5 � 1.4 Ma (Table 2) and hornblendefrom a tuff collected in the lower part of theAnta Formation at Rıo Piedras (Fig. 3B) pro-duced an 40Ar/39Ar date of 13.95 � 0.72 Ma(Table 2). Reynolds et al. (1994) dated thelowest exposed Anta beds as 15.2 Ma at RıoPiedras using magnetic stratigraphy (Fig. 3B),but the base of the formation is not exposed(Galli et al., 1996). They placed the contactwith the overlying Jesus Marıa Formation at14.2 Ma at Rıo Piedras.
Jesus Marıa Formation. The Jesus MarıaFormation concordantly overlies the Anta For-mation. Like the Anta Formation, it is widelydistributed across the Sistema de Santa Bar-bara. It is characterized by red and gray inter-bedded siltstones, sandstones, and intrafor-mational conglomerates. At Arroyo Gonzalez,
Geological
Societyof
Am
ericaB
ulletin,O
ctober2000
RE
YN
OL
DS
etal.
Figure 5. The Arroyo Gonzalez stratigraphic section (adapted from Yacimientos Petrolıferos Fisicales field records). Paleomagnetic site locations and their polarities aremarked with black and white circles. The dated tuff is located at the 760 m level in the Anta Formation.
Geological Society of America Bulletin, October 2000
MIDDLE MIOCENE TECTONIC DEVELOPMENT OF THE TRANSITION ZONE
TABLE 2. FISSION TRACK AGES (ZIRCON) FROM AIR-FALL VOLCANIC BEDSIN THE ANTA FORMATION
Note: Ratios corrected for extraction line blank, discrimination (0.33%/m.u.), and decay of 37Ar and 39Ar. J �0.0079470 � 0.5%. (40Ar/39Ar)K � 2.4 � 10–2, (36Ar/37Ar)Ca � 2.8 � 10–4, (39Ar/37Ar)Ca � 7.0 � 10–4. Age calculatedusing the decay constants recommended by Steiger and Jager (1977).
TABLE 4. CONTACT AGES WITHIN THE METAN SUBGROUP AT ALEMANIA, RIO PIEDRAS, ANDARROYO GONZALEZ
Top of Jesus Marıa N.P. ca. 13.0 ca. 9.7Anta–Jesus Marıa 14.8–14.6 (14.7 est.) 14.9–14.8 ca. 13.7Rıo Seco–Anta 15.0–14.9 �15.2 ca. 14.8Base of Rıo Seco N.P. N.P. ca. 15.1
Note: N.P.—not present.*Reynolds et al. (1994)—Magnetostratigraphy revised to Cande and Kent (1995) global polarity time scale
(GPTS).†Galli et al. (1996)—Magnetostratigraphy revised to Cande and Kent (1995) GPTS.
the Jesus Marıa Formation exhibits two subtlecoarsening-upward cycles (Fig. 5). The uppercycle is truncated disconformably by the over-lying Guanaco Formation. The Jesus MarıaFormation also thickens toward the east, at-taining a thickness of �1120 m at ArroyoGonzalez. On the basis of a K-Ar date froman interbedded air-fall tuff at nearby Rıo Cas-tellanos, Gebhard et al. (1974) considered theJesus Marıa Formation to be an Oligoceneunit. Reynolds et al. (1994) showed that themagnetic stratigraphy corresponds to middleMiocene time between 14.2 Ma and ca. 13.0Ma at Rıo Piedras (Table 3).
Jujuy Subgroup
The Jujuy Subgroup consists of the olderGuanaco and younger Piquete Formations(Fig. 4). Only the basal part of the GuanacoFormation was sampled in the Arroyo Gon-zalez paleomagnetic section.
Guanaco Formation. In most places theGuanaco Formation unconformably overliesthe Jesus Marıa Formation (Gebhard et al.,
1974). The contact is usually disconformable,but an angular unconformity is observed insome areas. Like the Jesus Marıa Formation,the Guanaco Formation coarsens upward.These beds are found in intermontane basinsacross the Transition Zone and exhibit basin-dependent compositional variation.
The contact is not exposed in Arroyo Gon-zalez. Guanaco Formation strata commonlyexhibit medium- to coarse-grained grayish-redsandstones and conglomerates with interbed-ded red to orange siltstone horizons. The basalstrata frequently resemble those of the JesusMarıa Formation, making distinction of thetwo units subtle.
Due to a rapid upsection increase in dis-tances between exposures, the only GuanacoFormation paleomagnetic samples were ob-tained from the basal 120 m (Fig. 5). Gebhardet al. (1974) estimated the total thickness inthis area to be �2150 m. On the basis of anisotopic age they assigned a middle to lateMiocene age to the formation. Viramonte etal. (1994) dated a 900-m-thick portion of theGuanaco Formation as 10.9–6.9 Ma (modified
here to the Cande and Kent [1995] global po-larity time scale) at Rıo Yacones, �100 kmwest of Arroyo Gonzalez (Fig. 3B).
Piquete Formation. The Piquete Formationis composed of dark red to pinkish beds ofpolymictic cobble to boulder conglomerate,coarse- to fine-grained sandstone, and rare silt-stone. Portions of the Piquete Formation areexposed farther downstream in Arroyo Gon-zalez (Fig. 4), but were not sampled in ourstudy. Limestone clasts are common withinthe Piquete Formation in this area. Gebhard etal. (1974) estimated a thickness of 830 m forthe Piquete Formation along the Rıo Gonzalezand assigned a Pliocene age to the unit. Reyn-olds et al. (1994) confirmed this age with 5–2 Ma magnetostratigraphic ages from the Pi-quete Formation at Rıo Metan (Fig. 3B). Mal-amud et al. (1996) reported a Pleistocene fis-sion-track age from a tuff in the upper part ofthe Piquete Formation from the Lerma Valley�100 km to the west of Arroyo Gonzalez(Fig. 3B).
Paleocurrent Data
Ripple marks, cross-beds, and pebble im-brication indicate west-directed paleoflowthroughout the Rıo Seco Formation (Galli,1995). This continues into the lower portionof the Anta Formation at Arroyo Gonzalez, asindicated by cross-bedding in fine-grainedsandstones. In the upper part of the Anta For-mation, however, the paleoflow direction is to-ward the east (Galli, 1995). Ripple marks,cross-bedding, and pebble imbrication suggesta west to east transport throughout the JesusMarıa Formation.
Interpretation
The Rıo Seco Formation is interpreted torepresent an ephemeral fluvial system derivedfrom the craton to the east. The Anta Forma-tion represents a playa lake and/or mudflatsystem. The lake was connected to the marineenvironment during a sea-level highstand. Thereversal of source directions between lowerand upper portions of the unit suggests thatthe lake migrated eastward.
Jesus Marıa Formation strata indicate a re-turn to an ephemeral stream depositional en-vironment. Deposition migrated eastward, fol-lowing the Anta depocenter. The Jesus Marıacoarsening-upward cycles at Arroyo Gonzalezsuggest two uplift events in the source area.
We associate the Guanaco Formation witha high-energy fluvial environment. These stra-ta are best modeled as distal facies of an al-luvial fan. The very coarse grained Piquete
Geological Society of America Bulletin, October 2000
REYNOLDS et al.
Figure 6. Plot of virtual geomagnetic pole (VGP) latitude of paleomagnetic sites vs. strati-graphic level. Polarities are abstracted to the standard black and white magnetic polarityscale to the right. Reversals are placed halfway between sites of different polarities exceptat the unconformable contact between the Jesus Marıa and Guanaco Formations.
Formation can best be interpreted as a medialalluvial fan deposit, probably related to upliftof the Sierra de Gonzalez, the nearest sourcefor the limestone clasts.
MAGNETOSTRATIGRAPHY OF THEARROYO GONZALEZ SECTION
Magnetic polarity stratigraphy was used tocorrelate �2105 m of detrital beds from theArroyo Gonzalez section with the global po-larity time scale (GPTS). Our sampling pro-gram included the complete Metan Subgroupand the lowest 120 m of the overlying Gua-naco Formation. We found 22 geomagneticfield reversals in the section, defining 23 po-larity zones (Fig. 6). A summary of the paleo-magnetic collections, laboratory techniques,and data analysis is reported in the Appendix.
A 13.2 � 1.5 Ma zircon fission-track age(Table 2) from an �2-m-thick air-fall tuff atthe 760 m level in the upper part of the AntaFormation is used to calibrate the magneto-stratigraphic column with the GPTS (Candeand Kent, 1995). The wide error range of thefission track age (14.7–11.7 m.y.) allows pos-sible correlations with several different GPTSnormal polarity zones. We choose the corre-lation shown in Figure 7 because it allows theclosest pattern match with the GPTS. All otherpossible correlations force correlation of along polarity zone with a short zone on theGPTS, or vice versa. Such correlations wouldresult in erratic changes in the sediment ac-cumulation curve (Fig. 8). We see no field ev-idence to support widely varying sediment ac-cumulation rates and choose the interpretationthat produces the sediment accumulation rateshown in Figure 8.
In our correlation we place the base of theNeogene portion of the section at ca. 15.1 Ma(Fig. 7). Our correlation in the Guanaco For-mation at the top of the section is tenuous, dueto diminished exposure and the disconforma-ble relationship between the Jesus Marıa andGuanaco Formations. We tentatively place thetop of the Jesus Marıa Formation at ca. 9.7Ma based on extrapolation of the sediment ac-cumulation rate below the formation boundary(Fig. 8). Given the polarity change in the vi-cinity of an unexposed unconformity and lackof outcrop, the age may be as old as ca. 10Ma. Alternative interpretations are shown indashed gray lines in Figure 7. In this interpre-tation the top of the paleomagnetic section isno older than ca. 9 Ma.
In our temporal interpretation, three shortnormal polarity zones were missed in the Me-tan Subgroup: two between 13.0 and 12.5 Maand one between 11.5 and 10.9 Ma. Polarity
zone durations vary between 30 and 60 k.y.(Cande and Kent, 1995). Given the vicissi-tudes of continental sedimentation, depositionmay not have occurred during some of theseintervals. It is also probable that our samplespacing was not detailed enough to encounterall reversals present in the section.
Our correlation reveals one short reversedpolarity zone, between 380 and 400 m (Figs.6 and 7), that is not seen on the GPTS (Fig.7). It was found in the middle of polaritychron C5ADn (14.612–14.178 Ma; Cande andKent, 1995). Reynolds et al. (1990) showed amagnetic excursion within this same polarityinterval at Las Juntas in La Rioja Province,Argentina. An excursion is also seen at RıoPiedras (Galli et al., 1996). McDougall et al.(1984, their Fig. 4) reported a reversal at aboutthis same time in the latitude of virtual pole
column from the basaltic lava pile in north-west Iceland. We suggest that we serendipi-tously sampled this excursion. Its reversed po-larity was confirmed at Arroyo Gonzalez withfour closely spaced (1 m) samples in 1995.
An alternative interpretation is that the re-versed zone between 380 and 400 m is not anexcursion within C5ADn but should be cor-related with another chron (shown in dashedgray lines in Fig. 7). The alternative interpre-tation forces correlation of a 280-m-thick nor-mal polarity zone (590–870 m) defined bynine stations (Fig. 6) with a GPTS normalzone that lasted �210 k.y. This would trans-late to a sustained sediment accumulation rateof 1.33 mm/yr over the length of the polarityzone. This extremely rapid rate would appearas an accumulation spike in the Anta Forma-tion. The Anta Formation exhibits no remark-
Geological Society of America Bulletin, October 2000
MIDDLE MIOCENE TECTONIC DEVELOPMENT OF THE TRANSITION ZONE
Figure 7. Correlation of the Arroyo Gonzalez magnetic stratigraphy with the global po-larity time scale of Cande and Kent (1995). The preferred correlation suggests that theMetan Subgroup was deposited between 15.1 and 9.7 Ma. A less favored alternative cor-relation is shown with dashed gray lines. Dashed gray lines at the top of the columnprovide alternate interpretations for the age of the unconformity.
able changes in its upper part to justify sucha spike. To the contrary, its constitution is re-markable only in its uniformity in the upper450 m (Fig. 5). For this reason and the reasonsstated herein, we reject the alternative modelin deference to a model with a short, new,reversely polarized zone between 14.612 and14.178 Ma.
The ages of the formation boundaries,based on our correlation with the GPTS, ap-pear in Table 3. The base of the Rıo Seco For-mation is dated as 15.2–15.0 Ma at ArroyoGonzalez. The Rıo SecoAnta contact isplaced at 14.8 Ma and the AntaJesus Marıacontact is placed at 13.7 Ma. The youngestJesus Marıa strata were deposited ca. 9.7 Maat Arroyo Gonzalez (Table 3).
A plot of the stratigraphic level of reversalsvs. their age (Fig. 8) indicates a mean sedi-ment accumulation rate of 0.3 mm/yr in theRıo Seco Formation. This rate continues in theAnta Formation until ca. 14.5 Ma, when itdoubles to 0.6 mm/yr. It then diminishes to
0.3 mm/yr in the Jesus Marıa Formation. Incontrast, sediment accumulated at a relativelyconstant rate of 0.3 mm/yr throughout the 2.3m.y. for which there is a record at Rıo Piedras.At Rıo Piedras, 100 m of the Anta Forma-tion are exposed and the Jesus Marıa Forma-tion is �400 m thick (Galli et al., 1996). Dueto the uncertainties in our correlation of theGuanaco Formation, we do not present its sed-iment accumulation history.
PROVENANCE STUDY
We collected 18 medium-grained sandstonesfrom the Neogene portion of the Arroyo Gon-zalez section to study sediment provenance: 2samples from the Rıo Seco Formation, 3 fromthe Anta Formation, 11 from the Jesus MarıaFormation, and 2 from the Guanaco Formation.Except at the base of the unit, the Anta For-mation was too fine grained for the method tobe effective. Six additional sandstones weresampled from the Guanaco Formation within
the section investigated by Viramonte et al.(1994) at Rıo Yacones, west of Arroyo Gon-zalez (Fig. 3B).
Provenance was determined using the modi-fied Gazzi-Dickinson method, counting 300points per slide (Ingersoll et al., 1984). Thin sec-tions were stained using techniques described byHoughton (1980). Breakdowns of the lithic clastcomponent are shown in Figure 9.
Arroyo Gonzalez
The Arroyo Gonzalez samples (Fig. 9A)show that percentages of metamorphic, plu-tonic, and volcanic clasts are high in the RıoSeco and basal Anta Formations while sedi-mentary fragments are nearly absent. Green-ish-gray tourmalines are also present in thetwo sandstones from the Rıo Seco Formation(ca. 15.1–14.8 Ma). Metamorphic fragmentsconsist of schists and phyllites. The oldest partof the Jesus Marıa Formation also contains anabundance of metamorphic, plutonic, and vol-canic clasts with few sedimentary fragments.The sedimentary percentage increases in thelower third of the Jesus Marıa Formation, be-ginning at the 1100 m level (13.1 Ma). Thistrend continues to the 1225 m level (ca. 12.9Ma) and corresponds to decreases in both themetamorphic and plutonic components. Be-ginning at the 1225 m level (ca. 12.9 Ma), thesedimentary abundance decreases while themetamorphic percentage increases. Thesemetamorphic fragments are overwhelminglyphyllites. At the top of the Jesus Marıa For-mation (ca. 11.5 Ma) sedimentary fragmentsincrease again as the metamorphic and pluton-ic components diminish (Hilliard et al., 1996).Limited data from the Guanaco Formationsuggest a decreasing sedimentary abundanceupsection as metamorphic and plutonic abun-dances increase. The metamorphic fraction iscomposed of phyllite fragments.
Most metamorphic fragments seen in thesandstones were slates and phyllites from theNeoproterozoic–Cambrian Puncoviscana For-mation exposed in the Puna and CordilleraOriental. In the Rıo Seco sandstones, high-grade crystalline rocks are found along withslates and phyllites. The two metamorphicfragment pulses seen in the Jesus Marıa For-mation are overwhelmingly phyllites.
Vadose ooids (Carozzi, 1993) are present inthe Jesus Marıa Formation between the 1500and 1600 m levels (11.9 to ca. 11.5 Ma).These were the only samples that containedsecondary calcite.
Geological Society of America Bulletin, October 2000
REYNOLDS et al.
Figure 8. Sediment accumulation history for the Metan Subgroup at Arroyo Gonzalezusing measured thicknesses. The sediment accumulation rate doubled ca. 14.5 Ma duringdeposition of the Anta Formation and at about the time that a reversal in paleocurrentflow direction took place. The point with error bars denotes the location and age of thedated tuff. Due to the presence of the unconformity at the top of the Jesus Marıa For-mation, the age of the Guanaco Formation (diagonal lines) and its sediment accumulationrate (dashed line) cannot be established.
Rıo Yacones
Virtually all metamorphic fragments foundin the Rıo Yacones sandstones (Fig. 9B) werephyllites from the Puncoviscana Formation.Sedimentary fragments are absent in the basalpart of the section (older than 8 Ma); meta-morphic and volcanic clasts account for mostof the lithic content. The two uppermost sam-ples (younger than 8 Ma) exhibit a much high-er percentage of sedimentary fragments, ac-companied by a decrease in the metamorphiccontent.
INTERPRETATION
Westward-directed paleoflow directions inthe Rıo Seco and lower Anta Formations com-bined with clasts of phyllites and high-grademetamorphic rocks suggest that sediment inthis area was initially derived from a cratonicsource. The onset of sediment accumulationindicates that foreland subsidence in this area,in response to the Puna uplift, began by ca.15.1 Ma. The source of the sediment mayhave been the forebulge, but was more likelythe eastern boundary of the rift basin, whichis located �45 km to the east. By this timethe low-energy Anta depositional system wasestablished to the southwest of the field area(Reynolds et al., 1994; Galli et al., 1996) inthe Metan and Alemanıa subbasins (Fig. 3A).The reversal of paleoflow directions and the
rapid transition to a high sediment accumula-tion rate in the Anta Formation (Fig. 8) sug-gest that detritus shed from the rising Andesoverwhelmed the local depositional system ca.14.5 Ma (e.g., high volcanic content).
During Anta time at Arroyo Gonzalez (ca.14.813.7 Ma), the distal foreland region wascovered by a playa lake and/or mudflat situ-ated largely within the Cretaceous rift basin(Fig. 10). The same depositional environmentis reported for part of this time at Rıo Piedras(Galli et al., 1996). Similar, contemporaneousfacies are also found in the Rıo Manero For-mation �500 km to the southwest in the west-ern Sierras Pampeanas (Malizia et al., 1995),suggesting that this could be part of a vastdistal foreland depositional system.
The high accumulation rate of westerly de-rived sediment in the Anta (Fig. 8) comparedto the lower rate at Rıo Piedras (Galli et al.,1996) may be related to increased basin ac-commodation caused by anomalously rapidbasin subsidence in the distal portion of theforeland. This possibility is supported by thelocation of the area in a subsiding forelandbasin near the zone of weakness along theeastern boundary of the Salta rift.
The rise of the sedimentary lithic clast con-tent in the lower Jesus Marıa Formation (Fig.9A), followed by a rise in metamorphic clastcontent as the sedimentary component de-creases, suggests the unroofing of a rising
mountain range ca. 13 Ma. The second in-crease in sedimentary lithic fragments occursat the top of the Jesus Marıa Formation ca.11.9–9.7 Ma. Metamorphic fragments in-crease in the basal Guanaco strata above theunconformity.
The presence of phyllite as the primarymetamorphic component suggests possiblesource areas in the Puna, Cordillera Oriental,or the Sierra de Quilmes and Cumbres Cal-chaquıes, in the northern Sierras Pampeanas(Fig. 3B). Although the Puna is a possiblesource, Butz et al. (1995) found that Puna-derived sands contained both Puncoviscanaphyllites and high-grade metamorphic frag-ments. Butz et al. (1995) eliminated the Sierrade Quilmes as a possible source by demon-strating that it began to rise ca. 12 Ma.
Cordillera Oriental uplifts exposing thePuncoviscana Formation are numerous. Rang-es around the city of Salta are drained todayby the Rıo Mojotoro (Fig. 3B). Sandstonesfrom the Rıo Yacones section are all derivedfrom the Cordillera Oriental and suggest thatuplift and unroofing of one of the ranges be-gan ca. 8 Ma. Rocks younger than ca. 6.4 Maare cut by an eastward-verging fault at the RıoYacones section near the boundary betweenthe Cordillera Oriental and the Sistema deSanta Barbara (Viramonte et al., 1994). Wecannot place a limit on the earliest CordilleraOriental uplift at this latitude, but to the northof Jujuy, in the inclined subduction area,Reynolds et al. (1996) tentatively dated theinitiation of Cordillera Oriental uplift as ca. 13Ma.
The Rıo Juramento system drains the Sierradel Leon Muerto and the Sierra de Santa Bar-bara in the western part of the Cordillera Ori-ental. It also has tributaries draining the Sierrade Carahuasi in the central part, and the Sierrade Metan–Sierra del Creston on the easternboundary, �80 km southwest of Arroyo Gon-zalez (Fig. 3B). Vilela and Garcıa (1978) andGalvan (1981) mapped the Sierra de SantaBarbara in the western part of the CordilleraOriental (Fig. 3B). (This is a different rangefrom the eponymous range in the northern Sis-tema de Santa Barbara; Fig. 3B.) The Sierrade Santa Barbara in the western CordilleraOriental is located immediately to the north ofthe Cumbres Calchaquıes (Fig. 3B) in thenorthern Sierras Pampeanas. The westward-verging thrust fault in the Sierra de Santa Bar-bara (Vilela and Garcıa, 1978) terminateswithin the Puncoviscana in the Cumbres Cal-chaquıes (Galvan, 1981) and suggests that up-lift of the two is related. Grier and Dallmeyer(1990) demonstrated that there were positivetopographic features in the northern Sierras
Geological Society of America Bulletin, October 2000
MIDDLE MIOCENE TECTONIC DEVELOPMENT OF THE TRANSITION ZONE
Figure 9. Results of sandstone provenance studies in (A) Arroyo Gonzalez and (B) RıoYacones. Lithic fragment components are designated Ls––sedimentary, Lm––metamor-phic, Lp––plutonic, and Lv––volcanic. The isotopic age in B was reported by Viramonteet al. (1994).
Pampeanas by that time. Given the age of theSierra de Quilmes uplift (Butz et al., 1995),we suspect that the Sierra de Santa Barbaraand Cumbres Calchaquıes are the sedimentsources for the base of the Jesus Marıa For-mation, predating the rise of the Sierra deQuilmes. We cannot, however, eliminate thepossibility of sources in the Sierra de LeonMuerto or Sierra de Carahuasi.
Uplift of the Sierra de Metan–Sierra delCreston contributed the second pulse of lithicfragments, starting ca. 10.5 Ma. Support forthis interpretation comes from work in theOran Group at Rıo Piedras and Rıo Metanalong the eastern base of the Sierra de Metan–Sierra del Creston (Fig. 3B; Reynolds et al.,1994; Galli et al., 1996). Sedimentary beds
deposited 14–12 Ma are present in both sec-tions, but neither section has strata deposited11–10 Ma (Galli et al., 1996). In both areas,the 11–10 Ma interval is absent due to a sig-nificant unconformity, suggesting that theseareas were positive features at that time.
Between Arroyo Gonzalez and the Sierra deMetan–Sierra del Creston are two Sistema deSanta Barbara ranges: the Sierra de Maız Gor-do, to the west, and the Sierra Lumbrera, to thesouthwest (Fig. 3B). Our sampling and petro-graphic analyses were unable to establish theuplift ages of these ranges and the Sierra Gon-zalez because they are apparently recorded instrata above the top of our paleomagnetic sec-tion. This suggests that all three ranges roseafter deposition of the top of the paleomagnetic
section, after ca. 9 Ma. We speculate that thedistal fan facies of the Guanaco Formation, inthe eastern Sistema de Santa Barbara, will con-tain abundant sedimentary lithic fragments de-rived from the Sierra de Gallo, Sierra de MaızGordo, and the Sierra Lumbrera. These rangesprobably arose in the late Miocene and Plio-cene. Medial fan facies in the Piquete Forma-tion, in the study area, were probably depositedas the Sierra de Gonzalez rose in late Plioceneand possibly Pleistocene time.
The Rıo Seco, Anta, and Jesus Marıa For-mations (and probably the Guanaco and Pi-quete Formations) are diachronous across theTransition Zone (Table 3). The Rıo Seco–Antaboundary was dated between 15.0 and 14.9Ma at Alemanıa (Reynolds et al., 1994). Thebase of the Anta Formation is older than 15.2Ma at Rıo Piedras (Galli et al., 1996), but is14.8 Ma at Arroyo Gonzalez. The Anta–JesusMarıa contact is at 14.9–14.8 Ma at Rıo Pie-dras and 13.7 Ma at Arroyo Gonzalez. The topof the Anta Formation at Rıo Piedras is con-temporaneous with the top of the Rıo Seco atArroyo Gonzalez. Similarly, the strata at thetop of the Jesus Marıa Formation at Rıo Pie-dras are contemporaneous with those near itsbase at Arroyo Gonzalez. The Jesus Marıa–Guanaco contact is unconformable in both lo-cations; the top of the Jesus Marıa is ca. 13.0Ma at Rıo Piedras (Galli et al., 1996) and ca.9.7 Ma at Arroyo Gonzalez. Younging-to-the-east diachroneity of formational contacts sup-ports models that invoke eastward migrationof uplift.
The vadose ooids found between 11.9 and11.5 Ma suggest arid conditions during thattime. Because this time interval does not cor-relate closely with the uplifts mentioned here,we attribute the aridity to climatic variation.
TECTONIC SYNTHESIS
Uplift of the Puna spawned development ofa foreland basin superposed on the Salta riftbasin. The playa lake and/or mudflat environ-ment of the Anta Formation was establishedat the basin center (Rıo Piedras; Table 3) be-fore 15.2 Ma. The foreland basin began sub-siding in the Arroyo Gonzalez area by ca. 15.1Ma, about the same time as internal drainagewas established on the Puna (Vandervoort etal., 1995). Rivers draining the eastern bound-ary of the rift carried Rıo Seco sediment west-ward into the foreland region (Figs. 11A and12A). Rıo Seco Formation deposition on thewestern side of the basin followed the residualtopographic low of the Salta rift basin. Migra-tion of the Anta Formation depositional en-vironment first reached Arroyo Gonzalez ca.
Geological Society of America Bulletin, October 2000
REYNOLDS et al.
Figure 10. Isopach map of the Metan Subgroup and its lithostratigraphic equivalents(modified from Galli, 1995). A thick, poorly dated pile of wedge-top strata (PayogastillaGroup) is present in the west to the east of the Puna thrust. The thickest accumulationof the Metan Subgroup corresponds to the eastern part of the Salta rift basin (white area).The Rıo Piedras section is located at RP.
14.8 Ma, but sediment flow from the west didnot dominate in the area until ca. 14.5 Ma,when paleocurrent flow directions reversedand the sediment accumulation rate doubled.
Tectonic disruption of the western portionof the foreland basin began ca. 13 Ma as theSierra de Santa Barbara rose along a west-ward-verging thrust fault (Figs. 11B and 12B),in conjunction with uplift of the Cumbres Cal-chaquıes in the northern Sierras Pampeanas.Starting ca. 12 Ma (Figs. 11C and 12C), theSierra de Quilmes, the northernmost range inthe Sierras Pampeanas, began to rise (Butz etal., 1995) on the western boundary of the riftbasin. This contrasts with the younger than 5.5Ma age reported by Strecker et al. (1989) atthe southern end of the range. We are unableto establish the uplift of the Sierra del Leon
Muerto, but speculate that it occurred between13 and 11 Ma (Figs. 11D and 12D). Thrustingwith mixed vergence rapidly migrated east-ward across the central part of the rift basin.By 10 Ma (Figs. 11D and 12E), eastward-verging uplift of the Sierra de Metan–Sierradel Creston commenced. The time of uplift ofthe Sierra de Carahuasi remains unknown, butwe speculate that it also started to rise ca. 10Ma.
We conclude that westward-verging thrust-ing in the Sistema de Santa Barbara occurredafter 9 Ma, uplifting the Sierra de Gallo, Si-erra de Maız Gordo, and Sierra de Lumbrera(represented by the Sierra de Lumbrera inFigs. 11E and 12F). Uplift of the Sierra deGonzalez area (Figs. 11F and 12F) accompa-nied the development of the Sistema de Santa
Barbara province. We speculate that this is theyoungest event, but precise uplift ages withinthe Sistema de Santa Barbara are not yet es-tablished by chronostratigraphy. We cannoteliminate the possibility that post-middle Mio-cene uplift in the eastern part of the forelandbasin migrated from east to west, as it appearsto have done in the Sierras Pampeanas to thesouth (Malizia et al., 1995; Coughlin et al.,1998).
As Transition Zone thrusting migrated east-ward, the foreland basin filled, driving addi-tional eastward progradation. Flexural subsi-dence was impeded beyond the eastern side ofthe former rift basin due to the mechanicalbreak at the rift boundary. Instead, the loadproduced by the eastward-migrating thrustingwas accommodated by short-wavelength,high-amplitude subsidence in the zone ofweakness along the boundary of the rift basin(Watts et al., 1995). This allowed continueddeepening of the basin in the Arroyo Gonzalezarea, at least throughout the time of theAntaJesus Marıa Formations (Fig. 9), duringwhich the low-energy Anta environment grad-ually migrated eastward. It was eventuallyoverwhelmed by progradation of the higherenergy lithofacies of the Jesus Marıa.
Data from Rıo Yacones suggest that upliftof the Cordillera Oriental in the northern partof the Transition Zone (Viramonte et al., 1994;Kotila et al., 1996) was contemporaneous withuplift in the Sistema de Santa Barbara in theeast (Fig. 11E).
Drainage Pattern Development
Figure 11 depicts our model for the evolu-tion of the modern drainage system. We as-sume that, once the internally draining Punawas established as a positive topographic fea-ture ca. 15 Ma (Vandervoort et al., 1995), allrivers on the eastern flank of the plateauflowed eastward and then followed an axialdrainage in the Salta rift basin. Westward-flowing streams on the east side of the Saltarift basin (Fig. 11A) were sourced on thecraton.
By 13 Ma (Fig. 11B), uplift of the CumbresCalchaquıes diverted eastward-flowing streamsin the southwestern part of the map northwardto form the Rıo Santa Marıa. Further streamdiversion occurred when the Sierra de LeonMuerto rose to form the south-flowing Rıo Cal-chaquı. The Rıo de las Conchas formed at theconfluence of the Rıo Calchaquı and Rıo SantaMarıa and flowed northeastward, probablyalong the base of the Salta-Jujuy high (Fig.11C). We speculate that the Rıo de las Conchasjoined the Rıo Mojotoro between Salta and Ar-
Geological Society of America Bulletin, October 2000
MIDDLE MIOCENE TECTONIC DEVELOPMENT OF THE TRANSITION ZONE
Figure 11. Map sequence illustrating the tectonic development of the northern portion of the Transition Zone and its effect on regionaldrainage. Crustal shortening is not depicted in this presentation. Labels of static features are presented in A but omitted in the others.Mountain range and paleomagnetic section abbreviations are listed in Figure 3. River abbreviations: RSM—Rıo Santa Marıa, RC—RıoCalchaquı, RCo—Rıo de las Conchas, Rmo—Rıo Mojotoro, ARJ—ancestral Rıo Juramento, RP—Rıo Piedras, RM—Rıo Metan, RJ—Rıo Juramento, RSF—Rıo San Francisco, RG—Rıo Gonzalez.
royo Gonzalez (Fig. 11D) to form the ancestralRıo Juramento, which began to transport detri-tus from the west side of the Sierra del Crestonand Sierra de Metan (Fig. 9A) to the ArroyoGonzalez site. The Rıo Metan and Rıo Piedrasdrained the eastern flanks of these ranges.
During the past 9 m.y. uplift commenced inthe Sierra de Gallo, Sierra de Maız Gordo, andSierra Lumbrera along the course of the Rıode las Conchas, forcing the river to bendsouthward to form the modern Rıo Juramento(Fig. 11E). The Rıo Mojotoro was divertednorthward to form the Rıo San Francisco (Fig.11E). Erosion in the Arroyo Gonzalez regiontruncated the top of the Metan Subgroup be-fore deposition of the Guanaco Formation be-gan. The Arroyo Gonzalez formed as the RıoGonzalez eroded into the rising Sierra de Gon-zalez (Fig. 11F).
Implications for Petroleum Exploration
Diachroneity of uplift caused an eastwardprogression of burial of organic-rich horizonsin the Salta Group across the Neogene fore-land basin in the Transition Zone. An expected
result would be the eastward younging of hy-drocarbon maturation ages in the source rocksof the basin. Thrust-related structural traps de-veloped during the Neogene are also diach-ronous across the region. Limits to the agesof these structures, seen on seismic lines, canbe established where they crosscut the datedNeogene strata. Comparison of local matura-tion ages with the age of the structural trapsshould allow evaluation of target structureswith relatively tight temporal precision.
CONCLUSION
We present evidence suggesting that upliftof the Sierra de Santa Barbara, in the westernCordillera Oriental, began ca. 13 Ma. Eleva-tion of this range is apparently related to therise of the Cumbres Calchaquıes and the Si-erra de Quilmes, the northernmost ranges ofthe Sierras Pampeanas. The Sierra de Quilmesbegan to rise 13–12 Ma along the southwest-ern margin of the Salta rift basin. These arethe earliest ages reported for tectonic activityin the Cordillera Oriental of Argentina and theSierras Pampeanas. Malizia et al. (1995) re-
ported a ca. 12.7 Ma age for the initiation ofthe Sierra de Velasco uplift in the central Si-erras Pampeanas �300 km to the south-south-west in the flat subduction area. Regionaldrainage patterns prevented us from establish-ing uplift ages for the Sierra de Candelaria(Figs. 3B and 11 F), the easternmost Pampeanrange at these latitudes.
Uplift of the Transition Zone ranges appearsin our model to progress in a northeasterly di-rection (Fig. 11). It began in the west alongwestward-verging thrust faults. The faults arereactivated listric normal faults formed duringthe Cretaceous opening of the Salta rift (Grieret al., 1991). After mountain building com-menced along the western margin of the rift,it migrated eastward across the Salta basin,vergence direction being dependent upon theorientation of preexisting extensional struc-tures. By ca. 10 Ma, uplift was active acrossthe width of the Cordillera Oriental between25� and 26�S, but between 24� and 25�S east-ward migration lagged. Faulting is not evidentat Rıo Yacones until after ca. 6.4 Ma (Vira-monte et al., 1994).
The Sistema de Santa Barbara, in the Su-
Geological Society of America Bulletin, October 2000
REYNOLDS et al.
Figure 12. Proposed model for the timing and sequence of uplift along cross-section lineA–A� (Fig. 3B). Arrows indicate westward and eastward thrust vergence. Locations ofindividual ranges and elevations are based on modern topography. Crustal shorteningand continuing uplift are not depicted. The overlap zone results from location of the Sierrade Leon Muerto to the north of the Sierras Pampeanas termination latitude.
bandean zone of the foreland region, was notelevated until after 9 Ma. Uplift in the Suban-dean zone in the inclined subduction area tothe north was probably initiated 9–8 Ma(Reynolds et al., 1996; Hernandez et al., 1996,1999).
Oriented samples were collected from 77 stations,initially at �30 m stratigraphic intervals, in 1990.A minimum of three, fist-sized samples was col-lected at each station. An additional 21 stationswere collected in 1992 and 1995 to support single-site polarity zones and to clarify problem areas.Sandstones were also collected in 1995 for petro-graphic analysis. Measurement of the section witha Jacob’s Staff and Abney Level proceeded as the1990 samples were collected. Sites were locatedwith respect to an existing measured section pro-vided by Yacimientos Petrolıferos Fisicales (Fig. 5).
Samples were generally collected from reddishsiltstones or mudstones with the hope that the mag-
netic minerals would be sufficiently fine grained toretain a reliable magnetic signal. Some samples inthe Anta Formation were very fine grained sand-stones. All 1990 samples were milled into 2.5 cmcubes at Universidad Nacional de Salta. Samplescollected in 1992 and 1995 were taken with a Pom-eroy Drill using standard coring techniques.
The natural remanent magnetizations (NRM) ofthe 1990 samples were measured on the three-axisvertical ScT cryogenic magnetometer at the HawaiiInstitute of Geophysics. The 1992 and 1995 sampleswere measured with the three-component 2G Su-perconducting Rock Magnetometer (SRM) at theUniversity of Pittsburgh. NRM magnetic dipole mo-ment per unit volume (M, amperes per meter) val-ues varied between 9.1 � 103A/m and 1.3 �101A/m. M values approximate an even distribu-tion between the two extremes.
We subjected 12 samples to stepwise alternatingfield demagnetization experiments to determine themagnetic properties of the strata. This treatment wassuccessful with some samples but with others failedto separate the components of the NRM. All othersamples were subjected to stepwise thermal demag-netization (Fig. A1). Samples collected in 1990were treated less rigorously that the 1992 and 1995
samples. They were demagnetized until they pro-duced a consistent orientation, but were not com-pletely demagnetized. The 1992 and 1995 sampleswere treated to total demagnetization. Results fromthe demagnetization experiments suggest that theprincipal carrier of remanent magnetization is he-matite in the Rıo Seco and Anta Formations andboth magnetite and hematite in the Jesus MarıaFormation.
A statistical mean direction of the paleomagneticvector was determined for each site using the meth-od described by Fisher (1953). Statistically signifi-cant results, using the R statistic (Watson, 1956),suggested that the stable component of magnetiza-tion had been isolated. As used here, class I sitesare those whose mean direction satisfies Watson’scriteria. When the number, N, of samples � 3, anR � 2.62 is considered to be statistically significant(Watson, 1956). Class II sites designate stratigraphiclevels for which only two samples from the site sur-vived to be analyzed.
Of the 98 paleomagnetic sites, 8 were collectedin the Lumbrera Formation and are not included inour data set. Of the Neogene sites, 79 are shown inthe magnetic polarity column (Fig. 8). Of the sites,67 provided class I data and 12 are class II. Sixsites failed to fit into a class I or II category. Sam-ples from five very friable horizons were destroyedduring transport to the lab or during analysis. All ofthe sites that were destroyed and all of the indeter-minate sites were collected in 1990 and were resam-pled during subsequent visits.
Figure A1 illustrates the thermal demagnetizationbehavior of one sample from the Rıo Seco Forma-tion, two from the Anta Formation, and one fromthe Jesus Marıa Formation. All exhibit a present-day viscous component that was removed by thefirst several thermal treatments, after which rela-tively stable readings were acquired and continuedthrough high temperatures (680 �C) and field inten-sities (60 mT). Site GZ-5 (Fig. A1a) was collectedfrom a red siltstone in the middle of the Rıo SecoFormation. After the initial alternating field treat-ment, it exhibited relatively stable behavior. SiteGZ-37 (Fig. A1b) came from one of the green zonesof the Anta Formation, just above the dated tuff.Site GZ-92 (Fig. A1c) is typical of the Anta red-beds. After removal of the normal viscous overprint,intensities remained relatively stable for both Antasamples, suggesting that hematite is the primarycarrier of remanent magnetization. Site GZ-50 (Fig.A1d) is a typical Jesus Marıa red siltstone from themiddle part of the formation. Both magnetite andhematite appear to be carriers of remanentmagnetization.
Accuracy of the paleomagnetic results was ex-amined with a reversal test for the site means of allNeogene class I data (Fig. A2). Mean normal andreverse directions are within 13.5� (�c) of antipodal,providing a positive reversal test (class C; Mc-Fadden and McElhinney, 1990). These results sug-gest that the magnetic component isolated by thedemagnetization treatments represents the detritalremanent magnetization and not a thermal or chem-ical postdepositional overprint. Mean inclinationsare considerably shallower than the projected �44�inclinations for this latitude. We attribute this dis-crepancy and the high �c to incomplete demagne-tization of the 1990 sample set.
APPENDIX 2. ANALYTICALPROCEDURES—40Ar/39Ar DATING
Hornblende was separated from tuff RPT-1 bystandard heavy liquid and magnetic techniques. Ad-
Geological Society of America Bulletin, October 2000
MIDDLE MIOCENE TECTONIC DEVELOPMENT OF THE TRANSITION ZONE
Figure A1. Vector end-point diagrams (Zijderveld, 1967) showing the thermal demagne-tization of representative samples from the Arroyo Gonzalez section. (A) GZ-5A—a redsiltstone from near the top of the Rıo Seco Formation. (B) GZ-37C—a green siltstone fromabove the dated tuff in the Anta Formation. (C) GZ-92—a red siltstone from a possiblenew reversed zone between 14.2 and 14.6 Ma in the Anta Formation. (D) GZ-50A—a redsiltstone from the middle of the Jesus Marıa Formation. A normal overprint was removedfrom the sample by the first several treatments.
Figure A2. Reversal test for class I data inthe Arroyo Gonzalez section. Class I, site-mean orientation data cluster in two antip-odal groups and pass the reversal test (pro-jection of the southern circle of confidenceshown with the dashed gray circle). Themean declination for the normal sample is354� with a mean inclination of –22.5� and�95 � 9.5�. For the reversed sample, themean declination is 186� with a mean incli-nation of �29.5� and �95 � 11.8�. The meannormal and reverse directions are within �c
� 13.5� of antipodal, providing a positivereversal test (class C; McFadden andMcElhinney, 1990). The projected inclina-tions should be ��44� for a site at this lat-itude. Low mean inclinations and the high�c are attributed to incomplete demagneti-zation of the 1990 sample set.
ditional cleanup was accomplished by hand-pickingunder a binocular microscope to achieve a final pu-rity of �99%. The separate was packaged in Sn foiland sealed, together with other unknowns, in anevacuated quartz vial. Five packets containing ANUmonitor mineral GA-1550 biotite (97.9 Ma; Mc-Dougall and Roksandic, 1974) were evenly spacedthroughout the tube to monitor the vertical variationin neutron flux within the irradiation container. CaF2
and K2SO4 were also included in the irradiationpackage to monitor neutron-induced interferencesdue to Ca and K, respectively. The samples wereirradiated for 40 h in position L67 at the Ford Re-actor at the University of Michigan.
Argon extraction was performed by fusing thesample in a double-vacuum tantalum resistance fur-nace and the evolved gas was purified on SAESgetters and a cold finger cooled to liquid-nitrogentemperature. The argon isotopes were measured ina substantially modified, computer-controlled MS-10 mass spectrometer operated on-line to the ex-traction system. Blank contribution from the extrac-tion line was �1 � 10–14 mol 40Ar at the extractiontemperature of 1350 �C. The measured isotopic ra-tios were corrected for line blank, mass discrimi-nation (0.33%/amu), radioactive decay of 37Ar and39Ar, neutron-induced interferences on K and Ca,and atmospheric contamination. The uncertainty inthe age reported for RPT-1 in Table 2 incorporatesboth the precision of the analytical measurementsand a 0.5% uncertainty in the J value.
ACKNOWLEDGMENTS
We thank the many people and institutions that as-sisted us during this project. Funding was provided
by American Chemical Society––Petroleum ResearchFund awards PRF#24348-B2 and PRF#28363-B8 toReynolds. Yacimientos Petrolıferos Fisicales (YPF)and BHP World Exploration provided personnel andlogistical support in the field. Additional logisticalsupport was provided by Jose Viramonte at the Univ-ersidad Nacional de Salta (UNSa). YPF geologistsAlfredo Disalvo, Luis Constantini, Alberto Schultz,and Bernardo Pozo helped with the sample collectionand shared their immense knowledge of the local andregional geology. David Gonzalez (YPF and XR Ex-ploracionistas Regionales, s.r.l.) was a superb fieldguide. Emilio Herrero-Bervera, at the Hawaii Insti-tute of Geophysics (HIG), and William Harbert, atthe University of Pittsburgh, contributed their insightto the paleomagnetic analysis. Alexandra Cheng andKenneth Helsley ran most of the analyses at the HIG.The FORTRAN program Stereonet by Richard All-mendinger was used to plot Figure A2.
REFERENCES CITED
Allmendinger, R.W., Ramos, V.A., Jordan, T.E., Palma,R.M., and Isacks, B.L., 1983, Paleogeography andAndean structural geometry, northwest Argentina:Tectonics, v. 2, p. 1–16.
Barazangi, M., and Isacks, B.L., 1976, Spatial distributionof earthquakes and subduction of the Nazca plate be-neath South America: Geology, v. 4, p. 686–692.
Belotti, H.J., Saccavino, L.L., and Schachner, G.A., 1995,Structural styles and petroleum occurrence in the Sub-Andean fold and thrust belt of northern Argentina, inTankard, A.J., et al., eds., Petroleum basins of SouthAmerica: American Association of Petroleum Geolo-gists Memoir 62, p. 545–555.
Bevis, M., and Isacks, B.L., 1984, Hypocentral trend sur-
face analysis: Probing the geometry of Benioff zones:Journal Geophysical Research, v. 89, p. 6153–6170.
Butz, D.J., Foldesi, C.P., and Reynolds, J.H., 1995, Prove-nance of the Payogastilla Group: A preliminary uplifthistory of the Central Andes, Salta Province, NW Ar-gentina: Geological Society of America Abstracts withPrograms, v. 27, no., 2, p. 39.
Cande, S.C., and Kent, D.V., 1995, Revised calibration ofthe geomagnetic polarity timescale for the Late Cre-taceous and Cenozoic: Journal of Geophysical Re-search, v. 100, p. 6093–6095.
Carozzi, A.V., 1993, Sedimentary petrography: EnglewoodCliffs, New Jersey, Prentice Hall, 263 p.
Cladouhos, T.T., Allmendinger, R.W., Coira, B., and Farrar,E., 1994, Late Cenozoic deformation in the CentralAndes: Fault kinematics from the northern Puna,northwestern Argentina and southwestern Bolivia:Journal of South American Earth Sciences, v. 7, p.209–228.
Comınguez, A.H., and Ramos, V.A., 1995, Geometry andseismic expression of the Cretaceous Salt Rift System,northwestern Argentina, in Tankard, A.J., et al., Petro-leum basins of South America: American Associationof Petroleum Geologists Memoir 62, p. 325–340.
Coughlin, T.J., O’Sullivan, P.B., Kohn, B.P., and Holcombe,R.J., 1998, Apatite fission-track thermochronology ofthe Sierras Pampeanas, central western Argentina: Im-plications for the mechanism of plateau uplift in theAndes: Geology, v. 26, p. 999–1002.
Davis, D., Suppe, J., and Dahlen, F.A., 1983, Mechanics of
Geological Society of America Bulletin, October 2000
REYNOLDS et al.
fold-and-thrust belts and accretionary wedges: Journalof Geophysical Research, v. 88, p. 1153–1172.
Fisher, R., 1953, Dispersion on a sphere: Royal Society ofLondon Proceedings, ser. A, v. 217, p. 295–305.
Galli, C.I., 1995, Estratigrafıa y sedimentologıa del Su-bgrupo Metan (Grupo Oran-Terciario), provincia deSalta. Argentina [Ph.D thesis]: Salta, Argentina, Univ-ersidad Nacional de Salta, 109 p.
Galli, C.I., Hernandez, R.M., and Reynolds, J.H., 1996, An-alisis paleoambiental y ubicacion geocronologica delSubgrupo Metan (Grupo Oran, Neogeno) en el rıo Pie-dras, departamento Metan: Salta, Argentina, Boletinde Informaciones Petroleras, Tercera Epoca, v. 12, no.46, p. 99–107.
Galvan, A.F., 1981, Descripcion geologica de la hoja 10e,Cafayate, provincias de Tucuman, Salta, y Catamarca:Servicio Geologico Nacional, Boletın 177, 41 p.
Gebhard, J.A., Guidice, A.R., and Gascon, J.O., 1974, Geo-logıa de la comarca entre el Rıo Juramento y Arroyolas Tortugas, provincias de Salta y Jujuy: Revista dela Asociacion Geologica Argentina, v. 29, p. 359–375.
Giraudo, R., Limachi, R., Requena, E., and Guerra, H.,1999, Geologıa estructural de la faja fallada y plegadadel Subandio Sur, Bolivia: Boletın de InformacionesPetroleras, v. 59, p. 54–70.
Grier, M.E., and Dallmeyer, R.D., 1990, Age of the Payo-gastilla Group: Implications for foreland basin devel-opment, NW Argentina: Journal of South AmericanEarth Sciences, v. 3, p. 269–278.
Grier, M.E., Salfity, J.A., and Allmendinger, R.W., 1991,Andean reactivation of the Cretaceous Salta Rift: Jour-nal of South American Earth Sciences, v. 4, p. 351–372.
Hernandez, R.M., Reynolds, J.H., and Disalvo, A, 1996,Analisis tectosedimentario y ubicacion geocronologicadel Grupo Oran en el Rıo Iruya: Departamento deOran, Provencia de Salta, Boletın de la Industria Pe-trolera, Buenos Aires, v. 12–45, p. 80–93.
Hernandez, R.M., Galli, C.I., and Reynolds, J.H., 1999, Es-tratigrafıa del terciario en el noroeste argentino: Re-latorio, XIV Congreso Geologico Argentino, Tomo I,p. 316–328.
Hilliard, R., Kotila, J.M., and Reynolds, J.H., 1996, Sand-stone provenance from Arroyo Gonzalez, Salta Prov-ince, NW Argentina: A preliminary uplift history forthe Santa Barbara System: Geological Society ofAmerica Abstracts with Programs, v. 28, no. 7, p. A-442.
Horton, B.K., 1998, Sediment accumulation on top of theAndean orogenic wedge: Oligocene to late Miocenebasins of the Eastern Cordillera, southern Bolivia:Geological Society of America Bulletin, v. 110, p.1174–1192.
Houghton, H.F., 1980, Refined techniques for staining pla-gioclase and alkali feldspars in thin sections. Journalof Sedimentary Petrology, v. 50, p. 629–631.
Ingersoll, R.V., Bullard, T.F., Ford, R.L., Grimm, J.P., Pick-le, J.D., and Sares, S.W., 1984, The effect of grainsize on detrital modes: A test of the Gazzi-Dickinsonpoint counting methods. Journal of Sedimentary Pe-trology, v. 54, p. 103–116.
Jordan, T.E., and Allmendinger, R.W., 1986, The SierrasPampeanas of Argentina: A modern analogue of
Rocky Mountain foreland deformation: AmericanJournal of Science, v. 286, p. 737–764.
Jordan, T.E., and Alonso, R.N., 1987, Cenozoic stratigraphyand basin tectonics of the Andes Mountains, 20�–28�South latitude: American Association of PetroleumGeologists Bulletin, v. 71, p. 49–64.
Jordan, T.E., Isacks, B.L., Allmendinger, R.W., Brewer,J.A., Ramos, V.A., and Ando, C.J., 1983, Andean tec-tonics related to geometry of subducted Nazca plate:Geological Society of America Bulletin, v. 94, p. 341–361.
Kotila, J.M., Hilliard, R., Foldesi, C.P., Butz, D.J., andReynolds, J.H., 1996, Neogene tectonic history of theTransition Zone, central Andes, NW Argentina: Geo-logical Society of America Abstracts with Programs,v. 28, no. 7, p. A-442.
Malamud, B.D., Jordan, T.E., Alonso, R.N., Gallardo, R.E.,Gonzales, R.E., and Kelley, S.A., 1996, PleistoceneLake Lerma, Salta Province, NW Argentina: Proceed-ings of XIII Congreso Geologico Argentino and IIICongreso de Exploracion de Hidrocarburos, BuenosAires, v. 4, p. 103–114.
Malizia, D.C., Reynolds, J.H., and Tabbutt, K.D., 1995,Chronology of Neogene sedimentation, stratigraphy,and tectonism in the Campo de Talampaya region, LaRioja Province, Argentina: Sedimentary Geology, v.96, p. 231–255.
Marquillas, R., and Salfity, J.A., 1988, Tectonic frameworkand correlations of the Cretaceous-Eocene SaltaGroup, Argentina, in Bahlburg, H., et al., eds., TheSouthern Central Andes: Lecture Notes in Earth Sci-ences, v. 17, p. 119–136.
McDougall, I., and Roksandic, Z., 1974, Total fusion 40Ar/39Ar ages using HIFAR reactor: Geological Society ofAustralia Journal, v. 21, p. 81–89.
McDougall, I., Kristjansson, L., and Sæmundsson, K.,1984, Magnetostratigraphy and geochronology ofnorthwest Iceland: Journal of Geophysical Research,v. 89, p. 7029–7060.
McFadden, P.L., and McElhinny, M.W., 1990, Classifica-tion of the reversal test in palaeomagnetism: Geo-physical Journal International, v. 103, p. 725–729.
Mingramm, A., and Russo, A., 1972, Sierras Subandinas yChaco Salteno, in Leanza, A.F., ed., Geologıa Region-al Argentina: Cordoba, Academia Nacional de Cien-cias de Cordoba, p. 185–212.
Mon, R., and Salfity, J.A., 1995, Tectonic evolution of theAndes in northern Argentina, in Tankard, A.J., et al.,eds., Petroleum basins of South America: AmericanAssociation of Petroleum Geologists Memoir 62, p.269–283.
Moores, E.M., and Twiss, R.J., 1995, Tectonics: New York,W.H. Freeman and Company, 415 p.
Moretti, I., Baby, P., Mendez, E., and Zubieta, D., 1996,Hydrocarbon generation related to thrusting in the SubAndean Zone from 18 to 22� S, Bolivia: PetroleumGeoscience, v. 2, p. 17–28.
Reynolds, J.H., Jordan, T.E., Johnson, N.M., and Tabbutt,K.D., 1990, Neogene deformation of the flat-subduc-tion segment of the Argentine-Chilean Andes: Mag-netostratigraphic constraints from Las Juntas, La Rio-ja, Argentina: Geological Society of America Bulletin,v. 102, p. 1607–1622.
Reynolds, J.H., Naeser, C.W., and Hernandez, R., 1993,
Chronostratigraphic calibration of Neogene sedimen-tation in the Argentine Subandes, Salta Province,northern Argentina: Geological Society of AmericaAbstracts with Programs, v. 25, no. 7, p. A-473.
Reynolds, J.H., Idleman, B.D., Hernandez, R.M., and Nae-ser, C.W., 1994, Preliminary chronostratigraphic con-straints on Neogene tectonic activity in the EasternCordillera and Santa Barbara System, Salta Province,NW Argentina: Geological Society of America Ab-stracts with Programs, v. 26, no. 7, p. A-503.
Reynolds, J.H., Hernandez, R.M., Idleman, B.D., Naeser,C.W., and Guerstein, P.G., 1996, Rıo Iruya revisited:The Neogene tectonic development of the western Si-erras Subandinas, Salta Province, NW Argentina:Geological Society of America Abstracts with Pro-grams, v. 28, no. 7, p. A-59.
Russo, A., and Serraiotto, A., 1978, Contribucion al con-ocimiento de la estratigrafıa terciaria en el noroesteargentino: VII Congreso Geologico Argentino, Neu-quen, Actas I, p. 715–730.
Sempere, T., Butler, R.F., Richards, D.R., Marshall, L.G.,Sharp, W., and Swisher, C.C., III, 1997, Stratigraphyand chronology of Upper Cretaceouslower Paleo-gene strata in Bolivia and northwest Argentina: Geo-logical Society of America Bulletin, v. 109, p. 709–727.
Steiger, R.H., and Jager, E., 1977, Subcommission on geo-chronology: Convention on the use of decay constantsin geo- and cosmochronology: Earth and PlanetaryScience Letters, v. 36, p. 359–362.
Strecker, M.R., Cerveny, P., Bloom, A.L., and Malizia, D.,1989, Late Cenozoic tectonism and landscape devel-opment in the foreland of the Andes: Northern SierrasPampeanas (26�–28�S), Argentina: Tectonics, v. 8, p.517–534.
van der Pluijm, B.A., and Marshak, S., 1997, Earth struc-ture: WCB/McGraw-Hill, 495 p.
Vandervoort, D.S., Jordan, T.E., Zeitler, P.K., and Alonso,R.N., 1995, Chronology of internal drainage devel-opment and uplift, southern Puna plateau, Argentinecentral Andes: Geology, v. 23, p. 145–148.
Vilela, C.R., and Garcıa, J., 1978, Descripcion Geologicade la Hoja 9e, Amblayo, Provincia de Salta: BuenosAires, Servicio Geologico Nacional, 65 p.
Viramonte, J.G., Reynolds, J.H., Del Papa, C., and Disalvo,A., 1994, The Corte Blanco garnetiferous tuff: A dis-tinctive late Miocene marker bed in northwestern Ar-gentina applied to magnetic polarity stratigraphy in theRıo Yacones, Salta Province: Earth and Planetary Sci-ence Letters, v. 121, p. 519–531.
Watson, G.S., 1956, A test for randomness of directions:Royal Astronomical Society Monthly Notes, Geo-physical Supplement, v. 7, p. 160–161.
Watts, A.B., Lamb, S.H., Fairhead, J.D., and Dewey, J.F.,1995, Lithospheric flexure and bending of the CentralAndes: Earth and Planetary Science Letters, v. 134, p.9–21.
Zijderveld, J.D.A., 1967, A.C. demagnetization of rocks:Analysis of results, in Collinson, D.W., et al., eds.,Methods in palaeomagnetism: New York, Elsevier, p.254–286.
MANUSCRIPT RECEIVED BY THE SOCIETY APRIL 10, 1999REVISED MANUSCRIPT RECEIVED DECEMBER 28 (??)MANUSCRIPT ACCEPTED JANUARY 4, 2000