IZA DP No. 1279 Migration and Diversity: Human versus Social Capital Vlad Manole Maurice Schiff DISCUSSION PAPER SERIES Forschungsinstitut zur Zukunft der Arbeit Institute for the Study of Labor August 2004
Transcript
IZA DP No. 1279
Migration and Diversity:Human versus Social Capital
Vlad ManoleMaurice Schiff
DI
SC
US
SI
ON
PA
PE
R S
ER
IE
S
Forschungsinstitutzur Zukunft der ArbeitInstitute for the Studyof Labor
Any opinions expressed here are those of the author(s) and not those of the institute. Research disseminated by IZA may include views on policy, but the institute itself takes no institutional policy positions. The Institute for the Study of Labor (IZA) in Bonn is a local and virtual international research center and a place of communication between science, politics and business. IZA is an independent nonprofit company supported by Deutsche Post World Net. The center is associated with the University of Bonn and offers a stimulating research environment through its research networks, research support, and visitors and doctoral programs. IZA engages in (i) original and internationally competitive research in all fields of labor economics, (ii) development of policy concepts, and (iii) dissemination of research results and concepts to the interested public. IZA Discussion Papers often represent preliminary work and are circulated to encourage discussion. Citation of such a paper should account for its provisional character. A revised version may be available directly from the author.
Migration and Diversity: Human versus Social Capital∗
This paper examines the welfare implications associated with different degrees of diversity or similarity between migrants and natives under both migration and trade. We use a general equilibrium model of migration, human capital and social capital and find that there are three equilibrium solutions: an internal one with half the population of each country migrating to the other country, and two corner solutions where everyone ends up in one of the two countries. The internal solution is unstable and is unlikely to be reached under different levels of human capital across the two countries. The corner solutions are stable and will be reached under most circumstances. If there are human capital differences across the two populations, everyone ends up in the country with the highest initial level of human capital. Welfare under any of the equilibrium solutions rises with the diversity in human capital and decreases with the diversity in social capital between migrants and natives. Trade and both migration solutions reduce inequality between the populations of the two countries by the same amount. In addition, trade and migration are not equivalent if social capital is present: the highest welfare is obtained with migration under the corner solution, the second highest welfare is obtained with trade, and the lowest welfare is obtained with migration under the internal solution. The first two solutions (third solution) raise (may raise or reduce) welfare relative to the no-migration case. JEL Classification: F11, F16, F22, J61 Keywords: migration, trade, social capital, human capital, welfare Corresponding author: Maurice Schiff Development Research Group The World Bank Mailstop No. MC3-303 1818 H. St. NW Washington DC 20433 USA Email: [email protected]
∗ The opinions expressed in this paper are entirely those of the authors. They do not necessarily represent the view of the World Bank, its Executive Directors, or the countries they represent.
1. Introduction
Employers in industrial countries tend to prefer immigrants with different skills
from those of natives. Policy makers often go along, first, because of employer pressure,
and second, because a greater diversity of skills enables increased gains from
specialization and exchange. In other words, there is a preference for importing those
skills that are in relatively short supply and are different from those with which natives
are abundantly endowed.
The preference for immigrants with a different skill composition than that of
natives applies to those with high skill levels, such as Indian software engineers in the US
and Germany1, and to those with intermediate skill levels, such as Southern and Eastern
African nurses in the UK. Another aspect of the preference for immigrants who differ
from natives is the demand for unskilled workers to carry out low-end jobs that natives
are unwilling to do (e.g., in the hotel and restaurant industries, agriculture, house cleaning
and more).
On the other hand, policy makers have often implemented migration policies that
discriminate in favor of people with an ethnic, cultural, religious or language background
that is similar to that of natives. This includes Australia, which long favored immigration
from the UK and where New Zealanders can still immigrate freely (Corden 2003), and
the US where early immigration policies favored those with European background and
discriminated against others, as documented by Jacobson (1998). 1 Bauer and Kunze, 2004, present several initiatives to attract high skilled workers in OECD countries. Some countries, like Canada and Australia, increased the number of immigration quotas. Similarly, the U.S significantly increased the number of H1B-visas (temporary visas that are used by high skilled workers). In August 2001, Germany introduced the Green Card program, facilitating temporary visas for IT specialists (a quota of 20 000 visas for a maximum of five years). Other countries reduced the transaction costs associated with the visa process. The U.K. reduced the requirements for high skilled visa. Starting in January 2002, France streamlined the process of obtaining visas for high skilled workers.
1
Thus, on the one hand, migration policy seems to favor diversity between
immigrants and natives, while on the other, it tends to favor similarity. The desire for
similarity tends to be associated with social capital characteristics of migrants and
natives, while the desire for diversity tends to be associated with their human capital
characteristics.2 The model presented in this paper incorporates characteristics of both
social and human capital in the production function in a two-country general equilibrium
framework. It assumes that social capital raises productivity and falls with labor mobility
and migration. Evidence on these relationships is provided in Schiff (2004). The above
implies that migration generates externalities associated with social capital. The paper
examines the welfare implications of different degrees of diversity or similarity between
migrants and natives under both migration and trade.
The main findings are:
1. There are three equilibrium solutions: an internal one with half the
population of each country migrating to the other country, and two
corner solutions where everyone ends up in one of the two countries.
2. Welfare under any of the equilibrium solutions goes up as the diversity
in social capital between migrants and natives decreases and that in
human capital increases.
2 Social capital has been defined as “the ability of people to work together for common purposes in groups or organizations” (Coleman, 1988) or as "... the set of elements of the social structure that affects relations among people and are inputs or arguments of the utility and/or production function" (Schiff, 1992). These elements include social norms, attitudes, values, language and culture. Social capital in the form of close ties to the community may generate benefits by raising utility directly, and/or by raising output through a reduction in the cost of transacting business due to higher trust and enforceability of sanctions. This paper focuses on the latter. For migration models focusing on the impact of social capital on utility, see Schiff (2002).
2
3. Either of the two corner solutions maximizes world welfare. These
solutions are obtained if immigration is unrestricted and there are high
human capital differences between the two countries, or in the presence
of social capital, if migration is fully restricted by one of the two
countries.
4. The welfare impact of migration under the internal equilibrium solution
is ambiguous.
5. Welfare increases with free trade and is higher than under the internal
migration solution and lower than under the corner solutions.
Consequently, trade and migration are not equivalent in the presence of
social capital.
6. Both trade and migration reduce inequality between the populations of
the two countries.
The remainder of the paper is organized as follows. Section 2 presents the model.
Section 3 solves the model in the absence of migration and Section 4 does the same under
migration. Section 5 presents the free trade solution and Section 6 compares the
migration and free trade solutions. Section 7 examines migration dynamics and Section 8
concludes.
3
2.The Model
The model draws in part on Schiff (2004) but differs by providing a more rigorous
modeling of the social capital. This leads to solutions and implications that differ entirely
from Schiff (2004).
Assume two “islands” i = 1, 2. Two-way migration can be obtained by assuming
different endowments of industry-specific skills in each island, zero cross-island moving
costs for labor and prohibitive moving costs for goods. Assume that the initial population
on each island is n = 1. Denote by nij the proportion of natives of Island i living on Island
j (i, j = 1, 2). Before migration takes place, n11 = n22 = 1, and the proportion that migrates
n12 = n21 = 0.
Each native of Island i living on Island j consumes Xij and Yij units of goods X and
Y, with utility given by
(1) ββijijij YXU += , β < 1
Note that a decrease in β increases the gains from diversification of consumption.
Output of X and Y depends on human capital and on local public goods and services
whose provision is positively related to the level of social capital. Alternatively, assume
that output depends on human capital and on aspects of social capital such as the extent
of trust and cooperation among individuals. Thus, X (Y) is produced with human capital
or skill x (y) and social capital S. Natives of Island 1 (2) are endowed with skill x (y) and
produce X (Y).3 Given that the population of each island only has one skill and produces
only one good, β is also inversely related to the diversity in endowments of skills or
3 For simplicity, the paper assumes one skill per island. The qualitative results hold if each island is
endowed with both skills, as long as the skills ratios differ across the islands.
4
human capital.4 Thus the gains from consumption diversification increase with the
diversity in endowments. The production functions for X and Y are ),( 11 jj SxFX = and
),( 22 jj SyFY = , where Sij is the social capital available to individual Iij. Specifically,
(2) .2,1;, 2211 === jySYxSX jjjj5
Following Lazear (2000), assume that the social capital is characterized by
‘network’ externalities (as with language), i.e., it increases with the number of people
who share it . An individual Iij moving from Island i to Island j does not benefit from
interaction with natives of Island j to the extent that the natives of Island j benefit because
creating a network of social relations and building trust takes time, and some relations
and experiences (e.g., those with family and childhood friends) cannot be recreated.
Another reason might be that natives of Island i may speak a different language than
those in Island j. The islands may also differ in other aspects, including ethnicity and
race. Glaeser et al. (2000) examined determinants of trust and trustworthiness in an
experiment with 258 Harvard undergraduates and found that differences in nationality
and race reduce the level of trustworthiness. Hence, migrants are assumed to gain partial
access to the social capital of natives in their island of destination. Symmetrically, natives
are assumed to gain partial access to the social capital of migrants to their own island.
Specifically, the social capital available to a native Iii (who does not migrate) is
Sii=nii+αnij, (i ≠ j) and for a migrant from Island i to Island j (i ≠ j) is Sij = nij+αnjj, α ≤ 1.
4 Note that implicitly human capital has two dimensions. The first is the level of x and y (highly skilled or not), and the second is the diversity between x and y as represented by β (no diversity if both x and y are, say, farmers (β close to 1) , and greater diversity if x is farmer and y is engineer (β close to zero)). 5 We have assumed here that social capital enters the production function and not the utility function.
Assuming the latter—as in Schiff (1998; 2002) and Schiff and Winters (1998)—does not change the main findings.
5
Given these assumptions and equation (2), individual output is:
In the absence of migration, i = j and n11 = n22 = 1. Assuming prohibitive
transport costs for goods, X and Y are not traded (this assumption is relaxed in Section 5).
Thus, quantities consumed ( )ijij YX , equal quantities produced ( )ijij YX , . From the
relations (3), these are yYYxXX ==== 22221111 ; and 012122121 ==== YYYY . From
equation (1), utility is βxU =11 and βyU =22 .
4. Migration
The natives of Island 1 (2) consume no Y (X) and the relative price of Y(X) in
units of X(Y) on Island 1 (2) is infinite (see equation (18) in Section 5). Thus there is an
incentive to migrate in both directions. Assume now that the two islands sign a treaty
integrating their labor markets by allowing free movement of people between them.
People from Island 1 (2) take their skills x (y) to Island 2 (1) in order to produce X (Y)
there and exchange part of it for Y (X). Because people migrate in both directions, goods
X and Y are now available on both islands.
Migration has three effects on welfare. First, since both X and Y are now produced
and consumed on both islands, everyone benefits from diversification of consumption.
6
On the other hand, migration leads to a private loss of productive skills, because
migration leads to a decrease in one’s own population and thus in social capital in the
island of origin. At the same time migration raises one’s own population in the island of
destination and raises social capital there.
Assume good Y is the numeraire. Natives and migrants maximize their utility, i.e.
individuals from Island 1(2) maximize U1j (U2j), j=1,2.
Consider Island 1. The first order condition for natives and migrants are:
1.a 11
111
11 PYX ⋅= −− ββ
1.b 11
211
21 PYX ⋅= −− ββ ,
where Pj is the relative price of X (in terms of Y) on Island j.
Budget constraints for natives and migrants are:
1.c )( 2111111111 nnxPYXP ⋅+=+ α
1.d )( 112121211 nnyYXP ⋅+=+ α
Market clearing conditions for goods X and Y are6:
1.e )( 21111121211111 nnxnXnXn α+=+
1.f )( 21212121211111 nnynYnYn α+=+
The same conditions hold for Island 2, namely:
2.a 21
221
22 PYX ⋅= −− ββ
2.b 21
121
12 PYX ⋅= −− ββ
2.c )( 2212212122 nnxPYXP ⋅+=+ α
6 Equation (1.f) is not independent of equations (1.c), (1.d) and (1.e) (Walras Law).
7
2.d )( 122222222 nnyYXP ⋅+=+ α
2.e )( 22121222221212 nnxnXnXn ⋅+=+ α
2.f )( 12222222221212 nnynYnYn ⋅+=+ α Population identity: 3.a 11211 =+ nn 3.b 12221 =+ nn Internal migration equilibrium is obtained when the migrants and natives from the same
population have the same level of utility (U11=U12, U21=U22) for 0<n12, n21<1 or:
4.a ββββ12121111 YXYX +=+
4.b ββββ22222121 YXYX +=+
Taking into account the Walras Law , we have 14 equations (1.a – 1.e, 2.a – 2.e, 3.a,
P2). This system can be reduced to a two equations system with two unknowns (for proof
see the appendix):
(4) 0
1))1)((1(
))1((
1))1((
)1)(1(
)1(1
1
221111
112222
221111
112222
2211
2211 =
+
⋅+−−
−⋅+
+
−⋅+
⋅+−−
−
−⋅+⋅+−
−β
β
β
β
αα
αα
αα
nnnnnn
xy
nnnnnn
xy
nnnn
(5) 0))1())(1(())1)(()1(()1)(1(
22111122
11222211
1
2211
1122 =−⋅+−⋅+⋅+−⋅+−
−
−−−
nnnnnnnn
nnnn
ααααβ
β
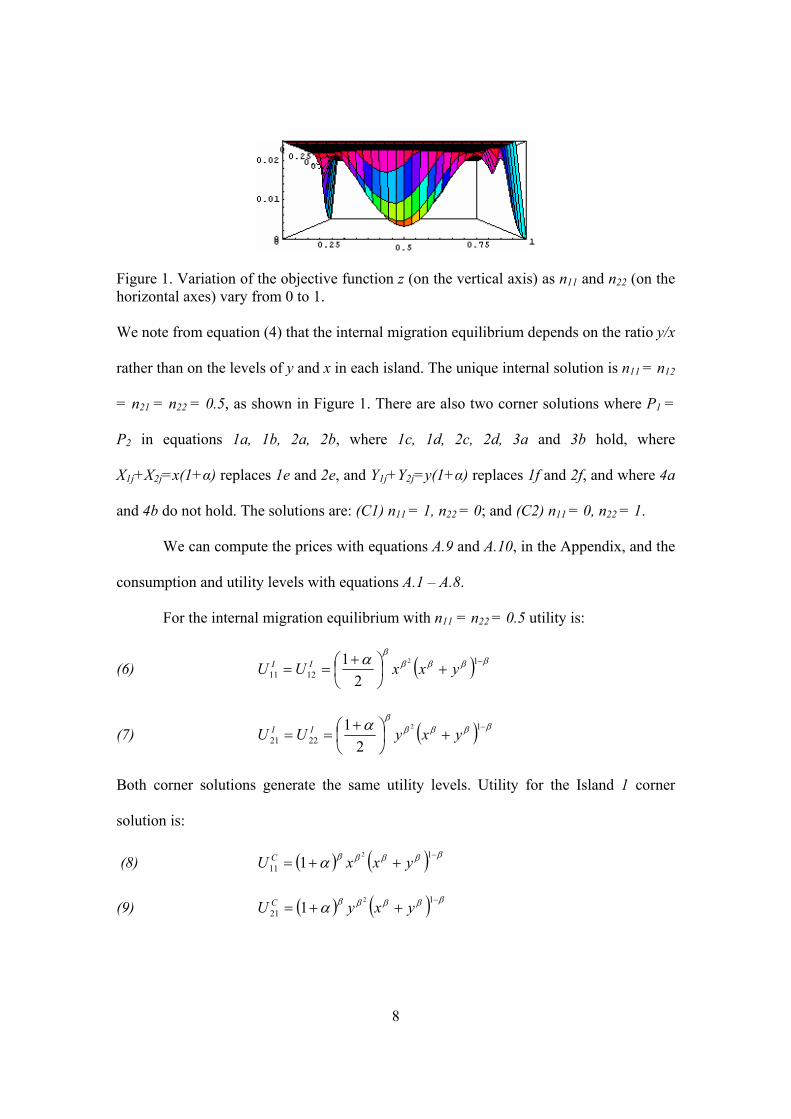
In order to solve for n11 and n22 we minimize the sum of the square of the left-
hand sides of equation (4) and (5) (denoted by z) with respect to n11 and n22. Figure 1
shows the variation of z.
8
Figure 1. Variation of the objective function z (on the vertical axis) as n11 and n22 (on the horizontal axes) vary from 0 to 1. We note from equation (4) that the internal migration equilibrium depends on the ratio y/x
rather than on the levels of y and x in each island. The unique internal solution is n11 = n12
= n21 = n22 = 0.5, as shown in Figure 1. There are also two corner solutions where P1 =
P2 in equations 1a, 1b, 2a, 2b, where 1c, 1d, 2c, 2d, 3a and 3b hold, where
X1j+X2j=x(1+α) replaces 1e and 2e, and Y1j+Y2j=y(1+α) replaces 1f and 2f, and where 4a
and 4b do not hold. The solutions are: (C1) n11 = 1, n22 = 0; and (C2) n11 = 0, n22 = 1.
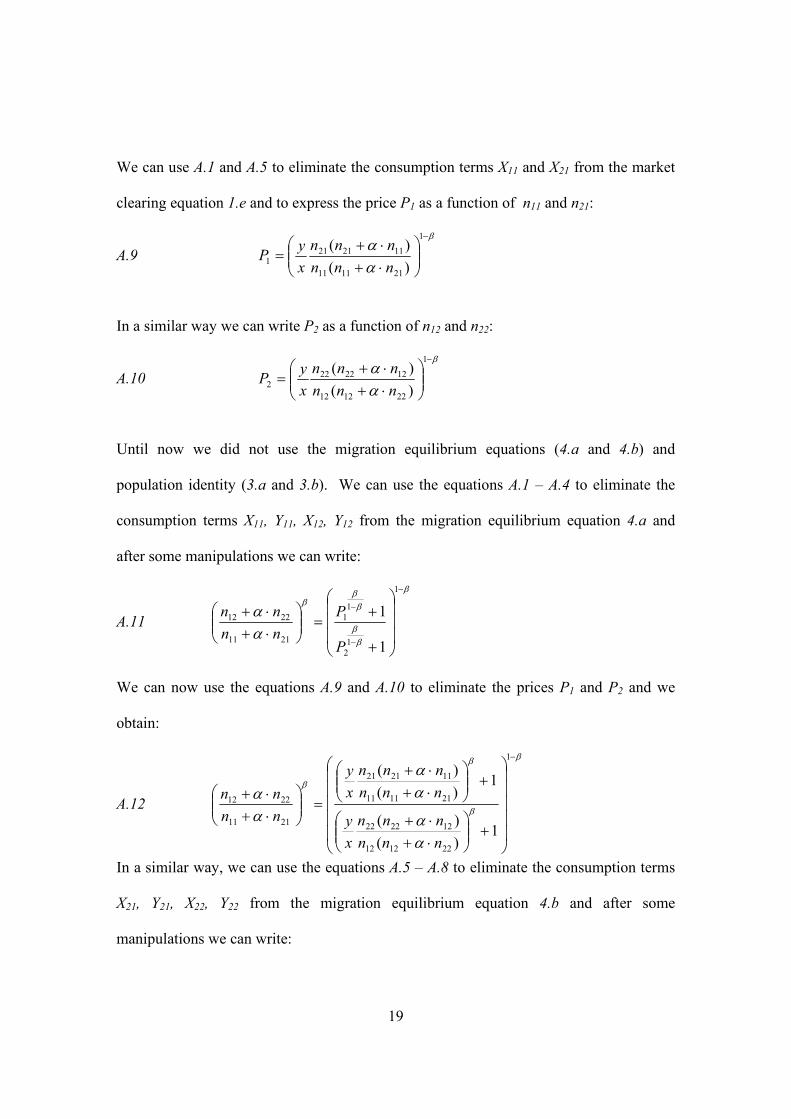
We can compute the prices with equations A.9 and A.10, in the Appendix, and the
consumption and utility levels with equations A.1 – A.8.
For the internal migration equilibrium with n11 = n22 = 0.5 utility is:
(6) ( ) βββββα −
+
+
==1
12112
21 yxxUU II
(7) ( ) βββββα −
+
+
==1
2221
2
21 yxyUU II
Both corner solutions generate the same utility levels. Utility for the Island 1 corner
solution is:
(8) ( ) ( ) βββββα−
++=1
11
2
1 yxxU C
(9) ( ) ( ) βββββα−
++=1
21
2
1 yxyU C
9
The internal equilibrium and the corner solutions generate the same relative price.
The difference between the levels of consumption and utility is due to differences in
social capital. For both population groups, the social capital for the internal equilibrium is
21 α+ while for the corner solutions, it is α+1 . The utilities ratio is 12/ >= βI
ijCij UU , i,
j = 1, 2. Thus the level of utility is higher for corner solutions than for the internal one.
We now compare the initial utility level with that of the internal equilibrium:
(10) β
ββ
βββ α
++
= −
−
21
)()(
1
1
0 xyx
UU I
The first term is greater than 1 and the second is smaller than 1. Thus, the impact is
ambiguous a priori. For β = 1, there are no diversity gains and the ratio is 12
1≤
+α .
Thus, migration leads to a welfare loss if there are no diversity gains, except when the
two populations have identical social capital ( 1=α ), in which case migration has no
impact on welfare. From equation (10), it follows that welfare gains from migration
increase with α and fall with β.
5. Trade
We consider the situation in which people cannot migrate but they can trade. In
this situation, there is one price in both islands and both goods are available in both
islands. People from Island 1 (2) maximize U11 (U22).
The first order conditions are:
(11) 11
11111−= βPYX
10
(12) 11
12222−= βPYX
The budget constraints are:
(13) xPYXP 111111 =+
(14) yYXP =+ 22221
The market clearing conditions are: 7
(15) 2211 XXx +=
(16) 2211 YYy +=
We can eliminate X11 and X22 from (15) using first order conditions (11) and (12):
(17) ( ) 11
12211−+= βPYYx
Using (16), we can express the price:
(18) β−
=
1
1 xyP
From (11), (13) and (18) we obtain consumption for Island 1 and similarly for Island 2.
The utilities under free trade are:
(19) ββββ −+= 111 )(
2
yxxU t
(20) ββββ −+= 122 )(
2
yxyU t
7 Due to Walras Law we just keep one equation.
11
6.Comparing the Migration and the Trade Solutions
We use the notation of U1 (U2) for the utility of the native population in Island 1
(2) in equilibrium From the relations (10),(14) and (19) we obtain the following
inequalities (and similarly for the second island):
(21) ItC UUU 111 >>
(22) ItC UUU 222 >>
The intuition for these results is that utility is higher when society benefits from product
diversity and social capital. Populations benefit from the same level of product diversity
under the three solutions. However, the level of social capital differs under these
solutions. When both populations are on the same island, social capital S=1+α . Trade,
with S=1, is a second best. The internal equilibrium, with social capital S=(1+α)/2, has
the lowest utility.
It is interesting to compare social inequality across the two population groups
under all these situations. In the initial situation we have:
(23) β
=
yx
UU
02
01
For the migration and trade situations we have:
(24) 2
2
1
2
1
2
1β
===
yx
UU
UU
UU
I
I
t
t
C
C
Thus, both migration and trade reduce world inequality.
12
7. Migration Dynamics
With multiple migration solutions, we further differentiate between them by
introducing a dynamic system. Consider
(25)
−=−=
222121
111212
UUnUUn
&
&
where the change in the proportion of the population that migrates from one island to the
other is equal to the difference between the utility of a migrant and the utility of an
individual that stays at home. The equality of utility, U12 = U11 and U21 = U22,
corresponds to a critical point for the dynamic system, and, from the preceding
discussion, it is an equilibrium condition for the system (4.a and 4.b) and corresponds to
n12 = 0.5 and n21 = 0.5. The dynamic system is nonlinear and does not have a closed form
solution but we can analyze the behavior of the system around the critical point by
linearization. We find that for the same human capital (x = y), for small α and for β close
to 1, the internal migration equilibrium is a negative attractor, and for other values of α
and β it is a saddle point. Thus, for both situations the equilibrium is unstable.
Let us consider the values of α = 0.5 and β = 0.5. If U12 - U11 is positive then n12
is increasing, and there is migration of population 1 from Island 1 to Island 2. If U12 - U11
is negative then n12 is decreasing, and the migrants are returning to their own island, with
a similar discussion for n21. From Figure 2 we note that the internal migration equilibrium
is a saddle point and therefore unstable, and the corner solutions are stable points.
13
Figure 2. Internal migration equilibrium is a saddle point, therefore unstable, and the corner solutions are stable points.
0 0.2 0.4 0.6 0.8 1n11 0
0.2
0.4
0.6
0.8
1
n2
The dynamic system (25) is well defined as long as the utilities are well defined.
To compute the utilities, we need finite prices and this implies the existence of migration.
How can we define the dynamic system in the initial situation, before migration takes
place? We can imagine a two step process. In the first stage, the first migrant move to the
other island.8 In the second stage, migration is governed by the dynamic system.
We consider three situations for the first stage; (1) n12 > n21; (2) n12 = n21; (3) n12
< n21. When we consider the same amount of human capital for both islands (x = y) the
results are symmetric (Figure 3). The bold curves are numerically computed solutions
and correspond to the three situations in the first stage (we choose for the first stage:
(1)10
312 =n ,
101
21 =n ; (2) 10
212 =n ,
102
21 =n ; (3) 101
12 =n ,10
321 =n ). In case (1),
migration is higher from Island 1 to Island 2 than from Island 2 to Island 1. This results in
8 We do not consider transportation costs in this model but it seems reasonable to assume that it is prohibitively expensive to move large populations from one island to another at the beginning of the migration, so for the first step we consider small values for n12 and n21.
14
S22 > S11 and S12 > S21. This implies a higher output in Island 2 than in Island 1 for both
populations and therefore a faster migration 12n& than 21n& . Thus everybody ends up on
Island 2 in a stable equilibrium (n12 = 1, n21 = 0). In case (2), U12 - U11 = U21 - U22 and we
obtain a similar migration pattern for the two populations, ending in an unstable
equilibrium (n12 = 0.5, n21 = 0.5). Case (3) is symmetric with case (1), with n12 = 0, n21 =
1. Note that in cases (1) and (3), there is an intermediate range (for values of n12 in case
(1) and n21 in case (2) between 0.35 and 0.75 in Figure 3) where we obtain return
migration.
Figure 3.The migration trajectories for the same amount of human capital (x = y).
0.2 0.4 0.6 0.8 1n12
0.2
0.4
0.6
0.8
1
12n
123
I
C1
C2
One can repeat the exercise with x ≠ y, i.e., with different levels of human capital
for the two populations and the same three cases as in the first stage.9 Figure 4 depicts the
case x = 1, y = 100. In case (3), when more people migrate from Island 2 to Island 1 than
population 1 migrates to Island 2, the very high level of human capital for population 2 in
9 The initial values for n12 and n21 for the three cases are the same as in the equal amount of human capital case.
15
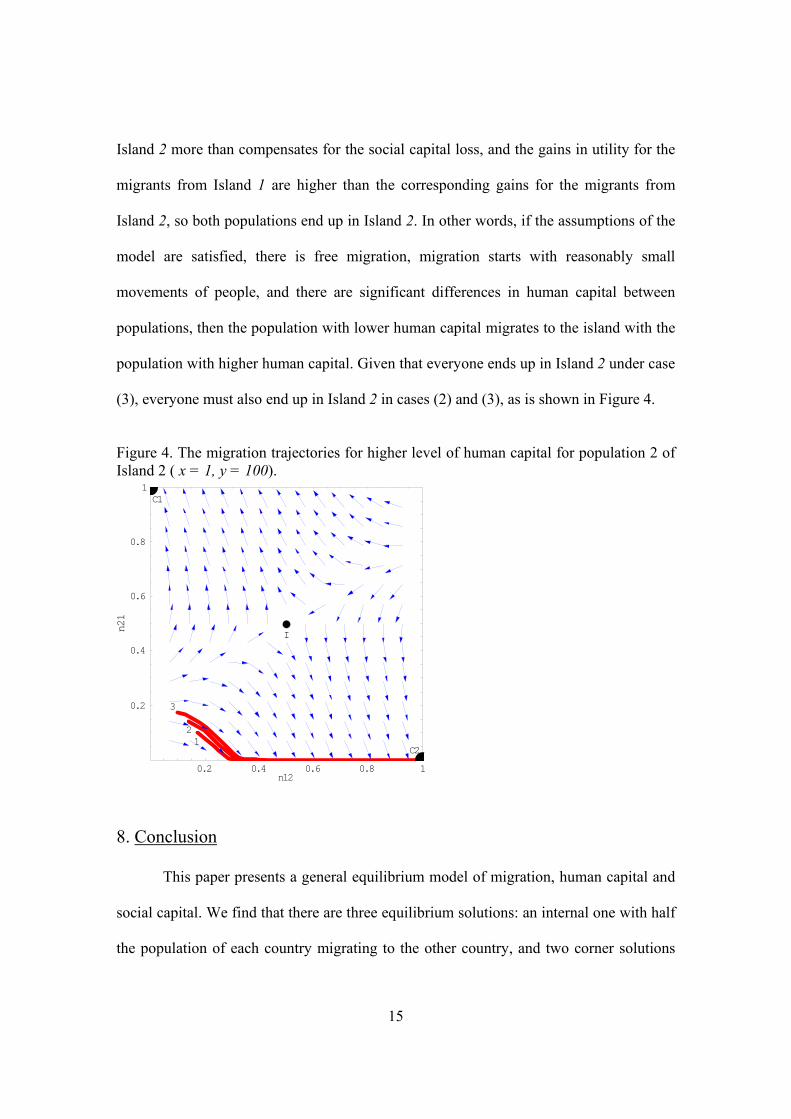
Island 2 more than compensates for the social capital loss, and the gains in utility for the
migrants from Island 1 are higher than the corresponding gains for the migrants from
Island 2, so both populations end up in Island 2. In other words, if the assumptions of the
model are satisfied, there is free migration, migration starts with reasonably small
movements of people, and there are significant differences in human capital between
populations, then the population with lower human capital migrates to the island with the
population with higher human capital. Given that everyone ends up in Island 2 under case
(3), everyone must also end up in Island 2 in cases (2) and (3), as is shown in Figure 4.
Figure 4. The migration trajectories for higher level of human capital for population 2 of Island 2 ( x = 1, y = 100).
0.2 0.4 0.6 0.8 1n12
0.2
0.4
0.6
0.8
1
12n
12
3
I
C1
C2
8. Conclusion
This paper presents a general equilibrium model of migration, human capital and
social capital. We find that there are three equilibrium solutions: an internal one with half
the population of each country migrating to the other country, and two corner solutions
16
where everyone ends up in one of the two countries. The internal solution is unstable and
is unlikely to be reached under different levels of human capital across the two countries.
The corner solutions are stable and will be reached under most circumstances. Welfare
under any of the equilibrium solutions rises with the increase in the diversity in human
capital and decreases with the diversity in social capital between migrants and natives.
Either of the two corner solutions maximizes world welfare. These solutions are obtained
if migration is unconstrained but there are high human capital differences – in which case
everyone ends up in the country with the highest initial level of human capital - or, if
immigration is fully restricted by one of the two countries. In the presence of social
capital, migration restrictions by one country maximize world welfare.
In addition, trade and migration are not equivalent if social capital is present.
Welfare increases with free trade and is higher than under the internal migration solution
and lower than under the corner solutions. Both trade and migration reduce inequality
between the populations of the two countries.
17
References Bauer, T.K. and A. Kunze. 2004. “The Demand for High-Skilled Workers and Immigration Policy,” Institute for the Study of Labor (IZA) Discussion Paper No. 999. Coleman, J.S. 1988. “Social Capital in the Creation of Human Capital,” American Journal of Sociology 94 (Supplement): S95-S120. Corden, W.M. 2003. “40 Million Aussies? The Immigration Debate Revisited,” Inaugural Richard Snape Lecture, Productivity Commission, Melbourne. Glaeser, E. L.,, D. Laibson, J.A. Scheinkman, and C.L. Soutter. 2000. “Measuring Trust,” Quarterly Journal of Economics, 115 (3):811-46. Jacobson, M.F. 1998. Whiteness of a Different Color: European Immigrants and the Alchemy of Race. Harvard University Press: Cambridge. Lazear, E.P. 2000. “Culture and Language” in Essays in Honor of Gary S. Becker. Journal of Political Economy 107 (6): S95-126. Part 2. Schiff, M. 1992. “Social Capital, Labor Mobility, and Welfare: The Impact of Uniting States,” Rationality and Society 4: 157-175. Schiff, M. 1998. “Integration Politique, Mobilite de la Main d’Oeuvre, Bien-etre et Capital Socio-Culturel,” Revue d’economie du developpement. 6 (4). Schiff, M. 2002. “Love thy Neighbor: Trade, Migration, and Social Capital,” European Journal of Political Economy, 18 (1):87-107 Schiff, M. 2004. “Labor Mobility, Trade and Social Capital,” Review of International Economics (September). Forthcoming. Schiff, M. and L. A. Winters. 1998. “Regional Integration as Diplomacy,” World Bank Economic Review 12(2): 271-96.
18
Appendix
Assuming that there is migration for both islands (n11 ≠ 1 and n22 ≠ 1 so n12 ≠ 0
and n21 ≠ 0 and 0 < P1, P2 < ∝), we reduce the initial systems of 14 equations (1.a – 1.e,