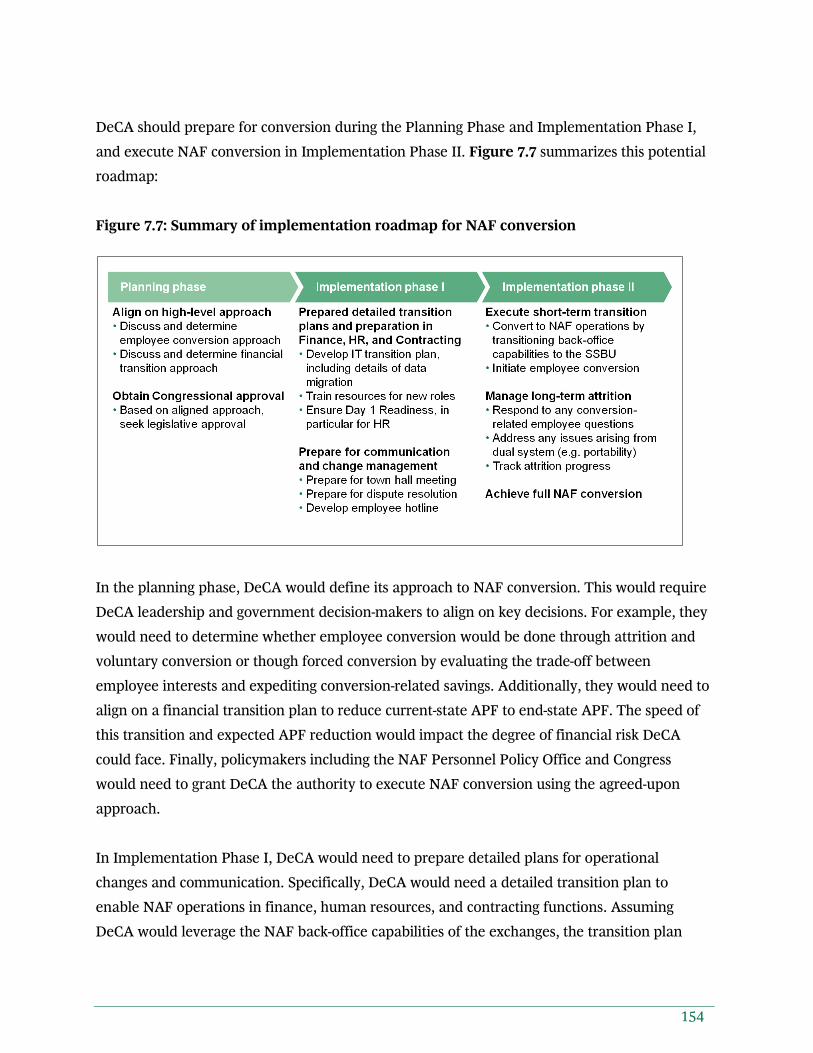
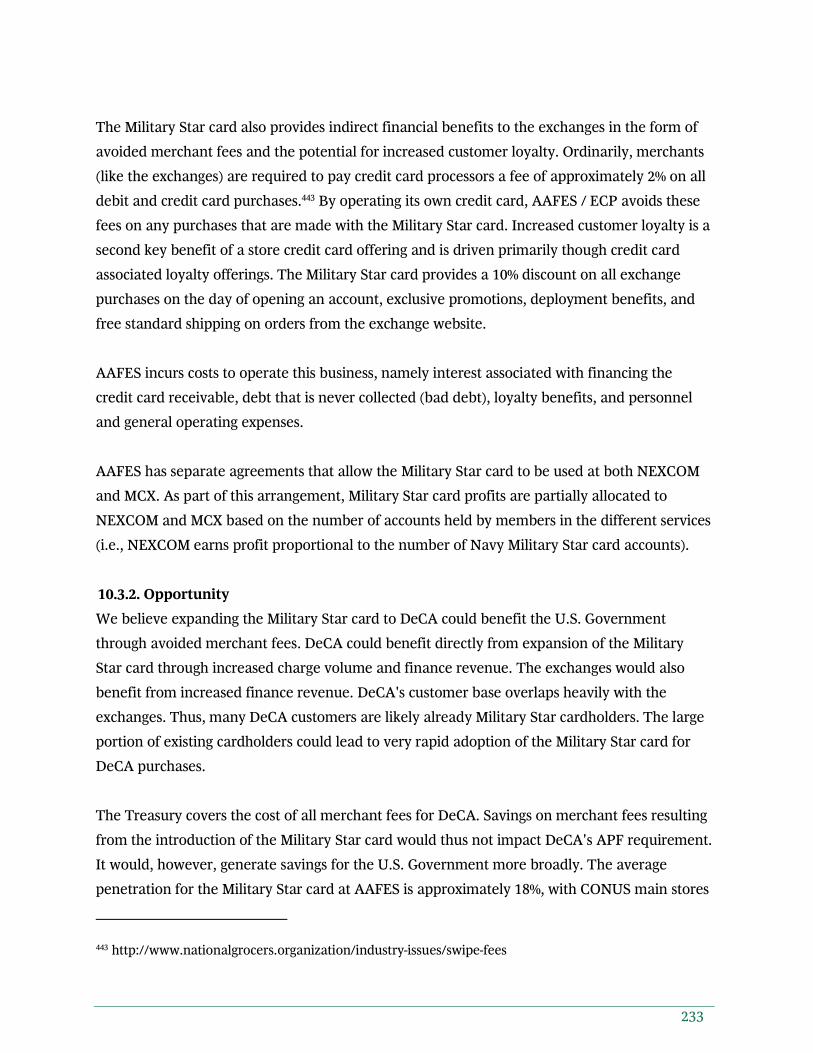
Military Resale Study Assessment of opportunities for the Defense Commissary Agency and evaluation of consolidation in the broader military resale system Boston Consulting Group July 10, 2015
Transcript
Military Resale Study Assessment of opportunities for the Defense Commissary Agency and evaluation of consolidation in the broader military resale system
Boston Consulting Group
July 10, 2015
WoodSW
Typewritten Text
WoodSW
Typewritten Text
The estimated cost of this report or study for the Department of Defense is approximately $1,417,000 for the 2015 Fiscal Year. This includes $1,375,000 in expenses and $42,000 in DoD labor.
13.1. List of stakeholders .......................................................................................................... 290
7
Section 1: Executive summary
1.1. Study context
In 2015, the U.S. Department of Defense (DoD), Office of Personnel and Readiness (P&R)
engaged the Boston Consulting Group (BCG) to evaluate opportunities for the Defense
Commissary Agency (DeCA). The purpose was to identify ways to reduce the amount of
appropriated funds necessary to support DeCA while minimizing impact to or even enhancing
the patron benefit. DoD asked BCG to evaluate various potential business reforms to the
commissary in its assessment, including:
Transition from the current "cost-plus 5%" pricing approach for goods sold in
commissaries to "variable pricing" (framework used by all private sector grocers)
Introduce "private label" products into commissaries, which are an alternative to
national brands that private sector grocers leverage to offer products of similar quality
at lower prices and higher profit margins (e.g., Kroger brand corn flakes versus
Kellogg's)
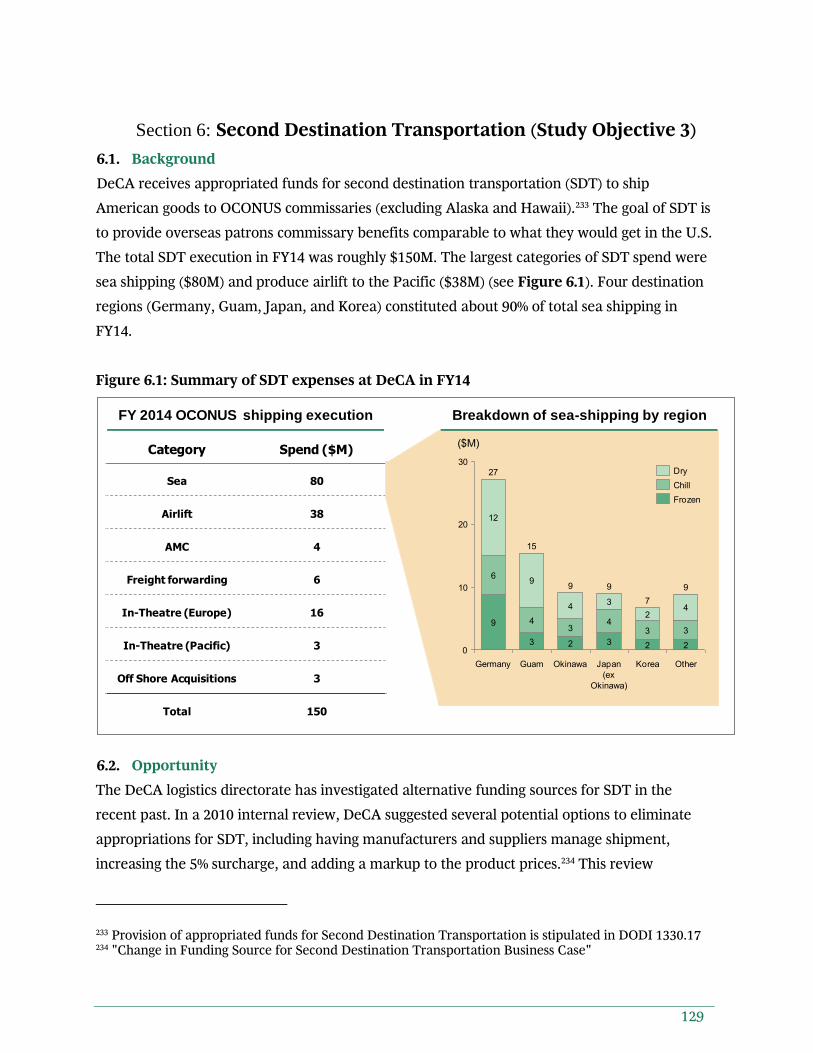
Reduce the need for appropriated funding for Second Destination Transportation to
locations outside the Continental United States (OCONUS)
Convert commissaries from an appropriated fund (APF) activity to a nonappropriated
fund (NAF) activity, and thus fund and operate commissaries in a similar manner as the
exchanges1
Consolidate all or some of the commissary system with the exchange system(s) to
improve efficiency
For each potential reform, BCG estimated the size of budgetary savings, assessed the critical
path for implementation, analyzed any impact on patrons, and highlighted other potential
impacts on the broader military resale system.
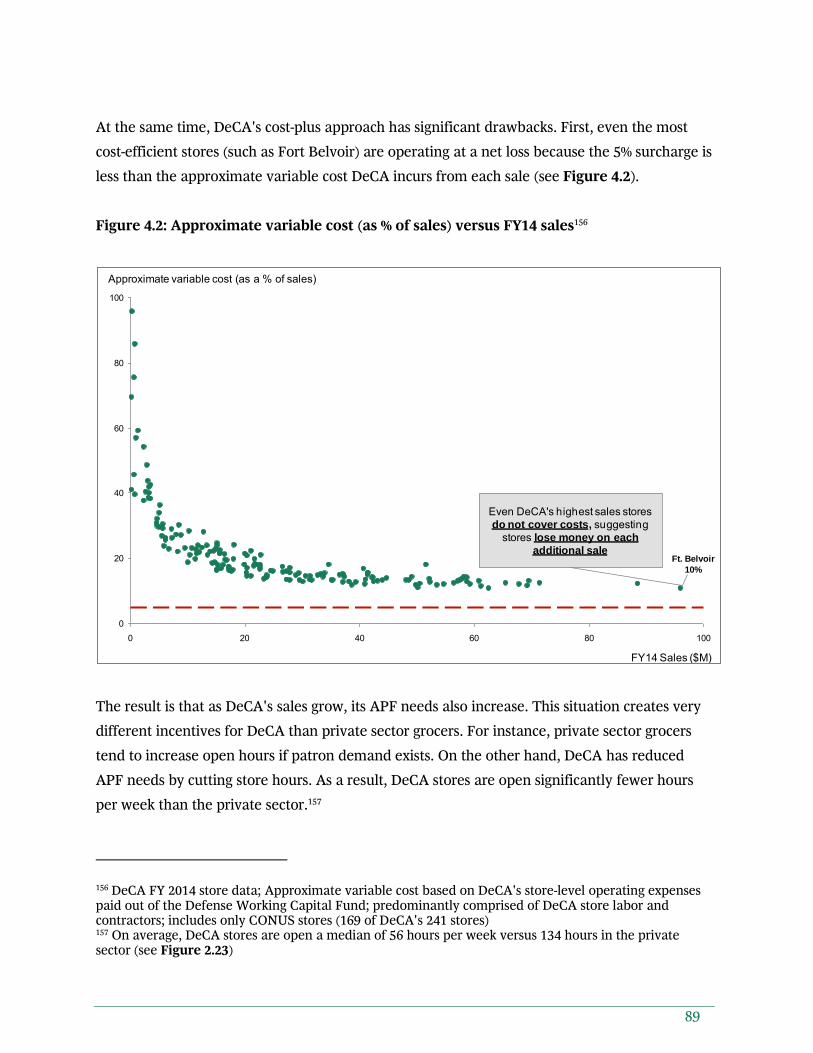
1.2. Understanding DeCA's current operations
DeCA operates very differently than private sector grocers. DeCA sells at cost-plus a 5%
surcharge in order to offer discounted groceries to patrons on military bases around the world.
Unfortunately, cost-plus pricing significantly constrains DeCA in several ways:
1 Many military installations have retail stores ("exchanges") operated by one of three service-aligned organizations within DoD. AAFES operates exchanges on Army and Air Force installations, NEXCOM
8
Prevents DeCA from capturing any profit margin beyond the 5% surcharge, which in
practical terms means DeCA incurs a net loss on each transaction2
Creates an environment with misaligned incentives in which higher sales volume
results in greater losses, increasing the need for additional APF funding
Dampens incentive for DeCA to lower its product cost since doing so would result in
lower prices and therefore lower surcharge revenue
Creates a situation in which reducing operating cost can only be done through levers
that may not be good for patrons, such as reducing store hours
Prevents DeCA from having a clear pricing strategy to compete with private sector
grocers and help bring patrons into the commissary
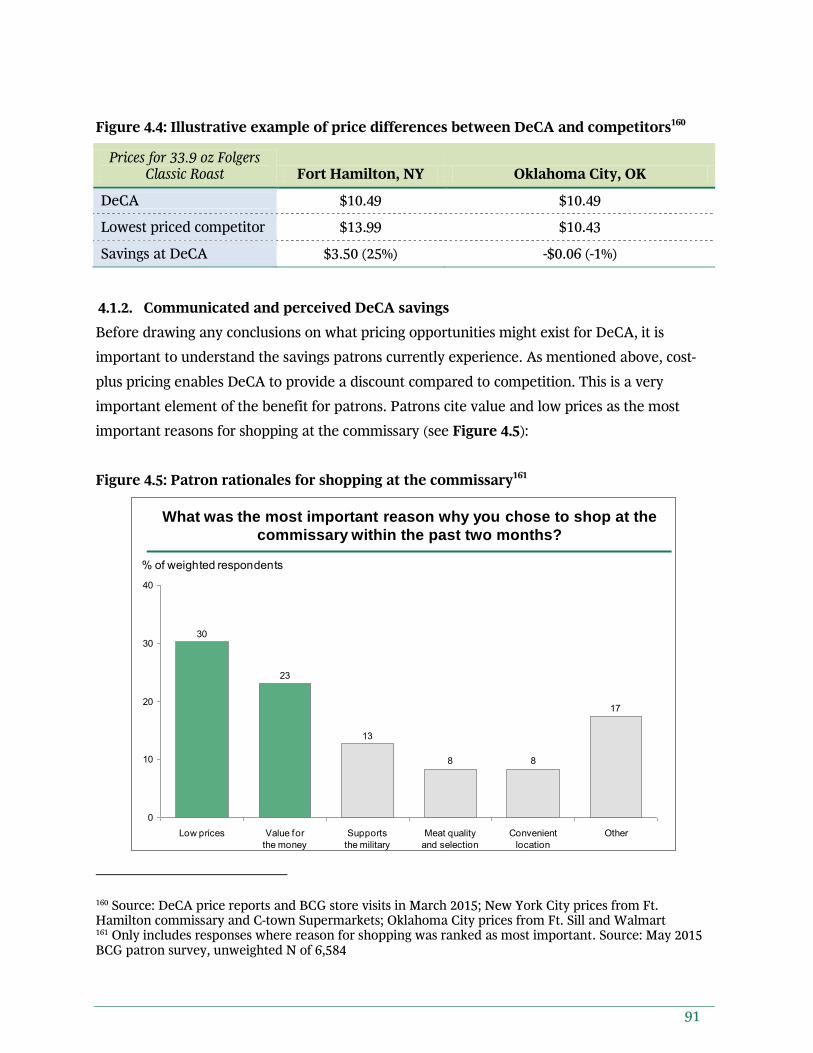
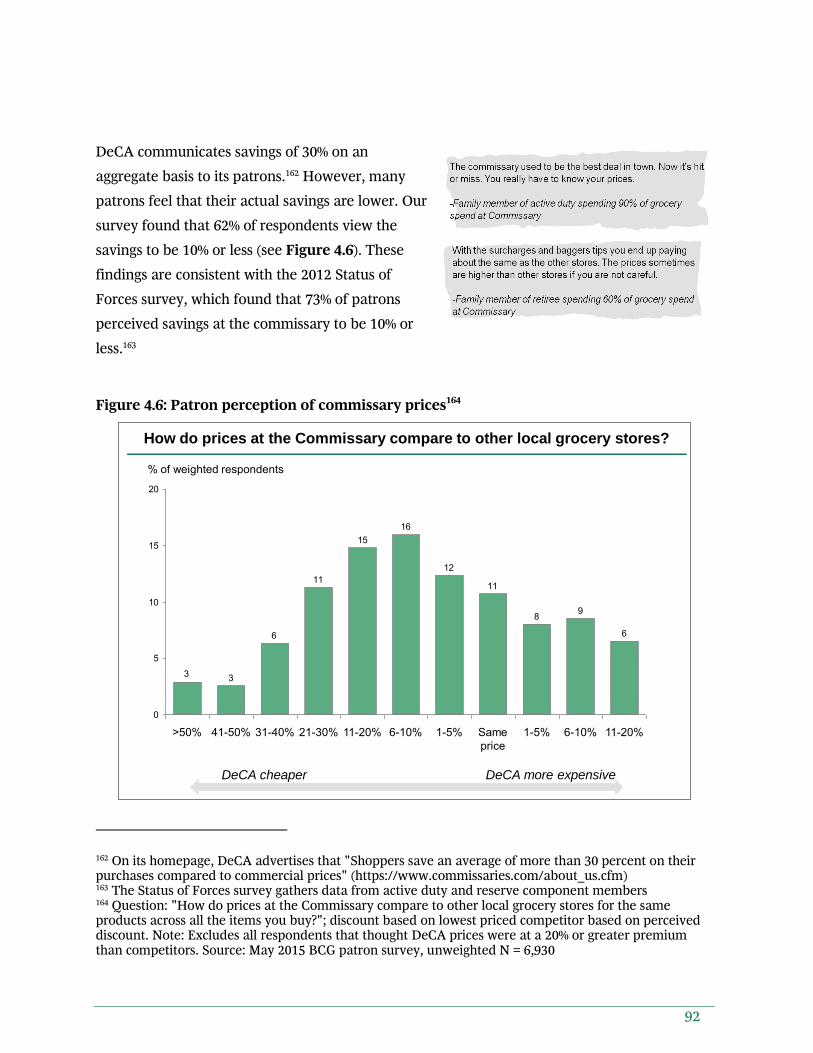
Additionally, DeCA communicates a worldwide average 30% savings for patrons versus the
private sector.3 However, when compared to the lowest priced nearby competitor, we believe
most patrons are actually experiencing 16%-21% savings in CONUS locations on identical
branded items.4
DeCA faces other constraints that impede its ability to operate effectively. One major constraint
is operating as an APF entity. This requires DeCA to comply with an array of Federal contract
and personnel regulations that are intended to achieve certain public policy objectives, but also
drive up labor and acquisition costs, lengthen timeframes for key actions, and are therefore out
of alignment with the commercial environment DeCA competes in. In contrast, the exchanges
are NAF entities that operate under a significantly more flexible contract and personnel
framework that enables them to conduct personnel and acquisition activities at a similar pace
and scope as the private sector while still balancing the public policy objectives inherent in
being a government entity.5
2 Even the largest, most efficient commissaries have an approximate variable cost of 10% of sales on every transaction, and most commissaries have much higher variable costs ranging from 15% to 30%. See Section 2.3 3 DeCA is required by DoDI 1330.17 to meet an annual savings rate proposed by its Board of Directors, which was most recently agreed upon at 30% 4 See Section 2.3 for our savings estimate and methodology 5 For example, DFARS regulations impact the process by which DeCA administers contracts. See Section 7.1.2.4 for additional details
9
DeCA is also required to ship certain domestic products to OCONUS locations, operate small
remote stores that are necessary to serve patrons but are not economically sustainable without
subsidization, and is limited in the products that can be sold (e.g., cannot sell alcohol or some
common non-food items offered by many private sector grocers).
In sum, DeCA's overall business model and the regulatory constraints applied to DeCA have
resulted in competitive disadvantages that negatively impact both its bottom line and the
patron experience. While DeCA is a capable organization in many ways that often optimizes
business outcomes within the constraints of the regulations they work with, we believe there
are many opportunities to change DeCA's business model and reduce APF needs while
maintaining or enhancing patron benefit.
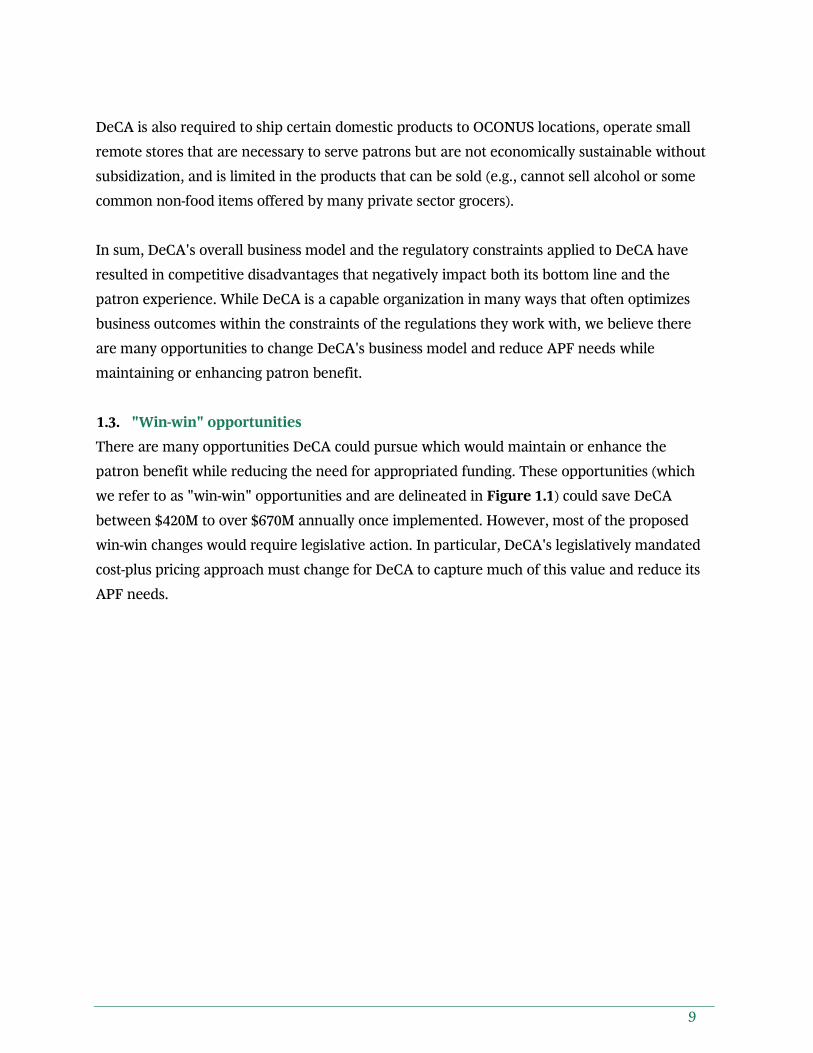
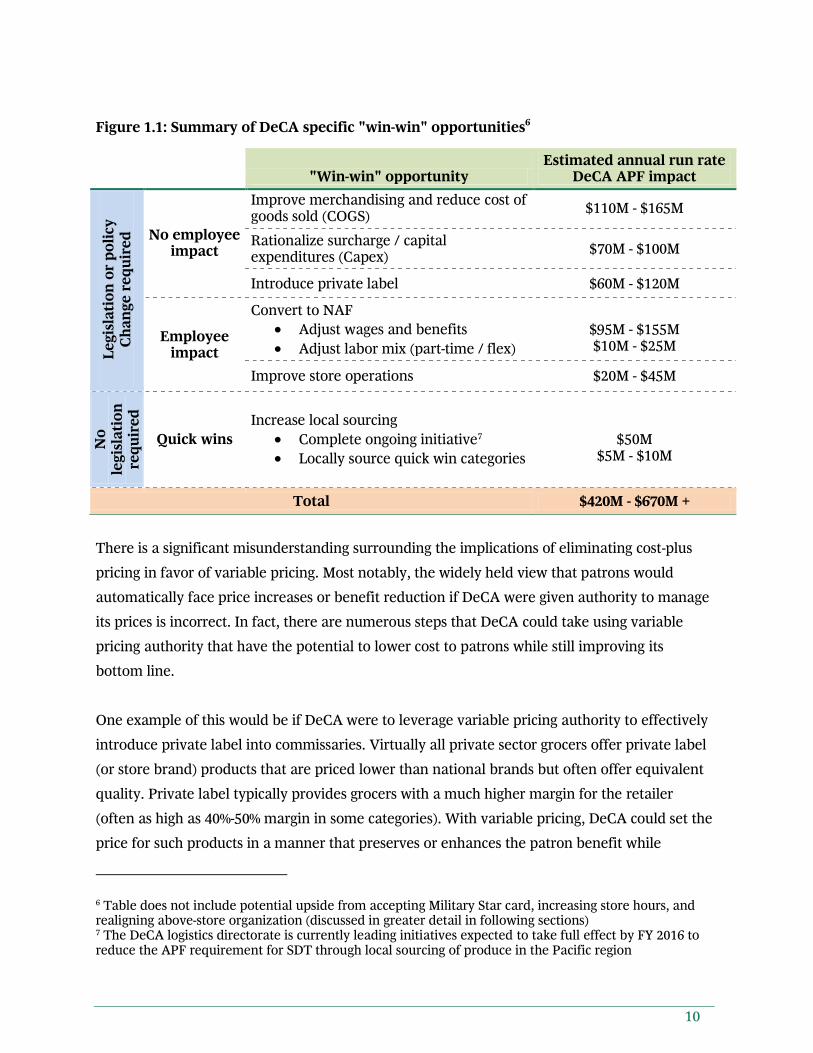
1.3. "Win-win" opportunities
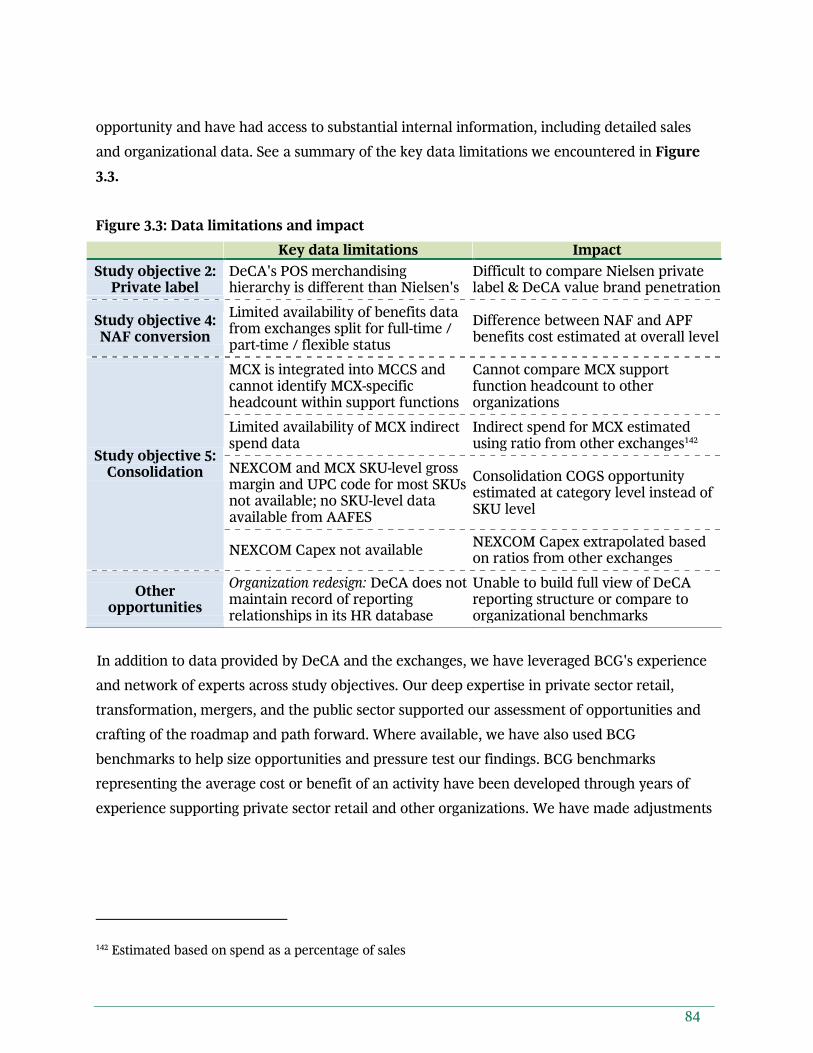
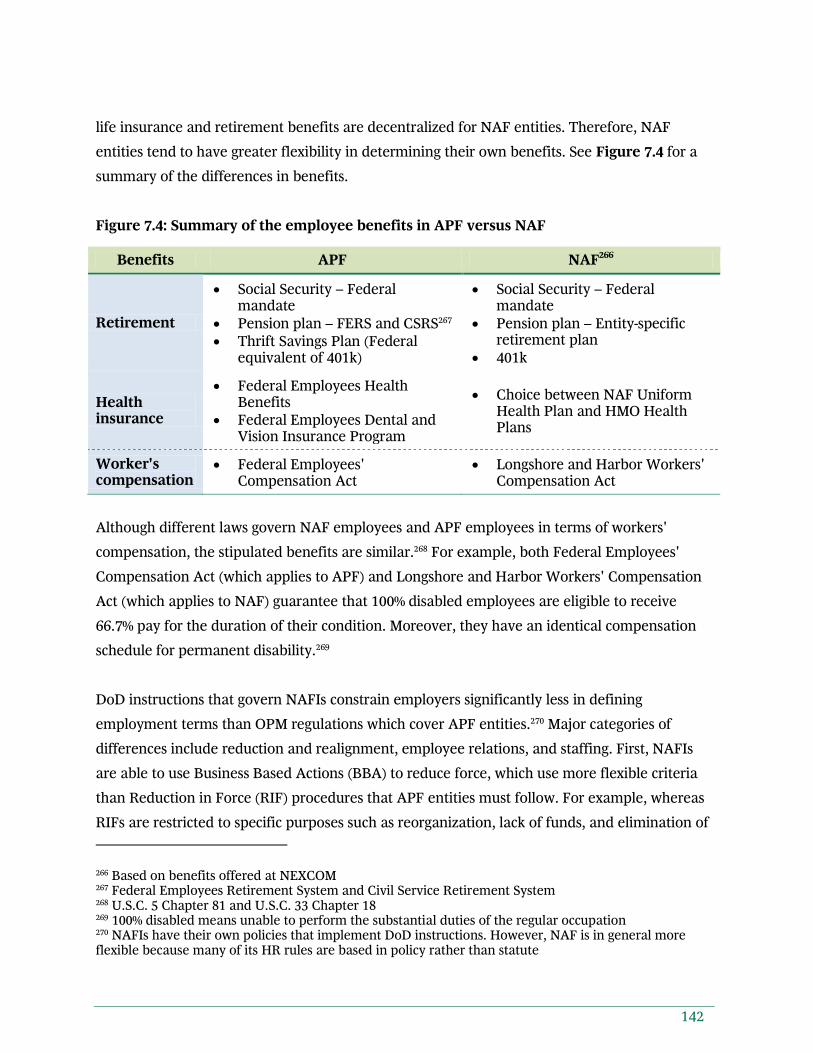
There are many opportunities DeCA could pursue which would maintain or enhance the
patron benefit while reducing the need for appropriated funding. These opportunities (which
we refer to as "win-win" opportunities and are delineated in Figure 1.1) could save DeCA
between $420M to over $670M annually once implemented. However, most of the proposed
win-win changes would require legislative action. In particular, DeCA's legislatively mandated
cost-plus pricing approach must change for DeCA to capture much of this value and reduce its
APF needs.
10
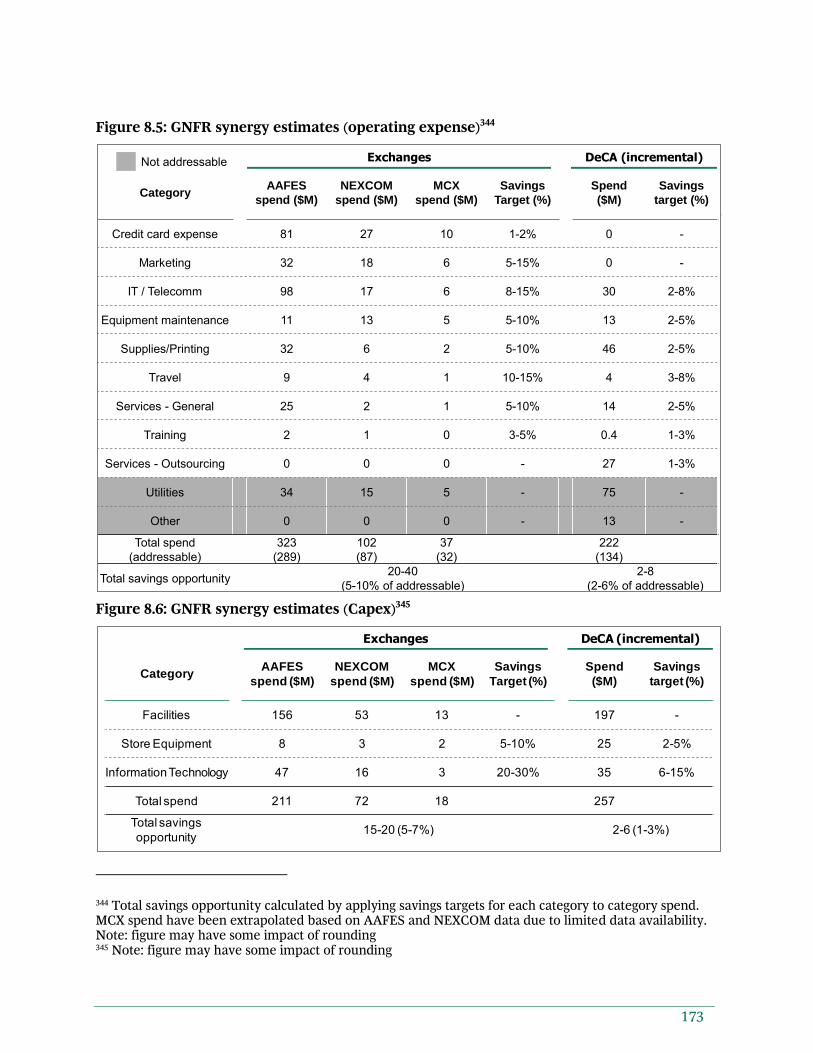
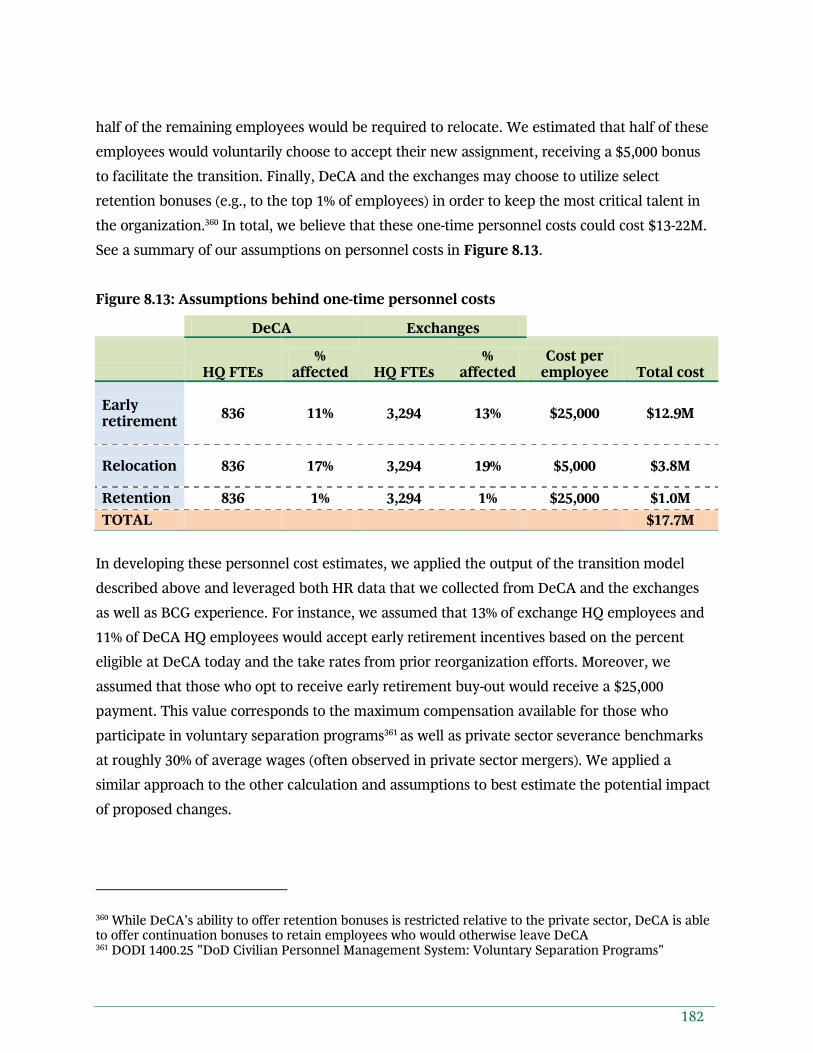
Figure 1.1: Summary of DeCA specific "win-win" opportunities6
"Win-win" opportunity
Estimated annual run rate DeCA APF impact
Le
gis
lati
on
or
po
licy
C
ha
ng
e r
eq
uir
ed
No employee impact
Improve merchandising and reduce cost of goods sold (COGS)
$110M - $165M
Rationalize surcharge / capital expenditures (Capex)
$70M - $100M
Introduce private label $60M - $120M
Employee impact
Convert to NAF
Adjust wages and benefits
Adjust labor mix (part-time / flex)
$95M - $155M $10M - $25M
Improve store operations $20M - $45M
No
le
gis
lati
on
re
qu
ire
d
Quick wins
Increase local sourcing
Complete ongoing initiative7
Locally source quick win categories
$50M
$5M - $10M
Total $420M - $670M +
There is a significant misunderstanding surrounding the implications of eliminating cost-plus
pricing in favor of variable pricing. Most notably, the widely held view that patrons would
automatically face price increases or benefit reduction if DeCA were given authority to manage
its prices is incorrect. In fact, there are numerous steps that DeCA could take using variable
pricing authority that have the potential to lower cost to patrons while still improving its
bottom line.
One example of this would be if DeCA were to leverage variable pricing authority to effectively
introduce private label into commissaries. Virtually all private sector grocers offer private label
(or store brand) products that are priced lower than national brands but often offer equivalent
quality. Private label typically provides grocers with a much higher margin for the retailer
(often as high as 40%-50% margin in some categories). With variable pricing, DeCA could set the
price for such products in a manner that preserves or enhances the patron benefit while
6 Table does not include potential upside from accepting Military Star card, increasing store hours, and realigning above-store organization (discussed in greater detail in following sections) 7 The DeCA logistics directorate is currently leading initiatives expected to take full effect by FY 2016 to reduce the APF requirement for SDT through local sourcing of produce in the Pacific region
11
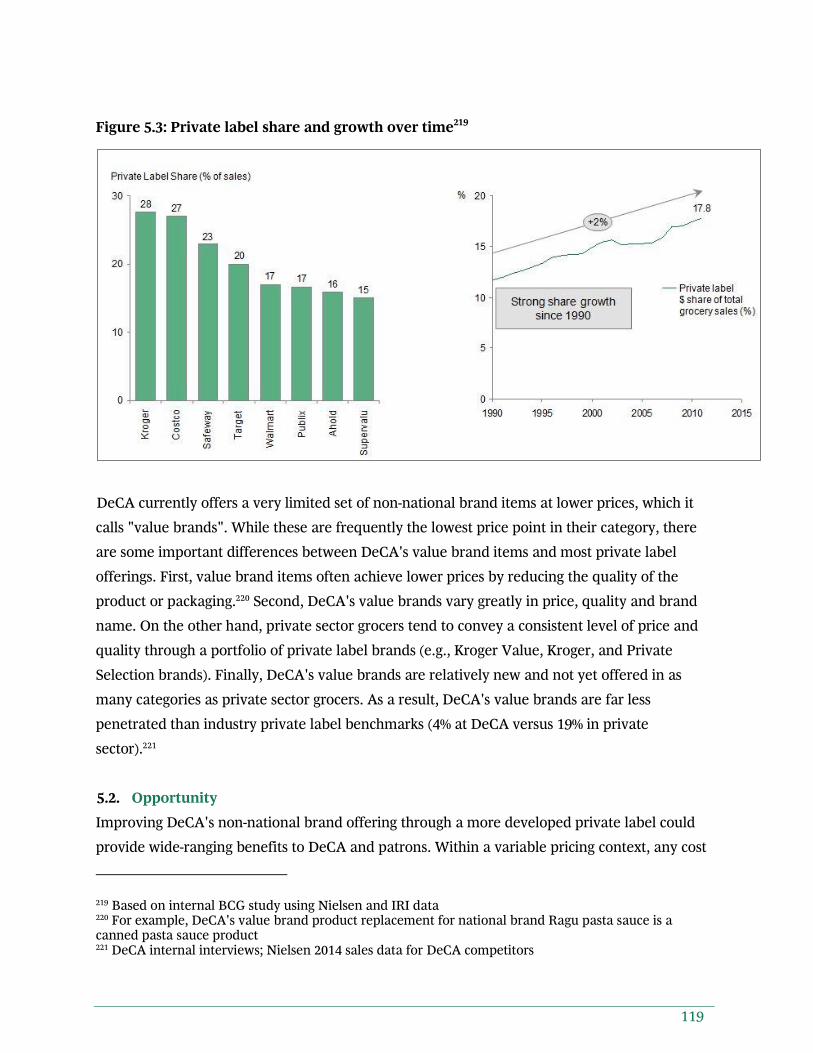
increasing margin and thus improving their bottom line. Private label now makes up roughly
19% of all grocery sales8 in the U.S. private sector, and commissary patrons have expressed
willingness to consider private label products in commissaries for many categories.9
The example below (Figure 1.2) demonstrates more holistically how the various win-win
reforms can improve both DeCA's bottom line and the patron experience.
Figure 1.2: Case study example of win-win opportunities for DeCA and patrons
Before making any pricing changes, we suggest DeCA revisit its definitions and parameters for
measuring patron savings. Controls can be put in place (e.g., independent validation) to ensure
that savings are maintained at DoD's intended levels.
8 Based on 2014 Nielsen data 9 Roughly 60% of patrons indicated willingness to switch to purchase private label from DeCA (varied by category). Source: May 2015 BCG patron survey, unweighted N = 3,843
Broad assortment of
national brands
Limited 'value brand'
offering
No private label
Sell at cost plus 5%
High complexity in
managing inventory due to number of brands
Issues with out of-stocks at times
Reduce # of national brands
Build deeper relationships and improve terms with
manufacturers
Introduce private label with similar quality at a lower price point
Sell private label at a margin
greater than 5%
Simplify shelf space to make
shopping and management of inventory easier
Today Suggested actions Impact
• Improved patron shopping experience
• Sufficient national brand options
• Improved selection with private label
• Simplified experience
• Increased margin for DeCA
• Fewer out-of-stocks
• Easier management of inventory as well as manufacturer relationships
5 – 6 comparable national brands (e.g., Hellmann's)
for ~$2.75
2 - 3 comparable national brands at ~$2.75
Private Label offering at ~$2.50
Similar or improved selection
Lower average cost
Example
offering to patron:
mayonnaise
12
1.4. Beyond the "win-win" opportunities
DeCA and government decision-makers should also carefully consider additional opportunities
which can generate value but would either involve risk to patron benefit or raise other public
policy tradeoffs that need to be closely evaluated. The most significant of these opportunities is
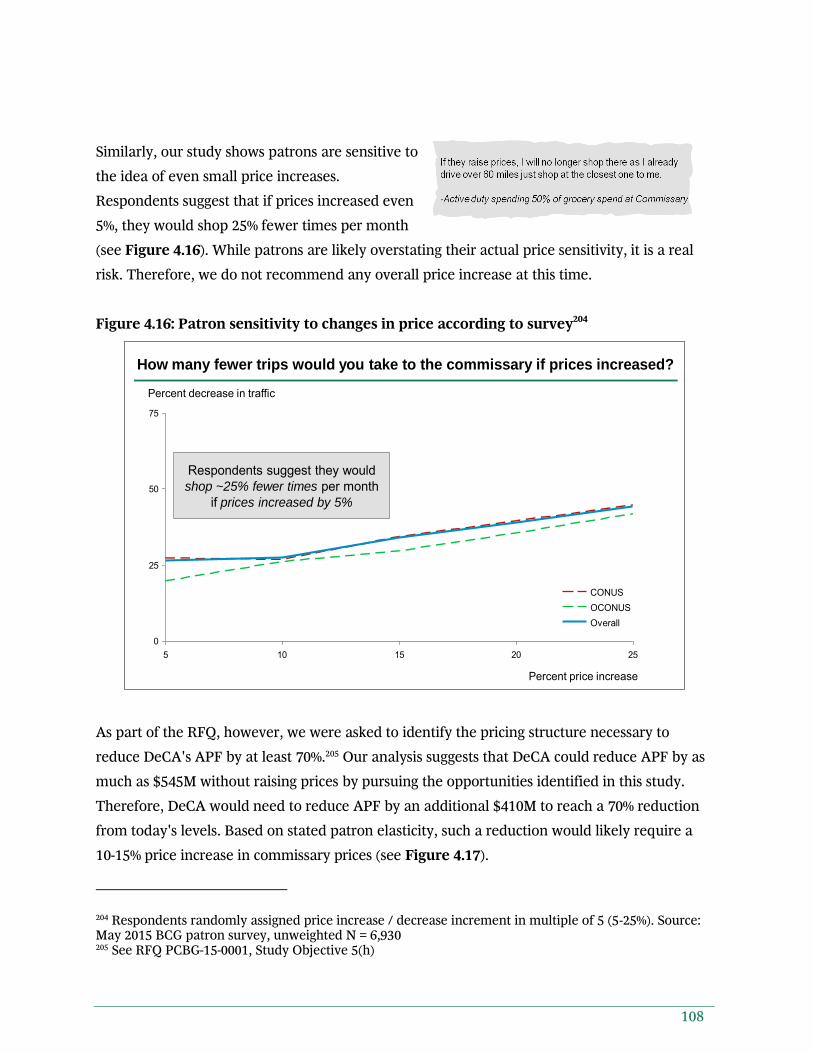
increasing prices. When surveyed, patrons indicated that they would likely move substantial
business to private sector grocers if prices at the commissary rose even 5%.10 In addition, a price
increase at DeCA would also have potential negative impacts on the exchanges in the form of
reduced patron traffic at resale complexes.
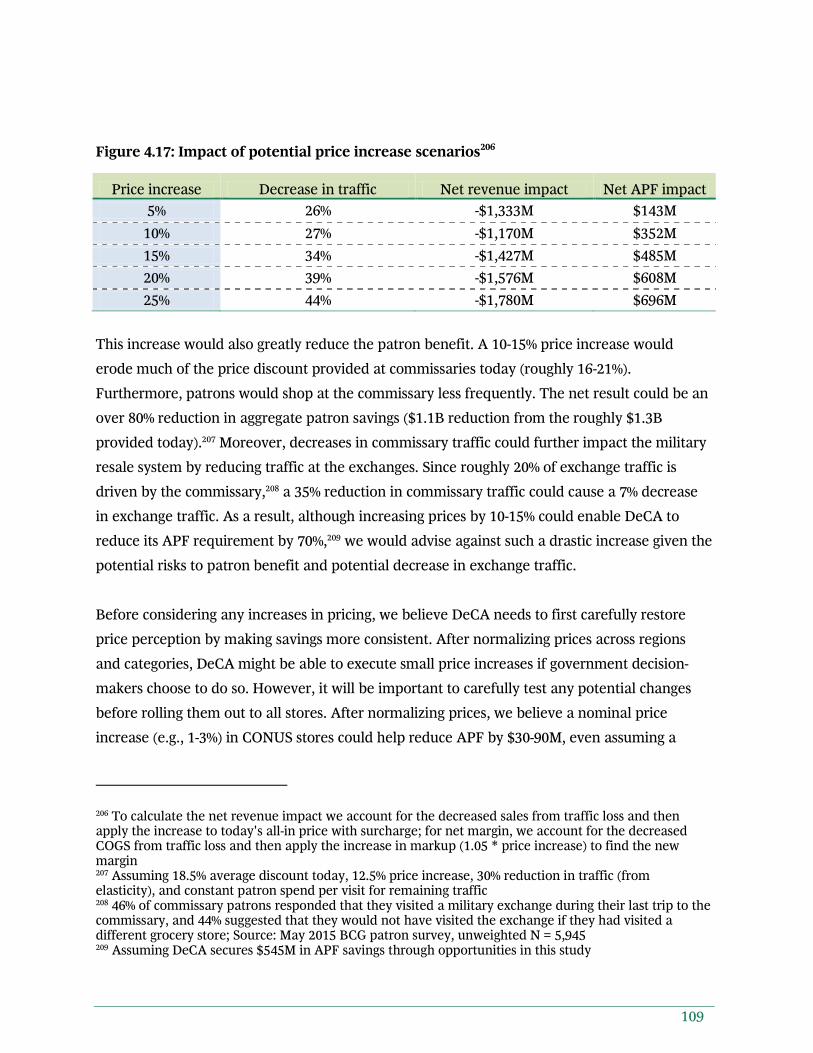
For this reason, we do not recommend any price increase for the commissaries at this time. A
nominal price increase of 1% – 3% could reduce APF by as much as $90M annually and might
be viable at some point in the future. However, we believe that DeCA and government
decision-makers should pursue the full set of "win-win" opportunities first and begin to restore
price perception before considering any potential price increase.
1.5. Consolidation of military resale activities
We believe that some degree of consolidation within the military resale system is the right
approach, but we do not recommend full consolidation of DeCA and the exchanges. There are
important aspects of DeCA and the exchanges to consider in evaluating the opportunity for
consolidation. To start, DeCA's grocery store operations are very different from the exchanges'
department and convenience store operations. The categories are different (e.g., grocery versus
electronics or soft goods), the way patrons shop is different (e.g., much lower use of
eCommerce in grocery), and the capabilities needed are different (e.g., supply chain needs to
accommodate perishable categories). Therefore, fully combining DeCA with the exchanges
would introduce complexity that would likely exceed any value created. However, we do
believe that there are opportunities for DeCA and the exchanges to collaborate to a greater
extent, and in particular we think that they should eventually combine some back-office and
non-resale procurement functions to generate cost savings.
On the other hand, the vast majority of the exchanges' business is fundamentally similar. They
operate similar retail formats, serve similar customer needs, compete in similar categories (with
10 Patrons reported that with a 5% price increase, they would shift 25% of their spend at DeCA elsewhere. Source: May 2015 BCG patron survey. See Figure 4.16
13
the same or similar products), and have similar business models (e.g., they are all NAF entities).
Therefore, we believe there are opportunities to reduce cost among the exchanges through
consolidation of a number of functions (e.g., back-office functions as well as merchandising and
supply chain) while retaining the in-store brand experience that the exchanges believe is
necessary to best serve their patrons. Consolidating these functions will also facilitate the
combination of back-office and non-resale procurement functions with DeCA described above.
There are some important differences among the exchanges to consider. The exchanges have
each developed a unique organization aligned with their respective service branches. The
exchanges have many nuances to what they accomplish and how they serve their patron base
(e.g., NEXCOM ship stores, MCX integration with Marine Corps Community Services, AAFES
credit card offering to patrons). In addition, each exchange has their own approach to how they
manage categories in their main stores. However, given the similarities in their core business
models, we think that a combined exchange organization would be more capable, could
leverage the strengths present in each of the current organizations, and would have better size
and scale to compete going forward.
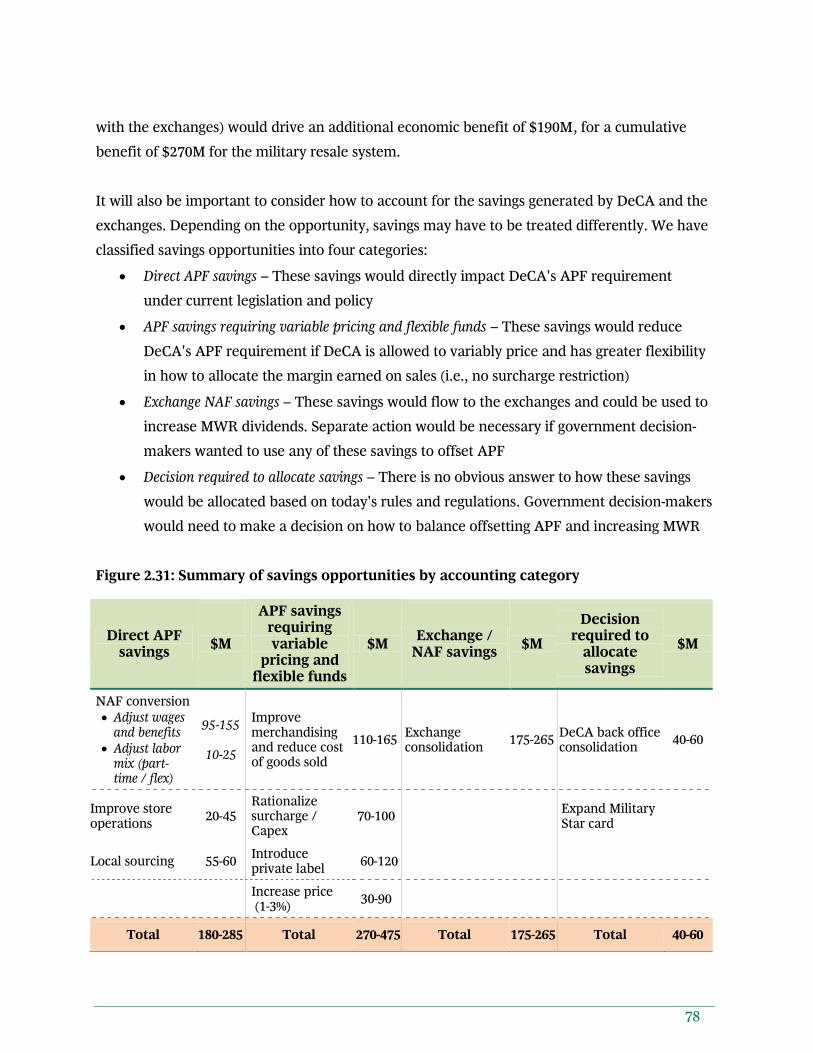
In total, we believe that consolidation among the exchanges could generate an additional $175-
265M in NAF savings annually beyond the DeCA specific win-win opportunities. Assuming
DeCA were to convert to NAF, consolidating DeCA's back-office functions and non-resale
procurement activities with the exchanges could generate another $40-60M in annual savings
(in addition to making DeCA's transition to NAF easier). As with the DeCA-specific
opportunities, there would be a transition period before savings could be realized. In addition,
government decision-makers would have a decision on whether to use savings to increase MWR
funding or to reduce APF needs (at the exchanges and DeCA). Consolidation will involve
complexity and there will be investment required to get it done, but we estimate the one-time
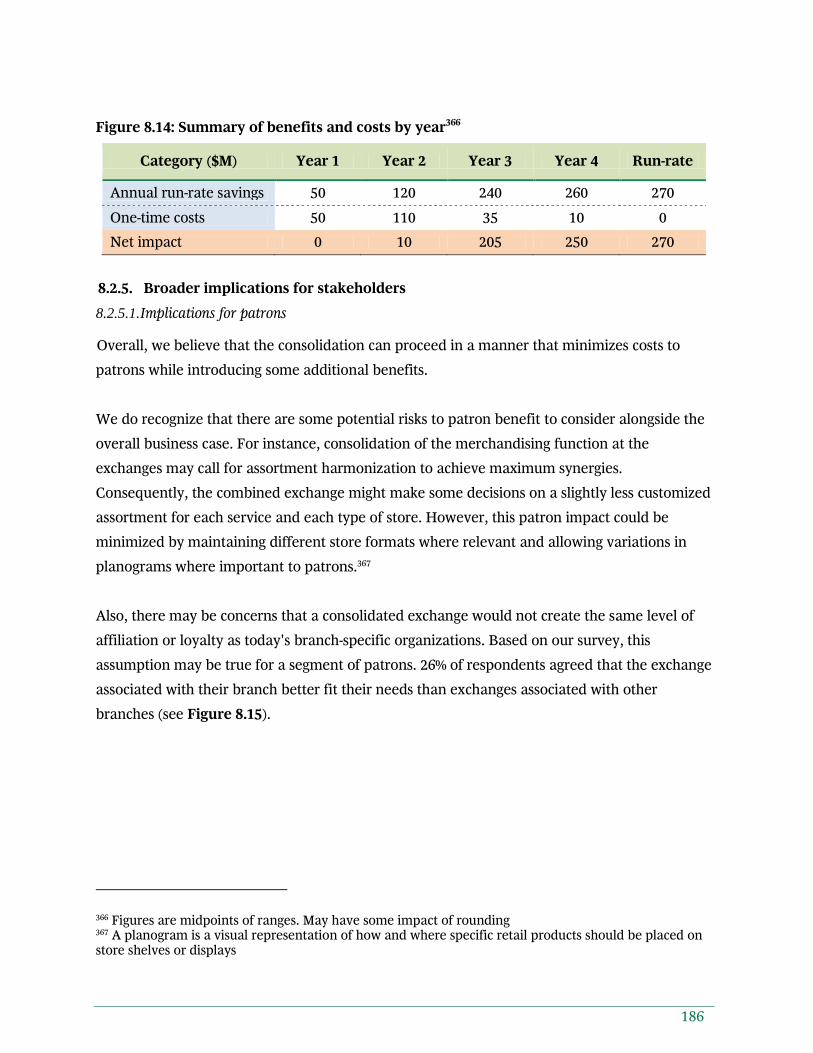
costs to be less than the annual run-rate savings.
1.6. The path forward
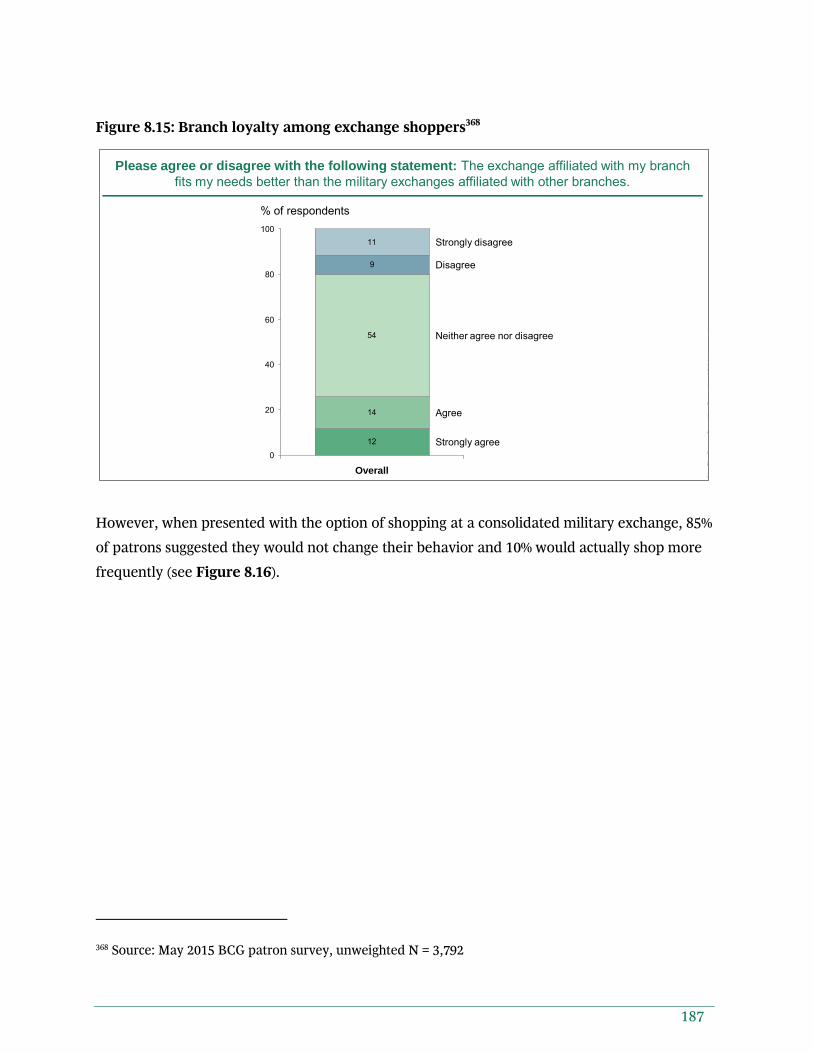
Both the DeCA-specific levers as well as consolidation are major opportunities that would
represent a significant amount of change for the military resale system. Therefore, phasing in a
practical way and dedicating time for planning will be important. To manage these changes,
DoD should establish an independent military resale governance board with clear
accountability. We recommend that the governance board be an independent entity within
14
DoD formed by merging the existing DeCA and exchange boards of directors. This could be
completed in steps to maintain alignment with the services and assure balanced representation
from each military branch. The governance board should select a single leader of the military
resale system responsible for overseeing the overall roadmap with a clear reporting line to
senior DoD leadership. As a first step, it is critical for the new leadership team to ensure that
DeCA and the exchanges make all ongoing business decisions in alignment with the overall
direction of the military resale system, and in particular avoid investments that would not
make sense in light of the changes suggested (e.g., back-office IT investments that are
incompatible with the other organizations and further limit shared service opportunities).
However, it is entirely possible (and likely) for DeCA and Exchange initiatives to move at
different speeds. Depending on legislation, we feel that DeCA can and should move as fast as
possible with their initiatives, while the consolidation topic may move slower due to the
complexity. Therefore, while the governance structure and approach described would lead to
greater coordination and a more organized roll-out, we do not believe it has to be in place for
progress to be made. Implementation of one set of initiatives should not be delayed because
others are not ready to move forward. For example, if given legislative authority, DeCA could
begin some of the highest opportunity initiatives immediately while DoD works to establish the
governance approach.
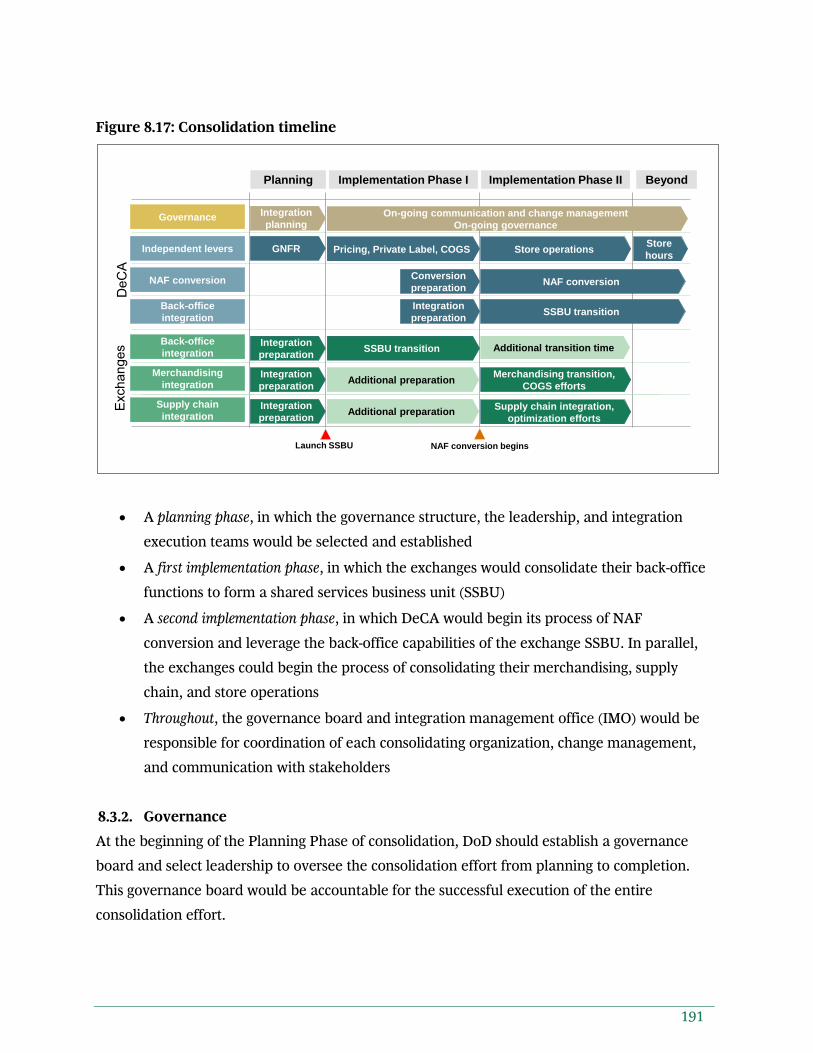
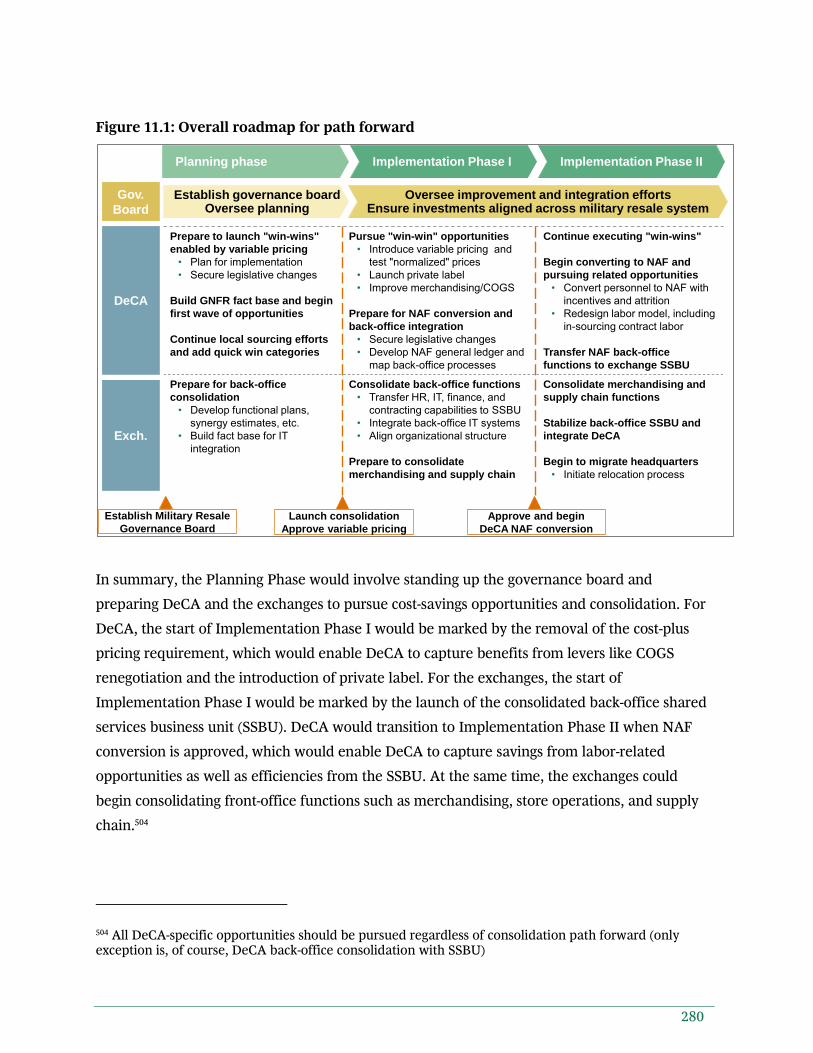
Assuming consolidation and DeCA initiatives do move forward, an initial planning phase would
be the first step. DeCA would need to create a detailed plan for each major initiative in the first
phase of implementation. The exchanges would also need to do the work to prepare for
consolidation, such as establishing a detailed baseline of costs and resources across the
organizations and setting savings targets for each function. Once planning is complete (likely a
six month process), DoD would be ready to move to implementation phases.
In the first phase of implementation, we suggest DeCA pursue some of the biggest win-win
opportunities, starting with the opportunities enabled by moving away from cost-plus pricing.
In parallel, we suggest the exchanges take a first step towards cost savings through
consolidation by merging back-office functions. To prepare for these changes, DeCA should
begin planning how to test and implement variable pricing, build capabilities to introduce
private label, and launch the analytical assessment needed for merchandising improvements
15
and negotiations on cost of goods sold (COGS). Similarly, the exchanges should start planning
for back-office consolidation, including IT integration and organization design.
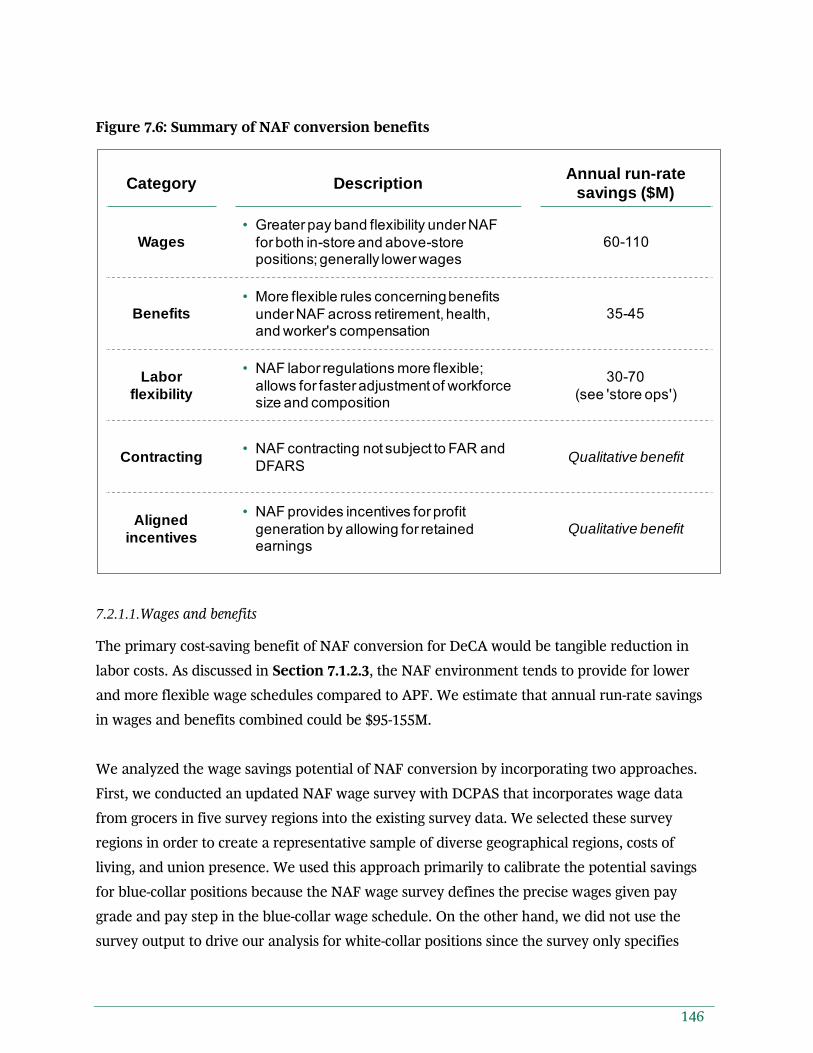
In Implementation Phase II, DeCA should convert to NAF and realize savings from labor-
related opportunities. At the same time, the exchanges could begin to service DeCA's NAF
back-office functions while beginning to merge commercial activities such as merchandising
and supply chain. It is important to note that DeCA will likely still require some level of
appropriated funding in the long term even if all of these opportunities are pursued.
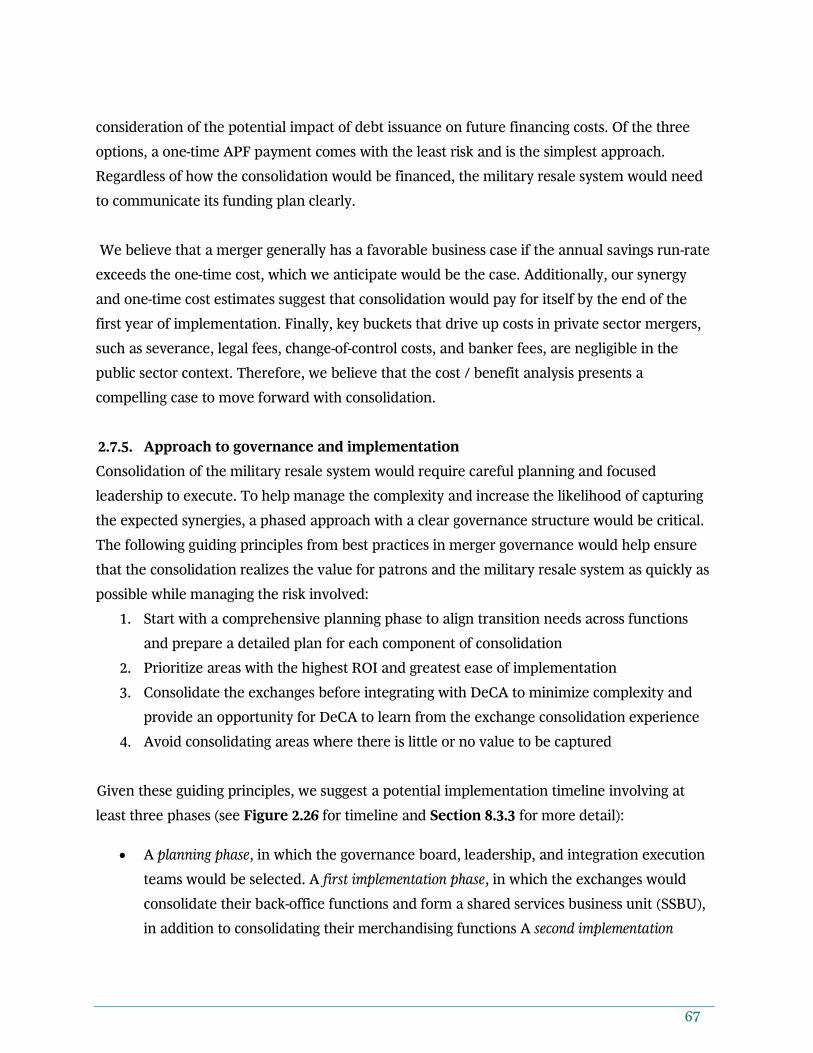
While the reforms we suggest above will take time and involve complexity,11 we believe there is
significant benefit to be gained in cost savings and enhanced patron benefit. Ultimately, the
military resale system will be more competitive, require less APF funding, and be well-
positioned to provide a broad set of benefits to patrons over the long term.
11 While it would be tough to predict the length of these phases, we expect each phase would likely last one to three years
16
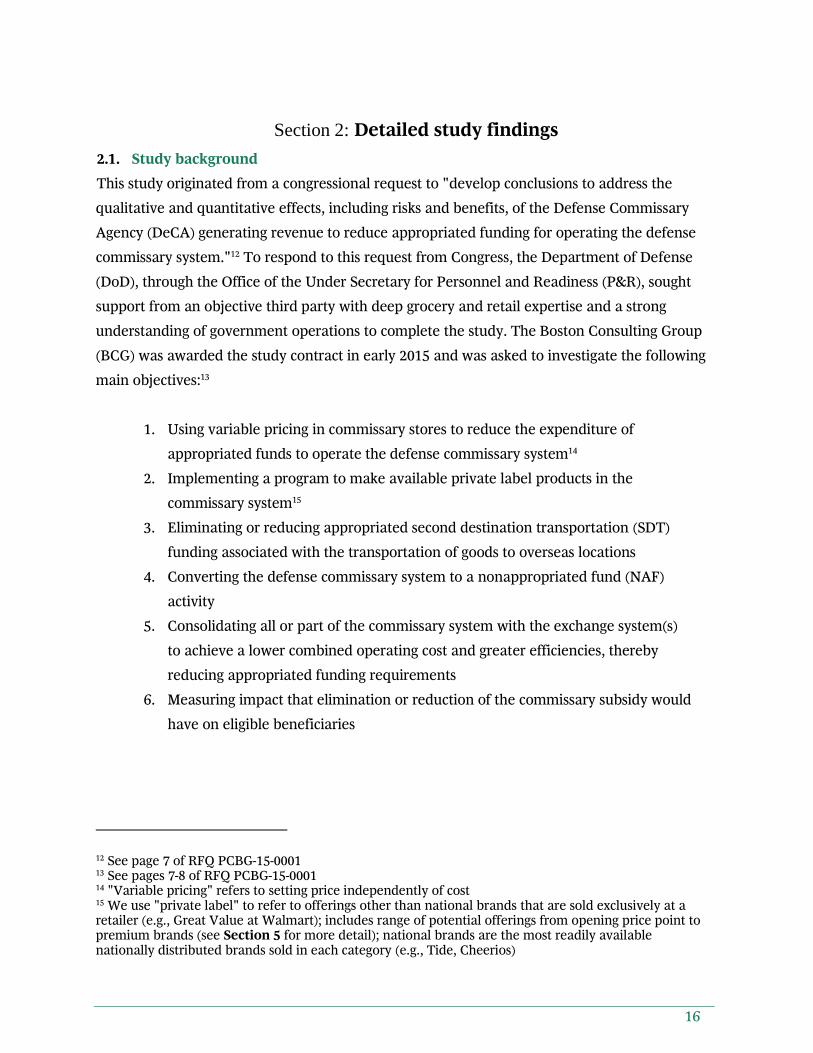
Section 2: Detailed study findings
2.1. Study background
This study originated from a congressional request to "develop conclusions to address the
qualitative and quantitative effects, including risks and benefits, of the Defense Commissary
Agency (DeCA) generating revenue to reduce appropriated funding for operating the defense
commissary system."12 To respond to this request from Congress, the Department of Defense
(DoD), through the Office of the Under Secretary for Personnel and Readiness (P&R), sought
support from an objective third party with deep grocery and retail expertise and a strong
understanding of government operations to complete the study. The Boston Consulting Group
(BCG) was awarded the study contract in early 2015 and was asked to investigate the following
main objectives:13
1. Using variable pricing in commissary stores to reduce the expenditure of
appropriated funds to operate the defense commissary system14
2. Implementing a program to make available private label products in the
commissary system15
3. Eliminating or reducing appropriated second destination transportation (SDT)
funding associated with the transportation of goods to overseas locations
4. Converting the defense commissary system to a nonappropriated fund (NAF)
activity
5. Consolidating all or part of the commissary system with the exchange system(s)
to achieve a lower combined operating cost and greater efficiencies, thereby
reducing appropriated funding requirements
6. Measuring impact that elimination or reduction of the commissary subsidy would
have on eligible beneficiaries
12 See page 7 of RFQ PCBG-15-0001 13 See pages 7-8 of RFQ PCBG-15-0001 14 "Variable pricing" refers to setting price independently of cost 15 We use "private label" to refer to offerings other than national brands that are sold exclusively at a retailer (e.g., Great Value at Walmart); includes range of potential offerings from opening price point to premium brands (see Section 5 for more detail); national brands are the most readily available nationally distributed brands sold in each category (e.g., Tide, Cheerios)
17
For this study, we applied a customized mix of BCG's proven methodologies to understand the
needs of patrons, evaluate performance of DeCA's operations, and assess the impact of
potential changes to the military resale system. Our approach blended quantitative and
qualitative research methods to collect and synthesize data and insights into an objective set of
recommendations incorporating DeCA's mission, capabilities, and constraints.
Highlights of the activities completed to support this study include:
Interviewed over 100 stakeholders across DeCA, exchanges, and other DoD groups
Engaged over 20 senior BCG experts with 200+ combined years' experience in the public
sector, retail, consumer goods, and large-scale transformations
Collected and analyzed extensive operating and organizational data from DeCA and the
Conducted market basket study to capture competitive price data for representative set
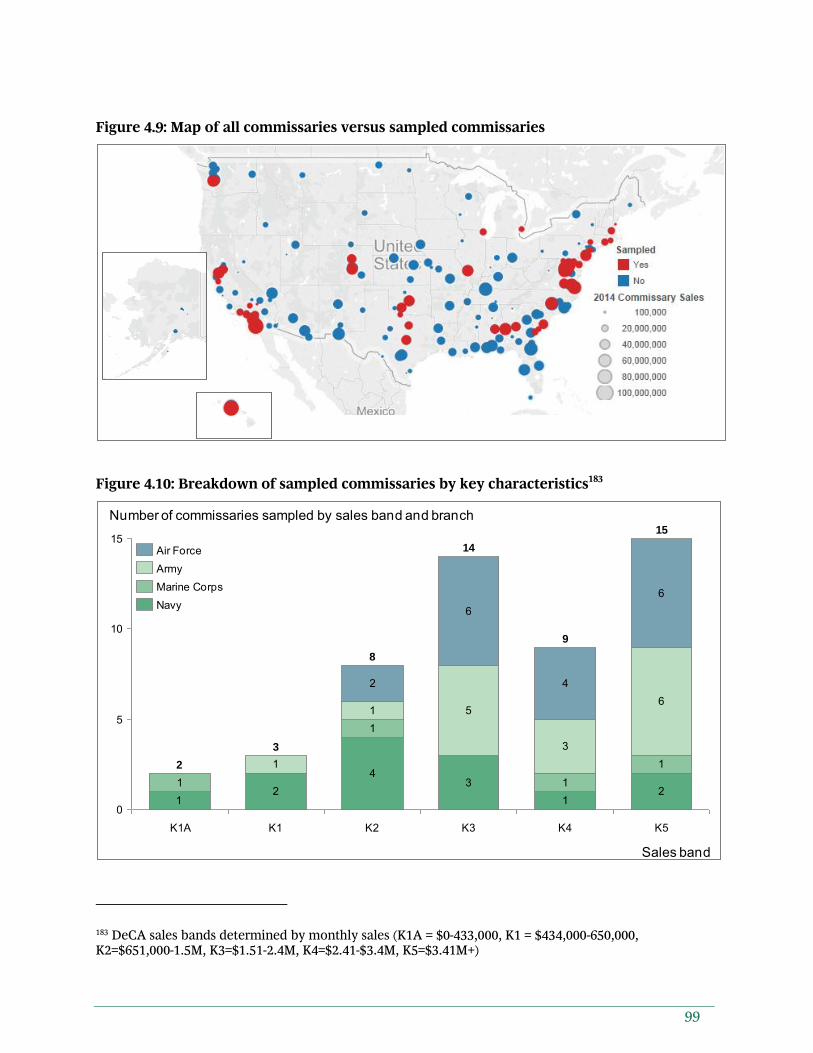
of 50 items (branded and private label) from 51 U.S. markets
Surveyed roughly 14,500 eligible patrons to get feedback on each study objective
Visited 13 commissaries, six exchanges, and a ship store across several regions to
understand store operations and the typical patron shopping experience
Reviewed findings and recommendations from more than 20 previous studies
Benchmarked DeCA and military exchange metrics against BCG's extensive database of
comparable retail and other private sector organizations16
2.2. Our approach
To frame our overall analysis, we examined DeCA's business model and evaluated the current
level of patron benefit. We then addressed each of the study objectives to provide an
understanding of the current situation, assessment of potential opportunities, and
recommendation of a path forward. We also broadly considered whether consolidation in some
form is the right path to meet the study objectives.
In addition to addressing the study objectives, we evaluated DeCA's business model to identify
other opportunities to reduce the need for APF. Some of these opportunities are "win-win"
initiatives that would both improve the benefit to patrons and reduce the APF needed. Other
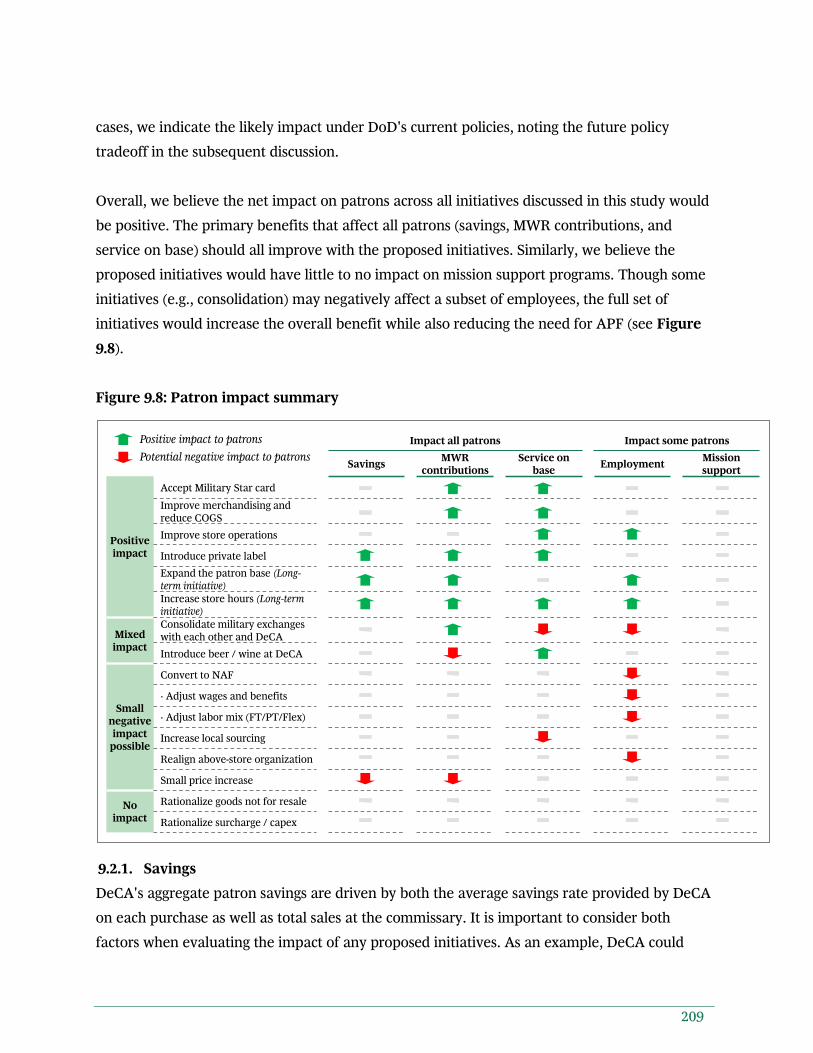
actions would likely reduce APF but might have negative repercussions for patrons. For these 16 All benchmarks have been aggregated and anonymized to protect client confidentiality
18
actions, we have laid out the trade-offs so that government decision-makers can make the best-
informed decision.
This section on detailed findings is structured as follows:
DeCA's current business model and patron benefit
Summary of key opportunities for the military resale system ("win-wins" and others that
may require trade-offs)
Consolidation options and assessment
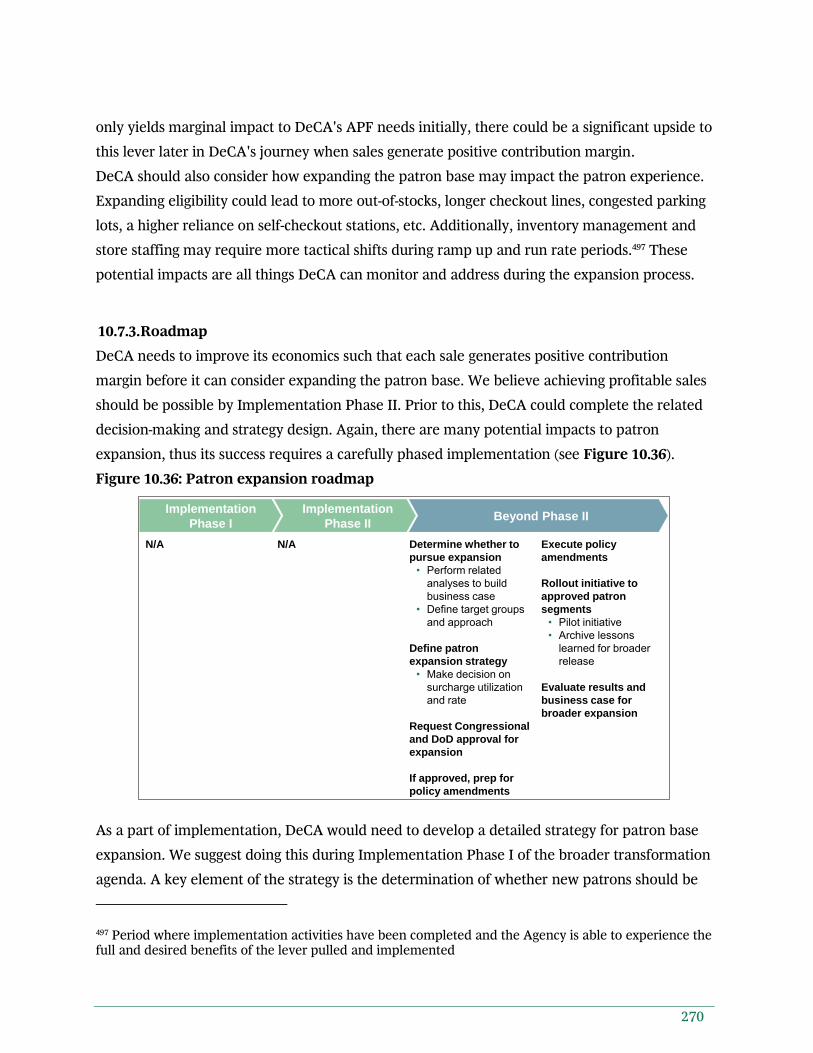
Roadmap to move forward
2.3. DeCA business model and patron benefit
DeCA is an organization within DoD with the primary mission to "deliver a vital benefit of the
military pay system that sells grocery items at cost while enhancing quality of life and
readiness."17
To deliver this benefit, DeCA operates 241 commissaries worldwide (169 in CONUS and 72
OCONUS) and a total budget of $7.3B.18 Goods are priced at cost and DeCA collects a 5%
surcharge at checkout (which funds facilities improvement, store equipment, store
maintenance, and information technology investments). In FY14, DeCA sold $5.6B of goods and
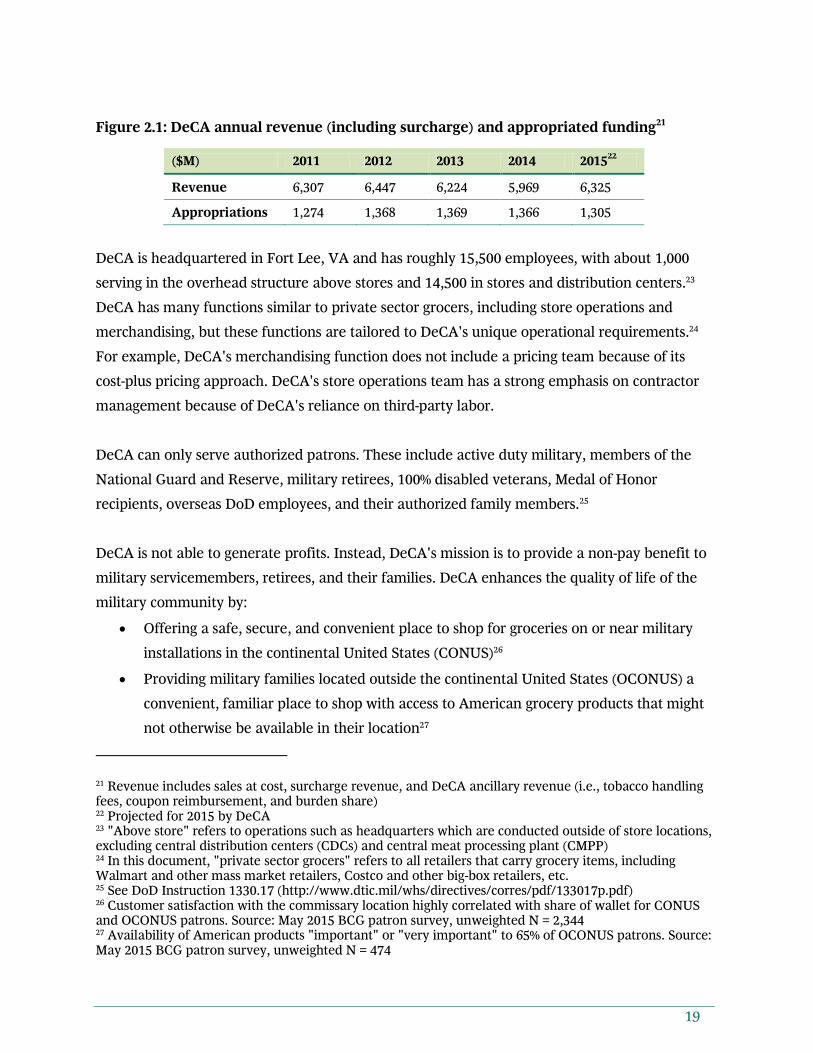
collected $287M in surcharge.19 In order to fund the difference between revenue and operating
costs, DeCA receives annual appropriated funding of approximately $1.4B (see Figure 2.1).20
17 See Section 2481(b), 10 U.S.C., DoDI 1330.17 and DeCA Strategic Plan (http://www.commissaries.com/documents/insidedeca/strat_plan.pdf) 18 Includes $5.6B in cost of goods sold, $1.4B in operating expense, and $0.3B in capital expenditures (funded by the surcharge) 19 Source: DeCA 2014 annual report 20 DeCA's appropriated funds cover operating expenses such as the wages and benefits of DeCA employees, the cost of shipping American goods to overseas locations, and other operating expenses such as utilities, contractors, and supplies
19
Figure 2.1: DeCA annual revenue (including surcharge) and appropriated funding21
($M) 2011 2012 2013 2014 201522
Revenue 6,307 6,447 6,224 5,969 6,325
Appropriations 1,274 1,368 1,369 1,366 1,305
DeCA is headquartered in Fort Lee, VA and has roughly 15,500 employees, with about 1,000
serving in the overhead structure above stores and 14,500 in stores and distribution centers.23
DeCA has many functions similar to private sector grocers, including store operations and
merchandising, but these functions are tailored to DeCA's unique operational requirements.24
For example, DeCA's merchandising function does not include a pricing team because of its
cost-plus pricing approach. DeCA's store operations team has a strong emphasis on contractor
management because of DeCA's reliance on third-party labor.
DeCA can only serve authorized patrons. These include active duty military, members of the
National Guard and Reserve, military retirees, 100% disabled veterans, Medal of Honor
recipients, overseas DoD employees, and their authorized family members.25
DeCA is not able to generate profits. Instead, DeCA's mission is to provide a non-pay benefit to
military servicemembers, retirees, and their families. DeCA enhances the quality of life of the
military community by:
Offering a safe, secure, and convenient place to shop for groceries on or near military
installations in the continental United States (CONUS)26
Providing military families located outside the continental United States (OCONUS) a
convenient, familiar place to shop with access to American grocery products that might
not otherwise be available in their location27
21 Revenue includes sales at cost, surcharge revenue, and DeCA ancillary revenue (i.e., tobacco handling fees, coupon reimbursement, and burden share) 22 Projected for 2015 by DeCA 23 "Above store" refers to operations such as headquarters which are conducted outside of store locations, excluding central distribution centers (CDCs) and central meat processing plant (CMPP) 24 In this document, "private sector grocers" refers to all retailers that carry grocery items, including Walmart and other mass market retailers, Costco and other big-box retailers, etc. 25 See DoD Instruction 1330.17 (http://www.dtic.mil/whs/directives/corres/pdf/133017p.pdf) 26 Customer satisfaction with the commissary location highly correlated with share of wallet for CONUS and OCONUS patrons. Source: May 2015 BCG patron survey, unweighted N = 2,344 27 Availability of American products "important" or "very important" to 65% of OCONUS patrons. Source: May 2015 BCG patron survey, unweighted N = 474
20
Employing a large proportion of veterans, military spouses, and dependents,28 and
Selling groceries to patrons at a discount relative to the private sector (required to
provide an overall discount of 30%)29
DeCA's mission to provide a benefit rather than pursue profits drives a few key differences
relative to private sector grocers. For example, because commissaries are on military
installations, locations are often geographically dispersed with limited local scale.30 Some of
these commissaries are in remote and isolated locations that are costly to operate but remain
open to provide a benefit to servicemembers with few or no other grocery options. Conversely,
private sector grocers generally seek a dense store footprint to achieve local scale and would
likely close small, remote locations if there was not sufficient profit to justify their operation.
Additionally, most American private sector grocers do not operate OCONUS,31 while DeCA has
72 OCONUS locations.
Another major difference between DeCA and private sector grocers is that DeCA is only
authorized to carry items in select categories per Section 2484(c), Title 10 U.S.C. and DoD
Instruction 1330.17. The primary categories that DeCA is restricted from selling include non-
food (aside from household supplies and pet food) and alcoholic beverages. Both are categories
which private sector grocers will typically offer and use strategically to drive customer traffic
and profit. These are also primary categories sold by the military exchanges.
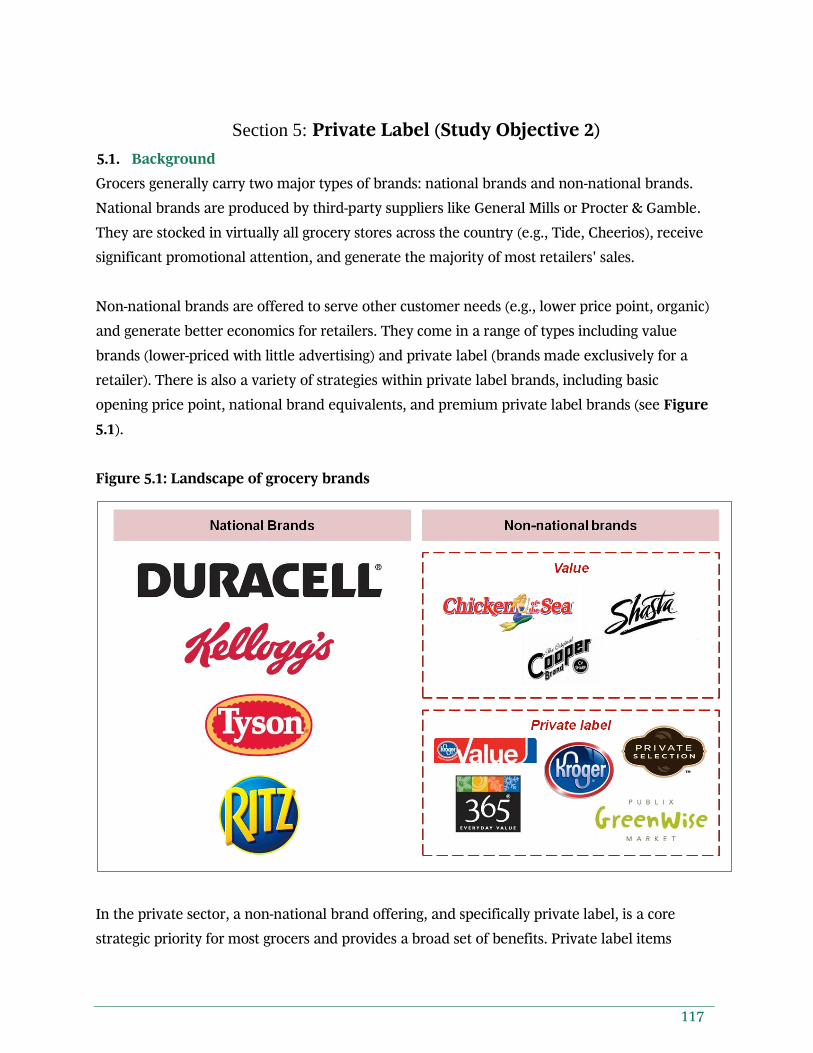
Grocers generally carry two major types of brands: national brand and non-national brand.
National brands are produced by third-party suppliers like General Mills or Procter & Gamble,
are stocked in virtually all grocery stores across the country, and receive significant
promotional and advertising attention (e.g., Tide, Cheerios). Non-national brands come in a
range of types, including value brands (lower-priced with little advertising) and private label
(brands made exclusively for a retailer). There is also variety within private label brands,
28 Roughly 60% of DeCA's employees are military spouses, family members, retirees, Guardsmen, Reservists, or veterans. Source: The Military Resale and MWR Center for Research 29 DeCA is required by DoDI 1330.17 to meet an annual savings rate proposed by its Board of Directors, which was most recently agreed upon at 30% 30 "Local scale" refers to the size/number of operations within an area. In the private sector, most grocers aim to achieve local scale to maximize sales and drive down operating costs (e.g., supply chain), resulting in many regional grocery chains (e.g., Publix, H-E-B) 31 Some private sector grocers have locations in Alaska and Hawaii (e.g., Walmart and Safeway), but very few have locations outside of the U.S.
21
including basic opening price point, national brand equivalents, and premium private label
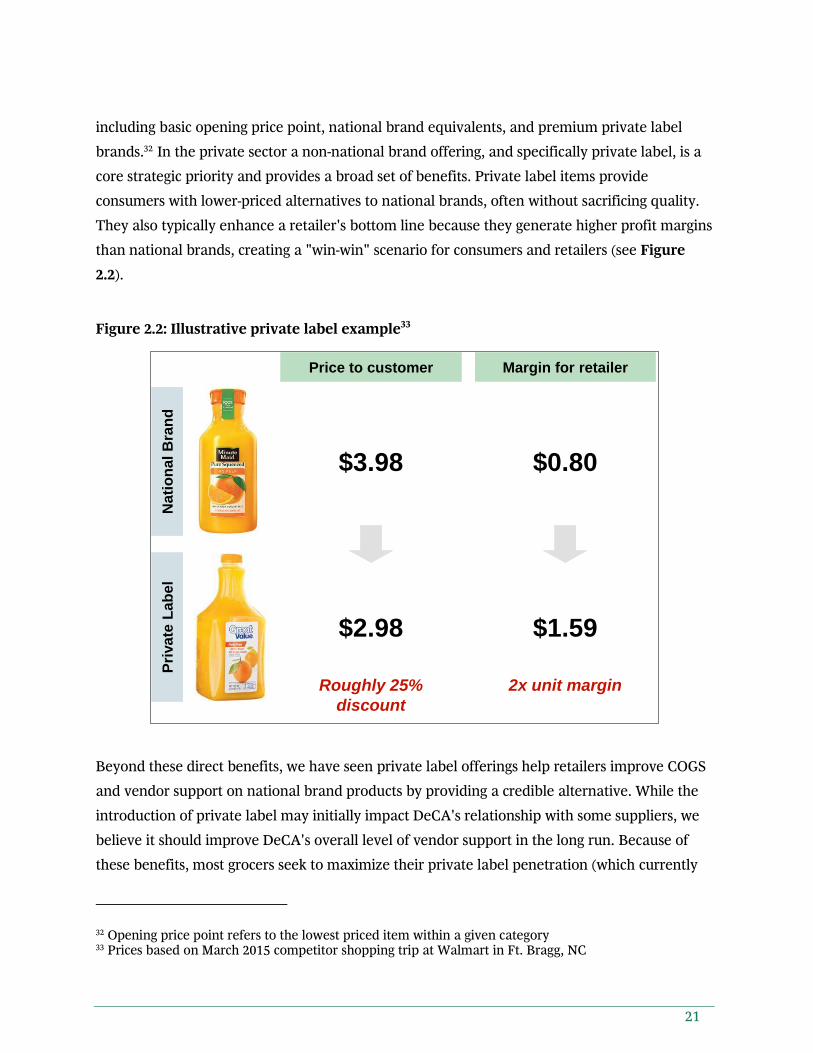
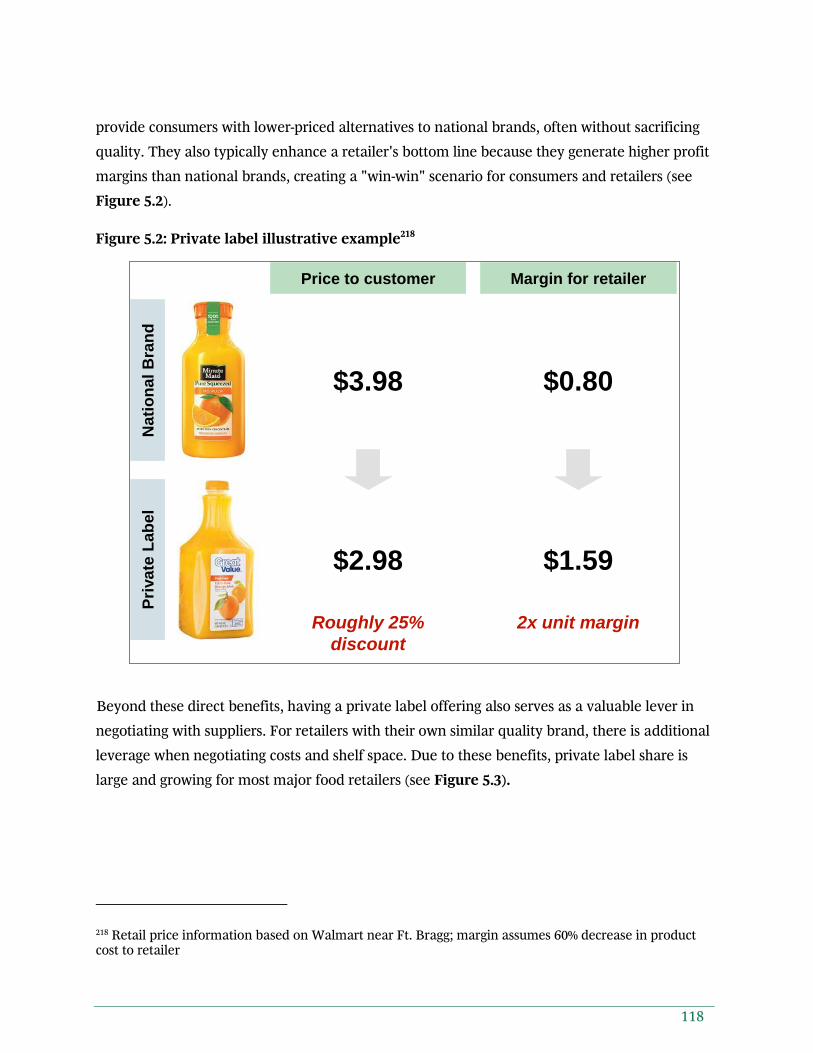
brands.32 In the private sector a non-national brand offering, and specifically private label, is a
core strategic priority and provides a broad set of benefits. Private label items provide
consumers with lower-priced alternatives to national brands, often without sacrificing quality.
They also typically enhance a retailer's bottom line because they generate higher profit margins
than national brands, creating a "win-win" scenario for consumers and retailers (see Figure
2.2).
Figure 2.2: Illustrative private label example33
Beyond these direct benefits, we have seen private label offerings help retailers improve COGS
and vendor support on national brand products by providing a credible alternative. While the
introduction of private label may initially impact DeCA's relationship with some suppliers, we
believe it should improve DeCA's overall level of vendor support in the long run. Because of
these benefits, most grocers seek to maximize their private label penetration (which currently
32 Opening price point refers to the lowest priced item within a given category 33 Prices based on March 2015 competitor shopping trip at Walmart in Ft. Bragg, NC
Price to customer
$3.98
$2.98
Roughly 25%
discount
Margin for retailer
$0.80
$1.59
2x unit margin
Nati
on
al
Bra
nd
Pri
vate
Lab
el
22
averages roughly 19% of sales). DeCA currently offers a very limited set of "value brand" items
which make up only 4% of sales. DeCA's "value brands" are typically lesser-known brands and
often have the lowest price point in their category, rather than a true private label offering.
Pricing at DeCA is also different than in the private sector. In the private sector, grocers
generally set prices based on various factors including consumer willingness to pay, competitive
intensity, and category roles.34 DeCA, however, is required to set prices using a "cost-plus"
approach. Cost-plus means that the price on the shelf to patrons is the cost from the supplier
plus a 5% surcharge.35 The cost from the supplier is agreed upon per DeCA's resale ordering
agreement (ROA), which stipulates that the average annual price of an item must be equal to
or lower than similar supermarkets' price (referred to as "best bucket" pricing). Suppliers (e.g.,
manufacturers and brokers) also provide some forms of "vendor funding", which is used to
fund promotional pricing to patrons.
For the majority of items with a standard barcode, DeCA sets prices at a national level.36 This
means that a box of Cheerios, for example, would cost the same in an urban area with a high
cost of living (e.g., Fort Belvoir in Washington, D.C.) as it would in a rural location with a lower
cost of living (e.g., Fort Benning near Columbus, GA). For items sourced regionally including
produce, meat, and some dairy items, DeCA sets prices at a regional level. The 5% surcharge is
added to the cost of each item at checkout. DeCA is not permitted to generate a margin beyond
the 5% surcharge, vary pricing by category to reflect competitive dynamics, or vary pricing
regionally to reflect differences in cost of living.37 In addition, the 5% surcharge does not cover
DeCA's cost of store labor or other operating expenses. As a result, DeCA loses money on each
item sold and requires appropriated funds to make up the difference.
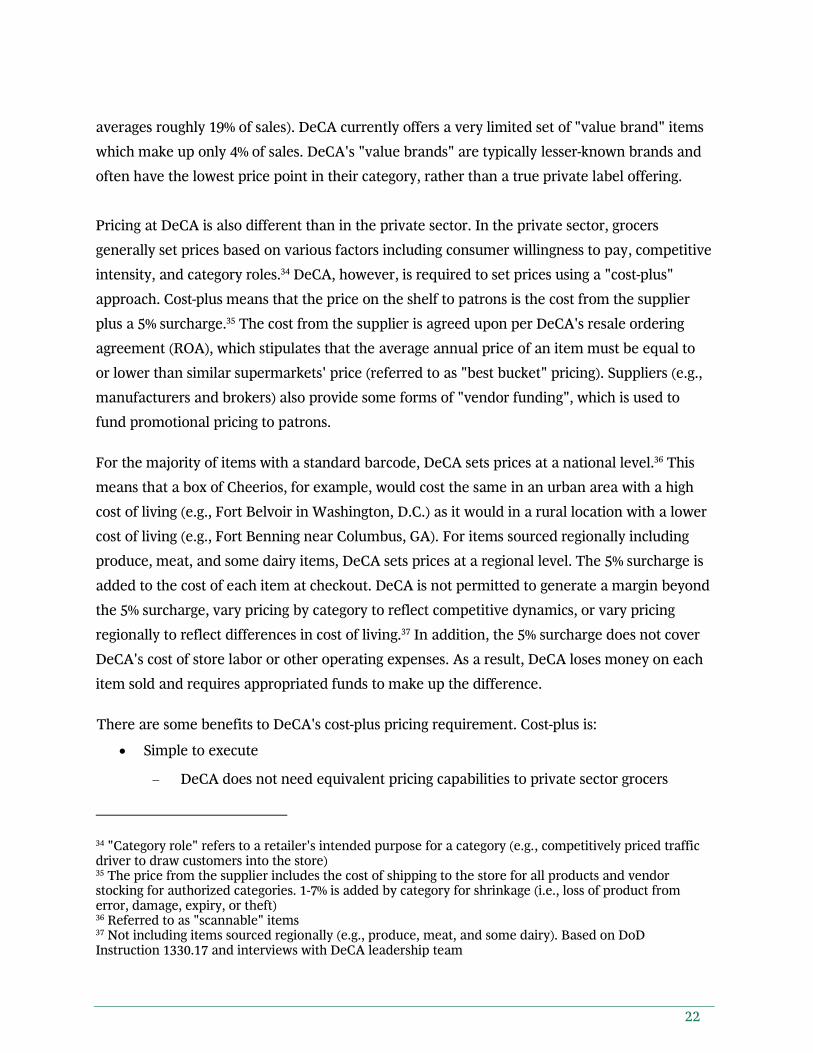
There are some benefits to DeCA's cost-plus pricing requirement. Cost-plus is:
Simple to execute
DeCA does not need equivalent pricing capabilities to private sector grocers
34 "Category role" refers to a retailer's intended purpose for a category (e.g., competitively priced traffic driver to draw customers into the store) 35 The price from the supplier includes the cost of shipping to the store for all products and vendor stocking for authorized categories. 1-7% is added by category for shrinkage (i.e., loss of product from error, damage, expiry, or theft) 36 Referred to as "scannable" items 37 Not including items sourced regionally (e.g., produce, meat, and some dairy). Based on DoD Instruction 1330.17 and interviews with DeCA leadership team
23
DeCA does not need competitive intelligence on market prices and elasticity38
DeCA can update prices significantly less frequently than private sector grocers39
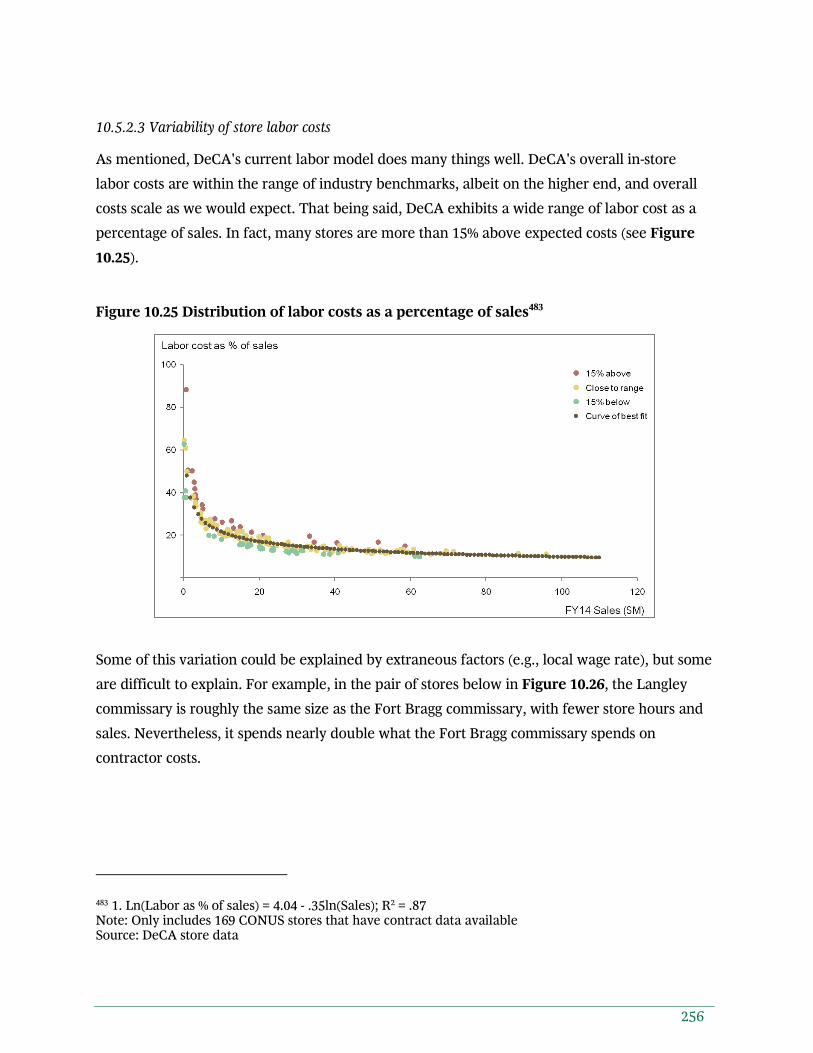
A way to ensure savings for patrons, which our market basket analysis revealed
currently range from 5–30% by category and by region (see Figure 2.6 and Figure 2.8)
However, the cost-plus requirement has a number of drawbacks. It also:
Prevents DeCA from capturing any margin beyond 5% surcharge, resulting in a net loss
on each transaction (see Figure 2.3)
As a result, DeCA operates in an environment in which higher sales create the
need for additional APF
Hinders DeCA from benefitting from many forms of cost reduction
For example, driving down product costs would positively impact patrons but
DeCA would realize no financial benefit – in fact, lower costs would further
reduce the surcharge collected and likely increase the need for APF
Inhibits DeCA from pricing relative to competition, patron shopping behavior, or
category role
38 DeCA does collect competitive intelligence for annual savings estimate calculation 39 In our experience with 60 grocery retailers in the last five years, private sector grocers may change prices multiple times per week and differentially across zones, while DeCA generally updates on the 1st and 16th day of each month across all CONUS stores
24
Figure 2.3: Approximate variable cost (as a percentage of sales) versus FY14 sales40
Another element that sets DeCA apart from the private sector is its use of third-party labor.
DeCA relies on third-party contractors and vendors to perform a variety of activities
traditionally done by employees, largely due to the labor limitations imposed on APF entities.41
In CONUS, DeCA does not manage its own supply chain and relies on third-party distributors
contracted by suppliers to arrange the logistics to deliver product to each location. In categories
where authorized (e.g., frozen vegetables), manufacturers hire "vendor stockers" to stock the
product on the shelves. The costs for supply chain and vendor stocking are generally included
in DeCA's COGS. In the remaining categories, DeCA hires contractors to stock shelves. Only in
select categories and stores, or when third parties fail to complete the task, do DeCA employees
stock shelves. Similarly, the deli / bakery, seafood, and sushi departments are operated entirely
by third-party contractors in most CONUS locations. In general, DeCA employees are
40 DeCA FY 2014 store data; Approximate variable cost based on DeCA's store-level operating expenses paid out of the Defense Working Capital Fund, predominantly comprised of DeCA store labor and contractors; Includes only CONUS stores (169 of DeCA's 241 stores) 41 For example, DeCA has less flexibility to alter weekly hours for part-time workers to meet demand compared to private sector grocers
0
20
40
60
80
100
100806040200
Approximate variable cost (as a % of sales)
FY14 Sales ($M)
Ft. Belvoir
10%
Even DeCA's highest sales stores do not cover costs, suggesting
stores lose money on each
additional sale
25
responsible for administrative activities, overseeing contractors, cutting and preparing meat,
and operating and managing checkout. This approach is different OCONUS where DeCA is
responsible for most in-store labor and uses a workforce made up of a mix of American
employees as well as local national employees.
The result is that the operations of a DeCA store involve much more complex coordination
among various parties than in private sector grocery stores. It is also difficult for DeCA to hold
the third parties accountable for gaps in their performance.42 This can create a number of
challenges in execution. For instance, out-of-stocks are a common problem in some
commissaries and occur at a level that exceeds nearby private sector competitors.43 While a
small percentage of the out-of-stocks stem from unanticipated spikes in patron demand, a much
greater proportion is typically caused by a lack of supplier, contractor, and vendor stocker
effectiveness.44 These out-of-stocks can leave patrons with a negative impression of store service
levels and lead to lost sales both during the immediate visit (through purchasing fewer or no
products) as well as down the line (by shopping the commissary less frequently). Another
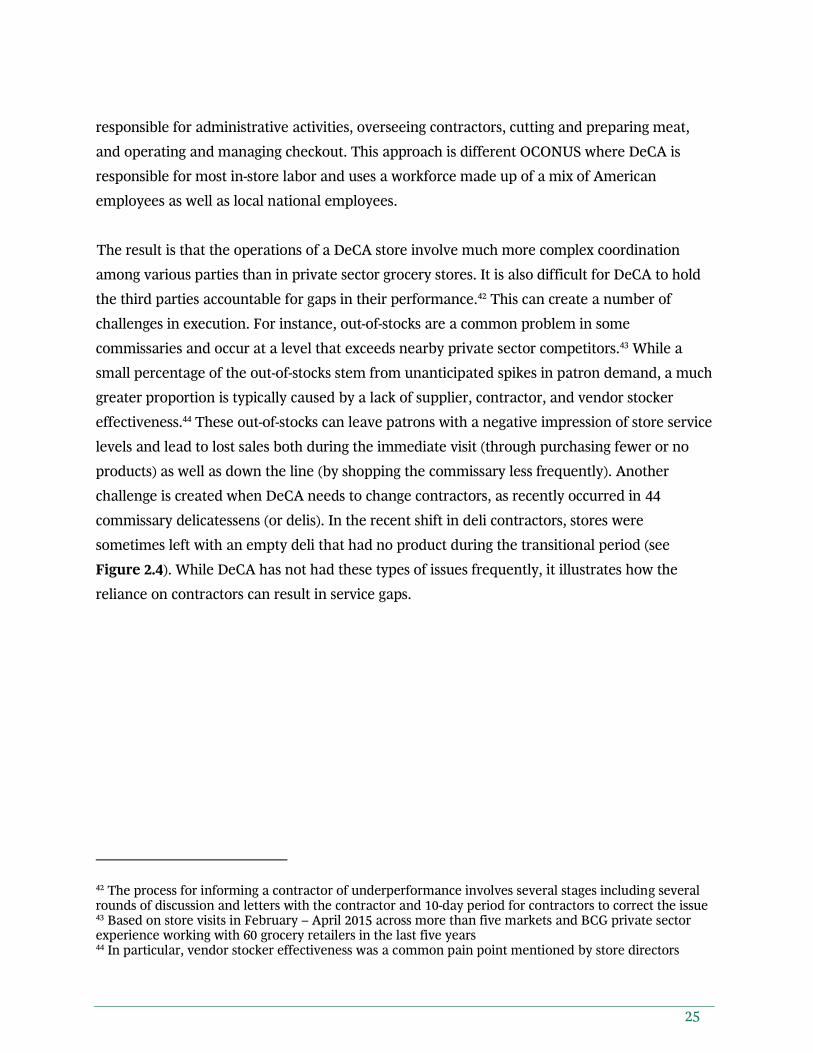
challenge is created when DeCA needs to change contractors, as recently occurred in 44
commissary delicatessens (or delis). In the recent shift in deli contractors, stores were
sometimes left with an empty deli that had no product during the transitional period (see
Figure 2.4). While DeCA has not had these types of issues frequently, it illustrates how the
reliance on contractors can result in service gaps.
42 The process for informing a contractor of underperformance involves several stages including several rounds of discussion and letters with the contractor and 10-day period for contractors to correct the issue 43 Based on store visits in February – April 2015 across more than five markets and BCG private sector experience working with 60 grocery retailers in the last five years 44 In particular, vendor stocker effectiveness was a common pain point mentioned by store directors
26
Figure 2.4: Deli / bakery at Maxwell AFB Commissary45
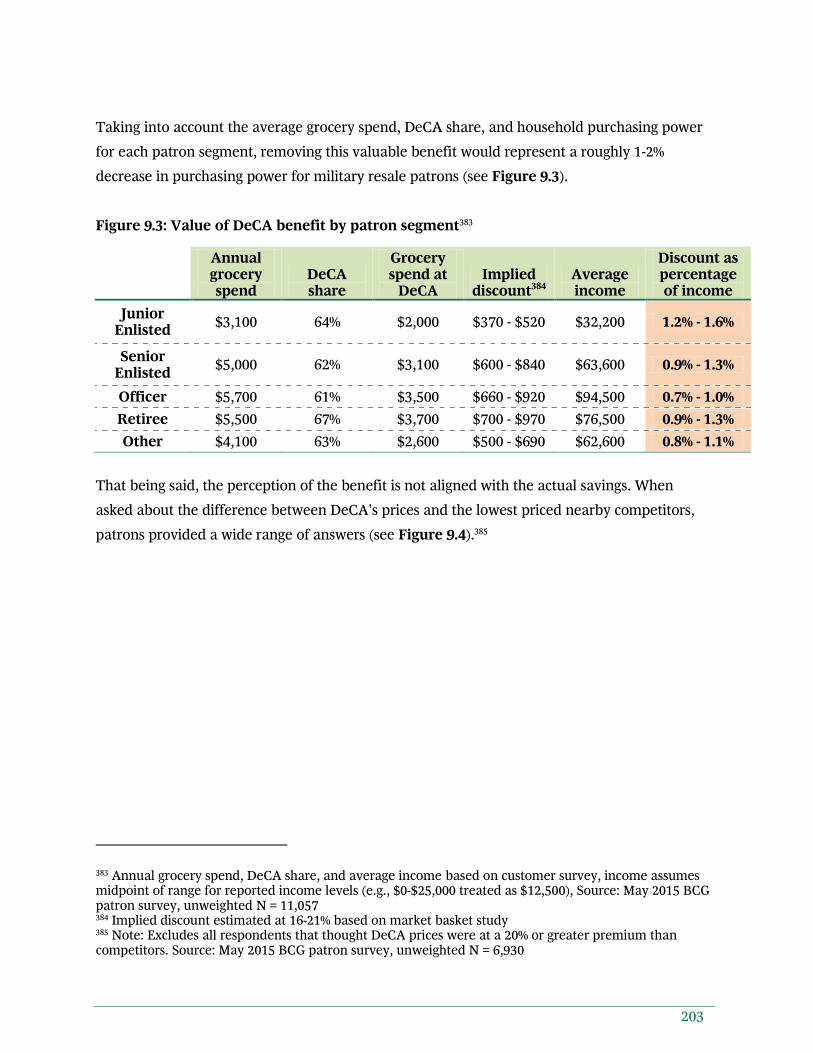
The cost savings DeCA provides are a key driver of patron usage of the commissary and
perception of the benefit.46 Therefore, it is important to evaluate patrons' current savings levels
to understand the value of the benefit. DeCA currently communicates a 30% worldwide
average discount primarily based on a comparison of DeCA's prices for all scannable items (i.e.,
items with a standard barcode) with average national prices at a wide set of competitors.47 This
savings calculation methodology has some advantages. For instance, it is able to include a very
large number of items and uses average prices over a 26-week period. However, it also has
some disadvantages. One key disadvantage is that it does not compare prices on a local level,
and therefore does not compare prices versus specific stores near each commissary.
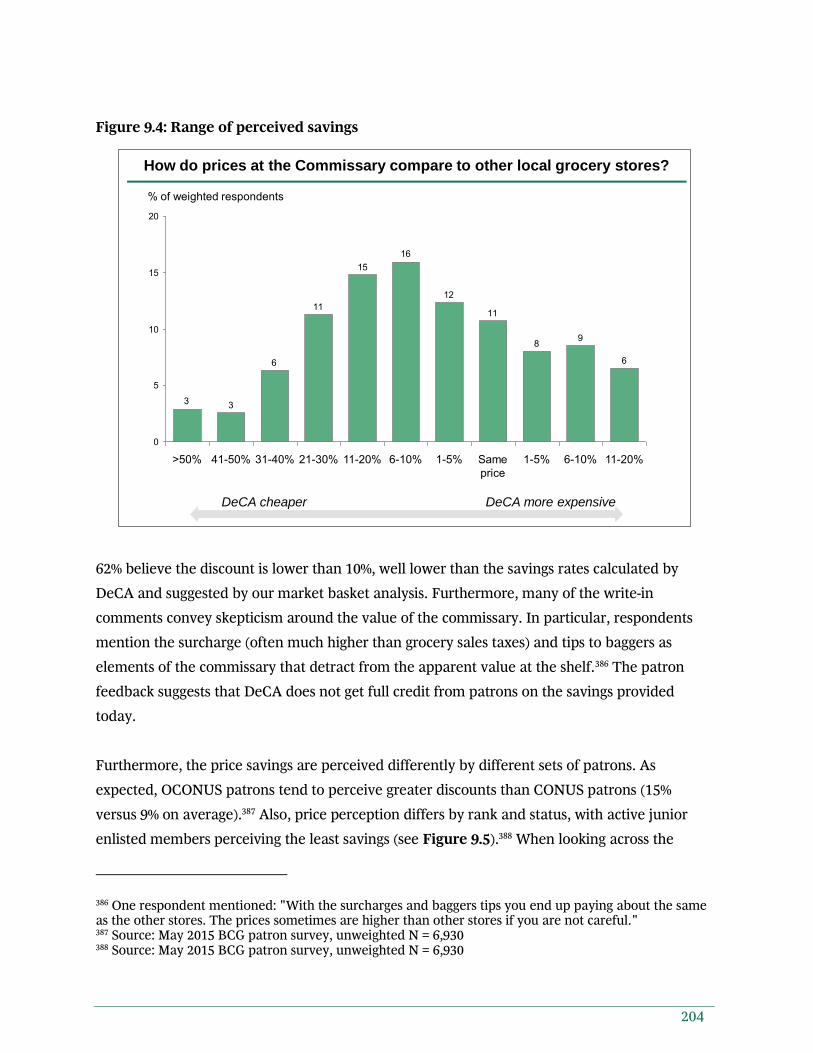
To attempt to better reflect patrons' shopping experiences at the local level, we conducted a
market basket analysis to gather prices of 50 key items (including their private label
45 Store visit in April 2015 46 More than 50% of patrons rated "Value for the money" or "Low prices" as their most important reason for shopping at the commissary. Source: May 2015 BCG patron survey, unweighted N = 6,584 47 For scannable items, DeCA's methodology compares DeCA's prices to national average prices of identical UPCs at all stores in Nielsen's All Outlets Combined database; DeCA fills in data for non-scannable items with physical audits at select stores and OCONUS. DeCA is required by DoDI 1330.17 to meet an annual savings rate proposed by its Board of Directors, which was most recently agreed upon at 30%
27
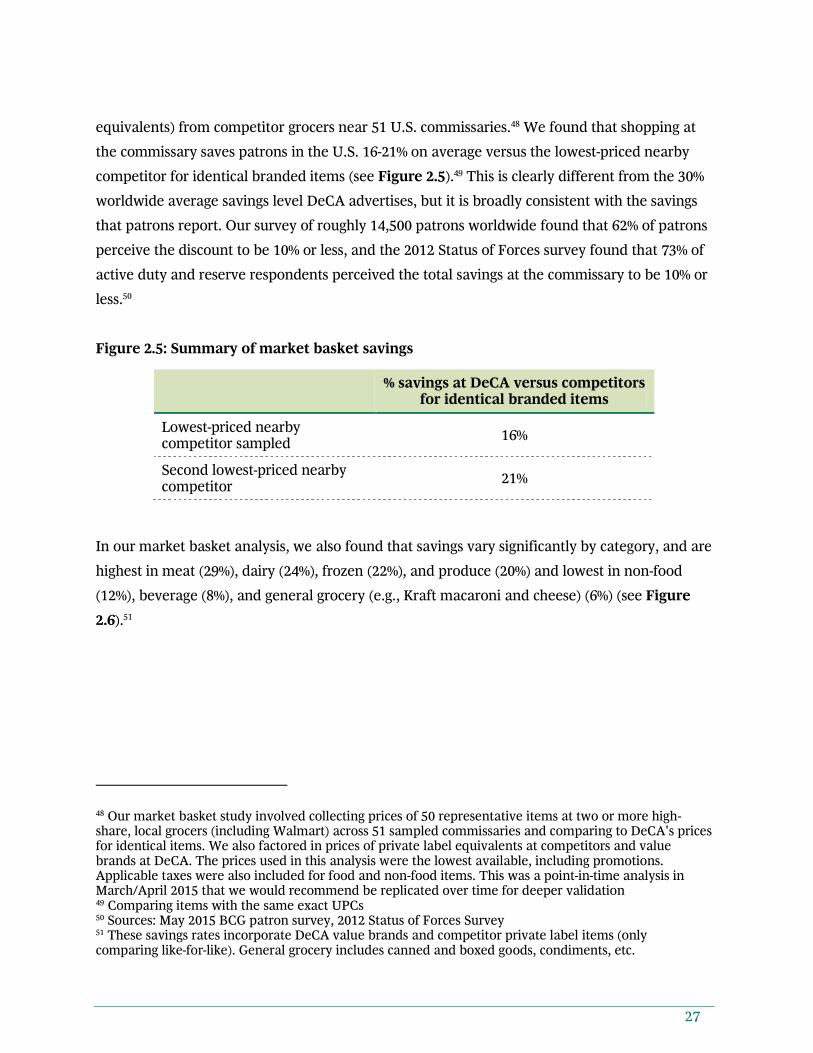
equivalents) from competitor grocers near 51 U.S. commissaries.48 We found that shopping at
the commissary saves patrons in the U.S. 16-21% on average versus the lowest-priced nearby
competitor for identical branded items (see Figure 2.5).49 This is clearly different from the 30%
worldwide average savings level DeCA advertises, but it is broadly consistent with the savings
that patrons report. Our survey of roughly 14,500 patrons worldwide found that 62% of patrons
perceive the discount to be 10% or less, and the 2012 Status of Forces survey found that 73% of
active duty and reserve respondents perceived the total savings at the commissary to be 10% or
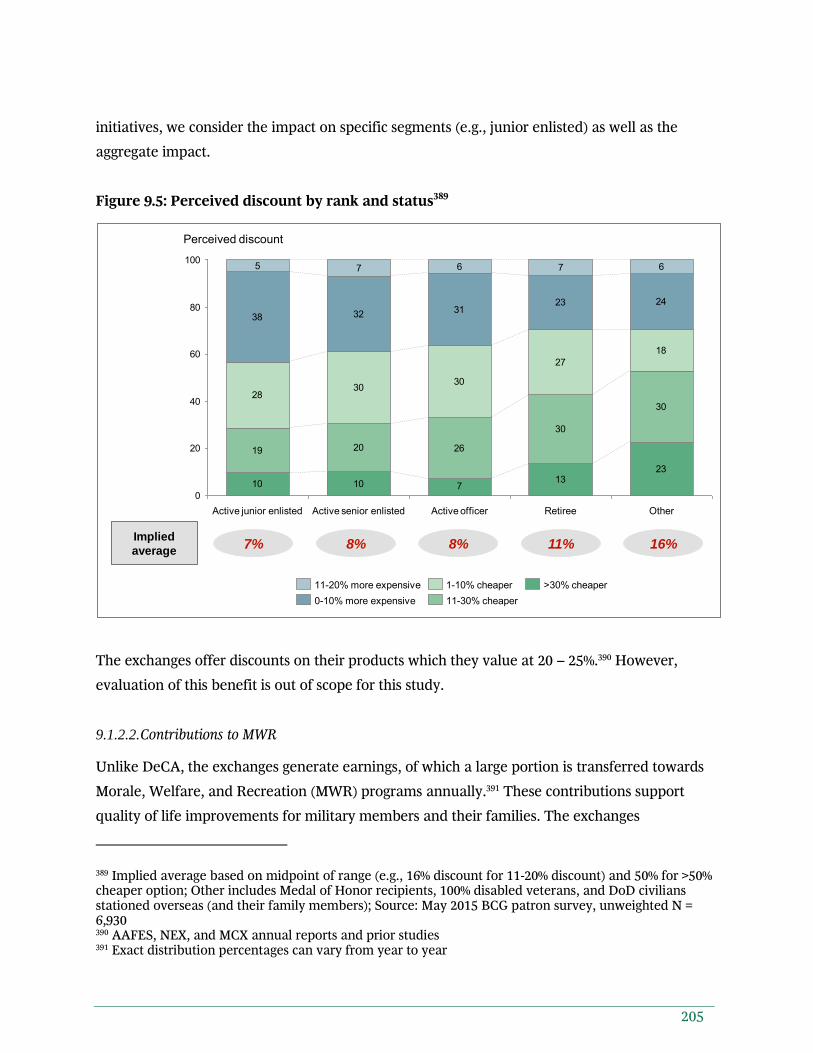
less.50
Figure 2.5: Summary of market basket savings
% savings at DeCA versus competitors for identical branded items
Lowest-priced nearby competitor sampled
16%
Second lowest-priced nearby competitor
21%
In our market basket analysis, we also found that savings vary significantly by category, and are
highest in meat (29%), dairy (24%), frozen (22%), and produce (20%) and lowest in non-food
(12%), beverage (8%), and general grocery (e.g., Kraft macaroni and cheese) (6%) (see Figure
2.6).51
48 Our market basket study involved collecting prices of 50 representative items at two or more high-share, local grocers (including Walmart) across 51 sampled commissaries and comparing to DeCA's prices for identical items. We also factored in prices of private label equivalents at competitors and value brands at DeCA. The prices used in this analysis were the lowest available, including promotions. Applicable taxes were also included for food and non-food items. This was a point-in-time analysis in March/April 2015 that we would recommend be replicated over time for deeper validation 49 Comparing items with the same exact UPCs 50 Sources: May 2015 BCG patron survey, 2012 Status of Forces Survey 51 These savings rates incorporate DeCA value brands and competitor private label items (only comparing like-for-like). General grocery includes canned and boxed goods, condiments, etc.
28
Figure 2.6: Commissary savings by category52
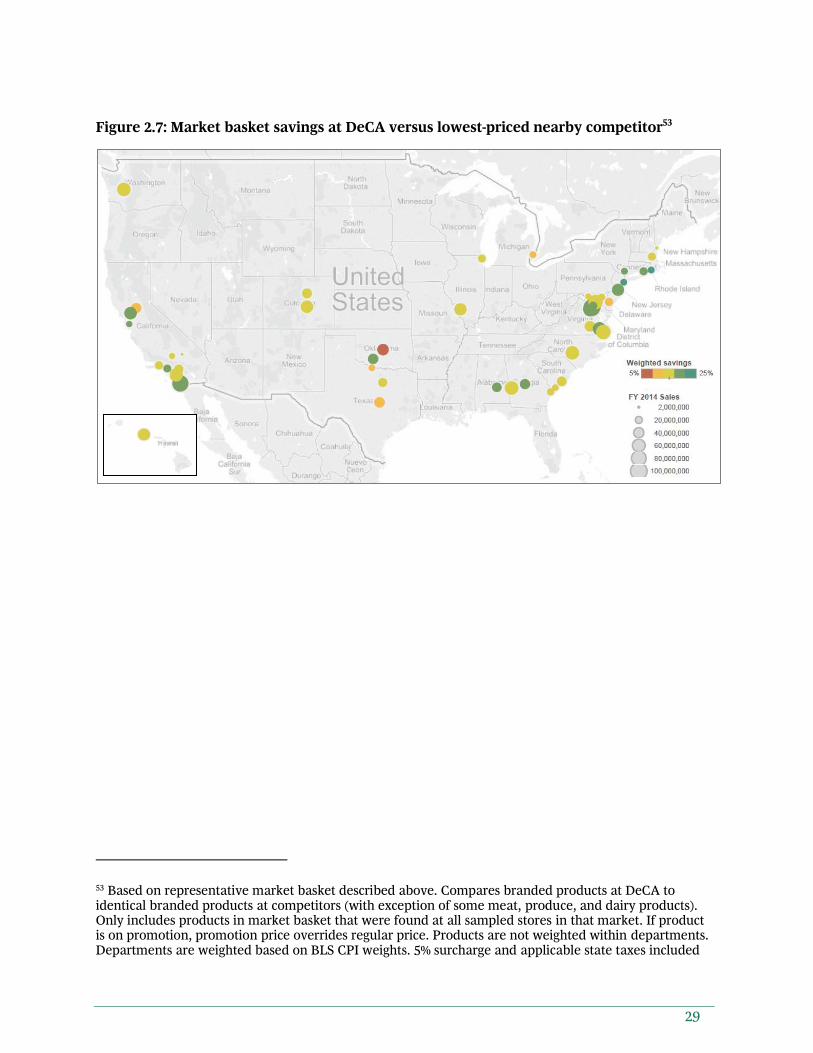
Savings also vary by location. There are some regions where the value of the benefit is in the
10-15% range (e.g., Fort Hood) and others in the 20-25% range (e.g., Fort Myer). Typically,
higher cost-of-living areas enjoy greater savings at the commissary and lower cost-of-living areas
experience lower savings because DeCA's pricing for scannable items is the same across
CONUS locations, while private sector grocers vary price by location. These locations with
higher cost-of-living tend to be near major metropolitan areas and are not as well penetrated by
Walmart (see Figures 2.7 and 2.8).
52 Based on lowest-priced nearby competitor (Walmart in most markets)
29
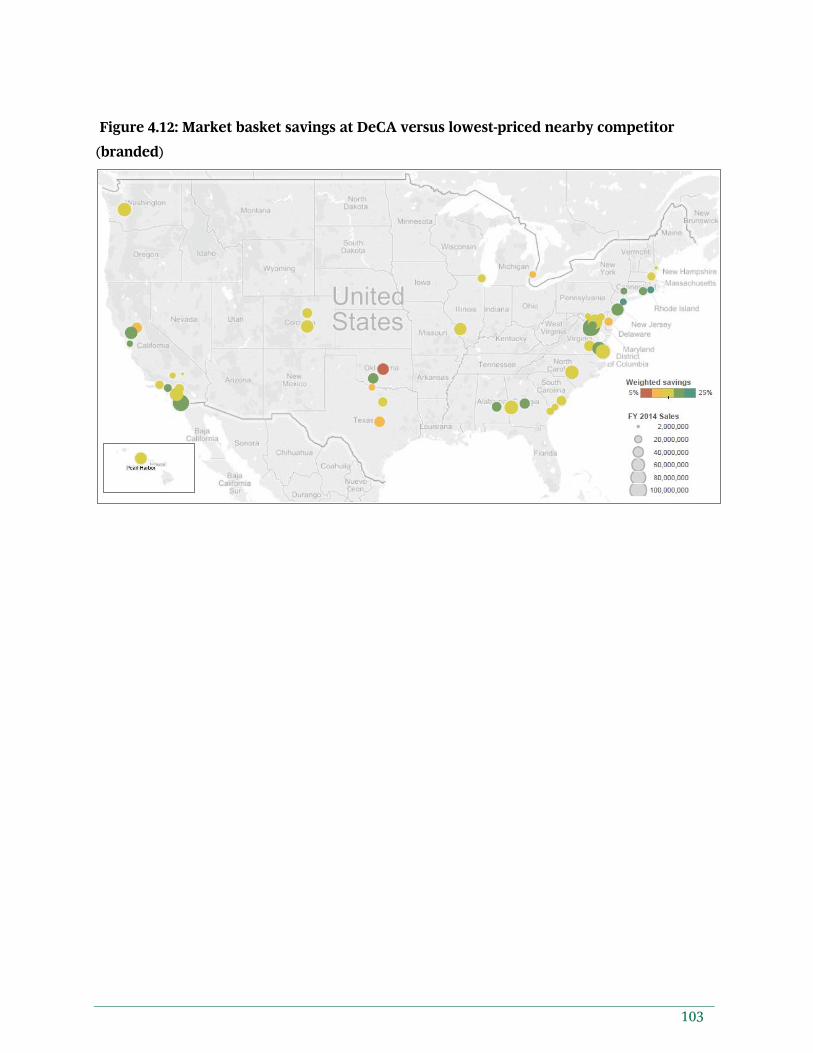
Figure 2.7: Market basket savings at DeCA versus lowest-priced nearby competitor53
53 Based on representative market basket described above. Compares branded products at DeCA to identical branded products at competitors (with exception of some meat, produce, and dairy products). Only includes products in market basket that were found at all sampled stores in that market. If product is on promotion, promotion price overrides regular price. Products are not weighted within departments. Departments are weighted based on BLS CPI weights. 5% surcharge and applicable state taxes included
30
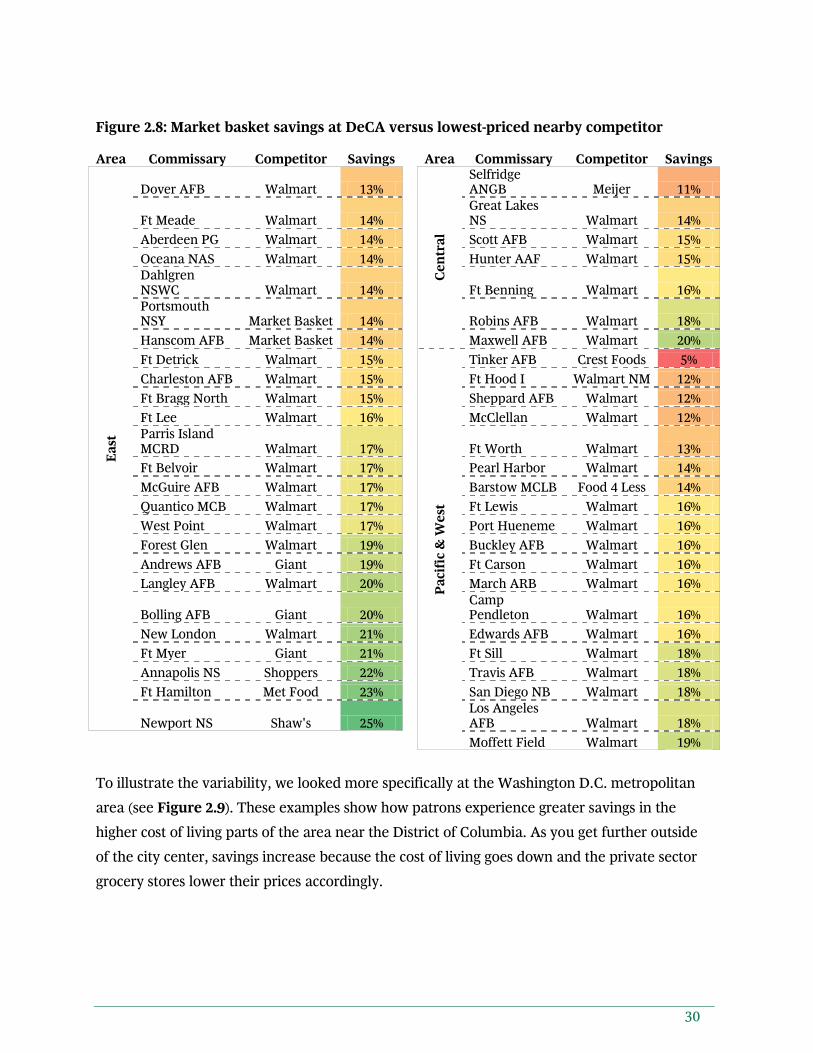
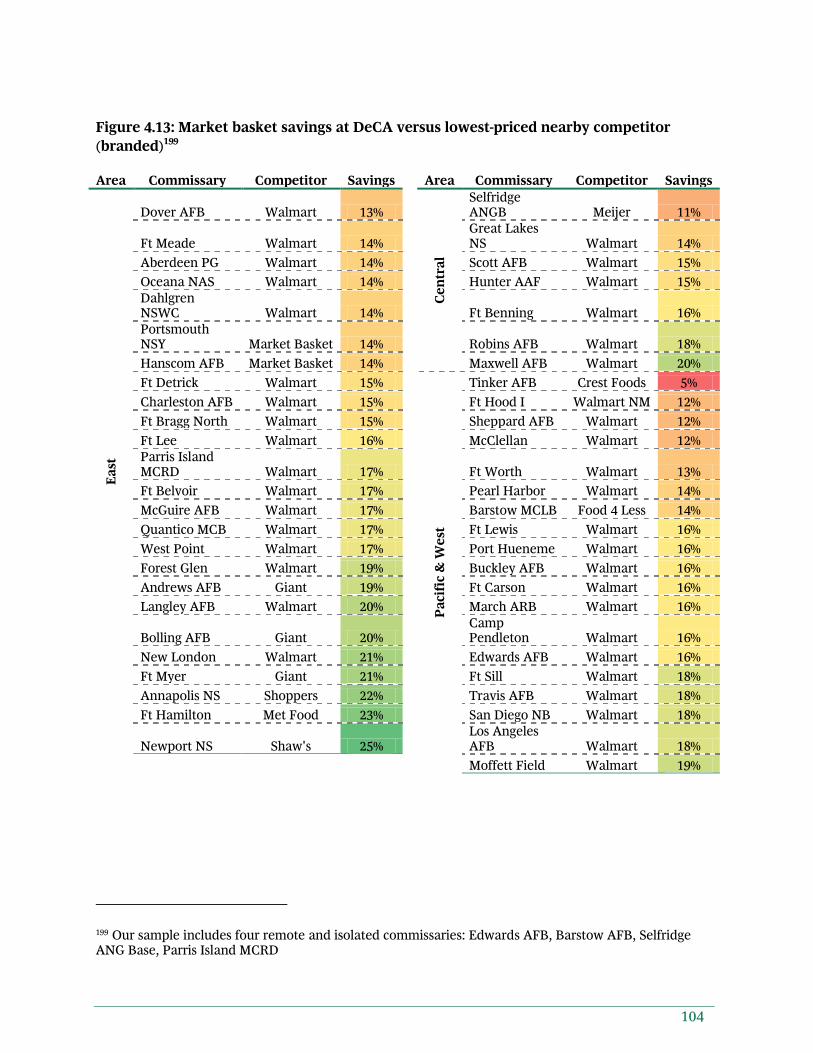
Figure 2.8: Market basket savings at DeCA versus lowest-priced nearby competitor
Area Commissary Competitor Savings
Area Commissary Competitor Savings
Ea
st
Dover AFB Walmart 13%
Ce
ntr
al
Selfridge ANGB Meijer 11%
Ft Meade Walmart 14%
Great Lakes NS Walmart 14%
Aberdeen PG Walmart 14%
Scott AFB Walmart 15%
Oceana NAS Walmart 14%
Hunter AAF Walmart 15%
Dahlgren NSWC Walmart 14%
Ft Benning Walmart 16%
Portsmouth NSY Market Basket 14%
Robins AFB Walmart 18%
Hanscom AFB Market Basket 14%
Maxwell AFB Walmart 20%
Ft Detrick Walmart 15%
Pa
cif
ic &
We
st
Tinker AFB Crest Foods 5%
Charleston AFB Walmart 15%
Ft Hood I Walmart NM 12%
Ft Bragg North Walmart 15%
Sheppard AFB Walmart 12%
Ft Lee Walmart 16%
McClellan Walmart 12%
Parris Island MCRD Walmart 17%
Ft Worth Walmart 13%
Ft Belvoir Walmart 17%
Pearl Harbor Walmart 14%
McGuire AFB Walmart 17%
Barstow MCLB Food 4 Less 14%
Quantico MCB Walmart 17%
Ft Lewis Walmart 16%
West Point Walmart 17%
Port Hueneme Walmart 16%
Forest Glen Walmart 19%
Buckley AFB Walmart 16%
Andrews AFB Giant 19%
Ft Carson Walmart 16%
Langley AFB Walmart 20%
March ARB Walmart 16%
Bolling AFB Giant 20%
Camp Pendleton Walmart 16%
New London Walmart 21%
Edwards AFB Walmart 16%
Ft Myer Giant 21%
Ft Sill Walmart 18%
Annapolis NS Shoppers 22%
Travis AFB Walmart 18%
Ft Hamilton Met Food 23%
San Diego NB Walmart 18%
Newport NS Shaw's 25%
Los Angeles AFB Walmart 18%
Moffett Field Walmart 19%
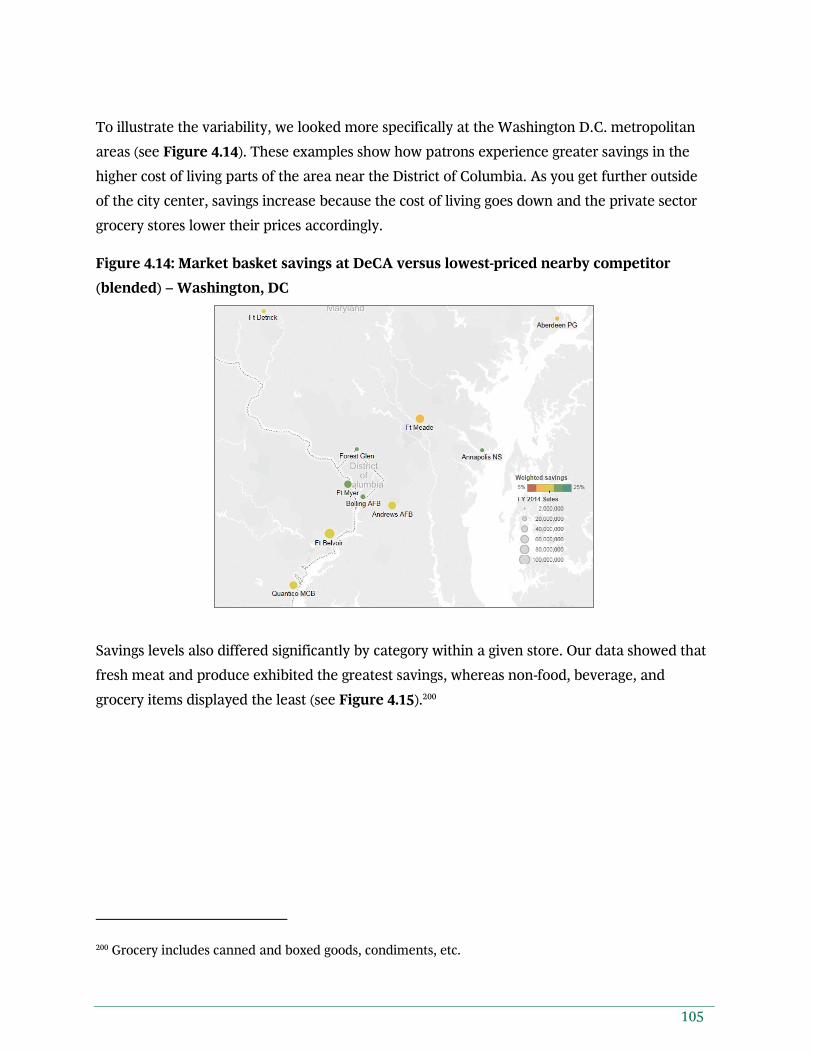
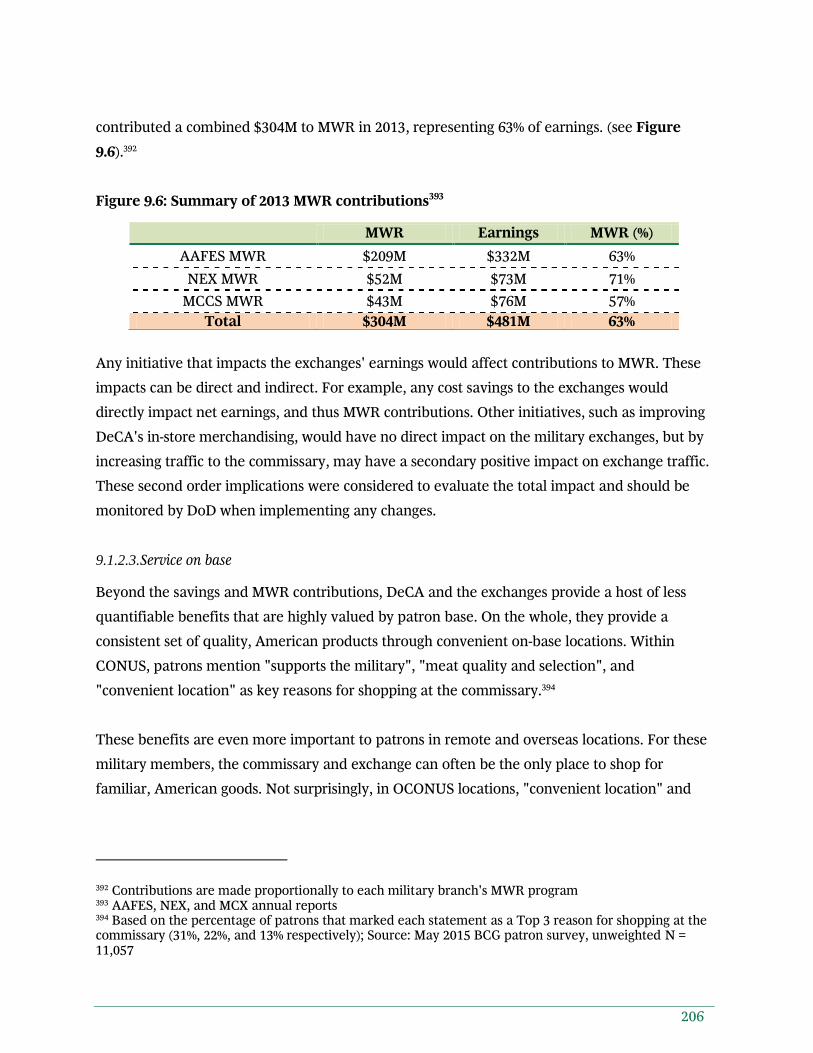
To illustrate the variability, we looked more specifically at the Washington D.C. metropolitan
area (see Figure 2.9). These examples show how patrons experience greater savings in the
higher cost of living parts of the area near the District of Columbia. As you get further outside
of the city center, savings increase because the cost of living goes down and the private sector
grocery stores lower their prices accordingly.
31
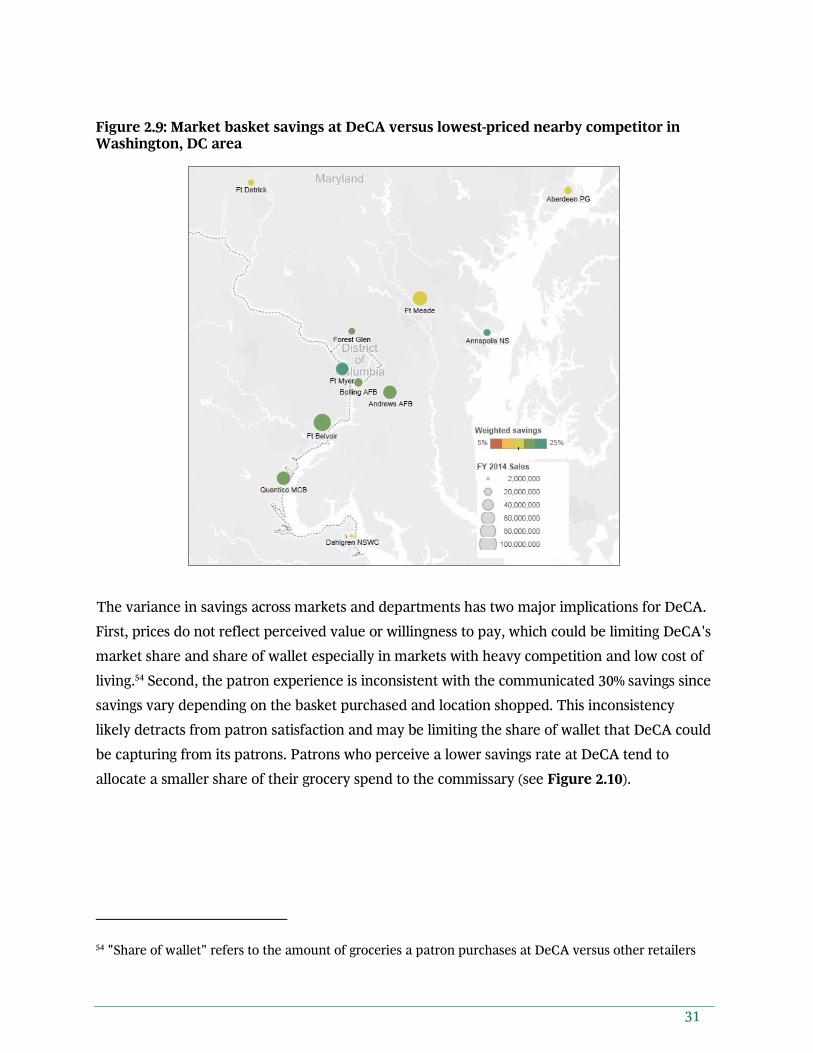
Figure 2.9: Market basket savings at DeCA versus lowest-priced nearby competitor in Washington, DC area
The variance in savings across markets and departments has two major implications for DeCA.
First, prices do not reflect perceived value or willingness to pay, which could be limiting DeCA's
market share and share of wallet especially in markets with heavy competition and low cost of
living.54 Second, the patron experience is inconsistent with the communicated 30% savings since
savings vary depending on the basket purchased and location shopped. This inconsistency
likely detracts from patron satisfaction and may be limiting the share of wallet that DeCA could
be capturing from its patrons. Patrons who perceive a lower savings rate at DeCA tend to
allocate a smaller share of their grocery spend to the commissary (see Figure 2.10).
54 "Share of wallet" refers to the amount of groceries a patron purchases at DeCA versus other retailers
32
Figure 2.10: Indexed share of wallet versus perceived savings rate55
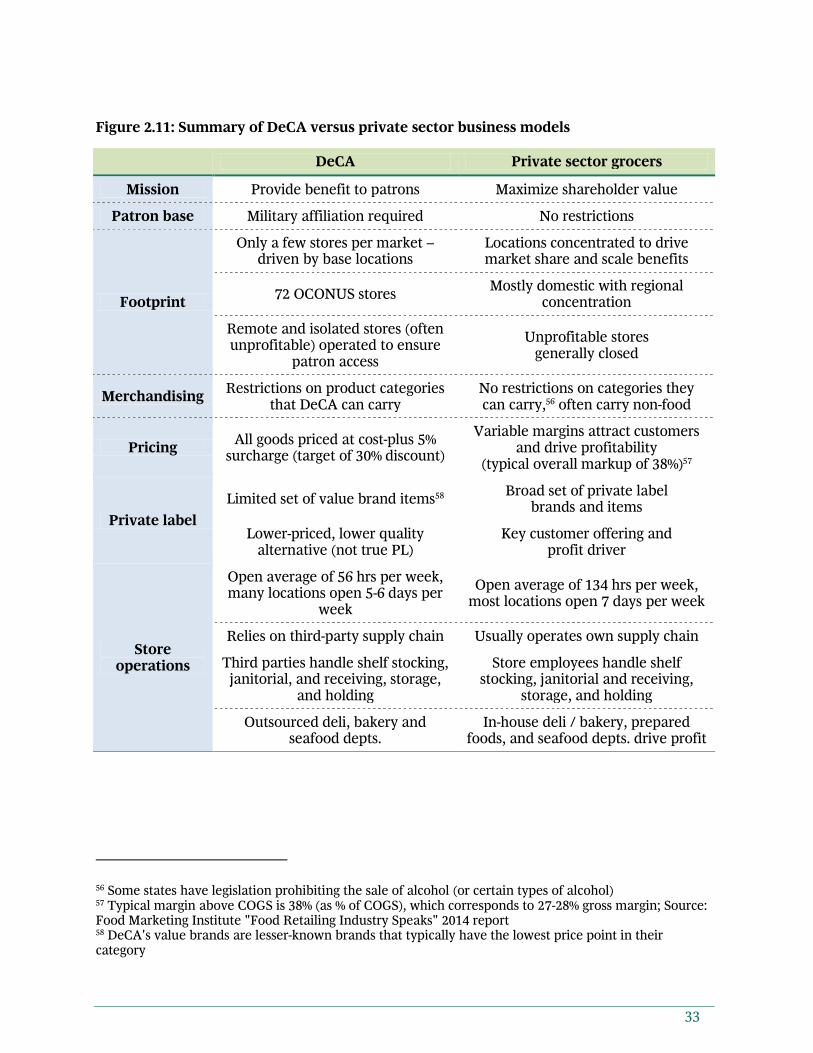
As discussed, there are numerous differences between DeCA and private sector grocers that
result in fundamentally different business models (see Figure 2.11). These differences create
significant operational and economic disadvantages for DeCA. If it were possible for DeCA to
adopt some practices observed in the private sector, there would be significant value for both
DeCA as well as patrons which we will explore further in later sections. While we are not
suggesting DeCA needs to adopt all of the practices seen in the private sector, we do believe the
differences between DeCA and private sector grocers are important to understand and
highlight some opportunities.
55 Indexed share of wallet calculated by taking the percent difference from the average share of wallet across all commissary users answering that question and those with a given range of price perception; Source: May 2015 BCG patron survey, unweighted N = 6,954
Indexed share of wallet by perceived savings rate
-15
-3
21
-20
-10
0
10
20
30
Perceived savings rate
No savings
Indexed % of grocery spend at the commissary
0-20% savings>20% savings
33
Figure 2.11: Summary of DeCA versus private sector business models
DeCA Private sector grocers
Mission Provide benefit to patrons Maximize shareholder value
Patron base Military affiliation required No restrictions
Footprint
Only a few stores per market – driven by base locations
Locations concentrated to drive market share and scale benefits
72 OCONUS stores Mostly domestic with regional
concentration
Remote and isolated stores (often unprofitable) operated to ensure
patron access
Unprofitable stores generally closed
Merchandising Restrictions on product categories
that DeCA can carry No restrictions on categories they can carry,56 often carry non-food
Pricing All goods priced at cost-plus 5%
surcharge (target of 30% discount)
Variable margins attract customers and drive profitability
(typical overall markup of 38%)57
Private label
Limited set of value brand items58 Broad set of private label
brands and items
Lower-priced, lower quality alternative (not true PL)
Key customer offering and profit driver
Store operations
Open average of 56 hrs per week, many locations open 5-6 days per
week
Open average of 134 hrs per week, most locations open 7 days per week
Relies on third-party supply chain Usually operates own supply chain
Third parties handle shelf stocking, janitorial, and receiving, storage,
and holding
Store employees handle shelf stocking, janitorial and receiving,
storage, and holding
Outsourced deli, bakery and seafood depts.
In-house deli / bakery, prepared foods, and seafood depts. drive profit
56 Some states have legislation prohibiting the sale of alcohol (or certain types of alcohol) 57 Typical margin above COGS is 38% (as % of COGS), which corresponds to 27-28% gross margin; Source: Food Marketing Institute "Food Retailing Industry Speaks" 2014 report 58 DeCA's value brands are lesser-known brands that typically have the lowest price point in their category
34
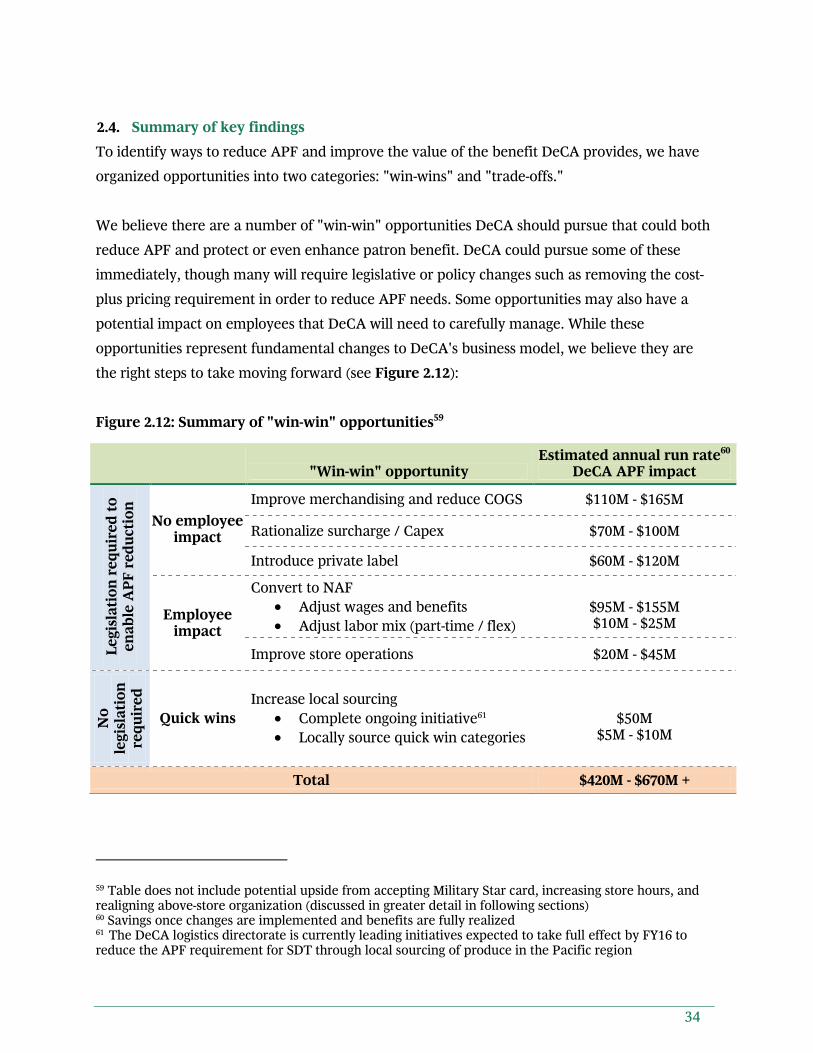
2.4. Summary of key findings
To identify ways to reduce APF and improve the value of the benefit DeCA provides, we have
organized opportunities into two categories: "win-wins" and "trade-offs."
We believe there are a number of "win-win" opportunities DeCA should pursue that could both
reduce APF and protect or even enhance patron benefit. DeCA could pursue some of these
immediately, though many will require legislative or policy changes such as removing the cost-
plus pricing requirement in order to reduce APF needs. Some opportunities may also have a
potential impact on employees that DeCA will need to carefully manage. While these
opportunities represent fundamental changes to DeCA's business model, we believe they are
the right steps to take moving forward (see Figure 2.12):
Figure 2.12: Summary of "win-win" opportunities59
"Win-win" opportunity
Estimated annual run rate60 DeCA APF impact
Le
gis
lati
on
re
qu
ire
d t
o
en
ab
le A
PF
re
du
cti
on
No employee impact
Improve merchandising and reduce COGS $110M - $165M
Rationalize surcharge / Capex $70M - $100M
Introduce private label $60M - $120M
Employee impact
Convert to NAF
Adjust wages and benefits
Adjust labor mix (part-time / flex)
$95M - $155M $10M - $25M
Improve store operations $20M - $45M
No
le
gis
lati
on
re
qu
ire
d
Quick wins
Increase local sourcing
Complete ongoing initiative61
Locally source quick win categories
$50M
$5M - $10M
Total $420M - $670M +
59 Table does not include potential upside from accepting Military Star card, increasing store hours, and realigning above-store organization (discussed in greater detail in following sections) 60 Savings once changes are implemented and benefits are fully realized 61 The DeCA logistics directorate is currently leading initiatives expected to take full effect by FY16 to reduce the APF requirement for SDT through local sourcing of produce in the Pacific region
35
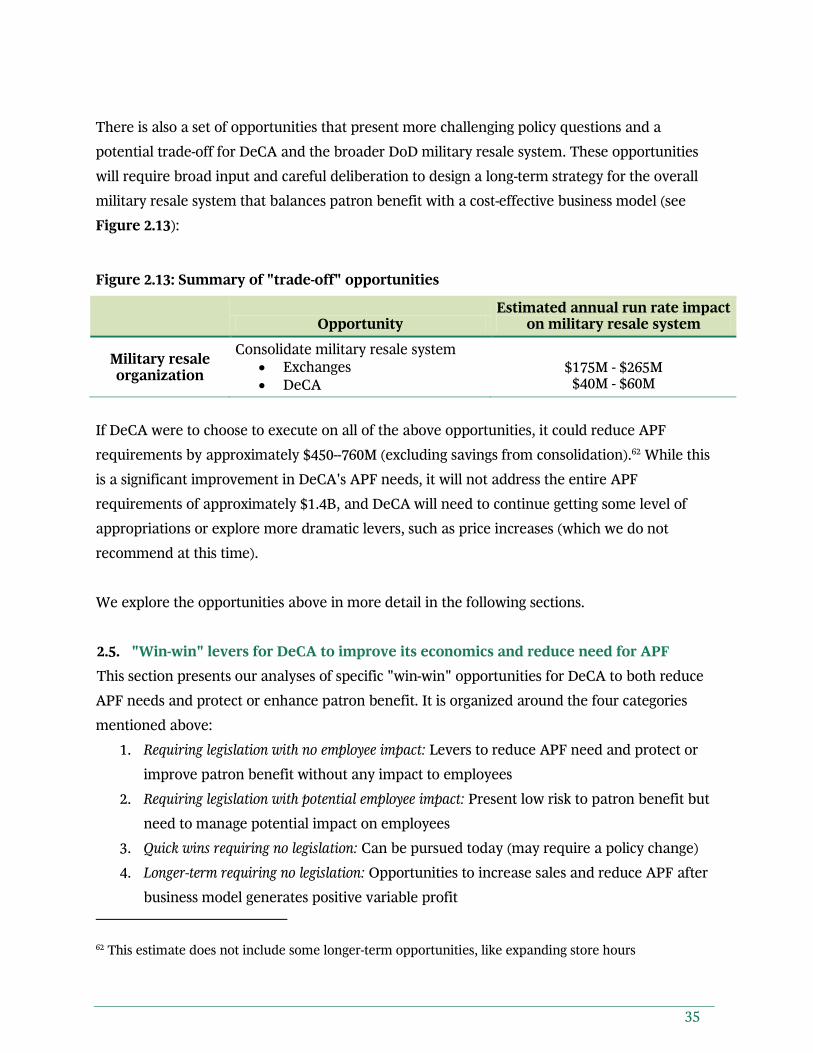
There is also a set of opportunities that present more challenging policy questions and a
potential trade-off for DeCA and the broader DoD military resale system. These opportunities
will require broad input and careful deliberation to design a long-term strategy for the overall
military resale system that balances patron benefit with a cost-effective business model (see
Figure 2.13):
Figure 2.13: Summary of "trade-off" opportunities
Opportunity
Estimated annual run rate impact on military resale system
Military resale organization
Consolidate military resale system
Exchanges
DeCA
$175M - $265M
$40M - $60M
If DeCA were to choose to execute on all of the above opportunities, it could reduce APF
requirements by approximately $450--760M (excluding savings from consolidation).62 While this
is a significant improvement in DeCA's APF needs, it will not address the entire APF
requirements of approximately $1.4B, and DeCA will need to continue getting some level of
appropriations or explore more dramatic levers, such as price increases (which we do not
recommend at this time).
We explore the opportunities above in more detail in the following sections.
2.5. "Win-win" levers for DeCA to improve its economics and reduce need for APF
This section presents our analyses of specific "win-win" opportunities for DeCA to both reduce
APF needs and protect or enhance patron benefit. It is organized around the four categories
mentioned above:
1. Requiring legislation with no employee impact: Levers to reduce APF need and protect or
improve patron benefit without any impact to employees
2. Requiring legislation with potential employee impact: Present low risk to patron benefit but
need to manage potential impact on employees
3. Quick wins requiring no legislation: Can be pursued today (may require a policy change)
4. Longer-term requiring no legislation: Opportunities to increase sales and reduce APF after
business model generates positive variable profit
62 This estimate does not include some longer-term opportunities, like expanding store hours
36
2.5.1. Opportunities requiring legislation with no employee impact
2.5.1.1. Merchandising and reduce cost of goods sold (COGS)
DeCA's cost-plus approach results in a different approach to merchandising than is typical of
private sector grocers. Because DeCA is required to set prices at cost-plus 5%, all products
generate the same 5% margin. Thus, while managing cost of goods sold (COGS) is a key driver
of profitability for private sector grocers, this practice is largely irrelevant for DeCA. Private
sector grocers are also motivated to frequently alter space allocation for items and categories
based on margin performance. DeCA, on the other hand, does not have an incentive to make
these kinds of analytical in-store merchandising decisions. Finally, when possible, private sector
grocers often seek to improve profitability through expanding into adjacent categories (e.g.,
prepared foods). DeCA, on the other hand, is limited by law or policy in which categories it can
sell. As a result, DeCA cannot always take advantage of these opportunities.
As DeCA moves away from cost-plus pricing, it will also be important to adjust its approach to
merchandising. We believe there could be opportunities for DeCA to reduce APF and enhance
the patron benefit through the following merchandising initiatives:
1. Improve COGS
2. Enhance space allocation in-store
3. Introduce new categories
As explained in Section 2.3, DeCA stipulates "best bucket" pricing from its suppliers in its
resale ordering agreement (ROA). However, there are many other components of the retailer-
supplier relationship that can significantly impact the overall economics. While DeCA works
closely with suppliers to help manage assortment and fund promotions, there are other forms
of support and partnership that DeCA may not be fully participating in. For example, it is
common practice for private sector grocers to use benefits such as prime location, end cap
placement, or shelf space for new products to secure additional support from suppliers.63 This
additional support, which goes beyond just the price of a good, can have a significant impact on
a retailer's overall costs. Taking into consideration the level of support that DeCA gets from
63 An end cap refers to the display placed at the end of an aisle. Products located in endcaps generally have higher sales, making this a highly valuable and sought after position
37
vendors today (including vendor stocking, promotional support, and merchandising programs)
as well as the impact of proposed changes to DeCA's business model (introduction of variable
pricing, private label, etc.), we believe there is an opportunity to enhance DeCA's COGS.
We have consistently seen private sector efforts to improve COGS benefit customers, retailers,
and suppliers. COGS efforts deliver significant value, even for the largest and most
sophisticated retailers with transparency into their cost structure and a focus on keeping COGS
low. These focused efforts typically yield 2-3% profitability improvement (as a percent of total
addressable COGS), which could be worth $110-170M for DeCA (based on addressable COGS of
$5.5B in FY14).64 DeCA has not previously undergone a targeted effort to improve COGS. Thus,
savings may be even greater in this case (i.e., 4-5 % reduction). However, because of some of
the challenges DeCA will face in pursuing this opportunity (see discussion below), we assume a
more conservative 2-3% savings for our estimate.
Successfully executing a COGS effort will require a very focused, analytical effort. Because
DeCA relies on suppliers to manage CONUS logistics, DeCA's COGS includes the cost of
distribution to the store and often vendor stocking. These costs are generally not disaggregated
in data provided to DeCA, making the COGS from suppliers much more opaque. DeCA would
need to build a comprehensive understanding of product profitability at the SKU level as well
as a clear view on how patrons feel about specific brands. Category managers would need to
benchmarking, and consumer research to understand purchase behavior and brand preference
to develop tailored category strategies to improve vendor support. Capturing the economic
benefits from these opportunities would also require moving away from cost-plus pricing, as
discussed in Section 4.
As part of the COGS effort, we believe DeCA can also improve its in-store merchandising to
make better use of space throughout the store. In general, DeCA stores allocate less space to
retail / selling area than private sector grocers.65 This allocation decreases sales per store and
the overall economic attractiveness of DeCA. While DeCA's unique in-store labor model may
drive some of these differences (e.g., requiring more space to stage product for third-party
64 2 – 3% savings generally seen among leading retailers in BCG experience 65 Booz Allen Hamilton, "Independent Study of the Engineering Directorate"
38
stockers), allocating additional space to selling area (where feasible within the building
structure) provides an opportunity to increase sales and enhance aggregate patron benefit by
providing more products in more visible locations.
DeCA also does not appear to optimally utilize the retail selling space it has. For example,
DeCA appears to underutilize endcaps, which are typically very productive locations used
strategically by private sector grocers (see Figure 2.14):
Figure 2.14: Comparison of Maxwell AFB commissary to private sector grocer66
Similarly, some commissaries fail to fully capitalize on open floor space, using the space for less
productive purposes (e.g., one commissary in the southern U.S. featured a pallet of firewood in
the produce section in April). Though difficult to quantify, we believe the potential sales upside
from improving space allocation and merchandising could be significant.
66 Left: Maxwell AFB store visit in April 2015; Right: Photo from 2015 BCG store photo library
Inconsistently stocked display of 2 products on 2 shelves
Easy and transparent overview of 4 products on 6 shelves
39
In the private sector, the process of designing store planograms is generally driven by a deep
understanding of consumer preferences, shopping behavior, category economics, and strategic
considerations such as impact on store traffic. DeCA has teams that are responsible for
planograms in each category, but there appears to be an opportunity to bring more of this
private sector lens to DeCA's merchandising decision making. Some categories and brands at
DeCA likely have more shelf space than necessary and could be reduced to add new
categories67 or to shift space to more productive categories and brands. For example, DeCA's
most recent laundry detergent planogram allocated roughly the same amount of shelf space (8-
12 units) across most of the 100+ items.68 Given the wide range of unit volume for each item
(from roughly 10,000 to over 100,000 units per year), there could be an opportunity to focus less
on lower performing products.69
Improving space allocation by category and item could free up shelf space for private label and
new categories, which would further enhance category margins and sales.70 As part of the
request for quotation (RFQ), we were asked to explore the introduction of beer and wine to the
Commissary. If the Commissary were to introduce beer and wine, some sales will shift from the
exchanges to the commissary. However, we believe the military resale system would gain share
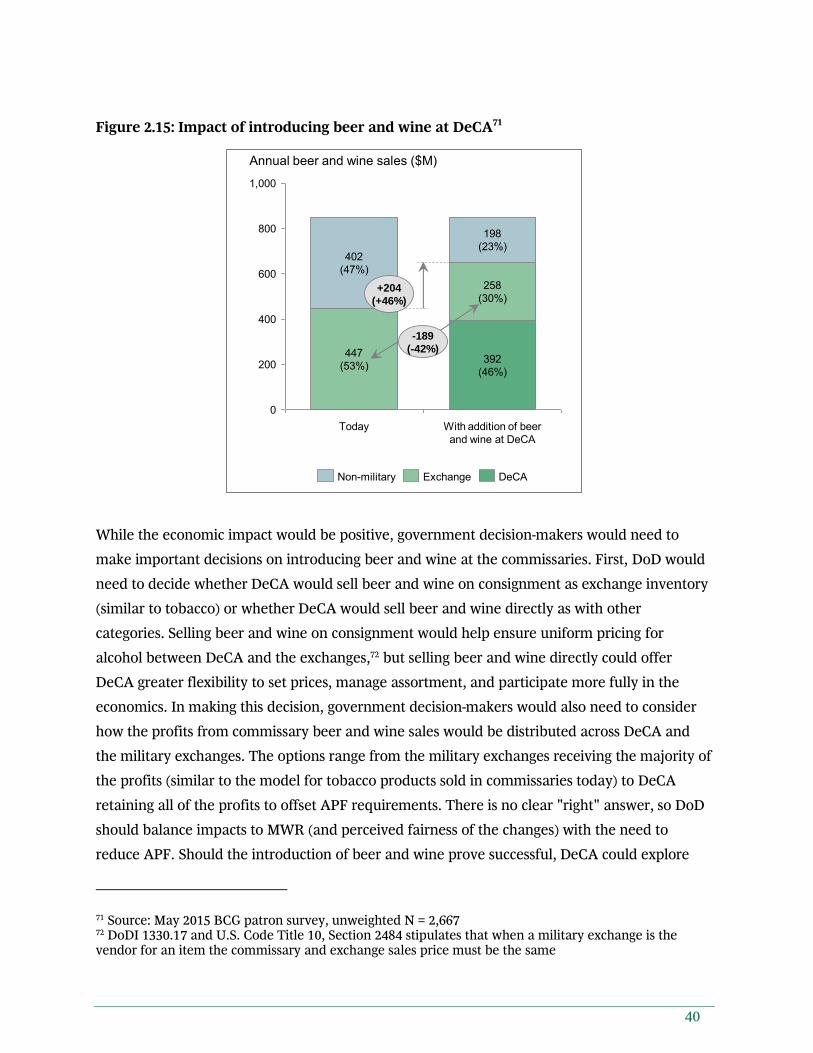
overall. Based on our survey, we estimate that patrons spend 53% of their total beer and wine
expenditure at military exchange outlets today (representing $447M in sales and $96M in gross
margin). If DeCA introduced beer and wine, patrons suggested they would increase the overall
share purchased at military resale outlets by 46% ($204M in sales). However, they would reduce
the amount spent at the military exchanges by 42% ($189M in sales) (see Figure 2.15).
67 Assuming authorized to carry the category or department, some of which may require legislative action (e.g., alcohol) 68 DeCA April 2015 laundry detergent planogram 69 Nielsen 2014 CONUS sales data 70 DeCA can likely add private label and beer / wine without having to discontinue any items; that being said, it would be important to re-explore planogram decisions after introducing the new products. In particular, value brands which are priced at or above competitive private label brands should be considered for discontinuation
40
Figure 2.15: Impact of introducing beer and wine at DeCA71
While the economic impact would be positive, government decision-makers would need to
make important decisions on introducing beer and wine at the commissaries. First, DoD would
need to decide whether DeCA would sell beer and wine on consignment as exchange inventory
(similar to tobacco) or whether DeCA would sell beer and wine directly as with other
categories. Selling beer and wine on consignment would help ensure uniform pricing for
alcohol between DeCA and the exchanges,72 but selling beer and wine directly could offer
DeCA greater flexibility to set prices, manage assortment, and participate more fully in the
economics. In making this decision, government decision-makers would also need to consider
how the profits from commissary beer and wine sales would be distributed across DeCA and
the military exchanges. The options range from the military exchanges receiving the majority of
the profits (similar to the model for tobacco products sold in commissaries today) to DeCA
retaining all of the profits to offset APF requirements. There is no clear "right" answer, so DoD
should balance impacts to MWR (and perceived fairness of the changes) with the need to
reduce APF. Should the introduction of beer and wine prove successful, DeCA could explore
71 Source: May 2015 BCG patron survey, unweighted N = 2,667 72 DoDI 1330.17 and U.S. Code Title 10, Section 2484 stipulates that when a military exchange is the vendor for an item the commissary and exchange sales price must be the same
2015-06-24 Materials for our discussion - Patron Impact and SurveyvComments.pptx 8Draft—for discussion only
Adding beer / wine can increase overall share for military
resale, but would likely reduce share for exchanges
Note: Unweighted N = 2,667 (individuals that answered the question and purchase beer and wine today)Source: May 2015 BCG patron survey
1,000
800
600
400
200
0
Annual beer and wine sales ($M)
+204
(+46%)
With addition of beer and wine at DeCA
392(46%)
258(30%)
198(23%)
Today
447(53%)
402(47%)
DeCANon-military Exchange
Introducing beer and wine a net positive for
military resale...
...but could adversely impact exchange
sales and MWR under current rules
• $392M increase in sales
• $86M increase in margin, which could be used to offset APF
DeCA
Military
Exchanges
(shift to
DeCA)
• $189M decrease in sales
• $41M decrease in margin, leading to a $26M decrease in MWR
Military
Resale
• $204M increase in sales
• $44M increase in margin
-189
(-42%)
Private sector and footnote
DeCA – military exchanges
= military resale
41
selling other categories, such as home goods, where the overall military resale impact may be
similarly positive.
2.5.1.2. Surcharge / capital expenditures (Capex)
We believe there is an opportunity to reduce DeCA's APF requirement by eliminating the
restrictions on DeCA's surcharge funds and improving the way these funds are spent. Under
current legislation, DeCA's surcharge funds can only be used to pay for commissary
construction, equipment and maintenance. If spend in these categories is less than total
surcharge revenue (5% of COGS), DeCA cannot use the excess surcharge funds to offset its APF
needs. This system provides DeCA with limited economic incentive to reduce surcharge related
spend. Instead, DeCA has an incentive to execute on their full surcharge budget to best serve its
patrons through store improvements. This incentive is different from what is seen in the private
sector where all funds are fungible and reduction in any expense can increase profitability.
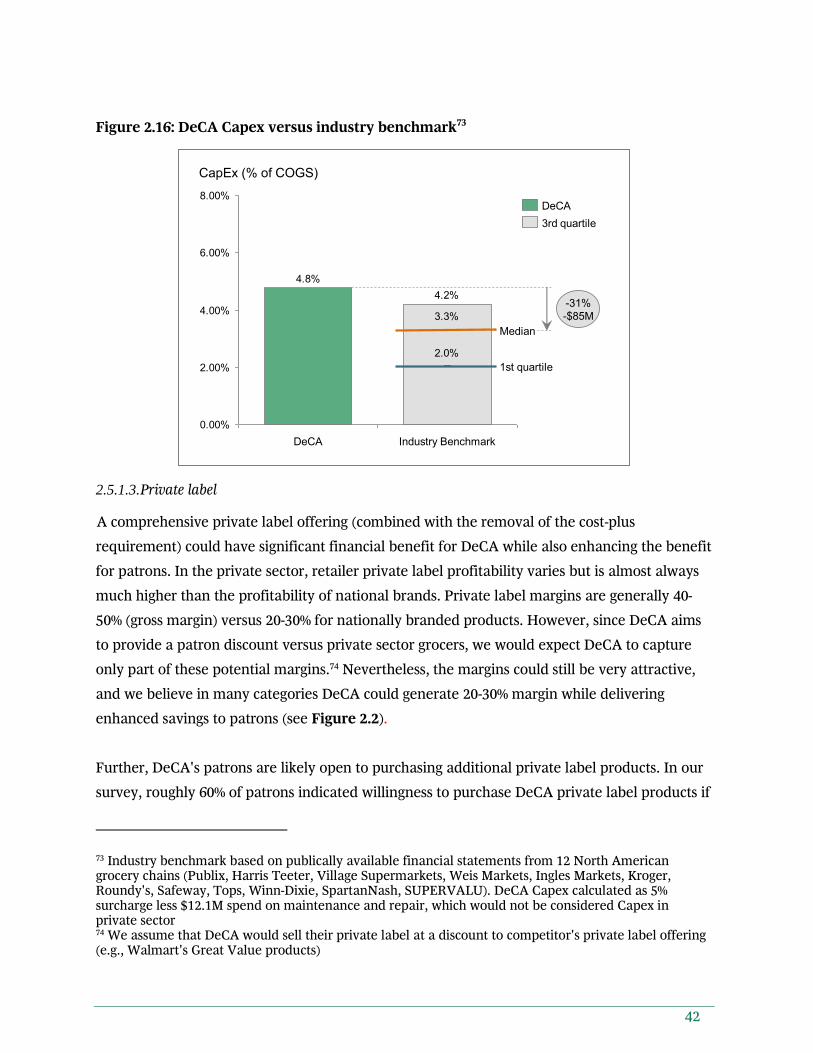
The vast majority of DeCA's surcharge budget is spent in categories which would be considered
as Capex in the private sector. Thus, to estimate the amount of room DeCA has to reduce
surcharge spend, we benchmark DeCA's surcharge of 5% against the annual Capex of private
sector grocers (see Figure 2.16). We excluded maintenance and repair costs from this
benchmark because they would not be considered as Capex. This analysis implies that DeCA
could save approximately $70-100M by aligning Capex (4.8% of COGS) with industry norms
(3.3% of COGS).
There are several reasons that the actual Capex savings opportunity at DeCA could be higher or
lower than this estimate. DeCA is subject to a number of statutes, regulations, executive orders
and DoD instructions which may limit its ability to execute Capex projects at the same cost as
private sector retailers. At the same time, DeCA does not incur several Capex costs that a
normal retailer would have to bear (i.e., investments to maintain CONUS distribution centers
and costs of building new stores to expand retail footprint). Since there are factors that both
increase and decrease the potential size of this savings opportunity, we feel that the estimate is
directionally accurate and that this is a big opportunity which DeCA should pursue if given the
flexibility needed.
42
Figure 2.16: DeCA Capex versus industry benchmark73
2.5.1.3. Private label
A comprehensive private label offering (combined with the removal of the cost-plus
requirement) could have significant financial benefit for DeCA while also enhancing the benefit
for patrons. In the private sector, retailer private label profitability varies but is almost always
much higher than the profitability of national brands. Private label margins are generally 40-
50% (gross margin) versus 20-30% for nationally branded products. However, since DeCA aims
to provide a patron discount versus private sector grocers, we would expect DeCA to capture
only part of these potential margins.74 Nevertheless, the margins could still be very attractive,
and we believe in many categories DeCA could generate 20-30% margin while delivering
enhanced savings to patrons (see Figure 2.2).
Further, DeCA's patrons are likely open to purchasing additional private label products. In our
survey, roughly 60% of patrons indicated willingness to purchase DeCA private label products if
73 Industry benchmark based on publically available financial statements from 12 North American grocery chains (Publix, Harris Teeter, Village Supermarkets, Weis Markets, Ingles Markets, Kroger, Roundy's, Safeway, Tops, Winn-Dixie, SpartanNash, SUPERVALU). DeCA Capex calculated as 5% surcharge less $12.1M spend on maintenance and repair, which would not be considered Capex in private sector 74 We assume that DeCA would sell their private label at a discount to competitor's private label offering (e.g., Walmart's Great Value products)
CapEx benchmark v6.pptx 6Draft—for discussion only
Source: Capital IQ, Peer set includes Publix, Harris Teeter, Village Supermarkets, Weis Market, Ingles, Kroger, Roundy's, Safeway, Tops, Winn-Dixie, SpartanNash, Supervalu
43
they were offered.75 As evidence, the exchanges already offer a wide range of private label
products to military resale patrons under their own brand names (e.g., Exchange Select and
Patriot's Choice) and have seen these products gain substantial share in some categories (e.g.,
26% penetration in girl's clothing at AAFES).76 We believe that DeCA could eventually see
similar penetration of its private label offering that exists among private sector grocers,
typically 15% - 40% depending on the category (see Figure 2.17).
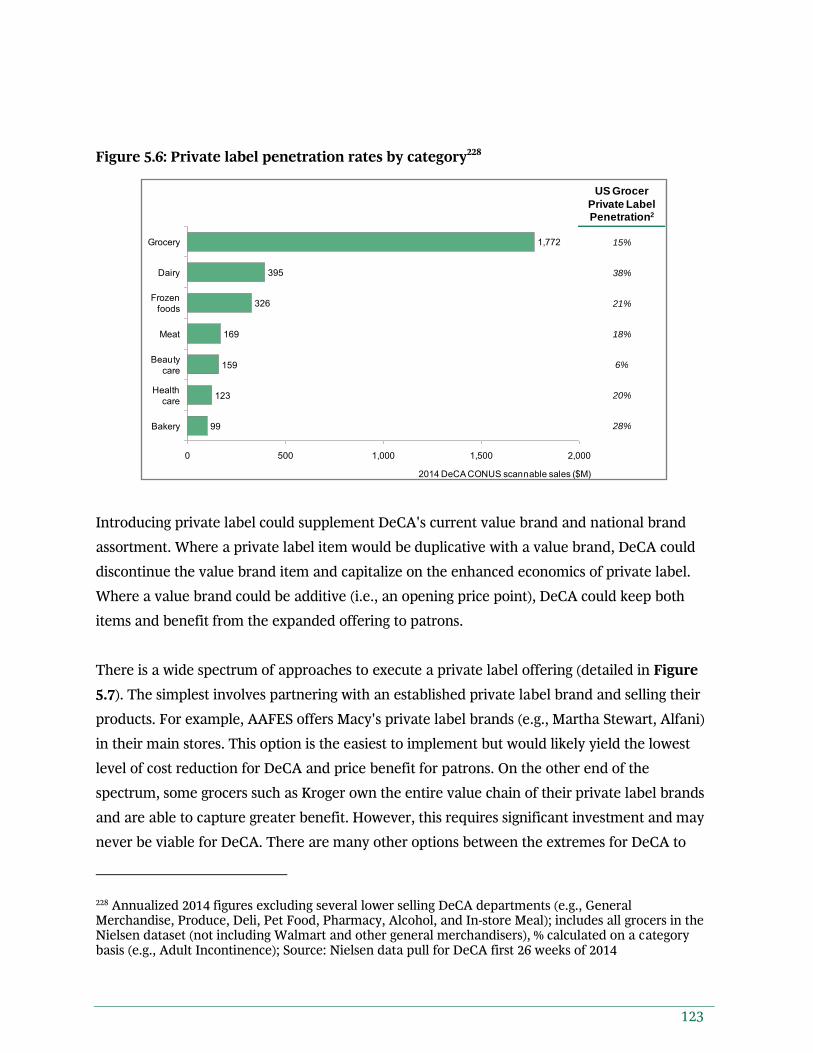
Figure 2.17: Private label penetration by department77
There is a wide spectrum of approaches to expand a private label offering (detailed in Figure
2.18). The simplest involves partnering with an established private label brand and selling their
products. For example, AAFES offers Macy's private label brands (e.g., Martha Stewart, Alfani)
in their main stores. This option may be the easiest to implement but may also yield the lowest
level of cost reduction for DeCA and price benefit for patrons. On the other end of the
spectrum, some grocers such as Kroger own the entire value chain of their private label brands
75 Willingness to purchase varies by category ranging from 39% (adult beverages) to 63% (grocery). Source: May 2015 BCG patron survey, unweighted N = 3,843 76 AAFES private label sales figures from FY2014 77 Annualized 2014 figures excluding several lower selling DeCA departments (e.g., General Merchandise, Produce, Deli, Pet Food, Pharmacy, Alcohol, and In-store Meal); includes all grocers in the Nielsen dataset (not including Walmart and other general merchandisers), % calculated on a category basis (e.g., Adult Incontinence); Source: Nielsen data pull for DeCA first 26 weeks of 2014
5000 2,0001,5001,000
159
123
1,772
395
169
326
Healthcare
Beautycare
Meat
Frozenfoods
Dairy
Grocery
99
2014 DeCA CONUS scannable sales ($M)
Bakery
US Grocer
Private Label Penetration2
15%
38%
21%
18%
6%
20%
28%
44
and are able to capture greater benefit. However, this requires significant scale and investment
and may never be viable for DeCA.
As a first step, DeCA should use a partnership or broker-managed model while developing a
broader private label strategy it can build over time. In a partnership model, DeCA would sell
another retailer's existing private label products. Alternatively, a broker-managed model would
allow DeCA to introduce private label brands without developing the full capabilities to
manage developing and sourcing the product. Both would allow DeCA to begin benefitting
from private label while providing a quick path to implementation.
Figure 2.18: Private label execution models78
DeCA would need to make two changes in order to fully benefit from private label. First, DeCA
would have to move away from cost-plus pricing. Second, DeCA would eventually need to
develop the capability to manage a broader portfolio of private label products. DeCA would
need to determine the right model for procuring private label products and then develop the
requisite capabilities. At a minimum, DeCA would need to add team members to manage
relationships with third-party private label manufacturers or sourcing companies.
78 Based on BCG's analysis of third-party provider websites
Complexity, investment, and savings
Description
Organization
implications
Broker
managed
• Broker (e.g., Daymon or Topco) coordinates development, manufacturing, and supply chain
• Add private label manager and analysts as breadth grows
• Support broader effort with existing category managers
Full vertical
integration
• Develop product internally and build capabilities to manufacture product internally
• Hire / acquire to build development and manufacturing capabilities
• Build separate private label department with support for each category
Internally
managed, 3rd
party developed
and manufactured
• Coordinate directly with development and manufacturing to create private label
• Add private label manager and analysts as breadth grows
• Consider adding separate private label department
Internal
development, 3rd party
manufacture
• Develop product internally and identify third-party partner to manufacture
• Hire / acquire to build product development capability
• Build separate private label department with support for each category
Partnership
• Sell existing private label brand (e.g., Kirkland, Exchange Select), managing as a normal supplier
• Add private label manager and analysts as breadth grows
• Support broader effort with existing category managers
Our recommendation
45
In the near term DeCA should look to build a partnership with an existing retailer or third-party
private label broker to get an initial offering off the ground quickly. Partnering with a third
party would simplify the execution for DeCA significantly because it would not require internal
product development, sourcing, or manufacturing capabilities. This arrangement might result
in lower margins than an internally managed value chain, but it would be much faster to bring
to market. In this scenario, DeCA could gradually build the internal capability to manage these
activities and reevaluate the opportunity for a different private label model to enhance margin.
Even if DeCA introduced new private label products and brands in a more limited way than the
largest private sector grocers (i.e., partnership or broker approach), we estimate that it could
contribute $60-120M annually to DeCA's bottom line once rolled out.79 We recommend that in
the first two years DeCA selectively launch products and build penetration in the highest
potential categories and then gradually build to full scale over the subsequent years. Phasing
the introduction of new categories and products would allow DeCA to test and learn along the
way, eventually reaping the full financial and patron benefits.
2.5.2. Opportunities requiring legislation with potential employee impact
2.5.2.1. Nonappropriated Fund (NAF) conversion
As an appropriated fund (APF) entity, DeCA faces constraints that private sector retailers do
not face including General Schedule (GS) pay scales, Federal programs for retirement plans and
health benefits, Office of Personnel Management (OPM) regulations on personnel policy, and
various procurement regulations such as the Federal Acquisition Regulation (FAR) and the
Defense Federal Acquisition Regulation Supplement (DFARS).80 While these regulations serve
important public policy goals, they limit DeCA's ability to operate the commercial aspects of
the enterprise efficiently. By converting to a nonappropriated fund instrumentality (NAFI),
DeCA would be able to better align regulatory requirements to its commercial activities and
reduce needs for APF. We believe that the benefits of NAF conversion, which include
alignment of incentives, cost-saving opportunities, and enablement of related savings levers,
79 Assumes a range of COGS savings (30-40%) and price discount to DeCA national brand prices (10-20%) at market level private label penetration 80 The FAR includes the Javits-Wagner-O'Day (JWOD) Act and the Small Business Acts. Some regulations that applies to APF entities still apply to NAFIs, such as the Davis-Bacon Act and Service Contract Act
46
outweigh potential costs and risks. The exchanges are examples of NAFIs that balance
commercial activities and public policy concerns while reducing reliance on APF.
Because DeCA is an APF entity, it is not permitted to retain its earnings.81 This results in a
limited incentive to pursue greater operating efficiencies because DeCA neither has profit
targets nor distributes any kind of dividend. Generating additional revenue or reducing costs
other than COGS does not improve DeCA's bottom line or benefit patrons. The cost savings
levers that DeCA is able to pull as an APF entity, such as reducing store hours, generally reduce
patron benefit. NAF conversion could better align DeCA's incentive structure with revenue
growth and cost reduction, which would help reduce the need for APF and could also improve
patron benefit.
Moreover, NAF conversion provides both tangible and intangible cost advantages (see Figure
2.19). We estimate that NAF conversion could generate long run annual savings of $125-225M
across the following categories:
81 Congressionally appropriated funds have a specific purpose and timeframe for budget execution, and APF entities are not legally permitted to use appropriated funds outside of these specified uses
47
Figure 2.19: Summary of the benefits of NAF conversion82
The quantifiable savings from NAF conversion come from three sources: wages, benefits, and
store operations levers. For instance, DeCA pays on average roughly 20% higher wages than the
exchanges for comparable in-store roles. Our analysis suggests that NAF conversion could
enable 15-25% wage savings for in-store positions, while maintaining the same level of pay for
above-store positions.83 Beyond differences in pay, there are also potential cost savings from
benefits.84 In addition, NAF conversion would enable store operations improvements85 which
collectively account for a potential $30-70M in savings (see Section 10.5).
82 Annual run rate savings refer to savings once all changes are implemented and benefits are fully realized 83 Estimates based on recent DCPAS NAF grocery wage survey results, June 2015 84 Benefits are 23% of payroll costs for DeCA versus 21% for AAFES. AAFES figure represents cost of group insurance, retirement expense, FICA expense, and vacation leave expense relative to total benefits and wage costs for FY14 85 These improvement levers exclude reduction in wage and benefits
Category DescriptionAnnual run-rate
savings ($M)
Wages
Greater pay band flexibility under NAF for both in-store and above-store positions; generally lower wages
60-110
Benefits
More flexible rules concerning benefits under NAF across retirement, health, and worker's compensation
35-45
Labor
flexibility
NAF labor regulations more flexible; allows for faster adjustment of workforce size and composition
30-70(see 'store ops')
ContractingNAF contracting not subject to FAR and DFARS Qualitative benefit
Aligned
incentives
NAF provides incentives for profit generation by allowing for retained earnings
Qualitative benefit
48
There are other less easily quantifiable advantages of NAF conversion. First, NAF conversion
would help DeCA contract more flexibly because FAR and DFARS do not apply to NAFIs.
While they serve a positive social role and reinforce the public nature of DeCA's mission, these
stipulations increase contracting costs for DeCA relative to sourcing in the open market.
Furthermore, DeCA would become more agile in terms of personnel actions. DeCA would be
able to more speedily hire and separate employees,86 use business-based actions to adjust the
size of the workforce, increase the use of flexible employees who do not receive benefits, and
offer performance-based pay.
These changes clearly involve policy trade-offs. However, we believe that the exchanges
effectively balance private sector best practices with public policy requirements, suggesting that
DeCA would be able to balance competing demands within a NAF framework. NAF conversion
would also strengthen consolidation synergies. If DeCA and the exchanges were to consolidate
even partially, NAF conversion would unlock a significant portion of the potential synergies for
DeCA.87 Without NAF status, DeCA would have limited back-office and sourcing synergies with
the exchanges since HR, finance, and procurement policies are different between APF and
NAF.
To convert to a NAFI, DeCA would need to significantly change its finance, HR, and contracting
processes. For instance, APF entities have minimal need for cash management since their
operating funds are provided annually by Congress, whereas NAFIs need to manage cash,
invest, and finance themselves much in the same way that private sector businesses do.
Moreover, NAFIs need to produce financial statements that comply with GAAP as specified by
the Financial Accounting Standards Board (FASB).88 On the other hand, DeCA currently follows
GAAP as specified by the Federal Accounting Standards Advisory Board (FASAB). To convert to
a NAFI, DeCA would need to update its accounting capabilities to comply with FASB standards.
Similarly, APF and NAF entities have distinct HR process needs. A successful NAF conversion
would require DeCA to reconfigure its payroll processing, benefits administration, employee
relations, and other HR processes to be compatible with NAF requirements. We believe that
86 NAF entities have the authority to use business-based actions, which allow them to separate for business reasons in a way that OPM regulations would not permit 87 We believe that NAF conversion is necessary for back-office, GNFR sourcing, and Capex consolidations of DeCA and the exchanges; integration of these functions contribute $30-45M to consolidation synergies 88 Generally accepted accounting principles
49
contracting would be the easiest function to convert to NAF processes, given that DeCA would
no longer be subject to FAR or DFARS. In all of these functions, DeCA could greatly enhance
the ease of implementation by aligning with the consolidation timeline and leveraging the NAF
capabilities of the exchanges.
In addition, Congress would need to legislate to give DeCA explicit permission to use its
revenues for NAF purposes by updating Chapter 147 of 10 U.S.C. This legislation would need to
also approve a financial transition plan specifying one-time costs, the level of annual APF
support during the transition period, and the end-state level of APF support.89 Further,
Congress should also approve a separate, DeCA-only NAF wage schedule if the NAF Personnel
Policy Office's authorities are insufficient to do so. The separate wage schedule would eliminate
the potential for disruption to existing NAF wage survey activities and pay bands.90
Converting DeCA employees to NAF employees could involve trade-offs and would require
careful consideration. Employee conversion could take place through attrition or forced
conversion. We believe a mixed approach of attrition and voluntary conversion would help
mitigate any potential effects on employees (e.g., morale, job satisfaction, performance). This
option would delay savings for DeCA but protect current employees from potential downside.
Those who choose to convert to NAF could be offered portability of retirement benefits as well
as save pay, which would maintain their pay level for two years.
Converting to NAF would require some one-time costs. DeCA would need to reconfigure its IT
systems and processes so that necessary finance, HR, and contracting data would flow through
to appropriate NAF-enabled functions. We estimate that these IT upgrades would cost
approximately $10-15M.91 In addition, DeCA may face new insurance requirements as a NAFI.92
We anticipate that these changes would not substantially change DeCA's long-term costs, but
they would require that DeCA build a cash reserve of $30-50M to become self-insured. Finally,
there would be additional investment necessary if DeCA were to build in-house NAF
capabilities.93 However, leveraging the existing back-office capabilities of the exchanges could
89 DeCA would likely need to continue to receive some APF support even after all savings are achieved 90 See Section 7 for more detail 91 This IT upgrade cost estimate is incremental to the IT integration costs calculated for consolidation 92 Includes worker's compensation, property liability, and public liability 93 If NAF conversion is not achieved by leveraging existing NAF capabilities, there would also be additional cost associated with administering both APF and NAF personnel systems
50
minimize additional costs and make implementation easier. Potential savings from NAF
conversion would outweigh these one-time costs.94
2.5.2.2. Store operations: Reduce contract labor spend and adjust labor mix
There may also be an opportunity to rethink the approach to in-store labor. We believe that
gradually "in-sourcing" contractor activities could present an opportunity to not only improve
the experience for patrons but also reduce the cost of labor in stores.95 However, under current
regulations, moving away from the contractor-dependent approach would be very difficult for
DeCA. As an APF entity, DeCA has additional restrictions on managing its workforce compared
with NAF institutions (e.g., part-time employees' weekly hours are set in contracts and are
difficult to adjust to meet short-term needs), and it can take up to 90 days to acquire and train
new in-store workers.96 This makes contractors a more attractive option for many activities
because they are more flexible to manage. In addition, the cost of vendor stocking is included
in COGS charged to DeCA by suppliers and directly paid for by patrons. Therefore, converting
DeCA to a NAFI and removing the cost-plus pricing requirement would make revamping the in-
store labor model much more feasible and attractive than it is today.
Assuming these conditions are in place, we believe savings from in-store labor changes could be
worth $30-70M, independent of wage and benefit adjustments associated with NAF
conversion.97 Three main factors would drive the savings and customer experience
improvements:
In-sourcing contractor and vendor stocking
In-sourcing deli / bakery and seafood operations
Adjusting DeCA's labor mix between full-time, part-time with benefits, and part-time
without benefits
As mentioned before, DeCA makes extensive use of contractors in stores (see Figure 2.20). In
FY14 alone, DeCA paid third parties roughly $180M for in-store activities, including $30M spent
94 These one-time cost estimates assume employee conversion through attrition; additional one-time costs when using forced conversion is discussed in Section 7.3.3 95 In-sourcing refers to transitioning processes from third-party providers to DeCA employees 96 90-day hiring timeline mentioned by multiple store directors 97 Also assumes that DeCA hires employees at prevailing NAF wage rates
51
on vendor stockers98 (22% of DeCA's total labor cost).99 While this allocation makes sense for
DeCA in the current APF environment, after NAF conversion the average DeCA employee will
command a more competitive wage rate than the contractor stockers currently charge. As a
result, it could be cost-effective to in-source all contractor stocking activities. While the savings
would be sensitive to a variety of factors (e.g., employee productivity, amount of additional
supervisors needed), we expect the savings could be roughly $15-35M per year once
implemented.100 Additional opportunities may also exist from in-sourcing some custodial and
receiving, storage, and holding activities.101
Figure 2.20: DeCA spend for third party in-store activities in FY14
In-sourcing operations of the deli / bakery and seafood departments could present another
opportunity. Combined these departments generated roughly $170M in sales in FY14 for DeCA.
Under the current structure, contractors bid to manage these departments based on their
proposed discount percentage to nearby competitors, with a minimum bid rate. Once awarded
the contract, they supply all labor and products (e.g., deli meat) to operate the department and
receive all department revenue except for the surcharge. As several of these contractors exist
solely to serve the military resale system, the industry clearly generates some margin or profit
98 Vendor stocking cost is part of COGS and passed on to patrons 99 $790M in total estimated labor spend includes $616M in DeCA payroll (salary and benefits), $147M in commercial activities contractors, and an estimated $30M in vendor stocking costs 100 Assumes a range of fully loaded cost for an in-sourced stocker of $23,000 - $44,000 (details outlined in Section 10.5.2.1) 101 In-sourcing presents an opportunity for DeCA because most of its contractor rates exceed the prevailing NAF wage rate. In such scenarios, private sector grocers either negotiate down their contractor rate or work to in-source activities.
In-store activity Spend ($M)
Shelf-stockingcontractors
$65M
Custodial services $59M
Vendor stockers $30M
Receiving, storing, and holding
$22M
Other grocery activities $1M
Total $177M
52
for the contractors. Assuming DeCA converts to NAF and can hire employees at similar wage
rates, DeCA could run these departments at similar price levels and use the margin to help
reduce its APF requirement. Assuming even modest margins of 2-5% for the contractors today,
this opportunity would be worth $5-10M annually. However, DeCA's fragmented store footprint
and small remote stores may present challenges when further evaluating and pursuing this
lever.
To achieve these savings, DeCA would need to increase labor capacity over time to in-source
activities completed by third parties today. Beyond cost savings, we believe these changes
would simplify the in-store labor model for store management, decrease out-of-stocks and other
execution errors, and provide DeCA patrons with a better overall shopping experience.
Furthermore, we believe DeCA can optimize its mix of full-time and part-time employees.
DeCA's share of full-time store level employees is greater than what we see in private sector
grocers. Today, 63% of DeCA's in-store employees are part-time, which is 7-12% less than the
70-75% range we typically see in the private sector. Furthermore, all DeCA employees receive
pro-rated benefits, even when working fewer than 30 hours per week. By shifting the labor mix
towards industry levels and shifting some part-time employees to a flexible, non-benefitted
status, DeCA could reduce store labor costs by $10--25M.
As these initial changes to the labor model are implemented, DeCA should reexamine its in-
store staffing model and processes to ensure they best serve its mission within the new
operating context. This reevaluation process should begin after DeCA has converted to NAF
and begun making the other organizational changes (e.g., in-sourcing contractor labor). A
comprehensive approach would look at all of the key labor processes, including the potential
DeCA-managed departments such as the deli, and examine their execution along a number of
dimensions (e.g., across stores, by time of day) to look for opportunities to further enhance
efficiency. This second phase of in-store labor redesign could likely allow DeCA to reduce costs
even more without harming the patron benefit.
53
2.5.3. Quick wins requiring no legislation
2.5.3.1. Local sourcing / Second destination transportation (SDT)
DeCA receives appropriated funds for second destination transportation (SDT) to ship
American goods to OCONUS commissaries (excluding Alaska and Hawaii). The goal of SDT is
to provide patrons overseas with commissary benefits comparable to what they would get in
the U.S. DeCA's total SDT execution in FY14 was roughly $150M. The largest categories of SDT
spend are sea shipping ($80M) and produce airlift ($38M) (see Figure 2.21).
Figure 2.21: Summary of SDT expenses at DeCA in FY14
We evaluated three options for DeCA to reduce SDT costs:
1. Increasing prices across all commissaries
2. Increasing prices only at commissaries that require SDT
3. Increasing the proportion of local sourcing
Our analysis suggests there would be substantial risk to patron benefit involved with the first
two options, and any change in price should be considered in the broader context of pricing
changes (see Section 6). However, there is opportunity to increase local sourcing.
54
The DeCA logistics directorate is currently pursuing initiatives to reduce the APF requirement
for SDT without increasing price. DoD has approved DeCA's plan to eliminate airlift and freight
forwarding by increasing local sourcing in the Pacific region.102 In addition, DeCA plans to
eliminate off-shore acquisition costs103 currently used to match U.S. prices for locally sourced
goods. These categories accounted for $47M in FY14 spend and would be eliminated by FY16.
Therefore, SDT for FY16 would be approximately $104M assuming there are no changes in
requirements in other SDT categories.
Our analysis suggests that DeCA would face challenges implementing local sourcing at a large
scale. Key challenges of local sourcing include DoD regulations that currently restrict local
sourcing,104 limited availability of comparable goods in overseas markets, and the need to build
capacity for overseas buying at DeCA. Overall, we believe that the potential upside from
extensive local sourcing is not enough to outweigh these challenges or the risk of impairing
patron benefit.
However, there are opportunities for DeCA to increase local sourcing through select "quick-
win" categories and avoid most of the risks and challenges discussed above (except the need for
DoD policy change). We conducted internal interviews with DeCA and considered each
category that DeCA currently ships overseas along dimensions such as availability of local
substitutes, cost of shipping, local prices, and shelf-life. Based on our review, bottled water,
soda, juices, and household cleaning goods are quick-win categories that DeCA should consider
sourcing locally. These categories could offer substantial savings relative to their retail value
because they are costly to ship.105 We also expect that local sourcing in these categories would
pose minimal patron impact given that these categories often have equivalent products
manufactured in the local market. Nevertheless, DeCA should test new locally sourced products
in select locations to limit any risk to patrons. Overall, we estimate that there is a $5-10M
potential APF savings opportunity through locally sourcing quick-win categories.
102 "Local sourcing" refers to replacing goods currently shipped from the U.S. with goods purchased from local markets overseas 103 DeCA currently uses appropriations to adjust the cost of locally sourced milk to match U.S. prices 104 DODI 1330.17 Enclosure 6 105 In FY14, the combined SDT cost for shipping bottled water and soda was approximately $4M
55
2.5.3.2. Goods not for resale (GNFR)
In FY14, DeCA spent $222M on GNFR. The largest categories of non-labor GNFR spend in FY14
included utilities, supplies (such as plastic bags and uniforms), IT / telecom, and services (see
Figure 2.22).
Figure 2.22: Summary of GNFR spend at DeCA in FY14106
DeCA's process for managing GNFR costs is robust and leverages many industry best practices.
For example, DeCA's contracting process involves market research, volume analysis, cost and /
or price analysis, cost estimates, sourcing reviews, acquisition strategy development, and
ultimately market competition and negotiation to ensure competitive pricing. Nevertheless,
based on our experience in the private sector, we anticipate further GNFR savings could be
possible through a targeted, multi-category GNFR renegotiation effort that is distinct from
normal day-to-day operations. These types of focused, highly analytical approaches consistently
yield results beyond what retailers achieve through normal procurement processes, so while
DeCA is already very focused on managing suppliers effectively, we believe there is still further
106 Contract labor excluded from GNFR baseline, addressed in store operations (See Section 10.5)
2015-06-30 Updated GNFR figures.pptx 0Draft—for discussion only
opportunity. Overall, we estimate DeCA could save up to 7-12% on its addressable GNFR spend
($123M) for potential savings of $10--15M.107
In the near-term, these savings may be on the lower end of the range due to APF contracting
restrictions. However, these savings may be at the higher end of the range over the long-term if
DeCA becomes a NAF entity subject to contracting requirements that are more aligned to
commercial activities. Because of the uncertainty around the exact timeline for capturing these
savings in a public sector context, GNFR savings have been excluded from the APF savings roll-
up. These savings are nevertheless worth pursuing.
2.5.3.3. Military Star card
The Military Star card is a store credit card operated by AAFES and the Exchange Credit
Program (ECP), which patrons can use to make purchases at any of the three exchanges.108
Military Star provides a benefit to cardholders compared to a traditional credit card through a
reduced APR and no annual fees, late fees or over-the-limit fees. It also offers in-store rewards.
The exchanges benefit from the Military Star card directly through finance revenue and
indirectly through avoided merchant fees and increased customer loyalty to the military resale
system.
Currently, DeCA is not authorized to accept the Military Star card. Both DeCA and the
exchanges could benefit from expanding the Military Star card to DeCA. The potential upside
in finance revenues for DeCA and the exchanges would depend on the structure of the
agreement DeCA makes with AAFES / ECP. Patrons would benefit through introduction of the
card by gaining greater access to the benefits of the card. AAFES believes that these two
benefits (increased finance revenue and patron benefit) could be worth up to $97–173M. The
U.S. Government would also benefit from avoided merchant fees from expanding the card.
Based on current Military Star card data, merchant fee savings are estimated to be $10-25M.
107 Utilities and "other" are the only GNFR categories excluded from addressable spend because they are not feasible to renegotiate. Contract labor involves significant labor regulations. Utilities are generally paid by the base and DeCA has no opportunity to renegotiate. "Other" consists primarily of base support. 7-12% savings estimate based on BCG experience from 77 GNFR projects in the last five years 108 The ECP's offering includes two credit cards: the Military Star card which is operated independently by the ECP and the Military Star Rewards MasterCard which is operated in partnership with Chase. For this discussion, we use the term Military Star card to refer to the independently operated card as well as the line of credit on the co-branded card which is linked to the ECP
57
To roll out the Military Star card, DeCA would need to secure permission from the Treasury to
accept the card. Once DeCA has authorization to accept the card, DeCA would need to work
with AAFES / ECP to integrate its point of sale (POS) system with the Military Star
infrastructure.
2.5.4. Longer-term opportunities requiring no legislation
2.5.4.1. Store hours
One of the ways DeCA has responded to budgetary pressures in the past is by reducing the
number of days and hours that stores are open. As a result, an average commissary operates
significantly fewer days and hours per week than an average private sector grocer (see Figure
2.23).
Figure 2.23: DeCA store hours compared to competitors109
Increased store hours would strengthen DeCA's value proposition as a convenient place to shop
and has the potential to grow sales through increased patron traffic and greater share of wallet.
109 Average open hours for grocery stores >20,000 sq ft (http://www.energystar.gov/ia/business/tools_resources/target_finder/help/Space_Use_Information__Supermarket_Grocery_Store.htm)
0
20
40
60
80
100
33(14%)
Weekly hours of operations
Number of stores
<40
93(39%)
40-50
7(3%)
43(18%)
15(6%)
70-8050-60 60-70
50(21%)
80+
DeCA median is 56 hours
compared with 134 hours for commercial grocers
58
In addition to growing sales, adjusting store hours could also benefit DeCA by reducing costs
associated with closing stores for one to two days per week (e.g., waste from spoiled
perishables). DeCA would only want to consider this opportunity once it has improved its
economics and is generating positive contribution margin on each sale.
2.6. Opportunities with trade-offs
2.6.1. Level of benefit: Pricing
As mentioned before, DeCA's cost-plus pricing helps provide a discount to patrons but results in
a number of challenges for the organization. Most importantly, cost-plus pricing contributes to
each sale at DeCA being a loss and growing the need for additional APF. Additionally, cost-plus
pricing results in an inconsistent discount across regions and categories.
We believe it is necessary for DeCA to move away from cost-plus pricing for the following
reasons:
1. Makes it possible for DeCA to "normalize" prices while keeping a similar overall
discount, resulting in more consistent savings across categories and regions
"Normalizing" prices means setting prices at a consistent discount to regional
benchmarks
2. Enables DeCA to create and execute a holistic pricing strategy to better serve patrons
and generate a positive contribution margin
3. Enables DeCA to capture the benefits from implementing other levers such as private
label and COGS
4. Allows for a nominal price increase to reduce APF, if deemed necessary in the future
As a first step, we suggest DeCA "normalize" prices110 across categories and regions in CONUS
by making savings consistent at an agreed-upon level (i.e., 16% – 21%).111 Although we expect
price normalization to require changes in the price of products, the overall discount level
should remain consistent. Some categories and regions may see moderate changes both up and
down from today's prices to reach the agreed-upon savings level, so measuring savings
110 Normalizing prices entails adjusting prices so that each region and category is in line with competitor pricing and there is less fluctuation in the savings rate across regions and categories 111 CONUS changes should have little to no impact on CONUS COLA as many regions do not qualify; OCONUS changes could be considered after normalizing prices as they may impact cost of living adjustment (COLA) as much as $50M+ (see Section 4.2 for more detail)
59
accurately, frequently, and transparently would be critical. That being said, the net impact on
the patron benefit should be neutral.
To test price normalization, DeCA would need to establish geographic pricing zones and decide
which competitor stores in each zone should serve as points of comparison. Then, DeCA would
need to agree on a target savings level versus selected competitors. We believe that keeping the
overall discount level consistent at 16-21%, which is the average discount off of the lowest and
second lowest-priced competitor in our sampled locations, could serve as an initial target level.
Finally, DeCA would need to select pilot stores for initial testing. While price decreases would
directly benefit patrons, some categories that are currently under-priced relative to the market
(most notably meat) would likely increase in price. There is some risk that price changes could
affect key items driving patron traffic, so DeCA's pricing team should continuously monitor
patron response to these gradual price change tests. After learning from the pilot stores, DeCA
should roll out normalized prices across CONUS locations. We expect the full process, from
testing in pilot stores to full-scale roll-out, to take approximately 12-18 months.
Normalizing prices and establishing a consistent discount should not necessarily be DeCA's
long-term pricing strategy, but it is a critical first step towards developing a more effective
pricing strategy. A consistent savings level across geographies and categories could likely help
DeCA in a number of ways. Patrons would likely move more of their shopping to the
commissary because they would be confident in the value of whatever they buy, in any
commissary location. Then, when at the commissary, patrons would be more likely to purchase
additional categories where the commissary offers a less compelling discount today. Overall,
these changes in patron perception and behavior could help grow DeCA's traffic, share of
wallet, and margin.
After normalizing prices across regions and categories, DeCA might be able to execute nominal
price increases if government decision-makers deem it necessary to do so. However, we do not
recommend any price increase at this time.112 If pursued in the future, it will be important to
carefully test any potential changes before rolling them out to all stores. After normalizing
112 See Section 4 for more detailed discussion on the risks of a price increase
60
prices, a 1-3% price increase could contribute $30-90M towards APF reduction.113, 114 If combined
with the introduction of private label, DeCA could reduce the overall cost of the patron's basket
even with a small price increase. Regardless of whether government decision-makers choose to
pursue price increases, moving away from cost-plus pricing is critical to achieving many of the
opportunities available to DeCA.
2.6.2. Access to benefit: Patron base expansion
After DeCA stores begin to generate a positive contribution margin (meaning each incremental
sales dollar generates margin in excess of its store-level costs),115 its APF requirement could be
further reduced by increasing sales. One way to grow sales would be to expand commissary
privileges to a broader population of military-affiliated personnel (e.g., on-base Federal civilian
employees, veterans serving in the executive branch). Stores would need to be both profitable
and prepared for increased traffic, so we recommend that DeCA wait until after the remaining
transformation levers have been executed before exploring this potential opportunity.
2.7. Consolidation of the military resale system
2.7.1. Overview of the exchanges
In addition to DeCA, there are three service-aligned retail organizations ("exchanges") in the
military resale system. AAFES (HQ in Dallas, TX) operates exchanges on Army and Air Force
installations, NEXCOM (HQ in Virginia Beach, VA) operates exchanges on Navy installations,
and MCX (HQ in Quantico, VA) operates exchanges on Marine Corps installations. 116 These
organizations operate a diverse global set of retail formats, ranging from Main stores (which
resemble department stores) to Marts (which resemble convenience stores) to quick-serve
restaurants. Although the exchanges operate in very similar businesses, the individual
exchanges have differences in their branding, store layout, and assortment. All of the
exchanges focus on delivering patron benefit through service and convenience, discounted
products, and a contribution to morale, welfare, and recreation (MWR) activities. See Section
8.1.1 for more detail on the exchanges.
113 Assumes a 1-3% increase on the all-in price today (including surcharge) on CONUS locations only and elasticity of -5 based on patron survey 114 DeCA should consider any price increases with the impact of normalization, which may also have resulted in price increases in certain regions and categories 115 COGS plus any associated store-level costs (e.g., adding additional labor for higher sales volume) 116 MCX does not have a separate HQ like DeCA, AAFES, and NEXCOM. The Marine Corps NAF Business and Support Services Division oversees MCX
61
2.7.2. Introduction to consolidation
As part of the study objectives, we were asked to develop a recommendation on whether to
pursue consolidation within the military resale system. We view consolidation as a question on
whether the broader military resale system can more efficiently and effectively serve patrons
by combining either the military exchanges or the military exchanges with DeCA in some form.
Regardless of how government decision-makers decide to proceed with consolidation, we
believe DeCA can and should pursue its own improvement initiatives.
Consolidation within the military resale system has been studied and debated over the past 25
years and received significant attention in recent months with the release of the Military
Compensation and Retirement Modernization Commission (MCRMC) report.117 While we
reviewed many of these studies as background, our focus was to conduct our own diligence and
analysis of the relevant facts.118
Throughout our consolidation assessment, we leveraged our extensive experience with retail
integration and government transformations.119 We also worked closely with key stakeholders
at DeCA and the exchanges to leverage internal data and apply the most realistic assumptions
available. We evaluated a range of consolidation options and estimated the potential synergies
and one-time costs of each. 120 In addition, we developed a recommended path forward for the
consolidation of the military resale system, including a high-level timeline, evaluation of
integration requirements, and potential governance structure.
We have organized our analyses around four key questions:
a) What are the consolidation options?
b) What are the potential synergies and costs of each consolidation option?
c) What are the broader implications for the military resale system and patrons?
d) What is the best way to approach governance and integration?
2.7.3. Consolidation options and retail merger background
117 Report of the Military Compensation and Retirement Modernization Commission, January 2015 118 See details in Section 8.1.4: Past studies 119 BCG has done over 500 post-merger integration related projects worldwide in the last five years 120 The financial benefit achieved through the combining of companies
62
Consolidation generally makes the most sense when it involves entities with similar business
models and strategies. The more alike the businesses are, the greater the synergies tend to be.
In addition, there are always intangible factors that affect whether a merger or consolidation is
successful, such as how well the cultures and leadership of the organizations work together,
how effectively the governance model functions, and how well the leadership manages the
integration. We have applied these considerations as we evaluated the consolidation options
and sized the sources of potential synergies and costs. While we have attempted to quantify the
potential benefits and costs to the greatest degree possible, we have also considered the
broader impact on the military resale system and patron benefit, much of which is necessarily
qualitative.
There is a spectrum of options for consolidation that the military resale system could undergo.
These options range from enhancing collaboration among the separate entities, to partial
consolidation (likely involving back-office functions), to full consolidation and integration of the
organizations. Moreover, consolidation could range from only the exchanges to DeCA and the
exchanges. Each option has different implications in terms of level of difficulty, cost, and
potential synergies. Ultimately, we believe the right approach is the option that delivers the
most benefit while minimizing unnecessary costs and negative impact to patron benefit. Any
consolidation plan should have sufficient financial return on investment (ROI), be feasible
given the nuances of the military resale system, and preserve or enhance the patron benefit.
To help evaluate different consolidation options, we looked at several successful examples
from the private sector that are instructive of differing approaches. In one major recent retail
merger, the acquiring company had a very similar business model as the acquired company.
This similarity implied a high degree of common capabilities, processes, and requirements
across the companies, from merchandising and store operations to back-office functions and
supply chain. Moreover, the store formats were similar enough that store banner consolidation
was an option. As a result, the acquiring and the acquired companies integrated completely to
form a single combined organization. Given significant overlap between the two businesses, the
merger produced a high level of synergies relative to its combined revenue (about 4%). This
example has some similarities to what a consolidation between the exchanges might look like.
On the other hand, a different retail merger involves two companies with different store
formats. While the two retailers target similar customer segments, they operate different
63
formats with fundamentally different product offerings. Given the differences, store
consolidation has little synergy potential and high risk. However, back-office, COGS, and GNFR
savings are still available. This consolidation has announced approximately 2% in expected
synergy (as a percentage of combined revenue). This example could be analogous to
consolidation of DeCA and the exchanges.
These two instances of post-merger integration121 (PMI) in the retail sector are helpful examples
of how a consolidation in the military resale system could happen. Specifically, like the first
example above, the exchanges have very similar organizational needs and operate in the
similar retail formats with similar value propositions. While each exchange has a slightly
different focus, we believe that potential differences do not overshadow the synergy potential.
For example, the exchanges have a high degree of category overlap, mainly differing in branch-
specific items such as uniforms. Consequently, we believe there are substantial potential
synergies from consolidating merchandising functions, in particular in terms of COGS sourcing
efficiencies.122
In contrast, DeCA and the exchanges operate in two different retail spaces (i.e., grocery versus
convenience and department stores) and have very different business models. While they
overlap in footprint (all operate on military bases), the difference in store formats implies that
store consolidation would have limited value. Further, DeCA and the exchanges have limited
category overlap and have different supply chain requirements such as shipping frequency and
shipping conditions (e.g., dry, chilled, frozen). Therefore, we do not believe that the integration
of store operations, merchandising, or supply chain of DeCA with the exchanges would be
feasible.
Nevertheless, many of the back-office functions (such as finance, IT, procurement, and HR) at
DeCA and the exchanges are relatively similar and would benefit from consolidation. If DeCA
converts to a NAFI, there are many capabilities, processes, and systems that would need to be
updated or built to support NAF operations (see Section 7.3). In a consolidation scenario,
DeCA would be able to leverage the exchanges' existing NAF capabilities rather than having to
build them from scratch. While there would be some cost associated with consolidating back-
121 The integration of the business operations of the acquiring and the acquired companies 122 Consolidation of merchandising functions does not necessarily imply homogenization of branding or store assortments
64
office functions and its timing would need careful consideration, we believe the logic for back-
office consolidation is strong.
2.7.4. Potential synergies and one-time costs
We believe that the right path forward for the military resale system involves consolidation of
the exchange back-office, merchandising, and supply chain functions, with eventual integration
of DeCA's back office (including finance, IT, HR, and indirect procurement). We estimate that
this form of two-step consolidation would result in annual run-rate savings of $215-325M for the
military resale system. 123
To assess the potential synergies from consolidating the military resale system, we evaluated
five dimensions that represent the largest savings opportunities:
Retail goods sourcing
Goods not for resale (operating expense)
Goods not for resale (Capex)
HQ resources (including both back-office and merchandising)
Supply chain
For each dimension, we evaluated the synergy for exchange-only consolidation and DeCA /
exchange consolidation by calculating addressable spend and estimated savings based on our
previous retail merger experiences (see Figure 2.24, and Section 8.2.2 for detail by synergy
lever). As we developed these synergy estimates, we also considered the nuances of the military
resale system, such as some of the limitations placed on both the NAF and APF models
discussed above. To the extent possible, we accounted for the subtleties involved in
consolidation within a government context. Furthermore, we have attempted to account for the
potential loss of efficiency involved in decoupling MCX from MCCS by assuming no synergies
from MCX.
123 Operating expense synergy of $200-295M, capital expenditure synergy of $15-30M
65
Figure 2.24: Summary of consolidation synergies
In addition to tangible cost savings, we believe that consolidation presents opportunities for
revenue upside. For instance, we believe that eCommerce is an underutilized channel for the
exchanges. The exchanges currently operate separate eCommerce operations and are therefore
not taking advantage of potential scale benefits. 124 By coordinating eCommerce investments
across the exchanges, the consolidated organization would likely have an opportunity to
expand the online channel.125
Achieving the above consolidation benefits would require an upfront investment. The proposed
consolidation scenario assumes one-time costs of $155-255M spread across four years (see
Figure 2.25). The main cost buckets for consideration include personnel (including relocation,
retention, and early retirement costs), systems integration, supply chain integration, inventory
write-offs, and PMI resources. We estimate the one-time costs in each of these categories by
124 Note that MCX uses AAFES platform but has a separate portal website 125 AAFES is already considering a plan to expand online shopping benefits to all honorably discharged veterans through the Veterans Online Shopping Benefit. Consolidation would enable the exchanges to pool together their resources to serve a broader online patron base
Key categoriesAddressable
spend ($M)
Savings
potential ($M)
Addressable
spend ($M)
Savings
potential ($M)
Savings
potential ($M)
Retail goods
sourcing
(COGS)
5,087 50 - 80 6,561 70 - 100 50 – 80
GNFR sourcing
(operating
expense)
408 20 - 40 531 25 - 50 25 – 50
GNFR sourcing
(capital
expenditure)
79 10 - 20 138 15 - 30 15 – 30
HQ resources 247 70 - 90 321 100 - 130 100 – 130
Supply Chain 237 25 - 35 303 30 - 45 25 – 35
Total 215 – 325
Exchanges Exchanges + DeCA Recommended
option
66
leveraging category-specific synergy benchmarks from our recent retail merger experiences and
applying them to the military resale context. Of these cost buckets, systems integration costs
have the widest potential variance. However, we believe that the business case for
consolidation remains strong even if the actual system integration costs land in the upper end
of our estimated range.
Figure 2.25: One-time implementation costs for consolidation by year
We estimate that the savings from consolidation would fully offset one-time costs in each year.
Nevertheless, temporary funding may still be required to make early investments (e.g., one-
time costs in Q1 which may not be offset by savings until Q4). Policymakers would need to
consider how DeCA and the exchanges could secure temporary funding to finance the one-time
cost of consolidation. The first option is that government decision-makers could approve a
special, one-time APF payment for each year of consolidation activities. Second, the exchanges
could reduce MWR dividends and retained earnings. This path would impact the broader
military community and possibly delay consolidation while sufficient profits are retained.
Third, DeCA and the exchanges could issue debt. This option would require a careful
Library of Figures-07July15-RB-v07.pptx 15Draft—for discussion only
System integration Inventory write-off PMI resourcesSupply chainPersonnel
67
consideration of the potential impact of debt issuance on future financing costs. Of the three
options, a one-time APF payment comes with the least risk and is the simplest approach.
Regardless of how the consolidation would be financed, the military resale system would need
to communicate its funding plan clearly.
We believe that a merger generally has a favorable business case if the annual savings run-rate
exceeds the one-time cost, which we anticipate would be the case. Additionally, our synergy
and one-time cost estimates suggest that consolidation would pay for itself by the end of the
first year of implementation. Finally, key buckets that drive up costs in private sector mergers,
such as severance, legal fees, change-of-control costs, and banker fees, are negligible in the
public sector context. Therefore, we believe that the cost / benefit analysis presents a
compelling case to move forward with consolidation.
2.7.5. Approach to governance and implementation
Consolidation of the military resale system would require careful planning and focused
leadership to execute. To help manage the complexity and increase the likelihood of capturing
the expected synergies, a phased approach with a clear governance structure would be critical.
The following guiding principles from best practices in merger governance would help ensure
that the consolidation realizes the value for patrons and the military resale system as quickly as
possible while managing the risk involved:
1. Start with a comprehensive planning phase to align transition needs across functions
and prepare a detailed plan for each component of consolidation
2. Prioritize areas with the highest ROI and greatest ease of implementation
3. Consolidate the exchanges before integrating with DeCA to minimize complexity and
provide an opportunity for DeCA to learn from the exchange consolidation experience
4. Avoid consolidating areas where there is little or no value to be captured
Given these guiding principles, we suggest a potential implementation timeline involving at
least three phases (see Figure 2.26 for timeline and Section 8.3.3 for more detail):
A planning phase, in which the governance board, leadership, and integration execution
teams would be selected. A first implementation phase, in which the exchanges would
consolidate their back-office functions and form a shared services business unit (SSBU),
in addition to consolidating their merchandising functions A second implementation
68
phase, in which DeCA would begin its process of NAF conversion and leverage the NAF
back-office capabilities of the exchange SSBU. In parallel, the exchanges could begin the
process of consolidating their supply chain and store operations
Throughout, the governance board and integration management office (IMO) would be
responsible for coordination of each consolidating organization, change management,
and communication with stakeholders
Figure 2.26: Consolidation timeline126
Governance
At the beginning of the Planning Phase of consolidation, DoD should establish an independent
governance board and select leadership to oversee the consolidation effort from planning to
completion. This governance board would be accountable for the successful execution of the
entire consolidation effort. While the governance board is an important first step for the
consolidation process, DoD could execute the numerous DeCA specific opportunities even if the
governance board has not been established.
One approach to creating this governance board would be to include members from the four
existing boards of directors of DeCA and the exchanges in a single entity.127 In doing this, DoD
126 SSBU refers to Share Services Business Unit
Independent levers
NAF conversion
Back-office
integration
Back-office
integration
Merchandising
integration
Supply chain
integration
NAF conversion begins
DeC
AE
xcha
nges
Pricing, Private Label, COGS
NAF conversionConversion
preparation
Integration
preparation
GNFR Store operations
SSBU transition
Integration
preparation
Additional transition time
Integration
preparation
Merchandising transition,
COGS efforts
Launch SSBU
Planning Implementation Phase I Implementation Phase II Beyond
Store
hours
SSBU transitionIntegration
preparation
Additional preparation
Additional preparationSupply chain integration,
optimization efforts
69
could give representation to each branch of the military. In addition, by leveraging existing
board members, the new board could leverage their experience in working with each
organization and create continuity from today's structure. This new board could then select the
new leader of military resale to oversee both the consolidation effort as well as the overall
future operations of the military resale system. The current organizations would then report
into this new leader. We would also suggest that the military resale leader report have a clear
reporting line to senior DoD leadership.
An important role of the governance board, integration leadership, and the IMO would be to
immediately focus on improving communication and collaboration across the military resale
system. For instance, we would recommend that the governance board ensure that DeCA and
the exchanges do not undertake investments, such as IT projects or building new facilities,
which are not consistent with the interests of the broader military resale system. Similarly, the
governance team should actively promote greater sharing of data and best practices across the
organizations.
2.7.6. Broader implications on the military resale system and patrons
Aside from the business logic of different consolidation scenarios, we also investigated other
implications of consolidation. In particular, we investigated the intangible and cultural impact
on patrons, employees, and the stakeholders of the military resale system.
1. Implications for patrons
We recognize that there are some potential risks to patron benefit to consider along with the
overall business case for consolidation. For instance, consolidation of the merchandising
function at the exchanges may call for some assortment harmonization to achieve maximum
synergies. Consequently, the combined exchange might be less able to support a customized
assortment for each service and each type of store. However, this patron impact could be
minimized by maintaining different store formats where relevant and allowing variations in
planograms where important to patrons.128
127 Note that MCX does not have its own governance board; the MCCS governance board oversees MCX as well 128 A planogram is a visual representation of how and where specific retail products should be placed on store shelves or displays
70
Additionally, consolidation could impact patrons if it limits the ability of the exchanges to
execute any of the numerous programs they have today that support the communities they
serve, for example, MCX's motorcycle safety program and AAFES' and NEXCOM's school lunch
programs. Consolidation does not need to negatively impact these programs and activities.
Meeting the needs of military servicemembers and their families should always be a core part
of the culture of the military resale system. We believe that consolidation could be executed in
a way that preserves this focus and prioritizes agility. In addition, to the extent that the
combined organization would have improved capabilities across functions, their ability to
respond to the needs of the military could improve. Therefore, while any change involves risks
to these important cultural elements of the exchanges, we believe they could be mitigated.
2. Implications for employees and other stakeholders
Consolidation could potentially involve substantial impact on the current employees of the
exchanges. We believe that the governance team can mitigate this impact by choosing a
consolidation path that balances equity and fairness with synergy attainment.
First, avoiding the use of involuntary separation would minimize adverse impacts on existing
employees. The combined organization can transition through judicious use of relocation
assignments, early retirement incentives, and attrition. Furthermore, the governance board and
integration management office should reduce uncertainty for the employees as much as
possible by communicating consistently about the vision for consolidation, specifically
highlighting any planned changes to the organizational structure.
In addition, consolidation may result in some loss in the connection that the exchanges
currently have with their respective military branches. To mitigate this risk, we believe it is
important to have a store-level management structure that would continue to maintain a close
relationship with each installation commander. In addition, each service should be represented
in the governance board to ensure they have oversight and input into the direction for military
resale.
Consolidation of the military resale system would present policy questions surrounding how to
allocate resulting synergies. There are at least three options for stakeholders to consider,
including increasing MWR dividends, reducing the level of APF for military resale, and
enhancing patron benefit through greater savings. Policymakers will need to carefully evaluate
71
these options to ensure equitable distribution of synergies to the military resale organizations
and patrons.
2.8. Roadmap to move forward
While previous sections have suggested a path forward for individual topics, we believe it is
important to articulate an overall roadmap for how the military resale system could move
forward. The magnitude of change required to do all or most of what is contained in this study
should not be underestimated. It will require significant legislative / policy changes, necessitate
building new capabilities, and impact the broad set of stakeholders who support or work with
the four organizations in the military resale system on a daily basis. As with any large-scale
change, there is always a risk that the service provided could be disrupted if the change is not
managed properly. While we see a very manageable level of risk to patron benefit from most of
the levers discussed above, there needs to be a major focus on ensuring the military resale
system continues to deliver throughout the period of change.
Planning for a large change effort should start with clear guiding principles to manage the
change and make decisions. While DoD team responsible for moving forward should own the
guiding principles for this effort, some important principles we would suggest considering and
that we have incorporated into our own thinking about the roadmap are:
Ensure the patron benefit is maintained or enhanced unless there is a deliberate
decision to make a change to it (e.g., if government decision-makers decide to raise
prices in a manner that significantly impacts patron benefit)
Be transparent in communication and decision making to minimize the uncertainty for
stakeholders, especially the employees of each organization and patrons
Balance speed with appropriate phasing in areas where there is risk, such as
consolidation or moving away from cost-plus pricing
Test wherever possible to understand impacts on a small scale before rolling out
broadly (e.g., a new DeCA pricing strategy)
Prioritize initiatives based on impact, and focus on tangible and sustainable
improvements in early phases
With these principles in mind, we would suggest the following approach to move forward with
the study objectives as well as other opportunities we identify in Figure 2.27. Our roadmap
72
presents the full set of activities necessary for the DoD to pursue all of the recommended
initiatives, including consolidation. However, it is entirely possible for DeCA specific initiatives
to move forward independent of consolidation. DoD could pursue these opportunities
regardless of decisions on consolidation and the governance board. Therefore, the roadmap
should be interpreted as an ideal state plan to accomplish all recommended initiatives for the
military resale system, acknowledging that DeCA can take action on many initiatives without
the full governance structure.
Figure 2.27: Military resale system roadmap
As shown in this roadmap, we believe that given the complexity of change, a planning phase
would be needed for both DeCA and the exchanges. This planning phase would give DoD a
chance to establish the governance board, develop a change management plan for the effort,
onboard the appropriate teams to own each workstream, and create detailed plans to guide the
work in an efficient and coordinated way. In addition, there may be some early quick wins for
DeCA that can move forward during this initial phase, such as renegotiating GNFR. DeCA can
also prepare for the legislative / policy changes required during this time. This initial planning
phase is important regardless of what subsequent phases look like.
Implementation Phase I Implementation Phase IIPlanning Phase
DeCA
Prepare to launch "win-wins"
enabled by variable pricing
• Plan for implementation• Secure legislative changes
Build GNFR fact base and begin
first wave of opportunities
Continue local sourcing efforts
and add quick win categories
Pursue "win-win" opportunities
• Introduce variable pricing and test "normalized" prices
• Secure legislative changes• Develop NAF general ledger
and map back-office processes
Continue executing "win-wins"
Begin converting to NAF and
pursuing related opportunities
• Convert personnel to NAF with incentives and attrition
• Redesign labor model, including in-sourcing contract labor
Transfer NAF back-office
functions to exchange SSBU
Exch.
Prepare for back-office
consolidation
• Develop functional plans, synergy estimates, etc.
• Build fact base for IT integration
Consolidate back-office functions
• Transfer HR, IT, finance, and contracting capabilities to SSBU
• Integrate back-office IT systems• Align organizational structure
Prepare to consolidate
merchandising and supply chain
Consolidate merchandising and
supply chain functions
Stabilize back-office SSBU and
integrate DeCA
Begin to migrate headquarters
• Initiate relocation process
Launch consolidation
Approve variable pricing
Approve and begin
DeCA NAF conversion
73
In thinking through how to phase this effort beyond the Planning Phase, the first important
aspect to decide is how to approach consolidation given the magnitude of change it could
involve across both DeCA and the exchanges. In the interest of acting expeditiously but in
phases, we believe that the right step in Implementation Phase I would be to consolidate the
back-office functions of the exchanges (as discussed earlier). This step alone would require
significant effort and have broad impacts. Therefore, it would be advantageous to complete this
integration first before attempting any broader consolidation (e.g., incorporating DeCA's back-
office functions).
After the Planning Phase, DeCA could start down the path of transformation by moving away
from cost-plus pricing and capturing the broader value this change unlocks, including COGS
renegotiation and the introduction of private label. These efforts would have significant
downstream implications for how DeCA merchandises and prices, manages its relationships
with brokers and distributors, and approaches its finances. When DeCA is no longer required to
price using cost-plus, it would be possible to generate a profit on each incremental sale that can
be used to fund operations and reduce needs for APF. This would be challenging and complex,
but we view it as a necessary and manageable first step to reduce APF and improve patron
benefit.
The timing of NAF conversion is also a major decision for DeCA. Given the magnitude of
change implied by our suggested first phase, and assuming successful efforts to secure legal
authority for conversion from government decision-makers, we believe NAF conversion should
be the core focus of Implementation Phase II for DeCA. This would give DeCA time to plan for
and solve the major challenges associated with NAF conversion. This would also give the
exchanges time to execute back-office consolidation so that they are in a position to service
DeCA's NAF back-office needs once it has converted. We believe that DeCA should aim to
officially convert to NAF at the beginning of Implementation Phase II and then manage the
transition to NAF over time and through attrition. NAF conversion would unlock further
opportunities for DeCA to reduce its need for APF, including streamlining store labor,
rethinking DeCA's approach to outsourcing (such as deli / bakery), adjusting store hours, etc.
At the same time, we think the exchanges would then be ready to take the next step in
consolidation during Implementation Phase II. This would likely involve integrating more
functions such as merchandising, supply chain, and store operations, and further streamlining
74
and integrating key business processes. However, we would expect the exchanges to continue
to maintain separate banners and would not see any change in the stores aside from changes in
assortment where it is economically advantageous and they have minimal patron impact.
It is important to note that this roadmap is entirely dependent on when decisions are made and
required legislation / policy is changed, so assigning specific dates and even firm timing is
impossible at this point. We strongly believe that this is a multi-year journey that would require
significant resources and coordination to execute. However, we believe this is the right
approach that balances our guiding principles for the change effort, continues to deliver patron
benefit, and begins to reduce needs for appropriated funds. Once this transformation is
complete, a unified military resale system will leverage its full scale and coordinated leadership
to provide a valuable benefit to patrons and their families in the most sustainable and efficient
way possible.
2.8.1. Summary of patron impact
The military resale system provides numerous benefits to its patrons today. Patrons view the
commissaries and exchanges as critical components of their overall compensation, and many
see military resale as a part of what allows DoD to maintain an all-volunteer military. Our
patron survey confirmed the importance of these programs, highlighting high share of wallet
and satisfaction among current commissary patrons.129
We believe the majority of our improvement levers present limited risk to this patron benefit.
Some of these levers would further enhance patron benefit. For example, moving away from
cost-plus pricing while introducing private label products and renegotiating COGS would result
in greater savings for patrons and an improved outcome for DeCA (see Figure 2.28).
129Commissary users spend 65% of their total grocery budget at DeCA (unweighted N = 13,095); 68% rate the commissary as "better" or "much better" than their nearest competition (unweighted N = 2,336). Source: May 2015 BCG patron survey
75
Figure 2.28: Illustrative example of "win-win" scenarios130
To evaluate the full set of patron impacts, we looked across five major areas of benefits
provided today:
Savings offered at DeCA131
Military exchanges' contributions to MWR
Service on base, providing convenient access to a variety of American products
Employment of military-connected individuals
Mission support through additional programs (e.g., school lunches)
Though some potential initiatives (e.g., price increase) may negatively affect employees or
patron benefit, there are numerous ways for DeCA to mitigate these impacts (e.g., executing
workforce changes through attrition, gradual testing of price changes). Furthermore, the vast
130 Cost savings and price discount assumptions based on experience with other food retailers —nearly 350 projects with grocers in the last five years 131 The savings offered at the military exchanges would not be affected and are out-of-scope for this study
76
majority of initiatives will result in positive or neutral impact on all facets of patron benefit,
outweighing the potential risks (see Figure 2.29).
Figure 2.29: Patron impact summary
Overall, these changes should result in even greater savings and a better shopping experience
for DeCA patrons. The combination of moving towards a more consistent pricing strategy,
introducing new products such as private label, and improving the execution of service in stores
will make the commissary a more attractive place to shop, increasing the number of eligible
patrons utilizing the benefit and the frequency they shop. In addition, consolidation would
increase earnings for the military exchanges and generate greater contributions to MWR
programs. Overall, we expect the military resale system as a whole could grow share of wallet,
revenues and profit margin while maintaining or enhancing patron benefit.
77
2.8.2. Expected economics over time
Figure 2.30: Expected economics over time (assumes midpoint of all savings ranges)132
By looking at the run rate impacts of the various APF reduction opportunities by phase, we can
see that removal of cost-plus pricing (which will enable DeCA APF reduction opportunities in
Implementation Phase I) is expected to have the largest impact on DeCA's economics. Prior to
any legislative change, DeCA can drive an APF reduction of $60M with minimal cost by pursing
quick wins (i.e., increasing local sourcing, reducing GNFR costs). Roughly $310M in savings can
be driven by full implementation of DeCA Implementation Phase I initiatives including
introduction of variable pricing, introduction of private label, improving merchandising,
reducing COGS, and reducing Capex. Back-office consolidation at the exchanges in
Implementation Phase I is expected to have a net run rate impact of $80M. Once DeCA has
approval to convert to NAF, DeCA would be able to pursue Implementation Phase II APF
reduction opportunities to drive an additional $175M in APF savings. Full realization of
consolidation in Implementation Phase II (including integration of DeCA back-office functions
132 APF impact shown versus FY 14 APF budget ($1,366M). Actual budget execution in FY14 was $1,300M. Note: incorporates the midpoints of ranges in opportunity size. Slight difference compared to Figure 1.1 and Figure 2.12 due to rounding
78
with the exchanges) would drive an additional economic benefit of $190M , for a cumulative
benefit of $270M for the military resale system.
It will also be important to consider how to account for the savings generated by DeCA and the
exchanges. Depending on the opportunity, savings may have to be treated differently. We have
classified savings opportunities into four categories:
Direct APF savings – These savings would directly impact DeCA's APF requirement
under current legislation and policy
APF savings requiring variable pricing and flexible funds – These savings would reduce
DeCA's APF requirement if DeCA is allowed to variably price and has greater flexibility
in how to allocate the margin earned on sales (i.e., no surcharge restriction)
Exchange NAF savings – These savings would flow to the exchanges and could be used to
increase MWR dividends. Separate action would be necessary if government decision-
makers wanted to use any of these savings to offset APF
Decision required to allocate savings – There is no obvious answer to how these savings
would be allocated based on today's rules and regulations. Government decision-makers
would need to make a decision on how to balance offsetting APF and increasing MWR
Figure 2.31: Summary of savings opportunities by accounting category
Direct APF savings
$M
APF savings requiring variable
pricing and flexible funds
$M Exchange /
NAF savings $M
Decision required to
allocate savings
$M
NAF conversion
Adjust wages and benefits
Adjust labor mix (part-time / flex)
95-155
10-25
Improve merchandising and reduce cost of goods sold
110-165 Exchange consolidation
175-265 DeCA back office consolidation
40-60
Improve store operations
20-45 Rationalize surcharge / Capex
70-100 Expand Military Star card
Local sourcing 55-60 Introduce private label
60-120
Increase price (1-3%)
30-90
Total 1180-285 Total 270-475 Total 175-265 Total 40-60
79
Section 3: Study Methodology
This study originated from a congressional request to "develop conclusions to address the
qualitative and quantitative effects, including risks and benefits, of the Defense Commissary
Agency (DeCA) generating revenue to reduce appropriated funding for operating the defense
commissary system."133 To accomplish this, the Office of the Undersecretary for Personnel and
Readiness (P&R) and the Government Services Administration (GSA) submitted a request for
quotation (RFQ) to identify an objective partner with deep grocery and retail expertise and a
strong understanding of government operations to thoroughly analyze and diagnose
opportunities for DeCA and the broader military resale system.
The Boston Consulting Group (BCG) was awarded the study contract in early 2015. BCG is a
global management consulting firm with extensive experience in retail and the public sector.
Our customized, objective approach combines deep insight into the dynamics of companies and
markets with close collaboration at all levels of the client organization. Founded in 1963, BCG is
a private company with 82 offices in 46 countries.134
The RFQ organized deliverables into six main study objectives: 135
1. Using variable pricing in commissary stores to reduce the expenditure of
appropriated funds to operate the defense commissary system136
2. Implementing a program to make available private label products in the
commissary system137
3. Eliminating or reducing appropriated second destination transportation (SDT)
funding associated with the transportation of goods to overseas locations
4. Converting the defense commissary system to a nonappropriated fund (NAF)
activity
133 See page 7 of RFQ PCBG-15-0001 134 For more information, see www.bcg.com 135 See pages 7-8 of RFQ PCBG-15-0001 136 "Variable pricing" refers to setting price independently of cost 137 We use "private label" to refer to offerings other than national brands that are sold exclusively at a retailer (e.g., Great Value at Walmart); includes range of potential offerings from opening price point to premium brands (see Section 5 for more detail); national brands are the most readily available nationally distributed brands sold in each category (e.g., Tide, Cheerios)
80
5. Consolidating all or part of the commissary system with the exchange system(s)
to achieve a lower combined operating cost and greater efficiencies, thereby
reducing appropriated funding requirements
6. Impact that elimination or reduction of the commissary subsidy would have on
eligible beneficiaries
BCG was given clear instruction to view the study objectives as required deliverables but not
the only areas to consider in developing a plan to reduce DeCA's need for APF. We applied a
customized mix of BCG's proven methodologies to understand the needs of patrons, evaluate
the performance of DeCA's operations, and assess the impact of potential changes to the
military resale system. 138 Our approach blended quantitative and qualitative research methods
to collect and synthesize data and insights into an objective set of recommendations
incorporating DeCA's mission, capabilities, and constraints. We also leveraged our deep retail
and grocery expertise to present relevant best practices for DeCA and the military resale system
to consider.
Throughout this study, the importance of maintaining an objective process has been repeatedly
emphasized by almost all stakeholders. We made every effort to listen to all perspectives, but at
the same time have focused on developing our own point of view.
At a high level, we approached the study in three phases (see Figure 3.1). We began in late
February 2015 and submitted the final study to P&R on July10, 2015. Given the significantly
compressed timeline compared to most other studies of the military resale system, we have
noted where additional analysis could be required in the future.
138 Some examples include large-scale quantitative customer research/survey, in-depth stakeholder interviews, scenario analysis and financial modeling, etc.
81
Figure 3.1: Overall project timeline
The first phase focused on working closely with DeCA and each exchange to collect granular
data on past and current operations. The second phase shifted to conducting the required
analysis for each study objective and additional retail levers. The final phase involved pressure
testing our findings and synthesizing them into a set of potential paths forward and a
recommendation on how to proceed. Highlights of the activities completed to support our study
included:
Interviewed over 100 stakeholders across DeCA, exchanges, and other DoD groups
Engaged over 20 senior BCG experts with 200+ combined years' experience in the public
sector, retail, consumer goods, and large-scale transformations
Collected and analyzed extensive operating and organizational data from DeCA and the
exchanges (e.g., sales, merchandising, personnel, store operations, etc.)
Conducted market basket study to capture competitive price data for representative set
of 50 items (branded and private label) from 51 U.S. markets
Surveyed approximately 14,500 eligible patrons to get feedback on each study objective
Visited 13 commissaries, six exchanges, and one ship store across several regions to
understand store operations and the typical patron shopping experience
Reviewed and collected insights from more than 20 previous reports
Benchmarked DeCA and military exchange metrics against BCG's extensive database of
comparable private sector organizations (all anonymized for confidentiality)
Collect internal data from DeCA and
exchanges
Compile internal benchmarking data
Conduct high-level diagnostics and
identify initial hypotheses
Interview key stakeholders across DeCA
and exchanges
Visit selected sites
Begin price data collection
Analyze data gathered to validate
hypotheses across study objectives
Investigate potential scenarios for
change, including savings, costs and
requirements
Gather input from key BCG experts
Conduct additional follow-up interviews
to pressure test findings
Gain approval for and launch large-scale
patron survey
Draft full report for validation
Analyze survey responses to
understand patron response to
recommended changes
Validate draft report with key
stakeholders
Finalize recommendations and full
study report
February-March 2015 April-May June-early July
Check-in Final reportDraft report
82
Our study primarily focuses on opportunities specific to DeCA.139 However, in many
circumstances the exchanges provide a helpful example of what could be achieved in a
different public sector retail model. To this end, we collected data and input from the
exchanges where relevant to better assess the opportunities for DeCA. For example, we looked
to the exchanges as a source of input on the private label topic since they currently have private
label offerings. Additionally, given the exchanges are NAFIs, they provided extremely helpful
input to help determine requirements for DeCA. Study objective 5 (consolidation) is closely
linked to the exchanges, so we collected more granular data from them to support our analyses
of the opportunities for consolidation across the military resale system.
Throughout the effort, DeCA and the exchanges have been very supportive and helped to
provide appropriate data for our analyses. They have also made themselves available for
numerous interviews and follow-up discussions. See summary of data sources in Figure 3.2.
Figure 3.2: Primary data sources
Primary data sources
All study objectives
Interviews with DeCA, exchange, and DoD stakeholders
Relevant previous studies
BCG experience with private sector retail and government transformations
Study objective 1: Variable pricing
BCG market basket competitor pricing data140
DeCA annual savings analysis
Nielsen competitive price data (provided by DeCA)
BCG patron survey
Study objective 2: Private label
Nielsen private label sales data
Exchange private label sales and margin data
DeCA POS data
BCG private label benchmarks141
Study objective 3: SDT reduction
DeCA FY14 SDT execution
Container cost by destination and shipment type
Number of containers by destination and shipment type
139 Study objectives 1-4 and 6 primarily relate to DeCA: Variable pricing, private label, SDT reduction, NAF conversion, and patron impact 140 Collected in 51 markets across the U.S. for this study (see Pricing section for detailed methodology) 141 Cost structure and margin from other BCG grocery private label efforts
83
Primary data sources
Study objective 4: NAF conversion
Indirect spend data for DeCA
Federal Wage Schedule for Richmond, VA area
Employee data for exchanges and DeCA
Special Federal Wage System survey by DCPAS
Benefits expenses for exchanges and DeCA
General Schedule and NAF pay band for Richmond, VA area
Store operations: Interviews with DeCA store directors, store visits, DeCA employee data, store data
Capex: DeCA historical surcharge fund execution, interview with head of DeCA engineering directorate, Booz Allen Hamilton 2014 report on DeCA engineering directorate
Military Star card: Interview with SVP of exchange credit program
Store hours: DeCA March 2015 sales by store by day, DeCA store open / close hours, BCG patron survey
Patron expansion: Dept. of VA 2014 veteran population, AAFES proposal to expand patron base, BCG patron survey, DeCA 2014 financials, DoD instruction 1330.17 Enclosure 2
Like most organizations, DeCA and the exchanges face some limitations that prevented us from
getting the full depth of data requested. Nevertheless, we have gained visibility into each
84
opportunity and have had access to substantial internal information, including detailed sales
and organizational data. See a summary of the key data limitations we encountered in Figure
3.3.
Figure 3.3: Data limitations and impact
Key data limitations Impact
Study objective 2: Private label
DeCA's POS merchandising hierarchy is different than Nielsen's
Difficult to compare Nielsen private label & DeCA value brand penetration
Study objective 4: NAF conversion
Limited availability of benefits data from exchanges split for full-time / part-time / flexible status
Difference between NAF and APF benefits cost estimated at overall level
Study objective 5: Consolidation
MCX is integrated into MCCS and cannot identify MCX-specific headcount within support functions
Cannot compare MCX support function headcount to other organizations
Limited availability of MCX indirect spend data
Indirect spend for MCX estimated using ratio from other exchanges142
NEXCOM and MCX SKU-level gross margin and UPC code for most SKUs not available; no SKU-level data available from AAFES
Consolidation COGS opportunity estimated at category level instead of SKU level
NEXCOM Capex not available NEXCOM Capex extrapolated based on ratios from other exchanges
Other opportunities
Organization redesign: DeCA does not maintain record of reporting relationships in its HR database
Unable to build full view of DeCA reporting structure or compare to organizational benchmarks
In addition to data provided by DeCA and the exchanges, we have leveraged BCG's experience
and network of experts across study objectives. Our deep expertise in private sector retail,
transformation, mergers, and the public sector supported our assessment of opportunities and
crafting of the roadmap and path forward. Where available, we have also used BCG
benchmarks to help size opportunities and pressure test our findings. BCG benchmarks
representing the average cost or benefit of an activity have been developed through years of
experience supporting private sector retail and other organizations. We have made adjustments
142 Estimated based on spend as a percentage of sales
85
where appropriate to account for the nuances of the military resale context.143 Areas where we
have leveraged benchmarking in our work are summarized below in Figure 3.4:
Figure 3.4: BCG benchmarks used in study
BCG benchmark Description of application
Study objective 2: Private label
Margin rate and price discount at other retailers for private label
Input to sizing of margin opportunity from introducing private label
Study objective 4: NAF conversion
IT complexity estimate by system Informed estimation of potential one-time costs
Study objective 5: Consolidation
Savings rate by synergy area (e.g., retail goods sourcing, GNFR, HQ resources, etc.)
Informed estimation of potential consolidation synergies
Cost assumptions by category (e.g., PMI support, supply chain, IT integration)
Informed estimation of potential consolidation costs
Other opportunities
Capex: Average grocer Capex as a % of COGS
Estimated Capex savings from DeCA aligning with industry norms
Finally, to assess patron impact across study objectives, we ran a large survey of eligible
military resale patrons.144 The survey instrument, invitation email, and proposed approach
went through a rigorous approval process in March – May 2015, with participation from the
Defense Manpower Data Center (DMDC), service branches, OSD privacy office, P&R Human
Research Protection Program (HRPP) manager, Washington Headquarters Services (WHS), and
OSD(P&R) Information Management Control Officer. After obtaining approvals, we received a
sample of approximately 400,000 email addresses from the DMDC balanced across
demographics (active duty, dependent, retiree, etc.), location (CONUS, OCONUS), military
branch, and rank. We supplemented this sample with additional patron email addresses from
DeCA, AAFES, NEXCOM, and MCX.
Concurrently, we established a new BCG subdomain and email address
([email protected]). We distributed the survey invitation from this email
address to roughly 620,000 potential respondents over the course of a one-month fielding
143 For example, in estimating the consolidation savings we adapted HQ resource reduction benchmarks to reflect the realities of DeCA and the exchanges (i.e., greater potential for HQ resource savings in exchange back-office functions, less potential in DeCA merchandising) 144 Our survey received all requisite approvals from DoD/DMDC/P&R and the military branches; assigned report control symbol DD-P&R(OT)2585
86
period (May 8, 2015 to June 8, 2015). We also sent several follow-up emails to under-
represented groups to help balance the overall survey sample. We received approximately
14,500 responses, marking a 2.5% response rate. Given the lack of survey incentive and short
fielding period, this response was in line with expectations established with the DMDC prior to
the survey.
The survey instrument asked respondents questions across a variety of topics. First, all
respondents answered a series of questions about their shopping behavior today. Then each
respondent proceeded down one of three randomly selected paths to gather more thorough
feedback on potential opportunities. The three deep-dive paths in the survey included:
1. Private label
2. Pricing
3. Commissary perception and category expansion
In summary, we leveraged these inputs to identify and evaluate a number of opportunities for
DeCA. Many are "win-win" opportunities that DeCA could pursue to reduce APF and protect or
enhance patron benefit. DeCA could pursue some immediately but most would require
legislative or policy change.145 Because these opportunities present potential trade-offs for
DeCA and the broader military resale system, these options will require careful deliberation by
stakeholders. In the subsequent sections, we clearly articulate the associated savings, tradeoffs,
and implementation milestones for each potential opportunity.
For any questions related to this study, please contact Kevin Kelly, Senior Advisor to the
Assistant Secretary of Defense for Readiness and Force Management at (703) 614-9454 or
145 For example, removing the cost-plus requirement and enabling DeCA to convert to NAF
87
Section 4: Variable Pricing (Study Objective 1)
4.1. Background
One of the main objectives of this study is to examine "using variable pricing in commissary
stores to reduce the expenditure of appropriated funds to operate the defense commissary
system."146 Before evaluating potential changes, we first build a detailed fact base on DeCA's
current pricing:
Cost-plus pricing and its impact on DeCA's economics
DeCA communicated savings and patron perception of discount
Alternate savings calculation based on representative market basket
After evaluating DeCA's cost-plus pricing approach and its impact, we explore how DeCA could
move towards a holistic variable pricing strategy, including accounting for patron sensitivity to
price changes. We then lay out a roadmap to illustrate how DeCA could execute proposed
changes.
4.1.1. Cost-plus pricing and its implications
DoD Instruction 1330.17 mandates DeCA to price all products at cost-plus a 5% surcharge
(referred to as "cost-plus" pricing). Per DoD Instruction 1330.17, DeCA's product cost includes:
1) The cost of the item itself from the supplier,147
2) Transportation / logistics to the store within CONUS,148
3) Vendor stocking for authorized categories, and
4) 1-7% markup to account for cost of shrinkage, spoilage, and pilferage149
As a whole, cost-plus pricing at DeCA is very different from typical pricing approaches in the
private sector (see Figure 4.1):
146 See RFQ PCBG-15-0001 147 The cost from the supplier is agreed upon per DeCA's resale ordering agreement (ROA), which stipulates that the annual average price of an item must be equal to or lower than similar supermarkets 148 Also referred to as "first destination transportation" 149 Percentage markup added varies by product category
88
Figure 4.1 Pricing approach at DeCA versus private sector grocers
DeCA Private sector grocers
Setting price
Prices are cost-plus 5% (costs generally determined by suppliers)
Prices controlled by retailer, who can vary level of margin
Prices based on multiple factors including customer willingness to pay, competitive intensity of market, and category roles150
Regional pricing
Most prices for scannable items151 consistent across CONUS, changed twice per month152
Locally sourced items such as fresh meat, produce, and dairy are priced regionally to account for variations in product cost
Prices set by zone,153 often changed multiple times per week
Regional pricing based on a variety of factors such as product cost, cost of living, and local competition
Sales tax Purchases exempt from sales tax Patrons pay sales taxes, but in most
states food not taxed
Promotional support
DeCA must pass all savings from promotional funding to patrons
In some cases, grocer has discretion to retain promotional funding for profit
Pricing capabilities
No dedicated pricing team
Not collecting granular or frequent competitive intelligence154
Dedicated pricing team (usually in merchandising function)
Collecting competitive intelligence to track prices
There are several benefits to DeCA's cost-plus pricing requirement. The biggest benefit is that it
is easy to execute. A private sector grocer of DeCA's size would likely have a pricing team with
between five to ten FTEs to analyze the impact of price changes, track competitor prices and
promotions, and develop, implement, and refine their pricing strategy. 155 Because DeCA simply
sells at cost-plus 5%, it does not require a dedicated pricing team or sophisticated pricing
capabilities. In addition to ease of execution, the cost-plus approach helps fulfill DeCA's mission
of providing a benefit to patrons by generally delivering savings versus competitor prices,
depending on the category and region (see Section 4.1.2).
150 "Category role" refers to a retailer's intended purpose for a category (e.g., competitively priced traffic driver to draw customers into the store) 151 Scannable means an item has a universal product code (UPC) and does not need to be weighed at checkout 152 Some promotional activity at DeCA increases frequency of price changes 153 Some retailers use multiple pricing zones within one metropolitan area 154 DeCA does leverage industry-standard competitor pricing data from Nielsen to calculate its savings rate 155 FTE refers to full-time equivalent (workload of a full-time employee)
89
At the same time, DeCA's cost-plus approach has significant drawbacks. First, even the most
cost-efficient stores (such as Fort Belvoir) are operating at a net loss because the 5% surcharge is
less than the approximate variable cost DeCA incurs from each sale (see Figure 4.2).
Figure 4.2: Approximate variable cost (as % of sales) versus FY14 sales156
The result is that as DeCA's sales grow, its APF needs also increase. This situation creates very
different incentives for DeCA than private sector grocers. For instance, private sector grocers
tend to increase open hours if patron demand exists. On the other hand, DeCA has reduced
APF needs by cutting store hours. As a result, DeCA stores are open significantly fewer hours
per week than the private sector.157
156 DeCA FY 2014 store data; Approximate variable cost based on DeCA's store-level operating expenses paid out of the Defense Working Capital Fund; predominantly comprised of DeCA store labor and contractors; includes only CONUS stores (169 of DeCA's 241 stores) 157 On average, DeCA stores are open a median of 56 hours per week versus 134 hours in the private sector (see Figure 2.23)
0
20
40
60
80
100
100806040200
Approximate variable cost (as a % of sales)
FY14 Sales ($M)
Ft. Belvoir
10%
Even DeCA's highest sales stores do not cover costs, suggesting
stores lose money on each
additional sale
90
Second, cost-plus pricing prevents DeCA from fully capturing the margin benefits from
reducing cost of goods sold (COGS).158 Under cost-plus pricing, any reduction in DeCA's COGS
would have to be passed directly to the patron. Reducing COGS would actually reduce the
surcharge collected because DeCA's prices would be lower (see Figure 4.3). As a result,
reducing COGS would not lessen APF needs, but rather increase them.
Figure 4.3: Example impact of COGS reduction at DeCA with cost-plus pricing
Example item
With 10% reduction in COGS
COGS $10.00 $9.00
Surcharge (5%) $0.50 $0.45
Price to patrons $10.50 $9.45
Increase in sales volume required to maintain surcharge
11%
Similarly, introducing private label, which generally increases margins while enhancing patron
benefit, would reduce the total surcharge collected and would not reduce DeCA's need for APF
in the cost-plus approach. Reducing COGS or introducing private label would obviously be
beneficial for patrons; however, DeCA's cost-plus requirement creates little reason to
proactively pursue these opportunities.159
Lastly, the cost-plus requirement prevents DeCA from pricing products in a way that reflects
each store's competitive position in its market or the differences in patron price sensitivity
across categories. For instance, a private sector grocer would take a very different pricing
approach in an area with a lower cost of living and higher competitive intensity than in a more
affluent area with less competition (see Figure 4.4). This likely undermines the patron
shopping experience by creating a high degree of variability in savings and consequently
reduces the share of wallet that DeCA could be earning from patrons.
158 Cost of goods sold refers to the price DeCA pays manufacturers or distributors for an individual product 159 See executive summary for more detail on "win-win" opportunities
91
Figure 4.4: Illustrative example of price differences between DeCA and competitors160
Prices for 33.9 oz Folgers Classic Roast Fort Hamilton, NY Oklahoma City, OK
DeCA $10.49 $10.49
Lowest priced competitor $13.99 $10.43
Savings at DeCA $3.50 (25%) -$0.06 (-1%)
4.1.2. Communicated and perceived DeCA savings
Before drawing any conclusions on what pricing opportunities might exist for DeCA, it is
important to understand the savings patrons currently experience. As mentioned above, cost-
plus pricing enables DeCA to provide a discount compared to competition. This is a very
important element of the benefit for patrons. Patrons cite value and low prices as the most
important reasons for shopping at the commissary (see Figure 4.5):
Figure 4.5: Patron rationales for shopping at the commissary161
160 Source: DeCA price reports and BCG store visits in March 2015; New York City prices from Ft. Hamilton commissary and C-town Supermarkets; Oklahoma City prices from Ft. Sill and Walmart 161 Only includes responses where reason for shopping was ranked as most important. Source: May 2015 BCG patron survey, unweighted N of 6,584
17
88
13
23
30
0
10
20
30
40
% of weighted respondents
Convenient location
Low prices OtherSupports the military
Value for the money
Meat quality and selection
What was the most important reason why you chose to shop at the
commissary within the past two months?
92
DeCA communicates savings of 30% on an
aggregate basis to its patrons.162 However, many
patrons feel that their actual savings are lower. Our
survey found that 62% of respondents view the
savings to be 10% or less (see Figure 4.6). These
findings are consistent with the 2012 Status of
Forces survey, which found that 73% of patrons
perceived savings at the commissary to be 10% or
less.163
Figure 4.6: Patron perception of commissary prices164
162 On its homepage, DeCA advertises that "Shoppers save an average of more than 30 percent on their purchases compared to commercial prices" (https://www.commissaries.com/about_us.cfm) 163 The Status of Forces survey gathers data from active duty and reserve component members 164 Question: "How do prices at the Commissary compare to other local grocery stores for the same products across all the items you buy?"; discount based on lowest priced competitor based on perceived discount. Note: Excludes all respondents that thought DeCA prices were at a 20% or greater premium than competitors. Source: May 2015 BCG patron survey, unweighted N = 6,930
Patrick Exhibitsv6.pptx 17Draft—for discussion only
How do prices at the Commissary compare to other local grocery stores?
6
98
11
12
1615
11
6
33
0
5
10
15
20
% of weighted respondents
11-20%6-10%1-5%Same price
1-5%6-10%11-20%21-30%31-40%41-50%>50%
1. Unweighted N = 6,930 2. Question: "How do prices at the Commissary compare to other local grocery stores for the same products across all the items you buy?"; discount based on lowest priced competitor based on perceived discount
DeCA cheaper DeCA more expensive
Patron perception of Commissary prices
93
Patrons' perceptions of savings also vary by rank, with active junior enlisted members reporting
the lowest savings and retirees generally reporting the greatest savings (see Figure 4.7)
Figure 4.7: Perceived discount by rank and status165
Given the gap between the perceived and advertised savings rates, it is necessary to better
understand how DeCA calculates savings today before determining any changes DeCA could
make to its pricing.
4.1.2.1. DeCA savings methodology
DeCA calculates its 30% savings with an annual study that compares prices at DeCA to prices at
private sector grocers, nationally. DeCA's study draws on sales data166 for over 30,000 scannable
165 Source: May 2015 BCG patron survey, unweighted N = 6,930 166 Data sourced from Nielsen, a third-party that collects units and sales data for most major retailers at the SKU (stock keeping unit, meaning unique item) level
Patrick Exhibitsv6.pptx 18Draft—for discussion only
>30% cheaper1-10% cheaper11-30% cheaper0-10% more expensive
11-20% more expensive
Implied
average7% 8% 8% 11% 16%
94
items and physical audits for non-scannable items and products in OCONUS markets.167 To
calculate savings annually, DeCA compares its 26-week168 average prices to average prices for
identical products at a wide range of competitors.169 DeCA determines average prices by
dividing each item's total sales dollars by the total units sold for products sold at both DeCA
and its competitors. Prices reflect the scanned price at the register, including promotional
prices.
To supplement this effort, DeCA conducts physical audits annually to estimate savings for non-
scannable categories (e.g., meat and produce) and for OCONUS locations. Within CONUS,
DeCA collects data for about 60 non-scannable items (25 meats, 35 produce) per store from two
competitors within close proximity of 30 randomly selected commissaries. For OCONUS
locations, DeCA conducts physical audits to gather prices on 200 items across a variety of
categories from two local supermarkets at 15 commissaries.
To calculate savings for scannable items in CONUS, DeCA does the following:
1) Multiply the units sold at DeCA for each item by the average item price at DeCA to
calculate total DeCA sales for each department
2) Multiply the units sold at DeCA for each item by the average item price at All Outlets
Combined to calculate total "competitor equivalent" sales170
3) Adjust sales amounts for the 5% surcharge for DeCA prices and average CONUS sales
tax for competitor prices
4) Calculate savings as –
For meat, produce, and OCONUS prices, DeCA does the following:
1) Determine an average price per item using data from the two sampled competitors
2) Adjust for the DeCA surcharge and local taxes
3) Calculate savings using the same formula as (4) above
167 "Scannable" products refer to items with barcodes, "non-scannable" items refer to non-prepackaged items (e.g., meat, produce, deli, etc.) 168 Period ending June 21, 2014 169 Using Nielsen's "All Outlets Combined" dataset, which includes all major supermarket chains, drug stores, dollar stores, supercenters, and club stores. Note that prior to the 2013 study, DeCA compared DeCA prices to what Nielsen calls "Remaining Market," which includes only traditional grocery retailers; the benefit of using "All Outlets Combined" is that it includes Walmart, the largest competitor 170 This amount represents the hypothetical dollar sales for DeCA if they charged the average competitor price for each item
95
Lastly, to aggregate savings across departments, DeCA weights the savings to reflect how much
shoppers spend on average in each department.171 DeCA calculates the final worldwide savings
rate by weighting savings by total sales dollars in each region.
The 2013 DeCA study found that commissary shoppers save an average of 30.5% compared to
private sector stores, using the methodology described above.172 The 2014 study found an
average of 30.0% savings. DeCA notes that savings vary across regions and product categories
(see Figure 4.8), with higher savings OCONUS and in non-scannable categories.
Figure 4.8: Findings from DeCA 2014 price comparison study
171 Using Bureau of Labor Statistics Consumer Expenditure Survey. Categories used are meat, produce, dairy, grocery food, frozen, health & beauty care, and grocery non-food (see http://www.bls.gov/cex/) 172 http://mldc.whs.mil/public/docs/report/qol/New-Price-Study-Validates-30-percent-Savings-DECA-web-site.pdf
5
DeCA 2014 Price Comparison Study 2014
vs. 2013 Trend Comparisons
Category% Savings without Tax or Surcharge % Savings with Tax and Surcharge
Sep-14 Sep-13 % Change Sep-14 Sep-13 % Change
Meat 34.2% 38.8% -4.5% 32.3% 36.6% -4.3%
Produce 45.9% 47.8% -1.9% 44.3% 46.0% -1.7%
Dairy 25.2% 26.2% -1.0% 22.6% 23.7% -1.0%
Grocery Food 23.0% 23.5% -0.5% 20.4% 20.9% -0.5%
Frozen 25.4% 26.8% -1.4% 22.9% 24.4% -1.5%
Health and Beauty Care 24.2% 24.8% -0.6% 25.2% 25.8% -0.6%
**Note: Due to rounding some % change values may differ from one decimal 2014 minus 2013 values
96
DeCA's savings methodology is robust in a variety of ways. First, the analysis captures a large
number of items. DeCA collects an average price for all items sold at both DeCA and other
grocery stores. In 2014, this represented over 38,000 items. In addition, the physical audits
conducted for meat, produce and OCONUS fill any potential gaps in the competitor sales data.
DeCA's analysis also captures the pricing of a broad range of stores, including traditional
grocery stores and key players like Walmart.
However, DeCA's methodology has three key limitations:
Not geographically granular: Since DeCA uses aggregated average prices at
competitors across all of CONUS, there is no visibility into actual savings levels by
region within CONUS. Comparing DeCA prices to competitors within close proximity to
the commissary would be more reflective of patron experience in a local market
because competitor prices can vary significantly across regions.173
Cannot differentiate between specific retailers and store types: Due to
confidentiality requirements, Nielsen can only provide aggregated data that does not
identify specific retailers. This prevents DeCA from comparing its prices against specific
competitors (e.g., Walmart). Furthermore, Nielsen's competitor set includes stores
which are likely less relevant competitors, such as drugstores and high-end grocers.174
Therefore, the estimated savings rate does not truly reflect the difference between
commissary prices and the next best grocery alternative.175
Cannot consider private label: In reality, most patrons shop some mix of national
brand products and non-national brand products,176 depending on the category (e.g.,
milk, eggs, and cheese have high private label penetration). DeCA's savings calculation
primarily relies on items that both DeCA and competitors carry and does not
incorporate the impact of competitors' equivalent private label items, which are often
cheaper than national brand products.177
173 In the private sector, this is generally due to competitive intensity and cost of living. We see evidence in the public sector as well: for example, the 2015 COLA index in Colorado Springs, CO is 93 versus 119 in Staten Island, NY (Source: http://www.defensetravel.dod.mil/site/conus.cfm) 174 DeCA uses Nielsen's "All Outlets Combined" dataset, comprising all grocery outlets. For reference, Whole Foods and Wegmans combined comprised <2% of patron share of wallet in our survey 175 Of the 30 markets DeCA sampled in CONUS, conducted price checks at Walmart for only 6 markets 176 National brands are carried in virtually all grocery stores across the country and receive significant promotional attention (e.g., Tide or Cheerios). There are a range of non-national brands: regional brands, value brands (lower-priced, limited advertising), and private label (brands made exclusively for a retailer) 177 DeCA's value brands may be included in the savings calculation if they are sold by other retailers
97
While DeCA's approach to estimating savings is quantitatively rigorous, it may not be the best
way to fully understand the experience that any individual patron has when shopping at the
commissary (versus nearby grocery alternatives). Therefore, we calculated savings using an
alternative approach based on a representative market basket designed to estimate what
patrons in specific locations may experience. This is important to understand the patron impact
and likely response of DeCA introducing variable pricing.
4.1.3. Alternative savings methodology: Representative market basket
To address the limitations in DeCA's cost savings calculation methodology and better
understand the gap between communicated and perceived savings, we developed an
alternative approach to calculating patron savings. We created a representative market basket
of 50 items and gathered prices for that basket from at least two competitor grocers near
commissaries in 51 U.S. markets.178 We compared prices of national brand items at the
commissaries to identical items at nearby competitor stores. We also calculated a separate
savings rate to incorporate value brands at DeCA and private label equivalents at competitors.
This approach captures geographic granularity, enables retailer-specific comparisons, and
factors in private label pricing. It is also an important lens to evaluate the impact of potential
price changes at a local level. While there are some limitations to this approach (e.g., it is a
snapshot in time and subject to seasonal fluctuation), we believe it is directionally accurate and
an important data point to consider when weighing any changes to DeCA's pricing.
First, we selected items to include in the market basket. We aimed to create a balanced,
representative basket that captured items frequently purchased at the commissary and
competitor stores. Using an approximate breakdown of sales at a typical grocer,179 we allocated
39 grocery, 6 meat, and 5 produce items to our basket. For scannable items, we selected items
from each of the 20 top-selling grocery categories.180 We then selected the remaining scannable
categories based on sales volume, placement in the store (e.g., near checkout versus center-
store), and private label penetration. This helped ensure the basket was sufficiently broad.
178 We were unable to visit OCONUS locations; HI and CO data based on Retail Data 179 80% grocery, 10% meat, and 10% produce (BCG experience—nearly 350 projects with grocers in the last five years) 180 According to Nielsen's "Remaining Market" dataset for the 26 weeks ending June 21, 2014
98
After selecting categories, we selected the top selling UPC in each category.181 Similarly, for
non-scannable items, we selected top-selling items across the key fresh meat and produce
categories (e.g., ground beef, bananas).182 Selecting high-volume items helped ensure that we
could accurately compare the same exact items between DeCA and competitors.
From there, we selected the regions and stores for the physical audit. We selected 51 markets in
CONUS and Hawaii with a balanced mix of characteristics:
Region: east, central, west
Competitive intensity: high, medium, low (remote)
Commissary size: variety across DeCA sales bands
Base branch of service: Army, Air Force, Navy, Marines
The map below shows all commissary locations and highlights stores that were included in the
analysis. The charts that follow (Figure 4.9 and Figure 4.10) show the breakdown of sampled
stores by commissary characteristics.
181 If highest selling UPC was not a representative item, switched to an item more representative of broader market (e.g., switched from Sensodyne toothpaste to Colgate, replaced regional brand Blue Bell ice cream with national brand Breyers); some items not highest-selling UPC in category in effort to balance brands/items with frequent promotions 182 Specific meat and produce items selected using Nielsen Fresh Facts database (52 weeks ending January 31, 2015), cross-checking with Consumer Price Index components
99
Figure 4.9: Map of all commissaries versus sampled commissaries
Figure 4.10: Breakdown of sampled commissaries by key characteristics183
Number of commissaries sampled by sales band and branch
K5
15
Sales band
Air Force
NavyMarine CorpsArmy
100
After selecting markets to include, we then identified at least two to three top private sector
grocers in each market to compare to DeCA. We selected grocers to compare based on chain-
level market share in the statistical area (e.g., Walmart, Food Lion and Harris Teeter are top 3
competitors in Norfolk / Virginia Beach, VA area). Once we identified which retailers have the
greatest share, we then selected specific stores to visit based on proximity to the commissary.
Since Walmart is the most common commissary competitor,184 we sampled Walmart
Supercenter in every market that had a location.185
We then visited the stores and collected prices.186 At both DeCA and competitor stores, we
captured regular retail and lowest available promotional prices for both branded and private
label equivalent scannable products.187 We then recorded the regular and promotional price for
produce, fresh meat, eggs, and milk (no brand specification). In three remote markets, we
leveraged Retail Data188 (a third-party vendor) and the Walmart Savings Catcher app to gather
competitive price data.189
After completing the pricing audits, we calculated savings for the market basket in two ways.
First, we compared the lowest available price for an item at the commissary to the lowest
available price for the identical item at each competitor (referred to as "branded").190 Second,
we accounted for the penetration of competitor private label and DeCA value brand items
184 Walmart has the greatest share of wallet behind the commissary for eligible patrons, comprising 9% of monthly grocery spend (Source: May 2015 BCG patron survey, unweighted N = 13,095) 185 We included Walmart Supercenters and Neighborhood Markets only (regular Walmarts do not have full grocery selection) 186 Competitor physical audits were conducted between March 25, 2015 to April 26, 2015; commissary prices for produce, fresh meat, eggs, and milk collected during same time period 187 For DeCA's scannable products, we visited Hunter AAF on March 26, 2015 and recorded prices for the market basket as well as prices for equivalent value brands, where available. Given DeCA's consistent national pricing, we only needed to collect prices at one store (with the exception of Hawaii – prices gathered separately for the Pearl Harbor commissary). For produce, fresh meat, eggs, and milk at the commissaries, we gathered prices on the dates visited, since pricing for these goods varies across CONUS. For multiple commissaries in same region, used prices from commissary with greatest FY2014 sales (e.g., Fort Hood, Virginia Beach) 188 Leveraged Retail Data for Hawaii, Denver, and Colorado Springs. Data sometimes not for closest competitor location, but within reasonable driving distance; excludes private label and non-scannables 189 Walmart app specifies retail prices for items in specific locations. Some items available in store not always visible through app 190 Promotion prices override regular prices; we considered produce, fresh meat, eggs, and milk to be "non-branded" products, so the lowest prices were used
101
(referred to as "blended").191, 192 The blended savings are likely more reflective of the average
patron experience since patrons purchase a mix of branded and private label goods.
For both "branded" and "blended," we applied the commissary surcharge and relevant state
taxes.193 In each market, we only considered items that were available at all sampled stores.194
Then, we added the total cost of all items within a department and compared the total price at
DeCA to the total at a competitor to arrive at department-level savings. We calculated an
average savings rate per store taking into account consumer expenditures by product
category.195
This market basket analysis is broadly consistent with patron price perception and an
important data point to consider when evaluating any changes to pricing at DeCA. There are
some limitations to this approach to acknowledge:
It includes 50 commonly purchased items but does not cover the full store assortment;
for future analyses, we would recommend rotating select items over time to increase
coverage
We collected price data at a point in time in March-April 2015
Prices were collected at locations nearest to the commissary, but patrons living farther
from the commissaries may shop at locations closer to their residences196
Across all sampled markets, we found DeCA provided an average savings of 16% compared to
the lowest-priced nearby competitor using the "branded" approach of comparing identical
products. Walmart was the lowest-priced competitor in 38 out of 41 sampled markets where
Walmart competed.197 Compared to the second-lowest priced competitor, we found the DeCA
basket was 21% cheaper on average. Using the blended approach (including private label and
191 Blended price calculates the weighted average price based on competitor and DeCA's private label penetration and prices. Blended = [branded price * (1 – % private label penetration) + private label price * (% private label penetration)] 192 Private label price not incorporated if it was higher than branded price, which occurred rarely 193 We applied food and non-food taxes per state laws in sampled commissaries. We did not include the customary tip for baggers at the commissary (also not factored into DeCA savings calculation), which could further decrease savings at DeCA 194 We excluded paper towels from the analysis because of inconsistency in sizing across stores 195 Using Bureau of Labor Statistics Consumer Expenditure Survey category weights 196 We have not seen any evidence that grocers price differentially because of proximity to a commissary 197 Walmart had the highest share of wallet after the commissary for commissary shoppers. Source: May 2015 BCG patron survey, unweighted N = 13,095
102
value brands), DeCA savings drops slightly to 15% off of the lowest-priced competitor and 19%
off of the second lowest-priced competitor (see Figure 4.11).
Figure 4.11: Overall savings rate from BCG market basket analysis
Savings at DeCA versus competitors
Branded
Blended (incl. private label / value brand)
Lowest-priced sampled competitor 16% 15%
Second lowest-priced sampled competitor
21% 19%
The maps below show how savings differ by geographic location (see Figure 4.12 and Figure
4.13). There are some regions where DeCA provides savings in the 10-15% range (e.g., Fort
Hood, TX) and others in the 20-25% range (e.g., Fort Myer, VA). There are several reasons why
this occurs. First, cost of living differs by region. In metropolitan areas with higher cost of living,
private sector grocery prices tend to be higher. Since DeCA sets price nationally for most items,
savings at DeCA are greater in these areas. Second, DeCA savings vary based on competitive
intensity. DeCA savings are lower in areas with Walmart Supercenters. This was confirmed by
our survey, which showed that customers thought DeCA savings were 12% compared with
Walmart.198
198 Assumes perceived savings are in the middle of each savings range (e.g., a response of 21-30% cheaper is interpreted as a 26% perceived savings level) and at the low end for the tails (e.g., 50% or more cheaper is 50%). Source: May 2015 BCG patron survey, unweighted N = 6,930
103
Figure 4.12: Market basket savings at DeCA versus lowest-priced nearby competitor
(branded)
104
Figure 4.13: Market basket savings at DeCA versus lowest-priced nearby competitor
(branded)199
Area Commissary Competitor Savings
Area Commissary Competitor Savings
Ea
st
Dover AFB Walmart 13%
Ce
ntr
al
Selfridge ANGB Meijer 11%
Ft Meade Walmart 14%
Great Lakes NS Walmart 14%
Aberdeen PG Walmart 14%
Scott AFB Walmart 15%
Oceana NAS Walmart 14%
Hunter AAF Walmart 15%
Dahlgren NSWC Walmart 14%
Ft Benning Walmart 16%
Portsmouth NSY Market Basket 14%
Robins AFB Walmart 18%
Hanscom AFB Market Basket 14%
Maxwell AFB Walmart 20%
Ft Detrick Walmart 15%
Pa
cif
ic &
We
st
Tinker AFB Crest Foods 5%
Charleston AFB Walmart 15%
Ft Hood I Walmart NM 12%
Ft Bragg North Walmart 15%
Sheppard AFB Walmart 12%
Ft Lee Walmart 16%
McClellan Walmart 12%
Parris Island MCRD Walmart 17%
Ft Worth Walmart 13%
Ft Belvoir Walmart 17%
Pearl Harbor Walmart 14%
McGuire AFB Walmart 17%
Barstow MCLB Food 4 Less 14%
Quantico MCB Walmart 17%
Ft Lewis Walmart 16%
West Point Walmart 17%
Port Hueneme Walmart 16%
Forest Glen Walmart 19%
Buckley AFB Walmart 16%
Andrews AFB Giant 19%
Ft Carson Walmart 16%
Langley AFB Walmart 20%
March ARB Walmart 16%
Bolling AFB Giant 20%
Camp Pendleton Walmart 16%
New London Walmart 21%
Edwards AFB Walmart 16%
Ft Myer Giant 21%
Ft Sill Walmart 18%
Annapolis NS Shoppers 22%
Travis AFB Walmart 18%
Ft Hamilton Met Food 23%
San Diego NB Walmart 18%
Newport NS Shaw's 25%
Los Angeles AFB Walmart 18%
Moffett Field Walmart 19%
199 Our sample includes four remote and isolated commissaries: Edwards AFB, Barstow AFB, Selfridge ANG Base, Parris Island MCRD
105
To illustrate the variability, we looked more specifically at the Washington D.C. metropolitan
areas (see Figure 4.14). These examples show how patrons experience greater savings in the
higher cost of living parts of the area near the District of Columbia. As you get further outside
of the city center, savings increase because the cost of living goes down and the private sector
grocery stores lower their prices accordingly.
Figure 4.14: Market basket savings at DeCA versus lowest-priced nearby competitor
(blended) – Washington, DC
Savings levels also differed significantly by category within a given store. Our data showed that
fresh meat and produce exhibited the greatest savings, whereas non-food, beverage, and
grocery items displayed the least (see Figure 4.15).200
200 Grocery includes canned and boxed goods, condiments, etc.
106
Figure 4.15: Market basket savings by category at DeCA versus lowest-priced competitor
(blended)
4.2. Opportunity
To overcome the inconsistency in savings and financial disadvantages DeCA currently faces, we
believe it is necessary to move away from cost-plus pricing across DeCA's entire assortment.
Moving away from cost-plus pricing could enhance patron benefit while unlocking a number of
opportunities, including:
1. Make it possible for DeCA to "normalize" prices while keeping a similar overall
discount, resulting in more consistent savings across categories and regions for patrons
2. Enable DeCA to create and execute a holistic pricing strategy to better serve patrons
and generate a positive contribution margin
3. Realize the cost and margin benefits from implementing other levers such as private
label and renegotiating COGS
4. Give DeCA the ability to consider a moderate price increase to reduce APF in the
future, if necessary or required by government decision-makers
There is a commonly held misconception that moving away from cost-plus pricing would
necessarily mean an increase in prices. The first three benefits above could be achieved without
any net increase in prices to patrons. Moving away from cost-plus pricing would entail
increasing prices in some regions and categories and decreasing in others to provide a more
107
consistent savings rate to patrons. This would allow DeCA to maintain the overall savings rate
while capturing the majority of the benefits.
Moreover, moving away from cost-plus pricing would enable DeCA to better serve its patrons.
As mentioned, DeCA's cost-plus pricing results in wide variability in the savings rate across
geographies and categories. As a result, some patrons (e.g., shoppers in low cost-of-living areas
primarily purchasing general grocery items) receive a benefit far less than the average savings
rate. By moving away from cost-plus pricing, DeCA would be able to correct such imbalances
with "normalized" prices and tailor a pricing strategy to the needs of patrons (versus simply
flowing through national product costs). By offering a more consistent level of savings across
regions and categories, DeCA could enhance the overall benefit and encourage patrons to
increase their usage of the commissary. This would likely help address the difference in
perceived savings rates among different patron groups (see Figure 4.7).
The largest financial benefit of variable pricing is enabling a host of "win-win" cost savings
opportunities. Any efforts to reduce COGS today would not reduce DeCA's need for APF
because the savings would have to be passed entirely to patrons. With the cost-plus
requirement removed, DeCA would be able to financially benefit from reducing COGS.
Furthermore, DeCA would be able to realize the benefits of introducing private label products.
This would allow DeCA to reduce overall patron basket cost while achieving a greater margin
on each sale.201 Moving away from cost-plus pricing is a necessary step to unlock $240-385M in
potential annual APF reduction while improving the patron experience. 202, 203
In addition, moving away from cost-plus pricing would give DeCA the ability to raise overall
price levels if government decision-makers chose to do so. Since price increases have a direct
negative effect on patron benefit, government decision-makers would need to carefully
consider whether to do so. Furthermore, our survey results indicate that DeCA may be in a
challenging position from a pricing standpoint. As mentioned above, 62% of patrons believe
they receive a discount below 10% and some even believe the commissary is more expensive
than other local grocers (see Figure 4.6).
201 See Section 5: Private Label for more detail 202 Excluding any price increase 203 DeCA would need to ensure that any margin gained through variable pricing and COGS reduction could be used to offset APF needs
108
Similarly, our study shows patrons are sensitive to
the idea of even small price increases.
Respondents suggest that if prices increased even
5%, they would shop 25% fewer times per month
(see Figure 4.16). While patrons are likely overstating their actual price sensitivity, it is a real
risk. Therefore, we do not recommend any overall price increase at this time.
Figure 4.16: Patron sensitivity to changes in price according to survey204
As part of the RFQ, however, we were asked to identify the pricing structure necessary to
reduce DeCA's APF by at least 70%.205 Our analysis suggests that DeCA could reduce APF by as
much as $545M without raising prices by pursuing the opportunities identified in this study.
Therefore, DeCA would need to reduce APF by an additional $410M to reach a 70% reduction
from today's levels. Based on stated patron elasticity, such a reduction would likely require a
10-15% price increase in commissary prices (see Figure 4.17).
204 Respondents randomly assigned price increase / decrease increment in multiple of 5 (5-25%). Source: May 2015 BCG patron survey, unweighted N = 6,930 205 See RFQ PCBG-15-0001, Study Objective 5(h)
2015-06-07 DeCA slidesv2.pptx 42Draft—for discussion only
How many fewer trips would you take to the commissary if prices increased?
0
25
50
75
5 10 15 20 25
Percent decrease in traffic
Percent price increase
Respondents suggest they would shop ~25% fewer times per month
if prices increased by 5%
OverallOCONUSCONUS
109
Figure 4.17: Impact of potential price increase scenarios206
Price increase Decrease in traffic Net revenue impact Net APF impact
5% 26% -$1,333M $143M
10% 27% -$1,170M $352M
15% 34% -$1,427M $485M
20% 39% -$1,576M $608M
25% 44% -$1,780M $696M
This increase would also greatly reduce the patron benefit. A 10-15% price increase would
erode much of the price discount provided at commissaries today (roughly 16-21%).
Furthermore, patrons would shop at the commissary less frequently. The net result could be an
over 80% reduction in aggregate patron savings ($1.1B reduction from the roughly $1.3B
provided today).207 Moreover, decreases in commissary traffic could further impact the military
resale system by reducing traffic at the exchanges. Since roughly 20% of exchange traffic is
driven by the commissary,208 a 35% reduction in commissary traffic could cause a 7% decrease
in exchange traffic. As a result, although increasing prices by 10-15% could enable DeCA to
reduce its APF requirement by 70%,209 we would advise against such a drastic increase given the
potential risks to patron benefit and potential decrease in exchange traffic.
Before considering any increases in pricing, we believe DeCA needs to first carefully restore
price perception by making savings more consistent. After normalizing prices across regions
and categories, DeCA might be able to execute small price increases if government decision-
makers choose to do so. However, it will be important to carefully test any potential changes
before rolling them out to all stores. After normalizing prices, we believe a nominal price
increase (e.g., 1-3%) in CONUS stores could help reduce APF by $30-90M, even assuming a
206 To calculate the net revenue impact we account for the decreased sales from traffic loss and then apply the increase to today's all-in price with surcharge; for net margin, we account for the decreased COGS from traffic loss and then apply the increase in markup (1.05 * price increase) to find the new margin 207 Assuming 18.5% average discount today, 12.5% price increase, 30% reduction in traffic (from elasticity), and constant patron spend per visit for remaining traffic 208 46% of commissary patrons responded that they visited a military exchange during their last trip to the commissary, and 44% suggested that they would not have visited the exchange if they had visited a different grocery store; Source: May 2015 BCG patron survey, unweighted N = 5,945 209 Assuming DeCA secures $545M in APF savings through opportunities in this study
110
strong decrease in patron traffic which we do not believe is likely.210, 211 In reality, we believe
the impacts to traffic and patrons could be less dramatic given the small magnitude of the price
change and DeCA's ability to execute a price increase in a more targeted fashion (as opposed to
a consistent increase across all products and geographies). The introduction of private label
could help further offset the impact of a small price increase by providing more low-cost
options for patrons to enhance their overall savings. Nevertheless, even a nominal price
increase would impact patron benefit and should not be pursued in the near term.
Furthermore, any price changes could impact DoD cost of living adjustments (COLA). COLA
payments are determined by comparing the cost of a market basket of non-housing items in
each location to the average cost of that basket across all CONUS locations, taking into account
both commissary usage and prices. As a result, price changes at the commissary could influence
both the benchmark cost for the average CONUS location and COLA index for individual
locations.
Within CONUS, any potential impact to COLA from price normalization or a small price
increase would be minimal. Based on a study by the Defense Travel Management Office, a 30%
increase in CONUS commissary prices would only lead to an $11M decrease in CONUS
COLA.212 Given price normalization would involve more moderate price changes, the potential
impact should be less than $5M.
OCONUS COLA, however, presents a potential risk to the broader DoD budget. For example, a
5% increase in OCONUS prices (without a corresponding increase in CONUS prices) could drive
a $32M increase in OCONUS COLA. Due to this sensitivity, we would propose maintaining
separate OCONUS and CONUS savings levels and normalizing these two different geographies
separately. This would help ensure that savings levels are maintained for each geography,
which minimizes the risk of any significant COLA impact. As DeCA formulates a broader
pricing strategy, government decision-makers could determine whether or not to alter prices in
210 DeCA should consider any price increases with the impact of normalization, which may also have resulted in price increases in certain regions and categories 211 Elasticity of -5 based on May 2015 BCG patron survey. Elasticity of -5 means for every 1% increase in price, expect 5% decrease in traffic. Percentage of sales in CONUS stores based on DeCA store data (roughly 79%) 212 Defense Travel Management Office (DTMO) study, "Impact of Changes to DoD Commissary and Exchange Systems on DoD Cost of Living Allowance (COLA) Programs"
111
OCONUS locations, taking into account potential impacts to COLA as well as the potential to
improve DeCA's economics.
To summarize, we believe DeCA has an opportunity to rethink its pricing approach to enhance
patron benefit by making the discount more consistent across regions and categories. This will
require the removal of the cost-plus requirement in order to enable DeCA to set prices
independently. DeCA will need to consider any change in pricing very carefully as patrons have
indicated a high sensitivity to overall increases in price level. Nevertheless, if government
decision-makers should choose to do so in the future, we believe DeCA could increase price
nominally (e.g., 1-3%) while maintaining patron price perception. Any changes in pricing would
need to be executed very carefully to monitor impact on patrons.
4.3. Roadmap
Figure 4.18: Path forward for pricing
Transitioning away from cost-plus pricing will be a long-term journey for DeCA that needs to be
done carefully and in phases. Before DeCA can begin making any changes, legislative change
will be required. Focusing on securing the legislative approval to move away from cost-plus
should be DeCA's top priority in the short-term.
Implementation phase I Implementation phase IIPlanning phase
Prepare for legislative change
Stand up pricing team and capabilities
• Define roles & responsibilities • Identify and fill talent gaps• Design competitive
intelligence data and tools• Ensure IT requirements met• Define methodology for
ongoing savings calculation
Prepare for price normalization• Develop fact base of current
prices and costs• Outline potential regional
pricing zones
Test and roll out price
normalization• Align on approach (target
discount level, region/ category cadence, competitors to benchmark, KPIs to monitor)
• Select pilot stores• Monitor ongoing results and
refine approach
Develop holistic pricing strategy
• Define target discount by region and category
• Agree on promotional and private label pricing strategy
• Develop patron messaging and communications
• Plan for rollout
Complete price normalization
Begin to roll out pricing strategy
• Launch in waves by category and region
• Continuously monitor patron and financial impacts
Evaluate potential increase in prices
• Determine if needed• If needed, develop testing
plan and approach
112
As part of the movement away from cost-plus pricing, we also recommend the legislation
requiring DeCA to charge the 5% surcharge be eliminated.213 This change will ensure greater
flexibility within the pricing opportunity. Eliminating the surcharge would also eliminate the
restriction on how DeCA can spend the margin it makes on sales, thereby enabling DeCA to use
any Capex savings to offset APF (see Section: 10.2: Surcharge / Capital Expenditures for
additional detail). Once the surcharge legislation is removed, DeCA will need to test the impact
of updating shelf price to reflect all-in cost versus retaining a fixed percentage markup on sales
that is applied at the register to ensure that patron price perception is not negatively impacted.
Beyond legislative change, DeCA would also need to build a team to support pricing
capabilities similar to private sector grocers. In the private sector, we would expect a team of
five to ten retail pricing experts to support an operation of DeCA's scale. In the private sector,
pricing teams generally report into the merchandising department. The team would need to be
equipped with competitive intelligence capabilities to be successful. Most private sector grocers
partner with third-party vendors that collect competitor pricing information.214 DeCA would
also require IT capabilities to support competitive intelligence and ongoing pricing decisions.215
We estimate that the annual cost for a pricing function at DeCA with capabilities similar to the
private sector would be about $3-5M. Compared with the significant value this will unlock for
DeCA, the investment in a pricing capability is relatively small.
In the initial phase of rollout, we suggest DeCA focus on holding patron savings constant in
aggregate at an agreed-upon level. This will require careful monitoring as we expect price
normalization to result in changes in the price of many products. Some categories and regions
would see a moderate change either up or down from today's prices to reach the agreed-upon
savings level, so measuring savings accurately, frequently, and transparently will be critical.
During the Planning Phase, DeCA would need to determine how to measure and track savings
going forward. A key part of this measurement should be a market basket based approach to
213 DeCA charges a 5% surcharge on all sales which is used to pay for commissary construction, equipment and maintenance 214 Examples of third-party competitive intelligence vendors: Nielsen, IRI, Retail Data 215 DeCA's planned upgrade with NCR Government Systems to EBS (Enterprise Business Solution) has been described to us as capable of managing variable pricing with its Power HQ module. Our analysis assumes DeCA will move forward with this upgrade
113
provide flexibility to measure at a local level and capture the impact of private label products.
DeCA could identify a core set of items to permanently include in the basket, creating
consistency from one time period to the next. Beyond this core basket, DeCA could include a
rotating set of items to ensure savings are maintained across the store (versus simply on the
items in the core basket). In addition, this approach should be supplemented with Nielsen
based analysis to add a higher volume of items that can be priced on a more frequent basis to
further triangulate the savings levels. Beyond these elements of the approach, DeCA would
need to align on specific details during the Planning Phase, including how many and which
items to include in the basket (likely minimum of 50 but potentially 100 – 150 depending on
cost and frequency of measurement), which specific competitors to compare against, and how
often to collect data (quarterly, twice a year, etc.). Given that the market-basket approach is
inherently more manual, DeCA should continue to use a syndicated data source (i.e., Nielsen)
to monitor competitive price levels on a regular basis to serve as another input into pricing
decisions. Though the exact frequency would be determined later, the savings level should be
reported at least quarterly to key government stakeholders.
Once DeCA assembles a pricing team and aligns on a savings methodology, we recommend a
phased process involving continual testing to monitor any impacts of pricing changes on store
traffic, sales volume, and patron satisfaction. The first step in this pricing journey would be to
"normalize" prices to make savings more consistent across regions and categories relative to
competitors. Normalizing prices is necessary for DeCA to build a pricing and margin fact base,
and lay the foundation for a more sophisticated pricing strategy. To normalize prices, DeCA
would need to gather data on competitor pricing across regions and categories, then apply a
consistent level of discount. This would result in increasing prices on items with an above-
average discount and decreasing prices of others. Basing prices entirely on competitors should
not necessarily be DeCA's long-term pricing strategy, but we believe it is a necessary starting
point. Not only will this allow DeCA to begin capturing greater margin through COGS
negotiation and the introduction of private label, but we believe that by addressing the
inconsistency in the savings today, DeCA will improve the patron shopping experience and is
likely to see improvement in store traffic.
114
There are important actions and decisions DeCA needs to make to normalize prices:
Group all stores into regional pricing zones to reflect local demographics and
competitors. Since commissary locations are dispersed around the world, we anticipate
there would need to be a number of pricing zones.
Decide which competitor store(s) should serve as points of comparison in each
zone. Based on our market basket and survey analyses, we suggest including Walmart
for most markets.
Align on target savings level once DeCA has gathered benchmark prices on relevant
items from competitors. The market basket study found that the average discount off of
the lowest and second lowest-priced competitor in our sampled locations was 15-20%.
This is an initial target level to consider.
Select pilot stores to test price normalization once DeCA has an understanding of
price changes needed. The pilot stores should be a representative sample of store sizes
and sales, patron demographics, cost of living, and geographic regions.
After aligning on a plan, DeCA should begin to gradually normalize prices at pilot stores. Since
this would require both price decreases and increases, DeCA should carefully monitor any
impact of price changes and pay especially close attention to key items that could drive store
traffic (e.g., meat). Once the pilot tests are complete and DeCA has refined its approach with
lessons learned, prices should be normalized across all stores. We estimate that planning,
testing, and executing globally could take 12-18 months.
While price normalization is planned and tested, DeCA should simultaneously begin to develop
a holistic pricing strategy. Creating a pricing strategy from scratch will likely be an intensive
effort, but necessary for DeCA to compete effectively in the market. There are a number of key
questions that DeCA should address in order to develop this strategy, for example:
Is DeCA going to employ a high-low pricing or focus on everyday low prices?216
Which makes most sense for patrons?
What are the appropriate local benchmarks to compare price?
Should the discount vary based on any of the following factors?217
216 High-low pricing is the practice of setting the price of most products higher than the market rate, while offering a small number of products at below-market prices; Everyday low pricing (EDLP) is the practice of providing a low price without promotional events
115
Patron segment (e.g., rank, age, family status)
Category (e.g., produce, grocery, meat)
Geography (e.g., region, cost of living)
Competitive intensity (e.g., Walmart markets)
What will DeCA's promotional strategy be?
How should DeCA price private label products and new categories?
What is the best way to communicate the new pricing strategy to patrons?
DeCA could be categorized as a high-low player today, using promotions to drive traffic. This
experience provides a starting point to evaluate a pricing strategy and should make the effort to
develop a new strategy easier. Therefore, we think that a focused period of just three to six
months is needed for DeCA to reach decisions on the long-term approach to pricing.
Once DeCA develops a holistic pricing strategy, it should begin to test the strategy at pilot
stores. Given the familiarity DeCA would have developed with the pilot stores during the
normalization phase, we would recommend that DeCA consider the same pilot stores for
testing. Changes should be rolled out gradually and DeCA should track the impact on volume,
store traffic, and overall margin carefully. After testing, DeCA should have a refined pricing
strategy that can be rolled out in waves across all stores. We expect the testing and roll-out
process to take approximately one year. At this point, DeCA should work with government
decision-makers to determine if a broader price increase is necessary and appropriate.
Figure 4.19: Summary of pricing next steps
Submit legislative change to move away from cost-plus pricing
Staff pricing team
Set up pricing tools and capabilities
Align on and implement ongoing market basket savings methodology
Test price normalization in limited regions and categories
Complete price normalization across all stores and categories in waves
217 If DeCA should increase prices, it could spread the impact differentially across these factors. This would be both a business and policy decision that would have to be carefully considered
116
Develop holistic pricing / promotional strategy
Test pricing strategy in limited regions and categories
Roll out pricing strategy across all stores and categories in waves
Evaluate if price increase needed
117
Section 5: Private Label (Study Objective 2)
5.1. Background
Grocers generally carry two major types of brands: national brands and non-national brands.
National brands are produced by third-party suppliers like General Mills or Procter & Gamble.
They are stocked in virtually all grocery stores across the country (e.g., Tide, Cheerios), receive
significant promotional attention, and generate the majority of most retailers' sales.
Non-national brands are offered to serve other customer needs (e.g., lower price point, organic)
and generate better economics for retailers. They come in a range of types including value
brands (lower-priced with little advertising) and private label (brands made exclusively for a
retailer). There is also a variety of strategies within private label brands, including basic
opening price point, national brand equivalents, and premium private label brands (see Figure
5.1).
Figure 5.1: Landscape of grocery brands
In the private sector, a non-national brand offering, and specifically private label, is a core
strategic priority for most grocers and provides a broad set of benefits. Private label items
118
provide consumers with lower-priced alternatives to national brands, often without sacrificing
quality. They also typically enhance a retailer's bottom line because they generate higher profit
margins than national brands, creating a "win-win" scenario for consumers and retailers (see
Figure 5.2).
Figure 5.2: Private label illustrative example218
Beyond these direct benefits, having a private label offering also serves as a valuable lever in
negotiating with suppliers. For retailers with their own similar quality brand, there is additional
leverage when negotiating costs and shelf space. Due to these benefits, private label share is
large and growing for most major food retailers (see Figure 5.3).
218 Retail price information based on Walmart near Ft. Bragg; margin assumes 60% decrease in product cost to retailer
Price to customer
$3.98
$2.98
Roughly 25%
discount
Margin for retailer
$0.80
$1.59
2x unit margin
Nati
on
al
Bra
nd
Pri
vate
Lab
el
119
Figure 5.3: Private label share and growth over time219
DeCA currently offers a very limited set of non-national brand items at lower prices, which it
calls "value brands". While these are frequently the lowest price point in their category, there
are some important differences between DeCA's value brand items and most private label
offerings. First, value brand items often achieve lower prices by reducing the quality of the
product or packaging.220 Second, DeCA's value brands vary greatly in price, quality and brand
name. On the other hand, private sector grocers tend to convey a consistent level of price and
quality through a portfolio of private label brands (e.g., Kroger Value, Kroger, and Private
Selection brands). Finally, DeCA's value brands are relatively new and not yet offered in as
many categories as private sector grocers. As a result, DeCA's value brands are far less
penetrated than industry private label benchmarks (4% at DeCA versus 19% in private
sector).221
5.2. Opportunity
Improving DeCA's non-national brand offering through a more developed private label could
provide wide-ranging benefits to DeCA and patrons. Within a variable pricing context, any cost
219 Based on internal BCG study using Nielsen and IRI data 220 For example, DeCA's value brand product replacement for national brand Ragu pasta sauce is a canned pasta sauce product 221 DeCA internal interviews; Nielsen 2014 sales data for DeCA competitors
120
savings would provide a win-win benefit to both patrons and DeCA's bottom line. Furthermore,
the expansion of high-quality, low-price products would likely drive additional traffic into the
store.222
In the private sector, the profitability of private label varies but is typically much higher than
that of national brands. This is driven by a decrease in the cost of private label products to the
retailer (i.e., decreased cost of goods sold) versus national brands (see Figure 5.4with a range of
COGS savings from prior BCG experience). As a result, private label margins can reach 40%-50%
(gross margin) versus 20-30% for national brand products.223 DeCA aims to provide patrons with
a discount compared to private sector grocers, thus, we would not expect DeCA to fully capture
these potential margins. Nevertheless, the margins could still be very attractive, and we believe
DeCA could generate 20% - 30% margin in many categories while still delivering similar or
enhanced savings to patrons.
Figure 5.4: Range of COGS savings for some example categories224
Category
Expected COGS savings225
Household Paper 30-40%
Nuts 30-40%
Cookies 30-50%
Beverages 35-45%
Soup 35-45%
Household Products 35-55%
Beauty 40-50%
General Merchandise 40-50%
Prepared Food 40-50%
Salty Snacks 40-50%
Pet food 40-60%
Dry Grocery 45-55%
222 "Low prices" and "good value" are the most important reasons patrons shop at DeCA 223 In a 2011 report, Steve Burd, CEO of Safeway, mentioned private label sales generated 35% margins across all categories 224 Based on experience at variety of retailers, including drugstore, convenience store, and grocery chains 225 Difference in cost to retailers for a private label product versus what they would pay for a national brand equivalent
121
Category
Expected COGS savings225
Laundry 50-60%
Personal Care 50-70%
Household Cleaning 55-70%
OTC Medication 65-75%
Batteries 65-75%
Further, DeCA's patrons would likely be very
receptive to purchasing additional private label
products. In our survey, we found that
approximately 60% of patrons are willing to
purchase private label if it were offered by
DeCA at a reasonable price, which ranged from
6-30% discount for most patrons. For example,
69% of patrons indicated they would consider purchasing a private label dairy product if it were
offered at a 0-20% discount versus an equivalent national brand product (see Figure 5.5).226
226 Willingness to purchase varies by category ranging from 39% (adult beverages) to 63% (grocery); Source: May 2015 BCG patron survey, unweighted N = 3,843
122
Figure 5.5: Necessary discount for private label products
In addition, the military exchanges already offer a wide range of private label products to the
military resale patrons under their own brand names (e.g., Exchange Select, Patriot's Choice,
1775, North Star) and have seen these products gain substantial share in some categories (e.g.,
26% penetration in girl's clothing at AAFES).227 We believe that by improving on its existing
"value brand" offering, DeCA could eventually achieve similar penetration of its private label
offering that exists among private sector grocers, typically 15% - 40% depending on the category
(see Figure 5.6).
227 AAFES private label sales figures from FY2014
2015-06-07 DeCA slidesv4.pptx 47Draft—for discussion only
More than 50% cheaper than brand name equivalent41-50% cheaper than brand name equivalent31-40% cheaper than brand name equivalent21-30% cheaper than brand name equivalent
11-20% cheaper than brand name equivalent6-10% cheaper than brand name equivalent1-5% cheaper than brand name equivalentSame price as brand name equivalent
How much cheaper would a store brand item have to be for you to purchase it at the
Commissary (compared to an equivalent national brand product)?
123
Figure 5.6: Private label penetration rates by category228
Introducing private label could supplement DeCA's current value brand and national brand
assortment. Where a private label item would be duplicative with a value brand, DeCA could
discontinue the value brand item and capitalize on the enhanced economics of private label.
Where a value brand could be additive (i.e., an opening price point), DeCA could keep both
items and benefit from the expanded offering to patrons.
There is a wide spectrum of approaches to execute a private label offering (detailed in Figure
5.7). The simplest involves partnering with an established private label brand and selling their
products. For example, AAFES offers Macy's private label brands (e.g., Martha Stewart, Alfani)
in their main stores. This option is the easiest to implement but would likely yield the lowest
level of cost reduction for DeCA and price benefit for patrons. On the other end of the
spectrum, some grocers such as Kroger own the entire value chain of their private label brands
and are able to capture greater benefit. However, this requires significant investment and may
never be viable for DeCA. There are many other options between the extremes for DeCA to
228 Annualized 2014 figures excluding several lower selling DeCA departments (e.g., General Merchandise, Produce, Deli, Pet Food, Pharmacy, Alcohol, and In-store Meal); includes all grocers in the Nielsen dataset (not including Walmart and other general merchandisers), % calculated on a category basis (e.g., Adult Incontinence); Source: Nielsen data pull for DeCA first 26 weeks of 2014
5000 2,0001,5001,000
159
123
1,772
395
169
326
Healthcare
Beautycare
Meat
Frozenfoods
Dairy
Grocery
99
2014 DeCA CONUS scannable sales ($M)
Bakery
US Grocer
Private Label Penetration2
15%
38%
21%
18%
6%
20%
28%
124
consider. Starting with a partnership or broker-managed model in early stages while developing
a broader private label strategy is likely the right first step for DeCA. Over time, DeCA can
reevaluate whether to add capabilities as private label penetration grows.
Figure 5.7: Private label execution models229
In order for DeCA to fully benefit from private label, two key changes would be required. First,
DeCA would have to move away from cost-plus pricing. This would allow DeCA to capture part
of the additional margin from private label items to reduce its reliance on appropriated funds
while providing patrons a lower-priced, high-quality alternative to national brands (as discussed
above).
Second, DeCA would need to develop the capability to manage a portfolio of private label
products and brands. This process would involve determining the right model for procuring
private label products and then developing the requisite internal capabilities. At a minimum,
DeCA would need to add team members to manage relationships with third-party brokers (see
Figure 5.8). DeCA would also likely need a small team of analysts that work with category
managers to track private label sales and margin performance. These analysts can potentially
• Broker (e.g., Daymon or Topco) coordinates development, manufacturing, and supply chain
• Add private label manager and analysts as breadth grows
• Support broader PL effort with existing category managers
Full vertical
integration
• Develop product internally and builds capabilities to manufacture product internally
• Hire / acquire to build development and manufacturing capabilities
• Build separate private label department with support for each PL category
Internally
managed, 3rd
party developed
and manufactured
• Coordinate directly with development and manufacturing to create PL
• Add private label manager and analysts as breadth grows
• Consider adding separate private label department
Internal
development, 3rd
party
manufacture
• Develop product internally and identify 3rd party partner to manufacture
• Hire / acquire to build product development capability
• Build separate private label department with support for each PL category
Partnership
• Sell existing private label brand (e.g., Kirkland, Exchange Select), managing as a normal supplier
• Add private label manager and analysts as breadth grows
• Support broader PL effort with existing category managers
Our recommendation
125
be repurposed from DeCA or the exchanges' existing workforces or hired from a private sector
grocery. The full team would likely cost less than $400,000 per year.230
Figure 5.8: Example private label organization structure
To this end, DeCA should look to build a partnership with a third-party private label provider to
get an initial offering off the ground quickly. These providers do the work of developing
product and packaging specifications, procuring the products, and supporting the logistics of
getting the products to stores. Partnering with a third party would simplify the execution for
DeCA significantly because it would not require internal product development, sourcing, or
manufacturing capabilities. This arrangement would likely result in lower margins than an
internally managed value chain,231 but it would allow for DeCA to bring a private label offering
to market much quicker. In this scenario, DeCA could gradually build the internal capability to
230 Assumes one manager at $90,000 per year salary, three analysts at $70,000 per year, and benefits at 30% of salary (total cost of $390,000) 231 Would likely also require some upfront consulting costs for an initial diagnostic
Director of sales
Category 1
Category 2
Category 3
Category 4
Category 5
Manager, Private
Label
Analyst 1
Analyst 2
Analyst 3
Category 6
Private Label
Broker
Manufacturers
Distributors
Existing team
126
manage private label activities and reevaluate the opportunity for a different private label
model to enhance margin at a later date.
Even if DeCA introduced new private label products and brands in a more limited way than
private sector grocers (i.e., partnership or broker approach), we think it could contribute $60-
120M annually to DeCA's bottom line once rolled out.232 During the first two years of rollout,
DeCA could selectively launch products and build penetration in the highest potential
categories, gradually reaching full scale. Improving private label would not only help DeCA
reduce its need for appropriated funds but also improve the patron experience by providing a
better selection of quality products and further strengthening the savings provided.
5.3. Roadmap
Figure 5.9: Private label roadmap
232 Assumes a range of COGS savings (30-40%) and additional price discount (10-20%) at market level private label penetration
127
Reaching industry level private label penetration will take a number of years. The chart above
(see Figure 5.9) lays out this implementation path along three phases: planning,
implementation I, and implementation II.
The Planning Phase could take place before DeCA moves away from cost-plus pricing. Since
private label does not offer an economic benefit without variable pricing, we suggest DeCA use
this period to get a team in place and define a detailed strategy.
First, DeCA should hire a manger with prior private label experience to run the private label
team. This individual would be the main interface between DeCA and the private label broker
and would likely report into the Director of Sales. Underneath this manager DeCA could
potentially hire two to three analysts with experience in the private sector. These analysts could
conduct the necessary analytics in partnership with the category managers to define a more
detailed strategy. This strategy could include the potential categories to enter, products within
those categories, intended price points and positioning, placement on the shelf, as well as a
timeline for rollout.
This new team should then submit an RFQ for a private label broker to help develop, source,
and distribute new lines of private label products to the stores. Once the broker is decided,
DeCA can partner with the broker to finalize the category entry strategy, launch timeline, and
marketing messaging.
Once DeCA moves away from cost-plus pricing, it should begin rolling out private label with a
small set of products in a small set of stores. This test-and-learn approach would enable DeCA
to adjust packaging and branding if necessary and gauge general patron response to the new
products. Testing would also help DeCA evaluate which facings to repurpose for the broader
roll-out. As products pass the testing gateway they should be released broadly and promoted in-
store to build penetration.
Concurrently, DeCA and the private label broker should continue to develop and plan for the
next set of products to launch. While DeCA would likely only launch products in 10-15
categories in the early stages, we expect the number of categories to ramp quickly if DeCA sees
early success.
128
In the second implementation phase, DeCA should continue to enter new categories and build
penetration of existing products. Eventually DeCA would reach a steady state, similar to private
sector grocers, where penetration is high (e.g., 20%) and stable. At this point, DeCA should
reevaluate whether it wants to build the capability to move upstream (e.g., source private label
without a broker).
Figure 5.10: Summary of private label next steps
Staff private label manager and analysts
Conduct RFQ and select private label broker
Align on prioritization of categories to enter
Determine product price and positioning for prioritized products
Pilot first set of private label products in subset of stores
Complete rollout of private label in prioritized categories
Determine strategy and timeline for expanding private label in other categories
Continue to develop and roll-out new products, pending success of early rollout
129
Section 6: Second Destination Transportation (Study Objective 3)
6.1. Background
DeCA receives appropriated funds for second destination transportation (SDT) to ship
American goods to OCONUS commissaries (excluding Alaska and Hawaii).233 The goal of SDT is
to provide overseas patrons commissary benefits comparable to what they would get in the U.S.
The total SDT execution in FY14 was roughly $150M. The largest categories of SDT spend were
sea shipping ($80M) and produce airlift to the Pacific ($38M) (see Figure 6.1). Four destination
regions (Germany, Guam, Japan, and Korea) constituted about 90% of total sea shipping in
FY14.
Figure 6.1: Summary of SDT expenses at DeCA in FY14
6.2. Opportunity
The DeCA logistics directorate has investigated alternative funding sources for SDT in the
recent past. In a 2010 internal review, DeCA suggested several potential options to eliminate
appropriations for SDT, including having manufacturers and suppliers manage shipment,
increasing the 5% surcharge, and adding a markup to the product prices.234 This review
233 Provision of appropriated funds for Second Destination Transportation is stipulated in DODI 1330.17 234 "Change in Funding Source for Second Destination Transportation Business Case"
FY 2014 OCONUS shipping execution Breakdown of sea-shipping by region
Category Spend ($M)
Sea 80
Airlift 38
AMC 4
Freight forwarding 6
In-Theatre (Europe) 16
In-Theatre (Pacific) 3
Off Shore Acquisitions 3
Total 150
30
20
0
10
Other
3
999
27
7
9
Korea
4
Japan (ex
Okinawa)
12
Okinawa
($M)
32
4
6
4
39
3 23
4
3
Guam
2
Germany
2
15
Dry
FrozenChill
130
recommended the last option and suggested that it would require a 3% markup at all the
commissaries in order to completely eliminate SDT. This option is also in line with the
approach that DoD is currently considering to reduce SDT at DeCA.
DeCA is currently pursuing initiatives to reduce its APF requirement for SDT. DeCA is planning
to eliminate airlift and freight forwarding by increasing local sourcing in the Pacific region,
which DoD has approved. In addition, DeCA plans to eliminate off-shore acquisition costs,
currently used to match U.S. prices for locally sourced goods.235 These categories accounted for
$47M in FY14 spend and would be eliminated by FY16.236
To eliminate or further reduce SDT funding, we examined three potential options suggested in
the RFQ237, including:
Increasing prices across all commissaries
Increasing prices only at commissaries that require SDT
Increasing the proportion of local sourcing
In assessing these opportunities, we account for the SDT reduction expected from DeCA's
initiatives noted above.238
6.2.1. Increasing prices across all commissaries
If DeCA were to fully eliminate SDT funding by spreading the cost evenly across all
commissaries, DeCA would need to raise its prices uniformly by 2%.239 DoD is currently
evaluating this approach for implementation after FY16. If DeCA were to proceed with this
approach, the average customer savings in CONUS would decrease from 16% to 14%. This
would be consistent with DeCA's approach to building all costs of the product, including
shipping, into the prices patrons pay. However, from the patron's point of view, this will be no
different than any other price increase, so should be considered like a price increase from a
patron impact and elasticity standpoint. Therefore, adding SDT cost to commissary prices could
235 DeCA currently uses appropriations to adjust the cost of locally sourced milk to match U.S. prices 236 The reduction in SDT could result in an increase in OCONUS COLA 237 Request for quotation 238 Our calculations assume SDT baseline of $104M (FY14 total of $151M less $47M planned reduction) 239 1.9% represents the percent increase in prices necessary to off-set the $104M SDT funding, before accounting for surcharge; note that this calculation assumes any decline in patron traffic would proportionally decrease the requirements for SDT (e.g., a 5% reduction in sales could lead to a 5% reduction in SDT)
131
result in up to a 10% decrease in CONUS traffic according to the patron survey.240, 241
Considering the risk to patron benefit and store traffic, increasing prices uniformly carries
substantial risk.
6.2.2. Increasing prices only at commissaries that require SDT
If DeCA were to raise prices only at commissaries that require SDT, it could do so in two
different ways. First, DeCA could raise prices uniformly across all commissaries that receive
SDT support. In this case, DeCA would need to raise its prices by 12% on average in the 63
commissaries that receive SDT support. Alternatively, DeCA could raise prices in each region
by different amounts to offset regional SDT costs. This approach would disproportionately
impact patrons living in regions with the highest shipping cost from the U.S. For example, it
would severely impact patrons in Guam because shipping rates to Guam are significantly higher
than to other regions. Figure 6.2 summarizes the level of price increase necessary to offset the
SDT cost in each region. In both of these scenarios, the impact of price elasticity242 on SDT
reduction would be negligible assuming that SDT costs are roughly proportional to sales
volume (i.e., a 5% decrease in sales volume leads to a corresponding 5% decrease in SDT
costs).243
Figure 6.2: Region-specific price increases
Region FY14 Sales ($M) Price increase required to cover SDT
Europe 437 12%
Korea 104 8%
Japan 102 11%
Okinawa 101 9%
Guam 70 23%
Other 45 14%
240 Assumes an elasticity of -5; a 10% decrease in CONUS traffic could drive a roughly $380M decline in sales. See Section 4: Pricing for additional detail 241 Using the savings level for branded items relative to lowest-sampled competitor. See Section 4.12 242 Elasticity refers to the percent change in traffic for a percent change in price (e.g., -5 means that customers will shop 50% fewer times if DeCA increases prices by 10%) 243 OCONUS traffic would likely be affected by a roughly 12% price increase, though SDT would likely decrease in similar proportion. Assuming a decrease in traffic of 31% (based on the patron survey), the traffic loss could be as great as $280M, reducing the benefit provided
132
In both scenarios, patron impact would be substantial. However, overseas commissaries tend to
have higher savings rates than U.S. commissaries. Specifically, DeCA estimates that overseas
commissaries provide a 46.5% discount compared to a 16-21% discount at U.S. commissaries
(see Section 4.1.3 for our evaluation of DeCA savings rates).244 Nevertheless, OCONUS-only
price increases could have a large impact on OCONUS COLA distributions. A study by the
DTMO suggested that a 10-20% increase in OCONUS commissary prices could drive a $32-64M
increase in COLA. In this case, savings in SDT would largely be offset by increases in COLA.
Therefore, we do not feel that either of these opportunities are high priorities going forward.
6.2.3. Increasing the proportion of local sourcing
DeCA would be able to reduce some appropriations for SDT by replacing goods shipped from
the U.S. with locally sourced goods. Local sourcing has the potential to reduce SDT with
minimal patron impact, but it could involve a number of challenges. First, DoD regulations
mandate that DeCA stock U.S. products except for perishable products, indigenous specialty
items, and products with no U.S. equivalent.245 These regulations would need to change in
order to allow DeCA to expand local sourcing. Second, local substitutes of U.S. products often
have different quality, ingredients, labeling, and appearance. In order to minimize patron
impact, DeCA would need to ensure that local products are close equivalents of U.S.
products.246 Lastly, DeCA would need to build buying capabilities to support negotiations and
contracting with overseas suppliers.
Based on our review, we believe that the potential upside from extensive local sourcing is not
enough to outweigh the potential challenges or the risk of impacting patron benefit. However,
there are opportunities for DeCA to pursue local sourcing through select "quick-win" categories
which avoid most of the risks and challenges discussed above (except the need for DoD policy
change).
The ideal product categories for local sourcing have high availability of substitutes, high cost of
shipping, low local prices, and short shelf-life.247 Some examples of quick-win categories for
244 Overseas discount based on 2014 DeCA price comparison study; CONUS discount based on BCG study 245 DODI 1330.17 Enclosure 6 246 65% of OCONUS patrons responded that the availability of American products is "very important" or "important" to them, according to 2015 May BCG patron survey (unweighted N=474) 247 Low local prices and short shelf-life both suggest that local sourcing could enhance patron benefit; through locally sourcing, they could access cheaper and fresher goods
133
local sourcing that meet the above criteria are bottled water, soda, juices, and household
cleaning goods (e.g., laundry detergent and bleach).248 These categories could offer substantial
savings relative to their retail value because they are costly to ship.249 We also believe that local
sourcing in these categories would pose minimal risk to patron impact given that these
categories often have equivalent products manufactured in the local market. Nevertheless,
DeCA should test new locally sourced products in select locations before rolling out broadly.
Overall, we estimate that there is a $5-10M total potential savings opportunity through locally
sourcing these quick-win categories.
Our analysis suggests that implementing local sourcing would pose minimal impact on
TRANSCOM250 rates. Currently, DeCA is responsible for approximately 6% of the worldwide
volume on ocean liners that TRANSCOM manages.251 Therefore, a 5-10% reduction in DeCA's
SDT spend implied by locally sourcing quick win categories would reduce overall TRANSCOM
volume by less than 1%. Moreover, TRANSCOM volume fluctuates much more significantly
based on military needs. For instance, TRANSCOM faced a 50%+ reduction in ocean liner
volume in FY14 compared to FY12 from troop reduction in Afghanistan.
6.3. Roadmap
We believe that any potential price increases to offset SDT should be considered in the broader
context of pricing changes, which are discussed in Section 4.3. Therefore our roadmap focuses
on other ways to reduce the burden of SDT, such as increasing local sourcing.
Successful implementation of local sourcing would involve two phases: a planning phase to
obtain necessary approvals and align on an implementation plan, and an implementation
phase to negotiate and contract with suppliers, introduce locally sourced goods at the
commissaries, and evaluate performance. Figure 6.3 summarizes our suggested approach.
248 Some items, in particular juices and household cleaning goods, would be suited for local sourcing in Europe but not in Pacific region 249 In FY14, the combined SDT cost for shipping bottled water and soda was roughly $4M 250 The United States Transportation Command is a unified command of the DoD which coordinates air, land, and sea transportation for DoD 251 For FY14, based on input from TRANSCOM
134
Figure 6.3: Summary of implementation roadmap for local sourcing
In the Planning Phase, DeCA would need to first obtain DoD approval to expand the categories
authorized for local sourcing. To allow DeCA to pursue quick-win opportunities, we
recommend that DoD expand its statutes on permissible categories of locally sourced goods to
include the following two categories of items:
Products sold in the U.S. primarily as non-brand name or store brand items and which
are available locally at comparable cost and quality; e.g., water and salt
Products packaged or manufactured overseas by the same vendor who produces the
equivalent product sold in U.S. commissaries; e.g., Coca-Cola and Nutella spread
In addition, the DeCA logistics directorate should align on a high-level plan for implementation.
Specifically, it would need to finalize the categories and regions for local sourcing. Moreover, it
should establish and equip a buyer team in each region responsible for the implementation.
DeCA currently has resources in regional offices dedicated to local sourcing who could be
leveraged for these additional categories.
In the implementation phase, the buyer team would need to identify prospective suppliers,
determine items to introduce, finalize contracts, and develop new planograms to introduce
locally sourced goods. In this negotiation process, the buyer team should only select local goods
Implementation phase I Implementation phase IIPlanning phase
Obtain DoD approval
• Request DoD to update its instructions to expand categories permissible for local sourcing
Set high-level plan• Finalize list of quick-win
categories and regions• Develop savings target
Establish buyer team• Leverage existing buyer team or
add new buyers to execute local sourcing for quick-win categories
Negotiate and contract with
suppliers• Negotiate and develop contracts
with local suppliers• Arrange for English labels if
necessary
Introduce goods• Introduce locally sourced goods
at overseas commissaries
Monitor performance• Evaluate sales performance of
locally sourced goods• Request customer feedback
and update assortment as necessary
Continue to monitor
performance
Evaluate additional
opportunities for local sourcing
135
that can match the U.S. products that they replace in terms of price and quality. Once DeCA
introduces locally sourced goods at overseas locations, buyers should monitor sales
performance and periodically request feedback from patrons. While local sourcing has inherent
risk of patron impact, buyers could minimize this risk by monitoring the performance of locally
sourced goods and adjusting assortment as necessary.
Figure 6.4: Summary of SDT next steps
Submit request for changes in DoD policy to approve expansions in local sourcing
Align on categories and regions to locally source
Develop a buyer team in each region to support local sourcing
Negotiate and contract with local suppliers
Test locally sourced goods at select commissaries and measure performance
Roll out at wider scale if patron impact is measured to be small
Continue to monitor sales performance and patron feedback
136
Section 7: Nonappropriated Fund (NAF) Conversion (Study
Objective 4)
7.1. Background
7.1.1. Introduction
DeCA is an Appropriated Fund (APF) entity, which means that it receives congressional
appropriations to operate and deliver its services. As an APF entity, DeCA operates within a
regulatory framework that impacts its operations, primarily in areas such as financial
management, personnel policy, and contracting.
Chapter 147, Subchapter 1 of U.S. Code Title 10 requires that DeCA use appropriations to
cover its operating expenses, stipulates the cost-plus pricing model, and specifies that the
surcharge proceeds can be used only for construction, repair, improvement, and
maintenance.252 As a result, DeCA's expenses are divided into three categories which are
earmarked for specific purposes:
Resale stock is used to purchase resale items and replenished through retail revenues
DeCA working capital fund (DWCF) covers all DeCA expenses and is funded through
appropriations each year
Surcharge Collections Trust Fund pays for Capex on physical infrastructure and store-
level IT equipment and comes from surcharge revenues.
While these regulations serve important public policy goals, they limit DeCA's ability to operate
commercial aspects of the enterprise efficiently. Because DeCA collects revenues from its
patrons, it has the potential to convert to a Nonappropriated Fund Instrumentality (NAFI). By
becoming a NAFI, DeCA would be able to better align regulatory requirements to commercial
activities and reduce its needs for APF.
Given the savings opportunities that NAF conversion presents, various studies on DeCA have
suggested NAF conversion as a lever to reduce its appropriations. For example, the recent
MCRMC report recommended that some or all commissary staff be converted to NAF status to
reduce personnel costs.253 AAFES also recommended in a 2015 position paper that DeCA
252 10 U.S. Code § 2483 253 Report of the Military Compensation and Retirement Modernization Commission, January 2015
137
become a NAF entity, citing potential wage rate savings.254 The most comprehensive recent
study of the impact of NAF conversion was an internal study conducted by DoD in 2002,255
which estimated an opportunity for $92M reduction in DeCA personnel costs. It recommended
that DeCA convert its workforce to NAF status but remain an APF activity for all other
purposes.
While we referenced these studies as background, we conducted our own diligence into the
benefits and feasibility of NAF conversion. To support our analysis, we interviewed military
resale experts, conducted quantitative analyses of potential benefits and costs, and applied
insights from other government transformation initiatives. In contrast to previous studies, our
investigation evaluated not only a potential workforce conversion but also the implications of
other operational aspects of NAF conversion, such as changes in DeCA culture and potential
patron impact. Moreover, we considered a potential implementation roadmap and analyzed
risks and challenges.
In our assessment, we organized our analyses around the following key questions:
What are the key differences between operating as an APF organization versus a NAFI?
What are the different types of NAFIs?
Given the differences between APF and NAF, what would be the benefits and costs of
NAF conversion for DeCA?
How would NAF conversion impact employees, patrons, and other stakeholders?
How should DeCA implement a NAF conversion?
7.1.2. Key differences between APF and NAF
Government entities operating under APF status and NAF status face different sets of rules and
regulations which primarily affect four areas: culture, financial management, personnel policy,
and contracting.
254 AAFES, "Position Paper: Exchange Response to Military Compensation and Retirement Modernization Commission Recommendation to Consolidate Exchanges and Commissaries", February 2015 255 DUSD (MC&FP) and DUSD (CPP), "DeCA Nonappropriated Fund Workforce – Feasibility and Desirability", December 2002
138
7.1.2.1. Culture
Broadly speaking, APF entities are budget-driven. APF entities provide services that advance
public policy goals rather than generate profit. They receive appropriations, implying that their
continued existence does not depend on financial performance. Moreover, APF regulations
provide significant employee protection, and APF entities typically do not eliminate employees
based on their performance.
On the other hand, NAFIs must generate revenue to sustain themselves. Profitability and cash
flow are bigger concerns for NAFIs because they cannot necessarily rely on appropriations to
offset potential losses or solve liquidity issues. Moreover, NAF employees' pay increases often
depend on performance and generally have less employment protection relative to their APF
counterparts. While both entities serve public interest, these differences imply that NAFIs are
likely culturally closer to the private sector.
7.1.2.2. Financial management
APF entities and NAFIs have different financial management needs, in particular for treasury
and accounting. APF entities tend to have a fairly limited need for treasury management.256 As
with other Federal Government entities, DeCA does not hold its own cash. Instead, the U.S.
Treasury holds and manages DeCA's appropriations. On the other hand, NAF entities have a
greater responsibility to manage cash, invest, and finance themselves similar to private sector
businesses. Unlike DeCA, the exchanges have dedicated treasury management functions within
their finance departments. The exchanges also earn interest on their investments.
In addition, APF entities and NAF entities have different sets of accounting rules that they
must follow. APF entities are required to follow generally accepted accounting principles
(GAAP) as specified by the Federal Accounting Standards Advisory Board (FASAB). On the
other hand, NAFIs need to produce financial statements that comply with GAAP as specified by
the Financial Accounting Standards Board (FASB).257 Moreover, NAFIs face additional sets of
256 Treasury management refers to administration of financial assets and holdings, with the goal of ensuring liquidity, manage funding and investing activities, and mitigate financial risks 257 GAAP set by FASB represents the private sector standards in accounting
139
reporting requirements that do not apply to APF entities.258 In order to convert to NAF, DeCA
would need to align its accounting capabilities and processes with NAF standards.
7.1.2.3. Personnel policy
DeCA employees are paid using congressionally appropriated funds. They are therefore civil
service employees, and their employment follows regulations set by the Office of Personnel
Management (OPM). On the other hand, NAF employees, who are paid using self-generated
revenues, are subject to a different set of rules often set by DoD or a specific military service.
These differences include pay scale, benefits, and employment terms and conditions (see
Figure 7.1).
Figure 7.1: Summary of differences in APF and NAF personnel policies
Category APF NAF
Wages (white-collar) General Schedule NAF pay band
Wages (blue-collar) Federal Wage System Federal Wage System
Benefits
Federal Employee Retirement System
Federal Employee Health Benefits
Entity-specific retirement plan
NAF Uniform Health Plan
Employment terms Office of Personnel
Management (OPM) regulations
DoDI NAF personnel policy259
Service-specific regulations
In terms of wages, both APF entities and NAFIs use different wage schedules for white-collar
and blue-collar employees. "White-collar" refers to administrative and clerical positions,
including most above-store employees and sales store checkers. "Blue-collar" refers to manual
labor positions such as custodial workers, meat-cutting workers, and store associates. In
general, APF employees tend to receive higher wages than NAF employees.
For white-collar employees, the APF pay system is the General Schedule (GS) and the NAF
equivalent is the NAF pay band system. The GS pay scale has comparatively more rigid rules
258 These additional reporting requirements include "APF and NAF expense summary", "NAFs Available / Projected Usage", and "USA and UFM Practice Reports." Details are in DoDI 1015.15 259 DoDI 1400.25
140
about the possible range of pay and pay increases for any given position than the NAF system.
The GS consists of 15 pay grades with 10 step rates in each grade. Employees are automatically
eligible for within-grade step increases with tenure, as long as they maintain an acceptable level
of performance. On the other hand, the NAF pay band consists of 6 pay bands, with only
minimum and maximum rates specified for each band. NAF pay bands do not have pay steps,
and pay increases are based on performance. As a result, NAF pay bands tend to offer
employers significantly more flexibility in setting wages, in particular in the lower range of
wages. Both systems have geography-specific wage schedules. For instance, in the Richmond,
VA wage area, NAF pay bands have wider possible salary range than comparable GS grades,260
with minimum salary often more than 20% lower for NAF employees (see Figure 7.2):
Figure 7.2: Comparison of white-collar APF and NAF salary ranges in Richmond, VA area
GS grade range APF salary range261 ($) Comparable
NAF pay band NAF salary range262 ($)
GS-1 to GS-3 21,152 – 33,737 NF-1 16,700 – 35,080
GS-4 to GS-5 29,130 – 42,371 NF-2 20,060 – 46,710
GS-6 to GS-8 36,329 – 58,127 NF-3 28,720 – 63,500
GS-9 to GS-12 49,382 – 93,101 NF-4 34,500 – 100,000
GS-13 to GS-15 85,157 – 153,882 NF-5 67,000 – 158,700
SES263 148,700-203,700 NF-6 N / A
For blue-collar employees, APF entities and NAFIs both use the Federal Wage System. In both
cases, the wage schedule consists of 15 pay grades and 5 step rates in each grade, determined
based on annual surveys of private sector wages. However, the methodology and scope of the
wage survey differs for APF and NAF. The APF survey covers wholesale, manufacturing,
communications, and transportation industries, and only includes firms with more than 50
employees. The NAF wage survey only covers wholesale, retail, recreation, and service
industries, and includes firms with more than 20 employees. Because retail and service
260 The correspondence between GS and NAF pay bands is as presented in Figure 7.3 261 OPM, "Salary Table 2015-RCH", January 2015; note that this range represents the minimum and maximum wages for the specified pay grades, but the employer does not have the ability to choose freely within this range as NAF employers do 262 DCPAS, "NAF Pay Ranges for the Richmond/Chesterfield, VA Wage Area – Schedule #032-41-B", January 2015 263 Senior Executive Service – based on OPM, "Salary Table No. 2015-EX", January 2015
141
industries and smaller firms tend to have lower wages, the NAF wages are typically lower than
the APF wages for the equivalent pay grade. See Figure 7.3 for an illustration of this wage
difference in Richmond, VA, where NAF hourly rates are approximately 35% lower than APF
hourly rates for the same pay grade.
Figure 7.3: Comparison of blue-collar APF and NAF salary ranges in Richmond, VA area
APF pay grade
APF hourly wage range264 ($)
NAF pay grade
NAF hourly wage range265 ($)
WG-1 11.59 - 13.52 NA-1 8.29 - 9.65
WG-2 13.15 - 15.33 NA-2 8.90 - 10.43
WG-3 14.65 - 17.10 NA-3 9.65 - 11.25
WG-4 16.19 - 18.89 NA-4 10.57 - 12.35
WG-5 17.75 - 20.68 NA-5 11.51 - 13.45
WG-6 19.07 - 22.26 NA-6 12.29 - 14.34
WG-7 20.30 - 23.68 NA-7 13.03 - 15.20
WG-8 21.66 - 25.27 NA-8 13.76 - 16.06
WG-9 22.95 - 26.78 NA-9 14.52 - 16.91
WG-10 24.09 - 28.08 NA-10 15.25 - 17.79
WG-11 25.19 - 29.42 NA-11 16.00 - 18.63
WG-12 26.25 - 30.80 NA-12 16.72 - 19.52
WG-13 27.44 - 32.07 NA-13 17.47 - 20.36
WG-14 28.62 - 33.44 NA-14 18.20 - 21.25
WG-15 29.74 - 34.76 NA-15 18.93 - 22.08
Benefits for APF and NAF employees also differ. As a general rule, APF benefits tend to be
federally administered programs. For instance, APF employees are eligible for Federal
Employees' Health Benefits, Federal Employees' Group Life Insurance, and Federal Employees
Retirement System. These programs, managed by OPM, ensure that all civil service employees
have access to a standard set of benefits. On the other hand, many of the same benefits such as
264 DCPAS, "Federal Wage System Regular and Special Production Facilitating Wage Rate Schedules for the Richmond, Virginia (RCH) Wage Area", January 2015 265 DCPAS, "NAF Wage Schedules for the Chesterfield-Richmond, Virginia (RCH) Wage Area – Schedule #032", December 2014
142
life insurance and retirement benefits are decentralized for NAF entities. Therefore, NAF
entities tend to have greater flexibility in determining their own benefits. See Figure 7.4 for a
summary of the differences in benefits.
Figure 7.4: Summary of the employee benefits in APF versus NAF
Benefits APF NAF266
Retirement
Social Security – Federal mandate
Pension plan – FERS and CSRS267
Thrift Savings Plan (Federal equivalent of 401k)
Social Security – Federal mandate
Pension plan – Entity-specific retirement plan
401k
Health insurance
Federal Employees Health Benefits
Federal Employees Dental and Vision Insurance Program
Choice between NAF Uniform Health Plan and HMO Health Plans
Worker's compensation
Federal Employees' Compensation Act
Longshore and Harbor Workers' Compensation Act
Although different laws govern NAF employees and APF employees in terms of workers'
compensation, the stipulated benefits are similar.268 For example, both Federal Employees'
Compensation Act (which applies to APF) and Longshore and Harbor Workers' Compensation
Act (which applies to NAF) guarantee that 100% disabled employees are eligible to receive
66.7% pay for the duration of their condition. Moreover, they have an identical compensation
schedule for permanent disability.269
DoD instructions that govern NAFIs constrain employers significantly less in defining
employment terms than OPM regulations which cover APF entities.270 Major categories of
differences include reduction and realignment, employee relations, and staffing. First, NAFIs
are able to use Business Based Actions (BBA) to reduce force, which use more flexible criteria
than Reduction in Force (RIF) procedures that APF entities must follow. For example, whereas
RIFs are restricted to specific purposes such as reorganization, lack of funds, and elimination of
266 Based on benefits offered at NEXCOM 267 Federal Employees Retirement System and Civil Service Retirement System 268 U.S.C. 5 Chapter 81 and U.S.C. 33 Chapter 18 269 100% disabled means unable to perform the substantial duties of the regular occupation 270 NAFIs have their own policies that implement DoD instructions. However, NAF is in general more flexible because many of its HR rules are based in policy rather than statute
143
duties, BBA procedures can be used for a wider range of reasons including business
realignments and a need to be competitive with the local labor market. Moreover, NAFIs have
greater flexibility in determining which employees to separate because the primary factor in
the BBA selection process is performance, whereas the APF RIF process is seniority-focused.
Additionally, APF employees tend to have more formal recourse for grievances and appeals.
For example, they are able to appeal adverse actions to the Merit Systems Protection Board
(MSPB), and APF employers have the burden of proving that their actions were justified. In
contrast, NAF employees only have the right to appeal to MSPB for issues concerning
retirement portability and specific violations of their employment rights.271
Finally, APF employers face more regulations in terms of hiring and staffing. Our internal
interviews with DeCA suggest that it is often necessary to begin the administrative process
associated with hiring roughly three months ahead of the start date. NAFIs tend to be more
flexible, with the ability to start an employee with roughly eight weeks lead time. Further, civil
service positions often require U.S. citizenship, while most NAF positions do not.
7.1.2.4. Contracting
NAFIs face fewer contracting regulations than APF entities. In particular, NAFIs do not need to
comply with the Federal Acquisition Regulation (FAR) and the Defense Federal Acquisition
Regulation Supplement (DFARS), which specify permissible contracting practices, required
sources of certain supplies and services, necessary supplier qualifications, and a range of other
requirements. The socio-economic programs stipulated in FAR include small business,
environmental, and occupational programs. These regulations are extensive: the Defense
Business Board noted in April 2012 that the handbook for acquisition officers is 962 pages long;
DFARS consists of 1,903 pages; and FAR tops off at 2,013 pages.272 In contrast, the Department
of Defense Instruction and accompanying Military Department regulations that govern NAF
procurement are significantly less voluminous.273
271 NAF employees do have formal administrative grievance and appeal processes 272 Defense Business Board, "Linking and Streamlining the Defense Requirements, Acquisition, and Budget Process", April 2012 273 DODI 4105.67 is 21 pages long and requires Military Departments to set their own procedures to implement all applicable laws and policies
144
Although NAFIs do not need to comply with FAR and DFARS, there are several procurement
regulations that apply in both APF and NAF environments. For instance, the Service Contract
Act requires that government contractors provide wages and fringe benefits that are no less
than the prevailing rate in a specific locality.274 Further, the Davis-Bacon Act specifies a similar
requirement to provide local prevailing wages for construction workers on public buildings or
public works projects. Finally, the Buy American Act limits the acquisition of foreign products
and construction materials by government entities.
7.1.3. Distinctions in NAF categories
There is a wide range of possible funding statuses that NAFIs can take, from heavy reliance on
APF to no reliance on APF.275 Depending on its ability to generate revenue, each MWR activity
receives a funding category (see Figure 7.5). This designation has implications about the types
of expenses for which a particular NAF activity can receive APF support.
Figure 7.5: Summary of Morale, Welfare, and Recreation (MWR) program categories and funding levels276
Category Description Examples Funding
level
Category A – Mission sustaining
Virtually no capacity to generate revenues
Fitness, library, community centers
At least 85% APF
Category B – Basic community support
Limited capacity to generate revenues
Child & youth programs, pools, sports programs
At least 65% APF
Category C – Revenue generating
High capability to generate revenues
Exchanges, golf, bowling Only indirect APF support
The exchanges are currently designated as Category C NAF entities. This implies that they can
only receive APF for certain limited purposes, including second destination transportation
(SDT), major and minor construction driven by non-business reasons, sustainment and
restoration projects, and utilities.277 In FY13, the exchanges collectively received $397M in APF,
274 Applicable for contract work above $2,500 in value 275 DoDI 1015.15 outlines the policies governing the APF support that NAFIs can receive 276 Michael Kelly, "Resale Activities and Nonappropriated Fund Policy", July 2013 (based on DoDI 1015.15) 277 DoDI 1015.15 "Establishment, Management, and Control of Nonappropriated Fund Instrumentalities and Financial Management of Supporting Resources", October 2007
145
including $179M for SDT, $170M for contingency support, and $47M for direct and indirect
operating costs.278
If DeCA were to become a NAFI under the current legal framework, we anticipate that it would
be considered for Category C status like the exchanges. In FY14, DeCA would have been
eligible to receive at least $359M in APF support if it were a Category C NAFI.279 Assuming that
the cost optimization levers as outlined throughout this report realize their full savings
potential, DeCA would be eligible to receive approximately $260M in APF support as a
Category C NAFI.280
In addition, the current legal framework also provides for MWR activities to use APF funds that
they receive for NAF purposes. Through this process, MWR activities can receive
appropriations, convert them to NAF, and use them in accordance with NAF regulations. As a
result, MWR activities can take advantage of the cost benefits of NAF without having to
manage a separate APF system. The conversion of APF to NAF generally takes place under one
of three authorities: Uniform Funding Management (UFM), Memorandum of Agreement
(MOA) under Section 2492, 10 U.S.C., or Utilization, Support, and Accountability (USA). Of
these authorities, UFM is used most frequently, with several instances of successful
implementation in the recent past by the MWR organizations of the Army, Air Force, Navy,
and Marine Corps.
7.2. Opportunity
7.2.1. Potential benefits
We believe that NAF conversion would produce significant benefits in at least three areas:
quantifiable wage and benefits savings, enablement of store operations levers, and intangible
benefits including contracting flexibility and changes in culture. In total, NAF conversion could
generate as much as $125-225M in annual run-rate savings from wage and benefits adjustment
and store operations levers (See Figure 7.6).281
278 Report of the Military Compensation and Retirement Modernization Commission, January 2015 279 The sum of FY14 spend on SDT, Utilities, and Sustainment Capex 280 Based on the assumption that SDT would be reduced by roughly $50M and sustainment projects would be reduced by approximately $50M (half of Capex reduction opportunity) 281 Savings could take over 10 years to reach full run-rate; based on current attrition level, we expect that savings would reach 60% of run-rate in 5 years and 84% in 8 years
146
Figure 7.6: Summary of NAF conversion benefits
7.2.1.1. Wages and benefits
The primary cost-saving benefit of NAF conversion for DeCA would be tangible reduction in
labor costs. As discussed in Section 7.1.2.3, the NAF environment tends to provide for lower
and more flexible wage schedules compared to APF. We estimate that annual run-rate savings
in wages and benefits combined could be $95-155M.
We analyzed the wage savings potential of NAF conversion by incorporating two approaches.
First, we conducted an updated NAF wage survey with DCPAS that incorporates wage data
from grocers in five survey regions into the existing survey data. We selected these survey
regions in order to create a representative sample of diverse geographical regions, costs of
living, and union presence. We used this approach primarily to calibrate the potential savings
for blue-collar positions because the NAF wage survey defines the precise wages given pay
grade and pay step in the blue-collar wage schedule. On the other hand, we did not use the
survey output to drive our analysis for white-collar positions since the survey only specifies
Category DescriptionAnnual run-rate
savings ($M)
Wages
• Greater pay band flexibility under NAF for both in-store and above-store positions; generally lower wages
60-110
Benefits
• More flexible rules concerning benefits under NAF across retirement, health, and worker's compensation
35-45
Labor
flexibility
• NAF labor regulations more flexible; allows for faster adjustment of workforce size and composition
30-70(see 'store ops')
Contracting• NAF contracting not subject to FAR and
DFARS Qualitative benefit
Aligned
incentives
• NAF provides incentives for profit generation by allowing for retained earnings
Qualitative benefit
147
minimum and maximum in each pay band, leaving each NAFI with significant flexibility to
negotiate wages with its white-collar employees.
Second, we compared current DeCA wages with NAF wages at the exchanges using AAFES and
NEXCOM wages as a benchmark.282 We calculated the difference in wages at each pay grade
for white-collar in-store positions, blue-collar in-store positions, and above-store positions.283
Then, we calculated the level of reduction possible for above-store and in-store positions by
weighing the wage gap at each pay grade by the number of DeCA employees at that level. We
used this approach primarily to estimate the expected savings for white-collar positions.
Based on these analyses, we found that NAF wages would be on average about 20% lower than
DeCA wages for comparable pay grades of in-store positions. This wage gap was calculated as a
weighted average of white-collar positions, for which we observed about 10% lower wages,284
and blue-collar positions, for which we observed approximately 35% lower wages.285 Therefore,
we expect NAF conversion could drive a 15-25% reduction on DeCA in-store labor costs. The
exact level of savings, however, would depend on the degree to which DeCA and government
decision-makers are willing to reduce average employee wage levels.
On the other hand, while the exchanges had lower wages for low-level positions, they tended to
have higher wages for positions that were equivalent to GS-9 or above (approximately 5-10%
higher than DeCA).286 However, we assumed no change in wages for above-store positions
because NAF pay bands have greater flexibility compared to APF. Even after converting to
NAF, DeCA could choose to use wages that are roughly equivalent to its current wages for
above-store positions. NAF conversion would also give DeCA the flexibility to deliberately raise
its wages in some places to attract high-caliber talent (see Section 7.2.1.3).
We estimate that converting to NAF could allow DeCA to save $35-45M annually on benefits.
We calculated the potential savings by comparing the current benefits level at DeCA relative to
282 The exchanges provided a useful benchmark of the prevailing wages for white-collar retail positions within the NAF context 283 We excluded OCONUS from the calculation due to its limited impact on potential savings and additional complexity associated with it 284 For NEXCOM, 8% reduction relative to DeCA; for AAFES, 11% reduction relative to DeCA 285 Based on NAF wage survey, weighted average of savings due to going from restricted APF schedule to restricted NAF schedule with grocery for each surveyed location 286 Low-level positions include NF-2 and NF-3; higher-level positions include NF-4 and above
148
AAFES and NEXCOM. We compared benefits across health benefits, retirement benefits
(including retiree health benefit), disability insurance, life insurance, and bonus and awards.
We found that DeCA and the exchanges incur relatively similar costs for benefits: DeCA and
NEXCOM offer benefits costing 23% of the total payroll cost and AAFES offers benefits worth
21% of total payroll cost.287 We assumed that DeCA would be able to reduce its cost of benefits
as percent of payroll to the same level that AAFES currently incurs. Benefit costs that are a
function of wages would also reduce based on the wage savings explained above.288
7.2.1.2. Enablement of other efficiency levers
In addition to the quantifiable wage and benefits savings, NAF conversion would also allow
DeCA to pursue other savings opportunities. For example, NAF conversion would enable DeCA
to act on several store operations levers, which in total could generate $30-70M savings. These
cost savings levers include in-sourcing contractor stocking, in-sourcing deli / bakery and seafood
operations, and adjusting labor mix (see Section 10.5).
Currently, DeCA offers above-market wages for store labor and does not have the ability to
speedily hire and separate employees, use business-based actions to adjust the size of the
workforce, or offer performance-based pay. These constraints add to the cost of carrying in-
store labor and skew the economics toward outsourcing in situations where private sector
grocers are more likely to in-source to save costs. By converting to a NAF entity, DeCA would
be able to employ private sector best practices and reduce labor cost through in-sourcing.
These changes would not only directly reduce DeCA's reliance on appropriated funds, but also
strengthen consolidation synergies. If DeCA and the exchanges were to consolidate even
partially, NAF conversion would unlock potential synergies for DeCA.289 Without NAF status,
DeCA would have limited back-office and purchasing synergies with the exchanges since HR,
finance, and procurement policies are different between APF and NAF.
287 Total payroll cost refers to the sum of wages as well as cost of benefits. In calculating NEXCOM benefits, we did not include pension expenses that did not involve employer cash contribution 288 That is to say, benefits would decrease if total payroll costs decreased (when benefits as percent of total payroll cost are constant) 289 We believe that NAF conversion is necessary for back-office, GNFR sourcing, and Capex consolidations of DeCA and the exchanges; integration of these functions contribute $30-45M to consolidation synergies
149
7.2.1.3. Intangible benefits
There are other less quantifiable advantages of NAF conversion. These benefits include
changes in DeCA's culture, wage flexibility, and contracting flexibility.
Because DeCA is an APF organization, it is not permitted to retain its earnings.290 This results in
a limited incentive to pursue greater operating efficiencies because DeCA neither has profit
targets nor distributes any kind of dividend back to patrons or other stakeholders. Generating
additional revenue or reducing costs other than COGS does not improve DeCA's bottom line or
benefit patrons. The cost savings levers that DeCA is able to pull as an APF entity, such as
reducing store hours, generally reduce patron benefit. NAF conversion could better align
DeCA's incentive structure with revenue growth and cost reduction, which would help reduce
the need for APF and could also improve patron benefit.
In addition, since NAF wages are negotiable, NAF conversion would enhance DeCA's ability to
recruit top talent. Like most agencies, DeCA is currently limited in its ability to compete with
the private sector to recruit top talent using competitive compensation. However, we believe
DeCA could use wage flexibility to build a pipeline of employees with critical skills (e.g., project
management, analytics, and vendor negotiations) to achieve its transformation objectives. In
fact, other agencies, such as NASA, are already rejuvenating their human capital approaches to
include offering improved compensation packages to better recruit employees with critical
skills.291 For DeCA, building and maintaining innovative human capital capabilities using tools
like wage flexibility could be a critical first step in its journey.
Finally, NAF conversion would allow DeCA to contract without being subject to FAR and
DFARS. While these regulations serve a positive social role and reinforce the public nature of
DeCA's mission, they significantly increase the level of complexity and bureaucratic burden for
both DeCA and vendors.292 As noted in Section 7.1.3.4, both APF entities and their contractors
290 Congressionally appropriated funds have a specific purpose and timeframe for budget execution, and APF entities are not legally permitted to use appropriated funds outside of these specified uses 291 GAO-12-1023T Human capital management – Effectively implementing reforms and closing critical skills gaps are key to addressing Federal workforce challenges 292 For instance, acquisition specialists from the Congressional Research Service have testified before Congress in the past two years that, in regard to streamlining Acquisition Laws and Regulations , that “in some instances, regulations aimed at improving the acquisition process or promoting important public-policy goals impose unintended cost or regulatory burdens to industry. A number of analysts have
150
face significant regulatory challenges that they must overcome before they are able to conduct
business. Experts have argued that the extensiveness of the compliance requirements necessary
in government contracting discourages competition and increases prices that APF entities
face.293
While it is difficult to quantify the exact level of savings, we believe that NAF conversion would
reduce contracting costs in at least three ways. First, it would reduce the contracting process
costs that DeCA faces. Removal of FAR and DFARS would not only encourage competition but
also allow vendors to pass through savings associated with lower bidding process overhead.
Second, DeCA would require fewer resources to manage contracting under a less constrained
environment. At a minimum, DeCA would be able to repurpose its Office of Small Business
Programs whose primary purpose is to ensure compliance with the small business requirement
embedded in FAR. Third, DeCA would be able to participate more actively in consolidated
buying with the exchanges. Without NAF conversion, there would continue to be a barrier to
further procurement collaboration between DeCA and the exchanges.
7.2.2. Implications for stakeholders
In our assessment, we considered the impact of a potential NAF conversion on three key
stakeholders of DeCA: patrons, employees, and the broader military.
First, our research indicates that NAF conversion would not have a direct impact on DeCA
patrons. NAF conversion does not directly affect the benefit that DeCA provides to the patrons,
such as prices, assortment, or store hours. In addition, the experience at the exchanges suggests
that NAF conversion would not materially diminish patron satisfaction in the long run. Results
from the 2014 American Customer Satisfaction Index (ACSI) score DeCA's customer service
rating at 72, compared to a score of 75 for NEXCOM, 70 for MCX, and 68 for AAFES.294 These
argued that repealing or amending regulations that no longer provide a benefit could serve to simplify the acquisition process, remove unnecessary regulatory burdens on industry, and entice more companies to compete for defense and other federal government contracts. Refer to "Twenty-five Years of Acquisition Reform: Where Do We Go From Here?", October 2013 293 According to the Government Accountability Office (GAO), "the cumulative effect of insufficient profit margins and the challenge of operating in accordance with complex federal acquisition regulations discourage small and innovative businesses from partnering with the Government." Refer to "Highlights Of A GAO Forum Managing The Supplier Base In The 21st Century", March 2006 294 Military.com, "Study: AAFES Tied With Walmart for Lowest Customer Satisfaction", February 2015
151
scores indicate that DeCA does not have a significant advantage over the exchanges in terms of
patron satisfaction.
However, we believe that NAF conversion may affect commissary patrons indirectly because of
potential impacts to employee morale and performance. The majority of NAF conversion
savings would come from reduction of wages and benefits, which could affect employee morale
and negatively impact patron experience. Therefore, it is imperative for DeCA to communicate
transparently about the conversion process, execute the conversion in a fair and professional
manner, and provide appropriate compensation for impacted employees. Additionally, we
suggest that DeCA execute the conversion to NAF through attrition alone rather than forced
conversion to minimize impacts on current employees.
On the other hand, the cultural shift from being a budget-driven service to a self-sustaining
business may motivate employees to provide a superior patron experience. Operating as a
business may create a more patron-conscious attitude and lead to improvements in functions
such as merchandising and marketing. For example, NAF entities have the ability to offer
performance-based pay, which DeCA could use to incentivize employees.
While in the long run NAF conversion could reduce employee benefits, DeCA could mitigate
the impact to current employees. First, current employees would be able to retain their current
level of pay for two years and their retirement benefits, regardless of whether they convert
voluntarily or involuntarily. Portability laws allow APF employees who move to NAF positions
to retain their retirement plans, including both the pension plan (i.e., FERS or CSRS) and Thrift
Savings Plan.295 Additionally, current employees would not experience significant impact in
terms of union membership. Both APF and NAF employees have the ability to collectively
bargain through unions, and employees who convert can be grandfathered to maintain their
current membership.
Finally, our research suggests that the impact on other military stakeholders could be relatively
small. First, DoD could eliminate the second-order impact of including DeCA in the NAF wage
schedule by establishing a separate NAF wage schedule specific to DeCA. The exchanges and
295 Includes Portability of Benefits for NAF Employees Act of 1990, 1996 National Defense Authorization Act, and 2002 National Defense Authorization Act
152
other military MWR activities would then face no change in the wage schedules that they
currently use. If DeCA were included in the overall NAF wage schedule, the wage survey (see
Section 7.2.1.1) suggests that MWR and exchange blue-collar wages would increase on average
by 1.4%.296 This implies a potential increase of approximately $5M in total wages paid by the
exchanges.297 In addition, NAF conversion would not materially impact the Federal retirement
systems. Although the transition process may cause a short-term spike in the administrative
burden on the retirement systems and in particular the portability office, the long run effect
would be minimal. DeCA employees represent less than 1% of total civil service employees.
7.3. Roadmap
7.3.1. Key legislative requirements
A successful NAF conversion would require legislative changes. Congress must legislate to give
DeCA an explicit permission to use its own revenues, to include the surcharge if applicable, for
NAF purposes. By updating Chapter 147 of U.S. Code Title 10, Congress would also enable
DeCA to apply authorities to convert APF to NAF (see Section 7.1.3).
Additionally, DeCA could require approval from Congress to enable DeCA-specific NAF wage
schedules if the NAF Personnel Policy Office's authority is insufficient. There are two core
options for DoD to consider:298, 299
Maintain DeCA as new NAF schedule (recommended): This option requires policy approval
to create a separate NAF survey for the grocery industry for both white-collar and blue-collar
positions.300 DoD would maintain the same wage schedule for the overall NAF workforce,
eliminating the potential for disruption to existing NAF survey activities and pay bands. This
option also would remove any secondary impact of DeCA's NAF conversion on MWR wages.
296 Assuming the wage schedule remains restricted (see Section 7.3.1); if the wage schedule becomes unrestricted as a result of DeCA's inclusion, the gap could be 7.7% 297 Assuming the wage schedule remains restricted; if the wage schedule becomes unrestricted as a result of DeCA's inclusion, the potential impact could be as large as $30M; this potential impact does not include any additional impact on other MWR activities 298 When it is fiscally and legislatively feasible to do so, DoD increases its internal rates to be competitive with the market – referred to as Unrestricted. However, at times DoD's flexibility to raise wages is limited by legislation, capping increases before reaching parity with the market – referred to as Restricted 299 Based on insights from interview with DCPAS, June 2015 300 Given the difficulty of calculating wage schedule based on a single industry, DoD may want to combine survey output from grocery industry survey and the existing NAF wage survey to create a new wage schedule for DeCA
153
This option would set a new precedent for adding categories where there is a unique business
case for keeping the converted organization separate (e.g., avoid significantly increasing costs
for the broader NAF workforce for the benefit of including one new category).
Integrate DeCA into broader NAF schedule (traditional alternative): This option would
require NAF wage surveys to include the grocery industry, which could significantly increase
wages for existing NAF entities. While this option aligns to historical precedents for adding new
categories, it is not the recommended option due to the potential impact to other NAF
organizations.
Finally, Congress would need to approve a financial transition plan that outlines the upfront
one-time investment (see Section 7.3.3), level of annual APF support during the transition
period, and end-state level of APF support. To reduce appropriations without impacting patron
benefit, DeCA should aim to become a Category C NAFI with minimal reliance on APF in the
long run.301 Given that DeCA would continue to receive some level of APF, DeCA would need to
rely on an authority like UFM to continue receiving appropriations while realizing NAF cost
benefits. Specifically, Congress should authorize DeCA to receive at least the amount of APF
expected to be necessary each year based on an annual savings estimate (see Figure 2.30 for an
example) and allow DeCA to use UFM for this same amount.302 UFM would allow DeCA to
capture the benefits of NAF conversion before it has realized enough savings to become less
reliant on APF support.
7.3.2. Implementation roadmap
We believe DeCA should execute NAF conversion in concert with the broader process of
military resale consolidation. In particular, DeCA should conduct NAF conversion in
conjunction with exchange back-office consolidation. DeCA would be able to mitigate the
implementation challenges of NAF conversion by leveraging the NAF capabilities that the
exchanges currently possess. This section describes the implementation steps specific to NAF
conversion, while Section 8.3 outlines the phases of the overall consolidation, including the
back-office consolidation of DeCA with the exchanges.
301 Policymakers should also consider creating a separate funding category for DeCA so that it is able to receive APF for expenses not specified as available for appropriations for Category C 302 Congress should also authorize "buffer" APF to allow DeCA to continue to operate in the event that savings do not materialize in line with expected ramp-up
154
DeCA should prepare for conversion during the Planning Phase and Implementation Phase I,
and execute NAF conversion in Implementation Phase II. Figure 7.7 summarizes this potential
roadmap:
Figure 7.7: Summary of implementation roadmap for NAF conversion
In the planning phase, DeCA would define its approach to NAF conversion. This would require
DeCA leadership and government decision-makers to align on key decisions. For example, they
would need to determine whether employee conversion would be done through attrition and
voluntary conversion or though forced conversion by evaluating the trade-off between
employee interests and expediting conversion-related savings. Additionally, they would need to
align on a financial transition plan to reduce current-state APF to end-state APF. The speed of
this transition and expected APF reduction would impact the degree of financial risk DeCA
could face. Finally, policymakers including the NAF Personnel Policy Office and Congress
would need to grant DeCA the authority to execute NAF conversion using the agreed-upon
approach.
In Implementation Phase I, DeCA would need to prepare detailed plans for operational
changes and communication. Specifically, DeCA would need a detailed transition plan to
enable NAF operations in finance, human resources, and contracting functions. Assuming
DeCA would leverage the NAF back-office capabilities of the exchanges, the transition plan
155
should detail the manner in which necessary data would flow through from DeCA systems into
consolidated exchange back-office (which we refer to as the shared service business unit or
SSBU; see Section 8.3 for detail ). In addition, DeCA would need to build a robust
communication and change management strategy. Given the extent to which NAF conversion
could affect employees, DeCA should prepare a careful plan to minimize impact on employee
morale and sustain cultural change.
Starting in Implementation Phase II, DeCA would convert to NAF operations in finance, human
resources, and contracting, and begin the employee conversion process. DeCA should convert
to NAF by transitioning its back-office activities to the SSBU.303 In the short run, DeCA
resources would focus on supporting back-office consolidation efforts. In the long run, they
would manage remaining APF-related activities until the completion of the transition process.
For instance, in HR, DeCA would need to continue to support APF employees, while the SSBU
would handle all new and converted employees. In contracting, DeCA would continue to
manage APF contracts until they reach their end date.
As stated above, there are two potential approaches for DeCA to drive employee conversion.
We recommend that DeCA utilize a mixture of attrition and voluntary conversion. Following
this approach, DeCA would likely face fewer administrative, political, and employee
satisfaction-related challenges.304 DeCA would be primarily responsible for filling vacant
positions with NAF employees and administering the voluntary conversion process (e.g.,
conducting information sessions, passing employee data to the SSBU, processing retirement
portability, etc.).305 If applicable, DeCA would also be responsible for administering early
buyout activities to expedite employee conversion.
Alternatively, DeCA could leverage congressional assistance to apply forced conversion. Today
OPM regulations do not authorize DeCA to involuntarily convert employee status. If Congress
approved forced conversion, DeCA would communicate its plan and the details for the
conversion at the beginning of Implementation Phase I. At this time, DeCA would provide a
grace period for its employees to accept the conversion arrangement. During the forced
303 See Section 7.3.3 for details 304 Save pay and portability of benefits are provided for two years; however, changes to critical inputs of job satisfaction (e.g., wages, benefits, expectations, employee rights) could impact employees 305 Our analysis suggests that number of employees who would convert would be limited because NAF status generally offers lower protection and lower compensation than APF
156
conversion, DeCA would need to contract temporary staff to manage communications, design
and administer incentive packages, help existing employees find new work, support NAF hiring
as needed, and resolve disputes. Although this approach would be faster to realize NAF-
enabled savings, we would not recommend forced conversion because it would heighten
impact on employees.
After beginning to execute the conversion, DeCA would need to maintain these support
activities until its workforce is 100% NAF. Additionally, DeCA would have to track progress and
continuously refine its approach for expediting and supporting attrition and conversion. Finally,
DeCA would also need to manage conversion-related inquiries and address issues that could
arise from maintaining dual personnel systems (e.g., portability issues).
7.3.3. One-time costs
NAF conversion would require some one-time costs. However, the level of necessary
investment would depend on the approach DeCA takes in executing the employee conversion,
as outlined in Section 7.3.2. We organized our estimation of one-time costs into four categories:
IT integration costs, insurance requirements, transition management costs, and employee
compensation.
First, DeCA would need to reconfigure its IT systems and processes so that necessary finance,
HR, and contracting data would flow through to appropriate NAF-enabled functions, whether
they reside within or outside of DeCA. We expect that these IT upgrades would cost $10-15M.306
This investment would cover expenses necessary to support activities such as transition
planning, data migration, and potential development of additional application features.
Although this estimate is in line with implementation costs required in other IT initiatives of
similar scale that the military resale system has undertaken, a bottom-up analysis would be
necessary to develop more robust estimates for IT costs.
Next, DeCA would face additional insurance requirements by converting to a NAFI. Currently,
DeCA has minimal insurance requirements because the U.S. Government essentially acts as its
306 This IT upgrade cost estimate is incremental to the IT integration costs calculated for consolidation. We estimated these integration costs as approximately 75%-125% of our evaluation of IT savings opportunity for DeCA. Our estimate of IT savings opportunity for DeCA is estimated by taking 8-15% of Opex and 20-30% of Capex at DeCA. While NAF conversion does not produce IT synergies, we believe that potential savings represent a useful proxy for evaluating transformation costs
157
insurer. For example, the Federal Tort Claims Act (FTCA) covers most cases of claims made
against DeCA. If the U.S. Court of Federal Claims finds that DeCA is liable for any torts,
additional appropriations would be made available for the payment of awards, compromises,
or settlements.307 In addition, the Military Claims Act (MCA) covers other claims that FTCA
does not cover. Settlements under MCA would be paid out of claims funds that are
appropriated to the military components. Therefore, DeCA does not currently require its own
insurance for potential liabilities.
On the other hand, NAFIs do not have the same level of claims protection. They are responsible
to insure themselves in areas such as workers' compensation, property liability, and public
liability. While the long run costs of these additional insurance requirements are small,308
NAFIs need to have a cash reserve to become self-insured. If DeCA were to convert to a NAFI,
DeCA could require $30-50M309 in one-time APF to build a cash reserve for self-insurance.
The level of transition management costs would depend on how DeCA converts its employees.
If DeCA were to convert employees through attrition, transition management requirements
would likely be smaller. We believe that under such a scenario, the Integration Management
Office (IMO – see Section 8.3) would be able to perform a project management role for NAF
conversion with minimal incremental resources. However, if DeCA were to force convert its
employees to NAF status, additional transition management would be required. Not only
would DeCA need its own transition management office to oversee the conversion process, it
would also require incremental resources for dispute resolution, employee hotline, hiring, and
training. We believe that incremental resources required in forced conversion could be in the
magnitude of 50-150 FTEs for two years, implying a one-time cost of $10-25M.310
Likewise, the one-time cost associated with employee compensation would depend on the
conversion approach. If DeCA were to convert to NAF through attrition and voluntary
conversion, we do not expect that there would be any incremental cost since there would not
307 Such appropriations could come from the federal judgment fund 308 Total premiums for AAFES in FY14 was less than $1M 309 Calculated based on current level of AAFES cash reserve, which covers property liability, public liability, and worker's compensation. We assume that that liability expenses are proportional to number of employees to extrapolate to DeCA 310 Assuming average fully-loaded cost of $80,000 per year
158
be significant impacts to current employees.311 On the other hand, a forced conversion would
likely require significant level of compensation for the employees whose wages and benefits
would be reduced. Assuming that DeCA offers compensation of 26 weeks pay per employee312
and that every DeCA employee would be forced to convert, the cost could be approximately
$275M.313
Finally, we note that these costs are incremental to the one-time costs for consolidation
discussed in Section 8.2.3. DeCA would be able to significantly reduce the cost of NAF
conversion by taking advantage of the exchanges' existing back-office capabilities. However, if
DeCA were to develop in-house NAF capabilities, there would additional one-time costs.
Overall, our analysis suggests that NAF conversion would require $40-65M in one-time
investment if employees are converted through attrition and $325-365M if forced conversion is
applied. In the first scenario, the estimated annual savings run-rate of $125-225M is significantly
higher than the estimated one-time costs, suggesting a compelling business case for NAF
conversion. However, if DeCA relies on forced conversion, the one-time cost significantly would
exceed the annual savings run-rate, and therefore implementation would require careful
consideration of the business case.
Figure 7.8: Summary of NAF conversion next steps
Align on NAF conversion execution approach with policymakers
Submit NAF conversion plan for legislative approval
Develop detailed transition plans for back-office functions
Train HR resources to prepare for employee conversion
Conduct a town hall meeting to communicate with current employees
Start processing voluntary conversions and hiring new employees as NAF
Track attrition progress and address any employee issues that arise
Achieve conversion of full workforce to NAF status
311 To the extent that DeCA offers early retirement incentives, there would be some additional costs 312 Severance pay for employees who are involuntarily separated from the Federal service and who meet conditions of eligibility is up to 52 weeks of pay. Here, we assume that the average compensation in a forced conversion scenario would be worth half of the maximum compensation for involuntary separation 313 $550M is the approximate cost of wages for all U.S. employees at DeCA for FY14; 26-weeks pay for every employee is equivalent to half of the total wages
159
Section 8: Consolidation (Study Objective 5)
8.1. Background
8.1.1. Overview of the exchanges
In addition to DeCA commissaries, many military installations have retail stores operated by
one of three service-aligned organizations within DoD. AAFES (headquartered in Dallas, TX)
operates exchanges on Army and Air Force installations, NEXCOM (headquartered in Virginia
Beach, VA) operates exchanges on Navy installations, and MCX (headquartered in Quantico,
VA)314 operates exchanges on Marine Corps installations (see Figure 8.1).
There are many similarities among the three exchanges. Each exchange operates a diverse
global retail footprint ranging from main stores (which resemble department stores) to much
smaller marts (which resemble convenience stores) and quick-serve restaurants among other
store formats. The exchanges often sell similar products and face a similar set of competitors,
including traditional department stores (e.g., Macy's), supercenters (e.g., Walmart), specialty
stores (e.g., Dick's Sporting Goods), and online retailers (e.g., Amazon). The exchanges focus on
delivering patron benefit through the service and convenience they provide, discounts on
products they sell, and the dividend they produce which supports morale, welfare, and
recreation (MWR) activities.
314 MCX does not have a separate HQ like DeCA, AAFES, and NEXCOM. The Marine Corps NAF Business and Support Services Division oversees MCX
160
Figure 8.1: Summary of FY13 exchange operations315
While the exchanges have many similarities, they also have important nuances that
differentiate them:
Each exchange has some unique store formats, such as NEXCOM's ship stores, and
MCX's Marine Corps Tactical Field Exchanges and Warfighter Express Service (WES)
Each exchange has a customized offering, with differences in store layout, categories of
focus, and to some extent the brands carried
Each exchange has developed a brand image it believes is aligned to its patron base
315 SG&A expenses refer to sales, general, and administrative expenses. Percentages in parentheses indicate SG&A expense relative to total revenue (rather than exchange sales). Sources: RFQ, Annual reports, and data provided by the exchanges
Revenue $8.3B $2.7B $1.0B
Number of
stores and
formats
(Scope of
operations)
2,440 facilities
worldwide
• 127 main stores• 167 military clothing• 492 convenience• 169 specialty• 67 theaters• 1,418 QSR
1,048 facilities
worldwide
• 68 main stores• 106 military clothing• 393 convenience
and specialty• 481 QSR
500+ facilities
worldwide
• 17 main stores• 11 military clothing• 14 theaters• 343 convenience
and specialty• 115 QSR
Unique
capabilities
Exchange credit
program, eCommerce,
private fleet
Ship stores, Navy
Lodge, eCommerce
Integrated back-office
with MWR activities
Logistics
footprint
3 DCs in CONUS
6 DCs OCONUS
3 DCs in CONUS
4 DCs OCONUS
Limited distribution
capability
SG&A
expenses
$2.1B
(25% of revenue)
$0.7B
(24% of revenue)
$0.2B
(21% of revenue)
MWR
dividends
$209M $52M $43M
161
AAFES serves both Army and Air Force installations, while MCX and NEXCOM are
aligned with a single service branch
MCX is integrated into the MCCS (Marine Corps Community Services) organization,
which has a unified back-office that also serves MWR activities, such as family services
and child / youth programs
NEX is integrated into NEXCOM, which is responsible for the back-office functions of
five additional business lines, including Navy Lodge and Uniform Programs
In addition, there are several key differences between the exchanges and traditional private
sector retailers. Like DeCA, the exchanges have a restricted military-affiliated patron base.
Because of the need to operate on virtually all military bases, the exchanges have a more
fragmented footprint of stores than most private sector retailers. The exchanges are also
required to use TRANSCOM to supply international locations, which has some implications
such as the requirement of using U.S. flag carriers. These differences between the exchanges
and the private sector create some restrictions to the exchange business models.
8.1.2. Introduction to consolidation
We view consolidation as a question on whether the broader military resale system can more
efficiently and effectively serve patrons by combining either the military exchanges or the
military exchanges with DeCA in some form. Regardless of how government decision-makers
decide to proceed with consolidation, we believe DeCA can and should pursue its own
improvement initiatives. In the private sector, the competitive landscape of the retail sector is
evolving rapidly.316 Mergers and acquisitions (M&A) are an important strategic lever for
retailers to remain competitive in this dynamic environment. Successful mergers have the
potential to enhance profitability by enabling the combined company to realize cost-reducing
synergies in areas such as cost of goods sold (COGS), overhead, and supply chain. The
additional scale can also improve revenue performance through enhanced marketing and
merchandising capabilities.
However, not all mergers deliver their expected benefits. Underperformance can occur both
because of inadequate due diligence in the deal-making phase and because of poor
316 See for instance "Staying Ahead of the Customer: Retail Transformation and Reinvention" in BCG Perspectives, September 2013
162
management of the integration process.317 Consolidation involves risks and requires careful
consideration, planning, and ongoing management to achieve success. If managed well,
consolidation can create significant value. To get a sense of what the potential value of
consolidation could be, one approach is to look at what previous retail mergers have delivered.
In a 2013 study looking at the announced synergies of all retail mergers globally, we found that
the average annual savings as a percentage of the combined entities' sales was 1.3%.318, 319 To
refine this to a set of mergers that are more applicable to this situation, we also looked at
recent U.S. transactions involving retailers with similar business models (see Figure 8.2). The
average announced savings of these mergers was 2.4% of the combined entities sales. This type
of analysis is a helpful comparison, but announced synergies are almost always lower than
realized synergies, so a thorough bottom-up analysis of potential synergies is important to
estimating the true potential value of consolidation (see Section 8.2.2).
Figure 8.2: Announced synergies of recent retail mergers320
317 BCG Perspectives, "PMI for Consumer Goods: Finding the Opportunities" October 2012 318 BCG Perspectives, "How Successful M&A Deals Split the Synergies" March 2013
320 Source: press search, Capital IQ database. Based on all retail M&A transactions greater than $1B in value from 2004-2015 with announced synergies, excluding grocery stores and pharmacies. Note: most mergers only announce cost synergies and do not include revenue synergies, which would increase these estimates.
Consolidation benchmarking v7.pptx 0Draft—for discussion only
Comparable retail mergers announced synergies ranging
from 0.9 – 4.3% of combined sales
Projected synergies for exchange consolidation is within
sample range
Bottoms up estimate for exchangesSample average
Note: Based on all department store M&A transactions greater than $1B in value from 2004-2015 with announced synergies
Achieved in 1 yr vs. 3 yr projection
163
In assessing the potential for consolidation in the military resale system, we leveraged our
extensive experience with retail integration and government transformations.321 We also
worked closely with key stakeholders at DeCA and the exchanges to apply the most realistic
assumptions available to internal data. We evaluated a range of consolidation options and
estimated the potential benefits and one-time costs of each.322 In addition, we developed a
recommended path forward for the consolidation of the military resale system, including a
high-level timeline, evaluation of integration requirements, and potential governance structure.
We have organized our analyses around four key questions:
What are the consolidation options?
What are the potential synergies and costs of each consolidation option?
What are the broader implications for the military resale system and patrons?
What is the best way to approach governance and integration?
8.1.3. Consolidation options and retail merger background
There is a spectrum of options for consolidation that the military resale system could undergo.
These options range from enhanced collaboration among the separate entities, to partial
consolidation (e.g., only back-office functions), to full consolidation and integration of the
organizations. Further, consolidation could involve only the exchanges or both DeCA and the
exchanges. Each option has different implications in terms of level of difficulty, costs, and
potential synergies. Ultimately, we believe the right approach is the option that delivers the
greatest benefit while minimizing unnecessary costs and potential impact on patron benefit.
To help evaluate different consolidation options, we looked at several successful examples
from the private sector that are instructive in their differing approaches. In one recent major
retail merger, the acquiring company had a very similar business model as the acquired
company. This similarity implied a high degree of common capabilities, processes, and
requirements across the companies, from merchandising and store operations to back-office
functions and supply chain. Moreover, the store formats were similar enough that store banner
consolidation was an option. As a result, the companies integrated completely to form a single
combined organization. Given significant overlap between the two businesses, the merger
321 BCG has supported 54 retail post-merger integration related projects in the last five years 322 One-time costs are short-term investments required to implement necessary changes (e.g., cost to integrate IT systems)
164
produced a high level of synergies (about 4%) relative to its combined revenue. This example
could be analogous to consolidation of the exchanges.
On the other hand, a different recent retail merger involves two companies with different store
formats. While the two retailers target similar customer segments, they operate different
formats with fundamentally different product offerings. Given the differences in their business
models, store consolidation has little synergy potential and high risk. Therefore, these two
organizations will remain as separate business units with distinct merchandising and store
operations teams. However, this merger will generate value through consolidation of back-
office functions, GNFR323 sourcing, some retail goods sourcing, and supply chain. Given the
greater differences in business models, the consolidation has announced approximately 2% in
expected synergy (as a % of combined revenue). This example could be analogous to
consolidation of DeCA and the exchanges.
Our experience also suggests that successful instances of post-merger integration (PMI) in the
private sector follow common best practices.324 First, a successful integration requires strong
governance and a clear transition of leadership. The consolidating organizations need to report
into a single leader, who is ultimately responsible for its successful execution. Second, there
should be dedicated resources under the leader to plan and manage the execution of
consolidation initiatives. These resources, often called the Integration Management Office
(IMO), support integration from beginning to end in each area of consolidation. Third, a
successful integration requires a focused change management effort that encourages and
supports individuals to do things differently and work together on common business objectives.
Finally, it should follow a phased approach that focuses on the highest value initiatives first.
Leadership should recognize the inherent difficulty of integration and choose a path that
minimizes complexity to the extent possible. Following these best practices, the inherent risks
associated with consolidation can be managed to capture the expected value.
8.1.4. Past studies
Consolidation within the military resale system is a topic that has been studied and debated
over the past 25 years and has received significant attention in recent months with the release
323 Goods and services not for resale 324 BCG has done over 500 post-merger integration projects worldwide across industries in the last five years
165
of the Military Compensation and Retirement Modernization Commission (MCRMC) report.325
As background to our own assessment, we reviewed all of the major studies and position
papers concerning military resale consolidation. We considered these studies for context only
and did not use them directly in drawing our conclusions on consolidation.
Broadly speaking, there are two types of studies that concern military resale consolidation:
those evaluating consolidation of DeCA and the exchanges, and those evaluating consolidation
of exchanges only. Among the research evaluating DeCA and exchange consolidation, there are
both studies that support and studies that do not recommend consolidation. For example, the
MCRMC report recommended that DeCA and the exchanges combine to form a single entity. It
estimated a potential $316M in consolidation savings,326 coming primarily from cost reduction
in support staff, supply chain, and cost of goods sold.327 On the other hand, a 2015 position
paper by AAFES opposed the consolidation, claiming that MCRMC savings estimates were
based on old studies, the majority of estimated savings would be achievable without a merger,
and the one-time costs would be prohibitively high. AAFES instead recommended that DeCA
continue to reduce costs independently, through levers such as private label, pricing, and NAF
conversion, and that the exchanges seek opportunities for deeper collaboration.328
The exchange-only consolidation studies are generally dated and more uniformly in favor of
consolidation. The three most recent studies, conducted from 1996 to 2005 by third parties in
the private sector, all recommended a full consolidation of the exchanges. These studies
estimated annual run-rate savings of approximately $150-200M, with roughly $200-300M in
one-time costs.329
325 Report of the Military Compensation and Retirement Modernization Commission, January 2015 326 Savings in base case scenario, excluding savings not directly related to consolidation (e.g., Military Star, SDT, NAF conversion) 327 In the MCRMC report, supply chain and COGS savings were combined as logistics; the UETF study based on which MCRMC calculated logistics savings include both supply chain and COGS levers. MCRMC estimated the merger could result in $515M in total annual savings, with $316M coming from consolidation. They also estimated $467M in one-time costs in the first five years 328 Other studies include 2014 AAFES paper to USD(P&R) responding to commissary legislative proposal, 1997 CBO study, 1995 GAO study ($331M in annual savings) 329 Exchange-only consolidation reports include 2005 UETF study by Booz Allen Hamilton ($151-$162M in annual savings, with $213-$216M in one-time cost); 1999 Pwc Due Diligence Study ($206M in annual savings, with $320M in one-time costs in first three years); 1997 CBO study ($176M in annual savings); 1996 SRA International study ($37M in annual savings)
166
8.2. Opportunity
8.2.1. Proposed consolidation option and high-level approach
The opportunity (e.g., synergies) from consolidation is greater the more similar the business
models of the merging entities. Using this filter, we can evaluate the potential opportunity from
consolidating the military exchanges with each other and with DeCA. As discussed in Section
8.1.1, there are many important differences among the exchanges. However, at a high level, the
exchanges are very similar businesses. They operate in the same retail formats with similar
value propositions. While the exchanges each focus on their respective branch(es), they
ultimately have a similar patron bases: military servicemembers, retirees, and their families.
Moreover, although each exchange has slight differences in category focus and primary
suppliers, their main stores offer similar assortments in a similar department store format.
Given these similarities, we believe that consolidation of the exchanges could generate
significant synergy with limited risk to the core business.330
On the other hand, DeCA and the exchanges operate in two different retail sectors (i.e., grocery
versus convenience and department stores) and have very different business models. While
they overlap in footprint (all operate on military bases), the difference in store formats implies
that store consolidation would have limited value. Further, DeCA and the exchanges have
limited category overlap and different supply chain requirements (e.g., perishables versus
apparel). Therefore, integration of store operations, merchandising, or supply chains between
DeCA and the exchanges would also have limited value.
Nevertheless, many of the back-office functions (such as finance, IT, procurement, and HR) at
DeCA and the exchanges perform similar functions and could be integrated more easily. This
smaller scale integration could likely generate cost savings incremental to the consolidation of
the exchanges. In addition, consolidation with the exchange back-office functions would help
facilitate DeCA's conversion to NAF. Instead of developing new capabilities, processes, and
systems to support NAF (versus APF) requirements (see Section 7), DeCA could leverage the
capabilities already present at the military exchanges. In this manner, consolidation could
accelerate DeCA's conversion to NAF and lower the complexity to execute. Though
330 Our proposed consolidation path involves separating MCX from MCCS and integrating with NEXCOM and AAFES; however, the other MWR activities under MCCS should remain under Marine Corps
167
consolidating back-office functions would require some investment and careful sequencing with
other efforts, we believe the logic for back-office consolidation is strong.331
Although some benefits are likely attainable through enhanced collaboration without
consolidation of the organizations, we believe that consolidation maximizes the potential
synergies and increases the certainty of attaining them. Capturing synergies, whether through
enhanced collaboration or integration, requires leadership to be very aligned, committed to the
synergy goals, and willing to make difficult decisions. Achieving any savings beyond what the
exchanges and DeCA have already captured independently would be very difficult without
some degree of consolidation. In addition, the back-office savings can only be achieved by
merging the respective functions, which would require consolidation to capture.
Consolidation would not only generate significant savings for the military resale system, but
would also create a stronger organization that could better serve its patrons and remain
competitive in the dynamic retail environment. For example, the consolidated military resale
system could take advantage of its greater size and scale to work on initiatives that require
larger investments. One such initiative would be developing a robust eCommerce platform.
Currently, AAFES and NEXCOM both have their own eCommerce capability, despite the fact
that they sell similar products to military servicemembers. Once consolidated, the exchanges
could better take advantage of resources and capabilities across the three organizations to
deliver a better offering to patrons.332
8.2.2. Potential synergies
8.2.2.1. Overview
To assess the potential synergies333 from consolidating the military resale system, we conducted
a bottom-up estimate of five dimensions that represent the largest savings opportunities:
Retail goods sourcing
GNFR sourcing (operating expense)
331 We believe that the military resale system should pursue consolidation in a phased manner so that complexity would be minimized and learning from one phase could be leveraged in the following phases; we outline the approach in Section 8.3 332 AAFES is working towards expanding online shopping privileges to all honorably discharged veterans though the Veterans Online Shopping Benefit 333 The financial benefit achieved through the combining of companies
168
GNFR sourcing (Capex)
HQ resources (including both back-office and merchandising)
Supply chain
For each dimension, we evaluated synergies under exchange-only consolidation and DeCA /
exchange consolidation scenarios (see Figure 8.3 for details) by calculating addressable spend
and applying an estimated savings rate based on our previous retail merger experiences. Our
analysis suggests the annual run-rate savings for the consolidation option described in Section
8.2.1 would be $215-325M.334 As we developed these synergy estimates, we also accounted for
the unique factors involved in consolidations within a government context to the extent
possible.
Figure 8.3: Summary of consolidation synergies
334 The exchange portion of the synergies represents 1.6-2.4% of total combined sales, which is higher than the 1.3% figure stated in the 2013 BCG study "How Successful M&A Deals Split the Synergies. Divide and Conquer." However, as mentioned above, the more relevant comparison would include retail companies with similar business models, which have announced on average 2.4% synergy. The figure cited in the study is an average of all retail M&As which do not account for different degrees of overlap among combining companies. Given the highly similar business models of the exchanges, we expect that an exchange consolidation would produce higher-than-average synergies
Key categoriesAddressable
spend ($M)
Savings
potential ($M)
Addressable
spend ($M)
Savings
potential ($M)
Savings
potential ($M)
Retail goods
sourcing
(COGS)
5,087 50 - 80 6,561 70 - 100 50 – 80
GNFR sourcing
(operating
expense)
408 20 - 40 531 25 - 50 25 – 50
GNFR sourcing
(capital
expenditure)
79 10 - 20 138 15 - 30 15 – 30
HQ resources 247 70 - 90 321 100 - 130 100 – 130
Supply Chain 237 25 - 35 303 30 - 45 25 – 35
Total 215 – 325
Exchanges Exchanges + DeCA Recommended
option
169
We have undergone a function-by-function review of the exchanges to understand the value of
exchange consolidation. The proposed consolidation is significantly more likely to succeed than
private sector M&A deals given strong overlap in the cost categories among the three
exchanges, and the fact that there is no takeover premium as part of the cost of consolidation.
Our projected payback period is approximately two years, creating a valuable first step in the
subsequent back-office merger with DeCA (see Section 8.2.4).
8.2.2.2. Retail goods sourcing (COGS)
Our analysis and experience suggests that retail goods sourcing could be a significant source of
synergy in consolidation, particularly among the exchanges. The exchanges offer a similar
selection of products across a similar set of categories, so the opportunity could be large. Given
the limited category overlap between DeCA and the exchanges (grocery vs. department store),
the opportunity would likely be smaller and more difficult to achieve. Therefore, we would
recommend consolidating the merchandising organizations of the exchanges but not
consolidating with the DeCA's merchandising team.335 In this scenario, savings from
consolidating exchange retail goods sourcing could be $50-80M. In addition to the potential
COGS synergy, the organizations could become more effective by combining the expertise and
experience within each exchange's merchandising teams. Combining DeCA with the exchanges
could generate an additional $20M in savings, but the savings would be more difficult to
achieve given the different merchandising needs of grocery and department stores.336
To determine potential synergy for retail goods sourcing, we identified non-addressable
categories within each organization and removed COGS in these categories from the
addressable baseline. Non-addressable categories include those where we rarely see savings in
other contexts (i.e., services, gift cards, gasoline, tobacco, and other small categories) as well as
areas of limited overlap among the consolidating parties. For the exchanges, we considered
branch-specific items, such as uniforms, to be non-addressable. For DeCA, we also excluded
335 Consolidation of merchandising functions do not necessarily imply homogenization of branding or store assortments 336 The potential $20M synergy from including DeCA COGS is not currently included in the overall total. This $20M figure has the potential to grow if DeCA is permitted to carry additional merchandise categories that overlap with the exchanges (e.g., beer and wine, non-food)
170
categories and subcategories not present in any of the exchanges (e.g., produce, meat, dairy,
bakery, and some subcategories of grocery and frozen food).337
Once we determined addressable spend, we applied a 1–1.5% savings range based on our
experience in prior retail mergers.338 These savings are incremental to COGS savings that DeCA
or the military exchanges would be able to realize independently. To achieve these savings,
DeCA and the exchanges could utilize traditional levers for reducing COGS, aided by the
unique consolidation context. For example, they could target the lowest cost for each common
item across the military resale system. If one exchange sources an item for $1.50 per unit and
another exchange sources it for $1.55 per unit, the consolidated organization could realize
savings by sourcing the entire volume at $1.50.339 Furthermore, they could aggregate volume for
the same vendor and negotiate based on scale. The combined organization would likely be able
to strengthen the relationship with that supplier and reduce costs. Finally, they could improve
their assortment through strategic negotiations. The combined organization could eliminate the
lowest volume items, focus the assortment, and benefit from higher volumes on the remaining
items. Figure 8.4 summarizes our approach to estimating the COGS synergy opportunity.
337 We used conservative assumptions to estimate category overlap between DeCA and the exchanges. Although the exchanges have many food categories, they tend to have smaller assortments with different focus and very often carry different pack sizes 338 BCG has worked on 54 retail post-merger integration projects in the last five years 339 In order to verify the potential gap in prices, the exchanges would need to track gross margin at the SKU level (store-keeping unit level) and track each SKU by UPC code
171
Figure 8.4: Summary of key drivers of COGS synergies340
Our experience supporting retail mergers suggests that the differences in category strategies
among the exchanges would not significantly diminish the savings potential. For instance,
although NEXCOM and MCX focus on higher-end items while AAFES dedicates greater shelf
space to value items, much of their assortments overlap. Our analysis suggests that about 90%
of the categories overlap across the exchanges, with limited sales coming from uniforms and
other service-specific items. In areas of overlap, the merchandising teams could potentially
harmonize items and suppliers to realize savings from increased volume. In areas where
assortment differences are more substantial and important to the mission of each exchange,
the exchanges could maintain appropriate customization to serve their patrons' needs.
8.2.2.3. Indirect goods sourcing (Opex and Capex)
Both DeCA and the exchanges have relatively similar organizational needs for indirect goods.
Given the similarity of the functions and the savings potential from combined negotiations, we
believe DeCA and the exchanges should consolidate their indirect procurement capabilities.341
They could generate the greatest savings by creating scale and leveraging the entire volume
340 MCX addressable spend percent calculated as average of NEXCOM and AAFES. Note: figure may have some impact of rounding 341 However, DeCA would need to become a NAFI in order to realize full synergies – therefore, this recommendation is contingent on DeCA's NAF conversion
($M) AAFES NEXCOM MCX DeCA
Total COGS
(excluding services)3,899 1,448 514 5,662
Addressable COGS
(excluding branch-specific and non-overlapping
categories)
3,361(86%)
1,278(88%)
448(87%)
1,473(26%)
Estimated synergies
(1-1.5% of addressable spend)
50 – 80(Exchanges collectively) 20
Exchanges
172
across the military resale system. We estimate a roughly $25-50M opportunity in annual
operating expense and about $15-30M opportunity in annual Capex for indirect goods.
To calculate GNFR synergies we aggregated the total spend for categories in which
consolidation could generate savings. This approach was used for both Opex and Capex
could exist in marketing, IT / telecom, equipment, supplies, travel, professional services, and
credit card expense.342 We excluded utilities, contract labor, and 'other' categories because they
are not easily addressable (see Section 10.6).
We evaluated a specific savings target in each GNFR category, leveraging our extensive
experience helping retailers and other consumer companies optimize their indirect
procurement. Given the government context which may limit the level of flexibility that the
consolidated organization would have in contracting, we used conservative estimates compared
to our private sector experience. Figure 8.5 summarizes our estimate for the GNFR operating
expense opportunity, and Figure 8.6 summarizes the GNFR capital expense opportunity. The
savings targets in these figures reflect the relative difficulty of obtaining savings based on our
extensive experience in supporting our clients' indirect procurement teams.343 To estimate the
value of GNFR savings incremental to what DeCA would capture in an independent GNFR
effort (discussed in Section 10.6), we assumed that consolidation would add an additional 30-
50% to the savings from an independent DeCA effort, which is consistent with our experience
of GNFR savings in post-consolidation settings in the private sector.
342 While the exchanges have realized some savings through Military Star Card, they could realize some potential savings on transaction costs associated with third-party processors 343 Savings estimates based on BCG experience from 77 GNFR projects in the last five years
344 Total savings opportunity calculated by applying savings targets for each category to category spend. MCX spend have been extrapolated based on AAFES and NEXCOM data due to limited data availability. Note: figure may have some impact of rounding 345 Note: figure may have some impact of rounding
2015-06-30 Updated GNFR figures.pptx 3Draft—for discussion only
Total savings opportunity 20-40(5-10% of addressable)
2-8(2-6% of addressable)
Exchanges DeCA (incremental)Not addressable
CategoryAAFES
spend ($M)
NEXCOM
spend ($M)
MCX
spend ($M)
Savings
Target (%)
Spend
($M)
Savings
target (%)
Facilities 156 53 13 - 197 -
Store Equipment 8 3 2 5-10% 25 2-5%
Information Technology 47 16 3 20-30% 35 6-15%
Total spend 211 72 18 257
Total savingsopportunity 15-20 (5-7%) 2-6 (1-3%)
Exchanges DeCA (incremental)
174
8.2.2.4. HQ resources
As retailers, DeCA and the exchanges have similar back-office needs, including finance, HR, IT,
and others. While they currently have functions with disparate procedures and systems, our
experience indicates that a single shared-service business unit could effectively service the back-
office needs of the entire military resale system.346 Additionally, as mentioned above, given the
overlap in categories and merchandising activities among the exchanges, there is also the
opportunity to consolidate those teams. Given the typical level of scale advantage observed in
these functions, consolidation could present significant synergies in the range of $100-130M
annually.347 There would be a significant IT integration effort required to integrate these
functions.
To calculate the addressable spend for HQ resources, we obtained employee-level human
resources data from both DeCA and the exchanges and isolated the headquarters employees.348
Then, we constructed a view of total FTEs and total payroll expenses for each headquarters
department.
For each department, we calculated a target department-level FTE reduction (as a percent of
total FTEs in each function) leveraging our experience in supporting retail mergers.349 We first
calculated the opportunity for exchanges assuming that roughly 30-40% reduction would be
possible across functions based on our experience.350 While this is a significant amount of
savings, our experience in similar situations indicates that many of the functions would be able
to accommodate a larger organization with a similar number of FTEs. We did not assume any
reductions for MCX because we expected that MCX would need to add capabilities that MCCS
employees manage today when separating from MCCS. We applied slightly higher back-office
346 However, DeCA would need to become a NAFI in order to realize full synergies – therefore, this recommendation is contingent on DeCA's NAF conversion 347 BCG has worked on 172 shared services projects in the last five years 348 In order to focus on HQ resources, we excluded in-store employees and above-store employees in non-HQ locations, such as installations, regional administrative offices, and distribution centers 349 BCG is unable to share any specific examples because of client confidentiality. We have ranged the data based on this experience and have applied the aggregate range by category, adjusting where necessary for the specific context of DeCA and the exchanges 350 In the private sector, we have seen instances where in some departments the consolidated organization would have lower combined FTEs than either of the combining organizations alone. However, we used the assumption that combined FTEs in each function would generally be no smaller than the current size of AAFES functions since AAFES is the largest of the entities
175
reduction targets for DeCA because the combined exchanges would have greater capacity to
serve DeCA's needs after integration. We assumed that DeCA's merchandising, logistics, and
store operations would have little or no savings potential given these are the areas where
DeCA's business model is different and requires different capabilities. Figure 8.7 summarizes
our findings and assumptions around HQ resource reduction at the exchanges and DeCA.
Supply chain is an area that can be a source of significant synergies in some mergers. We
believe that the exchanges could consolidate their supply chain capabilities to take advantage
of the overlap in their distribution center footprint and combined scale. On the other hand, the
351 MCX excluded because no synergies estimated from disentangling teams from MCCS. Figure may have some impact of rounding
CategoryAAFES
spend ($M)
NEXCOM
spend ($M)
Savings
Target (%)Spend ($M)
Savings
target (%)
General Management 3 1 20-30% 1 50-60%
Finance 25 11 25-35% 11 55-65%
HR 25 19 30-40% 10 60-70%
IT 5 6 25-35% 5 50-60%
Internal Audit 3 2 25-35% 3 55-65%
Logistics 7 2 20-30% 5 5-15%
Real Estate 6 5 35-45% 3 60-70%
Merchandising 57 19 30-40% 13 0%
Marketing 5 1 25-35% 0 -
Operations 6 6 20-30% 4 5-15%
Other 24 9 25-35% 21 55-65%
Total 166 81 76
Total savings opportunity 70-90 (27-37%) 30-40 (41-49%)
Exchanges DeCA
176
significant differences in supply chain requirements between DeCA and the exchanges imply
that consolidating DeCA's supply chain may not be practical. We estimate that combining the
exchange supply chains could have $25-35M of annual savings potential.
To establish a financial baseline in supply chain, we obtained data around distribution center
costs, including both labor and non-labor operating costs, in-bound freight costs, and out-bound
freight costs from each organization. These supply chain costs totaled roughly $240M for the
exchanges and $70M for DeCA. Figure 8.8 summarizes the breakdown of supply chain costs at
each organization.
Figure 8.8: FY14 supply chain cost by organization352
In our experience supporting retail mergers, savings are typically 10-15% of the addressable
supply chain spend. Consolidation would open up three levers to reduce supply chain costs.
First, the exchanges could potentially consolidate distribution centers (DCs). There are at least
three potential opportunities for DC consolidation within CONUS and one opportunity in
Pacific OCONUS (see Figures 8.9 and 8.10). Consolidation of DCs could significantly reduce the
fixed costs of the combined footprint.353 Second, consolidation could provide opportunities for
efficiency improvements. For example, by sharing inventory across a combined distribution
system, the consolidated organization could potentially reduce overall inventory levels.
Inventory reduction would free up additional working capital and consequently generate
352 Due to its lack of in-house distribution capabilities, we excluded MCX from our evaluation of supply chain opportunity 353 Our experience working in distribution network optimization (144 projects in the last five years) suggests that fixed costs could be as much as 30% of the total DC operating costs
($M) AAFES NEXCOM DeCA
DC payroll costs 86 35 40
Other DC costs 10 4 9
Outbound transportation 31 11 17
Inbound transportation 52 16 N/A
Total addressable spend 178 66 66
Exchanges
177
savings. In addition, the exchanges could increase the utilization rate of outbound freight by
taking advantage of the greater store density that consolidation could provide. This lever
involves shipping to multiple installations that would otherwise be serviced separately.354
Finally, consolidation provides additional scale that could help improve inbound and outbound
freight costs, especially if DCs are consolidated. Consolidation could increase volume and
reduce the number of shipping destinations,355 which would help the consolidated organization
negotiate better freight rates.
Of course, the extent to which the military resale system could capture supply chain synergies
would depend on its ability to effectively harmonize existing capabilities. For example, the
exchanges would each need to provide visibility over supply chain data such as inventory data,
fleet utilization data, shipping volume, freight rates, etc. Our experience suggests that
integrating supply chain IT systems would require a significant effort that could span multiple
years. Moreover, a successful consolidation would need to effectively integrate some of the
unique features of the exchanges. As an example, AAFES has a dedicated fleet, while NEXCOM
and MCX rely on outside vendors for transportation. In addition, MCX does not have in-house
distribution capabilities and has instead outsourced them. While some of these differences
suggest there are significant supply chain opportunities, they also imply that a potential
integration would be a highly complex and time-consuming process.
However, the current level of collaboration between the exchanges on supply chain suggests
that consolidation could enable them to successfully capture the additional opportunities. For
example, NEXCOM currently provides warehoused merchandise support for MCX for some
SKUs, and its DCs supply to more than 120 MCX locations.356 NEXCOM and MCX also
collaborate on second destination transportation, sharing containers for shipping to the Pacific
region. In addition, DeCA and the exchanges have developed other opportunities for supply
chain collaboration through the Collaborative Efforts Board. For instance, AAFES and
NEXCOM conduct joint bidding for full truckload, the organizations share OCONUS
distribution responsibilities for certain goods, and AAFES provides transportation services for
NEXCOM in some CONUS regions. These examples demonstrate the capacity for DeCA and the
354 While the installations are less densely located than most private sector retailers, the exchanges could benefit from combined shipment in locations with a dense concentration of military installations 355 If DCs consolidate, vendors and distributors would need to ship to fewer locations 356 2013 Collaborative Efforts Annual Report
178
exchanges to find synergies in their supply chain. These examples are ultimately small initial
steps in what we believe could be a much more significant opportunity, especially once IT
integration takes place.
Figure 8.9: Distribution center consolidation opportunity (CONUS)
Figure 8.10: Distribution center consolidation opportunity (Pacific)
Floor Space (Sq ft)
0.8 – 6363 – 124
124 – 258
258 – 445
445 – 869
869 – 1,437
AAFES
DeCA
NEXCOM
Potential consolidation opportunities
East DC
AAFES: Dan DanielsNEXCOM: Norfolk
West DC
AAFES: LathropNEXCOM: Chino
South DC
AAFES: DallasNEXCOM: Pensacola
Stores FloorSpace (Sq ft)
0.8 – 6363 – 124
124 – 258
258 – 445
445 – 869
869 – 1,437
AAFES
DeCA
NEXCOM
Potential consolidation opportunities
Japan DC
AAFES: TokyoNEXCOM: Tokyo
Note: DeCA DC will not be consolidated
179
8.2.2.6. Revenue upside
In addition to tangible cost savings, we believe that a successful consolidation presents
opportunities for revenue upside. For instance, we believe that eCommerce is an underutilized
channel for the exchanges which can grow through additional investments. AAFES and
NEXCOM currently operate separate eCommerce operations,357 and are therefore not taking
advantage of potential scale benefits. Moreover, consolidation may provide for enhanced
customer experience through improvements in merchandising, marketing, joint loyalty
programs, and store operations.
Consolidation also gives DeCA and the exchanges an opportunity to share their best practices
and leverage the top talent from each organization. The front-office functions of a combined
organization could be more capable and competitive going forward. Therefore, these changes
have the potential to not only improve the top-line performance of the combined organization,
but also provide additional patron benefit through an enhanced customer experience. We have
not included any revenue upside in our synergy calculations, but believe it is a relevant factor
for consideration in evaluating the consolidation opportunity.
8.2.3. Potential costs
8.2.3.1. Overview
Consolidation would require some one-time costs, which we organized and phased along five
dimensions: personnel, system integration, supply chain integration, inventory write-off, and
post-merger integration (PMI) support. In total, we estimate that the integration would cost
$155-255M, with the majority of cost incurred in the first two years. See Figure 8.11 for a
summary of the costs.
357 Note that MCX uses AAFES platform but has a separate portal website
180
Figure 8.11: Estimated one-time costs of consolidation358
We estimate that the savings from consolidation would fully offset one-time costs in each year.
Nevertheless, temporary funding may still be required to make early investments (e.g., one-
time costs in Q1 which may not be offset by savings until Q4). Policymakers would need to
consider how DeCA and the exchanges could secure temporary funding to finance the one-time
cost of consolidation, but each year's synergies are projected to cover the associated costs
within the fiscal year.
8.2.3.2. Personnel costs
Our experience suggests that some personnel costs would be necessary to execute a successful
integration. In evaluating these costs, we conducted internal interviews with DeCA and the
exchanges to understand their past experience with reorganization initiatives and leveraged
our experience supporting mergers in the private sector. We applied the most realistic
358 Values are midpoints of savings ranges, e.g., $205M is midpoint of total range ($155-$255M). May have some impact of rounding
Library of Figures-07July15-RB-v07.pptx 15Draft—for discussion only
In developing these personnel cost estimates, we applied the output of the transition model
described above and leveraged both HR data that we collected from DeCA and the exchanges
as well as BCG experience. For instance, we assumed that 13% of exchange HQ employees and
11% of DeCA HQ employees would accept early retirement incentives based on the percent
eligible at DeCA today and the take rates from prior reorganization efforts. Moreover, we
assumed that those who opt to receive early retirement buy-out would receive a $25,000
payment. This value corresponds to the maximum compensation available for those who
participate in voluntary separation programs361 as well as private sector severance benchmarks
at roughly 30% of average wages (often observed in private sector mergers). We applied a
similar approach to the other calculation and assumptions to best estimate the potential impact
of proposed changes.
360 While DeCA's ability to offer retention bonuses is restricted relative to the private sector, DeCA is able to offer continuation bonuses to retain employees who would otherwise leave DeCA 361 DODI 1400.25 "DoD Civilian Personnel Management System: Voluntary Separation Programs"
183
8.2.3.3. System integration
Consolidation of the military resale system would involve IT integration across many systems,
which could include supply chain, point-of-sales, merchandising, finance, HR, and
procurement. We estimate that system integration would cost $70-110M on a one-time basis. In
evaluating this cost, we leveraged internal technology experts who have worked on other retail
mergers. In typical mergers, we tend to see integration costs around 100% of the total annual IT
synergy. However, we used an estimate of 200-300% of the estimated IT synergy in order to be
conservative and account for the inherent complexities involved in the military resale system.362
We further triangulated and corroborated our estimate by comparing our cost estimate relative
to total revenue. $70-110M represents roughly 0.5% of total combined revenue of the military
resale system, which is in line with the total systems costs relative to revenue in the other retail
mergers that we have supported.
To inform our cost estimate as well as evaluate the implementation challenges in IT, we
investigated the IT systems at DeCA and the exchanges. Interviews with DeCA and the
exchanges suggest that they have disparate IT systems and approaches with limited overlap.
For example, DeCA and AAFES both rely primarily on home-grown IT systems for their core
finance system, while NEXCOM and MCX use customized versions of commercial off-the-shelf
solutions.363In merchandising and point-of-sale systems, both AAFES and NEXCOM use IT
solutions offered by Oracle, while MCX has additional complexity because it shares an
integrated IT system with the broader MCCS. To successfully integrate their IT systems, DeCA
and the exchanges would need to agree on a common set of business requirements and
processes and migrate to a single system that can service all organizations' needs.
IT integration costs are estimated for each phase of consolidation based on which IT systems
would need to be integrated during each phase and the relative complexity of integrating each
system. In general, integrating supply chain systems as well as merchandising and point-of-sale
systems would be considered most complex. For this reason, the largest IT integration costs are
expected during Implementation Phase II.
362 Such as the existence of four independent organizations within the system 363 DeCA has the DeCA Interactive Business System (DIBS), which interfaces with inventory management, point-of-sales, and bill-paying systems, and AAFES has the Integrated General Ledger Accounting System (IGLAS) that interfaces with most finance processes, such as account reconciliation, payroll processing, and treasury management. NEXCOM uses the Lawson Finance suite while MCX uses the Computron Financial Management system
184
Given the complexity of the IT landscape at each organization, we believe that systems
integration costs have the widest potential variance of the cost buckets we examined. One-time
costs for IT fluctuate significantly based on details of the IT transition requirements. To be
conservative, we sided on the higher end of the one-time cost estimates. Even if system
integration costs unexpectedly rose another 50% to $110-170M (i.e., 300-450% of IT synergies),
the business case for consolidation would remain viable. In the planning for and execution of
the consolidation, IT will need to be a key area of focus for the governance team. We would
recommend a bottoms-up estimate that accounts for each sub-system separately in terms of
man-hours required for integration to refine the potential integration cost.
8.2.3.4. Supply chain integration
Some supply chain savings levers that the military resale system could use, such as distribution
center consolidation and process optimization, would involve some one-time investments.
These investments are necessary for a variety of reasons, ranging from labor involved in
solution development and personnel costs associated with facility closures to upgrades to the
physical infrastructure. The exact level of required one-time cost would depend on the types of
supply chain opportunities pursued. For example, we believe that of the levers described in
Section 8.2.2.5, distribution center consolidation would be most costly because it involves
significant time, planning, and infrastructure investment. On the other hand, freight rate
negotiations are relatively easy to implement with much lower investment.
However, we have observed in our experience that supply chain initiatives in a merger context
require on average 100% of the expected synergies in one-time costs. Based on this assumption,
we estimated $20-40M as a potential cost of supply chain integration.364
8.2.3.5. Inventory write-off
To execute a successful merchandising consolidation that captures the value of the COGS
opportunity, the exchanges would likely need to adjust their assortment by harmonizing some
items and vendors. This process would like incur some inventory write-offs during the
transition. To evaluate the cost of inventory write-off, we leveraged our experience in
364 Given the global nature of the exchange supply chain operations, costs likely at higher end of range
185
conducting COGS reduction efforts in merger contexts. We estimated the cost of inventory
write-off as margin value lost in the event of 50% clearance discounts, assuming that 15-20% of
the assortment would be swapped and that vendor promotions would fund 25% of the
discount.365 Based on these assumptions, we estimate that inventory write-off would cost $25-
40M.
8.2.3.6. Post-merger integration (PMI) support
In most mergers, especially those with a high degree of complexity, companies seek outside
support to help manage the post-merger integration (PMI) process. Given the many moving
parts that would be involved in a potential DeCA / exchange consolidation, we believe it would
be necessary for PMI support to ensure success. Typically, we have seen PMI in the private
sector cost approximately 15% of annual run-rate savings. Therefore based on our annual run-
rate savings estimate of $215-325M, we estimate the one-time cost of PMI support at $30-50M.
8.2.4. Phasing of benefits and costs
In addition to analyzing the annual run-rate savings and total one-time costs in each category,
we also examined how these benefits and costs would be phased. For each category of savings
and costs, we applied our experiences supporting numerous post-merger integrations to the
roadmap proposed in Section 8.3. For example, a typical COGS reduction effort would occur in
two to three waves, each lasting about three months. Savings would hit the bottom line
approximately 6 months after the completion of the analytical process, assuming 3 months to
complete negotiations and finalize new planograms and three months for inventory to clear.
These assumptions imply that if merchandising integration and corresponding retail sourcing
efforts occur in the first quarter of the second year, then savings would begin in the fourth
quarter of the second year. In this manner, we leveraged the best assumptions available to
calculate the potential economic impact of consolidation in each year.
365 Based on recent retail client merger experience
186
Figure 8.14: Summary of benefits and costs by year366
Category ($M) Year 1 Year 2 Year 3 Year 4 Run-rate
Annual run-rate savings 50 120 240 260 270
One-time costs 50 110 35 10 0
Net impact 0 10 205 250 270
8.2.5. Broader implications for stakeholders
8.2.5.1. Implications for patrons
Overall, we believe that the consolidation can proceed in a manner that minimizes costs to
patrons while introducing some additional benefits.
We do recognize that there are some potential risks to patron benefit to consider alongside the
overall business case. For instance, consolidation of the merchandising function at the
exchanges may call for assortment harmonization to achieve maximum synergies.
Consequently, the combined exchange might make some decisions on a slightly less customized
assortment for each service and each type of store. However, this patron impact could be
minimized by maintaining different store formats where relevant and allowing variations in
planograms where important to patrons.367
Also, there may be concerns that a consolidated exchange would not create the same level of
affiliation or loyalty as today's branch-specific organizations. Based on our survey, this
assumption may be true for a segment of patrons. 26% of respondents agreed that the exchange
associated with their branch better fit their needs than exchanges associated with other
branches (see Figure 8.15).
366 Figures are midpoints of ranges. May have some impact of rounding 367 A planogram is a visual representation of how and where specific retail products should be placed on store shelves or displays
187
Figure 8.15: Branch loyalty among exchange shoppers368
However, when presented with the option of shopping at a consolidated military exchange, 85%
of patrons suggested they would not change their behavior and 10% would actually shop more
frequently (see Figure 8.16).
368 Source: May 2015 BCG patron survey, unweighted N = 3,792
Slides on perception by branch.pptx 5Draft—for discussion only
If there were one brand of military exchanges for all military service members, how would this
change the frequency with which you shop at a military exchange versus other retailers?
12
14
54
9
11100
0
20
40
60
80
Overall
Disagree
Strongly disagree
% of respondents
Strongly agree
Agree
Neither agree nor disagree
Please agree or disagree with the following statement: The exchange affiliated with my branch fits my needs better than the military exchanges affiliated with other branches.
188
Figure 8.16: Patron willingness to shop consolidated exchange369
Furthermore, patrons' shopping experience should not be impacted by consolidation since we
do not suggest store banner consolidation and most of the changes would occur at the above-
store level. Therefore, we expect minimal risk to traffic from decreased affiliation.
Additionally, consolidation could impact patrons if it were to limit the ability of the exchanges
to execute any of the numerous programs they have today that support the communities they
serve. These programs include the motorcycle safety program of MCX and the school lunch
programs of AAFES and NEXCOM. In general, the three exchanges today are able to respond
flexibly to the needs of their specific segments of the patron base. Each exchange also has
examples of how it has responded to specific situations to help support military
servicemembers and their families.
There is no reason why consolidation needs to negatively impact these branch-specific
programs and activities. Meeting the needs of military servicemembers and their families
should always be a core part of the culture of military resale. We believe that consolidation
could be executed in a way that preserves this focus and prioritizes agility. In addition, to the
369 Source: May 2015 BCG patron survey, unweighted N = 3,792
Slides on perception by branch.pptx 4Draft—for discussion only
If there were one brand of military exchanges for all military service members, how would this
change the frequency with which you shop at a military exchange versus other retailers?
85
64100
80
60
40
20
0
% of respondents
I would shop there somewhat more frequentlyI would shop there much more frequently
It would not change how frequently I shop there
I would shop there much less frequentlyI would shop there somewhat less frequently
2
Overall
3
If there were one brand of military exchanges for all military service members, how would this
change the frequency with which you shop at a military exchange versus other retailers?
189
extent that the combined organization would have improved capabilities across functions, their
ability to respond to the needs of the military could improve.
8.2.5.2. Implications for employees
Given that the largest source of synergy of the consolidation is the consolidation of HQ
functions and consequent reduction of above-store FTEs, a major impact on employees is likely.
Specifically, we estimate that 30-40% of exchange HQ positions and 40-50% of DeCA HQ
positions could be impacted (See Section 8.2.2.4). To minimize the impact on employees, the
combined organization could transition with judicious use of relocation assignments, early
retirement incentives, and management of attrition. Furthermore, the governance board and
integration management office should reduce uncertainty for employees as much as possible by
communicating consistently about its vision for consolidation efforts and any planned changes
to the organizational structure. By making implications as transparent and fair as possible, the
combined organization could reduce negative impact and improve retention.
8.2.5.3. Implications for broader military
In addition, consolidation could impact the military branches through potential changes to the
exchanges' MWR structure. For instance, consolidation could result in some loss in the
connection that the exchanges currently have with their respective military branches. To
mitigate this risk, we believe it is important to have a store-level management structure that
could continue to maintain a close relationship with each installation commander. Given the
limited number of joint bases, each service can maintain some level of alignment with the
exchanges through their relationships at the installation level. In addition, each service should
be represented in the governance board to ensure they have oversight and input into the
direction for military resale.
Any potential impact on installation operating support services would be minimal. There would
only be impact to the extent the military resale system changes its store footprint, and we do
not believe that rationalizing store footprint would be advisable in the near to medium term.370
Existing stores would continue to rely on support services in the same manner that they do
370 However, the exchanges should review their overall store footprint beyond Implementation Phase II (see Section 8.3.3.4)
190
today. In addition, we do not recommend that DeCA and the exchanges pursue base operating
support costs as a GNFR opportunity since there would be limited potential for savings.
Consolidation of the military resale system would present policy questions surrounding how to
account for resulting synergies. There are at least three options to be considered, including
increasing MWR dividends, reducing the level of APF for military resale, and enhancing patron
benefit through greater savings.371
8.3. Roadmap
8.3.1. Overview
To help manage the complexity and increase the likelihood of capturing the expected synergies,
a phased approach372 with a clear governance structure is critical. The following best practices
informed by our experience in merger governance would help ensure that the consolidation
realizes the value for the military resale system as quickly as possible while managing risks:
1. Start with a comprehensive planning phase to align transition needs across functions
and prepare a detailed plan for each component of consolidation
2. Prioritize areas with the highest ROI and greatest ease of implementation
3. Consolidate the exchanges before integrating with DeCA to minimize complexity and
provide opportunity for DeCA to learn from exchange consolidation experience
4. Avoid consolidating areas where there is little or no value to be captured
Given these guiding principles, we suggest a potential implementation timeline involving at
least three phases (see Figure 8.17):
371 Therefore, consolidation could have impact on patron savings to the extent that the military resale system invests the realized synergies in lower prices 372 We believe that a phased approach is preferable because it would allow the military resale system to follow the best practices outlined above. However, potential risks of phased approach include delay in savings, elongation of the consolidation process, and the need for multiple Planning Phases
191
Figure 8.17: Consolidation timeline
A planning phase, in which the governance structure, the leadership, and integration
execution teams would be selected and established
A first implementation phase, in which the exchanges would consolidate their back-office
functions to form a shared services business unit (SSBU)
A second implementation phase, in which DeCA would begin its process of NAF
conversion and leverage the back-office capabilities of the exchange SSBU. In parallel,
the exchanges could begin the process of consolidating their merchandising, supply
chain, and store operations
Throughout, the governance board and integration management office (IMO) would be
responsible for coordination of each consolidating organization, change management,
and communication with stakeholders
8.3.2. Governance
At the beginning of the Planning Phase of consolidation, DoD should establish a governance
board and select leadership to oversee the consolidation effort from planning to completion.
This governance board would be accountable for the successful execution of the entire
consolidation effort.
Independent levers
NAF conversion
Back-office
integration
Back-office
integration
Merchandising
integration
Governance
Supply chain
integration
NAF conversion begins
DeC
AE
xcha
nges
Pricing, Private Label, COGS
Integration
planningOn-going communication and change management
On-going governance
NAF conversionConversion
preparation
Integration
preparation
GNFR Store operations
SSBU transition
Integration
preparation
Additional transition time
Integration
preparation
Merchandising transition,
COGS efforts
Launch SSBU
Planning Implementation Phase I Implementation Phase II Beyond
Store
hours
SSBU transitionIntegration
preparation
Additional preparation
Additional preparationSupply chain integration,
optimization efforts
192
One suggested approach to creating this governance board would be to include members from
the four existing boards of directors of DeCA and the exchanges in a single entity. This new
board would likely exist outside the services as an independent entity.373 The Principal Staff
Assistant (PSA) responsible for the military resale system could chair the new board. The new
board should have 10-12 seats, with representation of each branch of the military. By including
some existing board members, the new board could leverage their experience in working with
each organization and create continuity from current structure. This new board could then
select a single leader of military resale to oversee both the consolidation effort as well as the
overall future operations of the military resale system. Our experience suggests that it would be
critical for this new leader to have deep retail and management experience, whether in the
government or in the private sector.374 We would also suggest that the military resale leader
have clear reporting lines to senior DoD leadership. The current organizations would then
report into this new leader and essentially function as business units within a broader
organization.
Beyond the Board and the leadership, we would suggest the establishment of an integration
management office (IMO) to help coordinate the consolidating organizations and take
ownership of the planning and execution of each area of consolidation. The IMO would report
directly into the leader of military resale described above. The IMO would consist of a central
team responsible for change management and communication, as well as functional
integration teams in IT, finance, HR, merchandising, and supply chain. These functional
integration teams are dedicated resources to drive each area of consolidation from planning to
completion and would work closely with their functional counterparts at the exchanges and
DeCA.
An important role of the governance board, military resale leader, and the IMO would be to
improve communication and collaboration as soon as possible across the military resale system.
For instance, we would recommend that the governance board ensure that DeCA and the
exchanges do not undertake investments, such as IT projects or building new facilities, which
may be duplicative or not consistent with the interests of the broader military resale system.
373 MCX does not have its own governance board; as a result, the MCCS board of directors would remain if consolidation were to occur 374 BCG has worked on 54 retail post merger integration related projects in the last five years
193
Similarly, the governance team should actively promote sharing of data, documentation, and
knowledge across organizations as they begin the process of consolidation.
That being said, it is entirely possible for DeCA specific initiatives to move forward
independent of consolidation and the governance board. The governance structure and
approach described would be necessary to support consolidation and improve coordination
among the military resale entities. However, DeCA specific initiatives can and should be
pursued in the near-term, even if a governance board has not yet been established.
8.3.3. Implementation phases
8.3.3.1. Planning Phase
The goal of the Planning Phase would be to develop a detailed integration plan and ensure
business continuity in each function. Throughout this planning process, the IMO and the
consolidating organizations would align closely to develop realistic and feasible integration
plans. Initial groundwork to enable better, early coordination between the exchanges would
also be performed.
In this phase, the functional integration teams in the IMO would develop key deliverables such
as end-state operating model, detailed transition plan, and refined financial baseline. The end-
state operating model describes how people, processes, and systems would work at the end of
the consolidation. This serves as a common end-state goal shared by the IMO, DeCA, and the
exchanges. The detailed transition plan would include implementation roadmaps, milestones,
and performance metrics. This plan would serve as a work plan for the implementation phase
and help the IMO monitor implementation performance against schedule.
DeCA and the exchanges would collaborate closely with the IMO throughout the Planning
Phase. Each organization should actively work with IMO functional integration teams to
provide all necessary data for integration planning and financial baselining. We believe that the
IMO, DeCA, and the exchanges should take joint ownership for the final output of this phase so
that they can work closely together in advance of implementation and all share the
commitment toward achieving consolidation goals.
194
The Planning Phase would also be used to perform tasks that would enable better, early
coordination between the exchanges. As an example, during the planning phase, the exchanges
should establish temporary interfaces between their different warehouse IT systems as well as
a SKU translation table which would enable mapping of common SKUs across the three
exchanges. This would allow for the exchanges to share warehouse capacity for common SKUs
prior to full consolidation.
8.3.3.2. Implementation Phase I
Exchanges:
The key action in the first implementation phase is the consolidation of the exchange back-
office operations (including HR, IT, and finance). This process would bring existing back-office
capabilities into a new shared-service business unit (SSBU) which would serve all the
exchanges.
The governance board and the CEO would determine the design of the SSBU, with input and
recommendation from the IMO and the exchanges. To provide a basis for the design of the
SSBU, the IMO would assess each function at the exchanges along dimensions such as the level
of talent, the sophistication of processes, scalability and adaptability of IT systems, the cost of
operation, the ease of hiring additional talent, etc. We believe that the SSBU should leverage
the combined talent, processes, and systems across the three exchanges.
A successful SSBU transition would require three key steps. First, the SSBU would need to serve
all of the exchanges. The exchanges would need to configure their systems so that all necessary
data would flow to the SSBU. Each function would execute this initiative with support from the
corresponding IMO functional integration team. Second, the back-office teams at the exchanges
need to be combined. The end-state organization of the SSBU would likely be about 30-40%
smaller than the back-office functions at the exchanges before consolidation. We believe that in
order to minimize the impact on employees, the exchanges should rely on attrition and
voluntary separation as much as possible. Finally, the SSBU would need to become
independent from the exchanges. The SSBU would report into the leader of military resale
directly rather than into the exchanges. We envision that initially, each function in the SSBU
may have a dotted-line relationship with the leader and a solid line relationship with an
exchange. Once the extension of SSBU services to all exchanges is complete, the SSBU could
195
report directly into the leader. See Figure 8.18 for a representation of the relationship at the
end of this phase.
Figure 8.18 Organizational chart for military resale system by the end of Implementation
Phase I
DeCA:
In the first implementation phase, DeCA would focus on implementing optimization initiatives
including pricing, private label, COGS improvement, and preparing for NAF conversion. In
planning for NAF conversion, DeCA would work closely with the functional integration teams
in the IMO to detail the transition of finance, HR, and contracting capabilities to the SSBU in
the following phase. However, much of DeCA's focus during this phase would need to be on the
significant change necessary as part of its own transformation plan.
Leader of Military Resale
Integration Leader / IMO
Governance board
• Base-lining• Synergy tracking
• Communication• Change management
Shared Service Business Unit
DeCA
AAFES
Fu
nc
tio
na
l
Inte
gra
tio
nT
ea
ms Merchandising HR
Finance
Supply Chain
ITStore
Operations
NEXCOM
MCX
196
8.3.3.3. Implementation Phase II
Exchanges:
In the second implementation phase, the exchanges should continue their consolidation efforts
by evaluating the best approach to consolidating merchandising, supply chain, and store
operations functions. In each of these functions, the exchanges should establish a new
combined team that leverages the current talent, capabilities, and processes of the three
exchanges. In this process, the exchanges should leverage the lessons learned from the first
implementation phase. For instance, the exchanges should be able to better leverage resources
that do not have a role in the end-state organization. These resources could support the
transition efforts directly or provide additional analytical support as necessary. Moreover, the
back-office consolidation should be instructive of the working relationship necessary between
the exchanges and the IMO and any potential cultural challenges they would face.
We believe that the exchanges should eventually consolidate fully to form a single business unit
(BU) reporting into the leader. However, this transition represents a significant change for the
exchanges that would require careful coordination across each of the exchanges, the leader,
and the governance board. Therefore, we believe that they should evaluate the outcome of the
back-office consolidation in the first implementation phase and discuss the most equitable
approach to consolidating the exchanges. For example, they should discuss the structure of the
leadership of the new business unit. A successful consolidation would require the stakeholders
to come to an agreement on the transition plan that they can each support. There would be
some difficult decisions throughout this phase, such as whether to consolidate physical
headquarters. Each of these decisions would have a major impact on exchange employees and
need to be considered carefully. However, if managed properly and communicated effectively,
consolidation could create a combined exchange that would be positioned to deliver more to
patrons and the military overall.
It will be important to consider how to continue the exchanges' non-retail functions, such as
ship stores, Navy Lodges, uniform programs, and overseas school meal programs under the
consolidated exchange BU. They provide important benefits to patrons and the broader
military community and present limited potential for synergies given their unique missions.
Therefore, the priority should be to maintain these programs with minimal disruption to the
services they provide.
197
DeCA:
In the second implementation phase, DeCA would execute NAF conversion and consolidate its
back-office functions with the SSBU. The first day of NAF status for DeCA would bring about a
series of changes in finance, HR, and contracting. In finance, DeCA would transfer all its
responsibilities to the SSBU, which would publish the NAF financial statements starting in the
first full quarter after conversion. In HR, DeCA would transfer its responsibilities for all new
employees to the SSBU; however, some HR resources in DeCA would continue to have a role to
provide HR support for DeCA's existing APF employees. In contracting, DeCA would transfer
existing contracts and all new contracting responsibilities to the SSBU. However, some DeCA
resources would need to support the SSBU in order to monitor the existing APF contracts until
the end of their lifespan. We estimate that roughly half of the current HQ resources at DeCA
would have new roles at the SSBU after this process. The remaining DeCA resources could
support SSBU responsibilities, facilitate integration efforts, and provide additional data analysis
while transition is completed through relocation, attrition, and early buy-outs.
There may also be opportunities in this phase for enhanced collaboration on retail activities
between DeCA and the consolidated exchanges. For example, DeCA and the exchanges could
work together on private label sourcing and merchandising in overlapping categories. There
may also be a similar opportunity to collaborate on sourcing retail goods in overlapping
categories. Pursuing these opportunities could enhance synergies for both organizations.
8.3.3.4. Beyond Implementation Phase II
We believe that the scope and extent of consolidation described in this section should serve as
a meaningful medium-term goal for the military resale system. However, there are further
opportunities for consolidation. For instance, while we do not recommend any consolidation of
the store footprint in the medium-term, there may be long-term opportunities for a selective
rationalization. Moreover, although we do not believe that the potential benefits of supply
chain consolidation of DeCA and the exchanges justify additional one-time costs and potential
risks, it may make sense to look for further areas of cooperation once the supply chain
consolidation of the exchanges is completed. The governance board should continue to
evaluate opportunities to enhance organizational performance and maximize synergies
throughout the consolidation process.
198
Figure 8.19: Summary of consolidation next steps
Align on overall governance approach and determine Principal Staff Assistant
responsible for the military resale system
Launch new governance board; disband existing old governance boards
Select a new leader of military resale
Launch IMO
Conduct integration planning for back-office and IT integrations of the exchanges
Establish the SSBU and execute back-office integration
Conduct integration planning for merchandising and supply chain integrations of the
exchanges and back-office and IT integrations of DeCA and the exchanges
Execute merchandising integration and COGS improvement efforts
Execute supply chain integration and optimization initiatives
Execute back-office transition of DeCA functions to the SSBU, aligned with NAF
conversion
Evaluate opportunities for further integration of DeCA and the exchanges
199
Section 9: Patron Impact (Study Objective 6)
9.1. Approach and summary of benefit today
One of the primary purposes of the military resale system is to provide a benefit to eligible
patrons. The military resale system provides this benefit to patrons in many different ways,
ranging from savings on the products they sell to a convenient place to shop to MWR
contributions to the many programs they manage that serve both patrons and the community.
Given the importance of the benefit to patrons, we were asked to carefully consider how any
potential change to the military resale system would impact patrons, quantifying that impact
where possible.
9.1.1. Patron survey
To help assess the potential impact on patrons of our proposed changes, we surveyed eligible
military resale patrons to collect their feedback on key topics.375 The survey was open for
respondents in May 2015 and distributed to a broad sample of eligible patrons balanced across
demographics (active duty, dependent, retiree, etc.), location (CONUS versus OCONUS),
military branch, and rank. We have a response rate of 2.5% (which matches expectations given
DMDC's prior experience and the short fielding period) with a total sample size of over
14,500.376, 377 This large sample size allows us to look at responses by patron segment in a
statistically significant way.
The overall approach of the survey is to first understand patron shopping behavior today. This
section of the survey asks questions about patron's eligibility to shop, share of grocery spend
across a variety of retailers, and specifics about their last trip to the commissary. Then, each
respondent progresses down one of three randomly selected paths to gather thorough feedback
across a variety of topics. The three deep-dive paths in the survey are:
1. Private label: Understand openness to purchase private label products at the
commissary by category
2. Pricing: Understand customer responsiveness to potential price increases
375 Our survey received all requisite approvals from DoD/DMDC/P&R and the military branches; assigned report control symbol DD-P&R(OT)2585 376 Sample excludes roughly 700 survey respondents that were removed during data cleansing based on questionable responses to price perception questions (i.e., perceived commissary prices were 20% or more greater than competitor retailers). Data cleansing of this variety is normal in our quantitative research projects 377 Survey respondents are directed to answer varying questions in the survey, so each question is not necessarily presented to every respondent
200
3. Commissary perception and category expansion: Understand overall patron
satisfaction and willingness to purchase new categories (e.g., beer and wine) from the
commissary
Through this survey we are able to better understand the impact of various initiatives on both
patrons overall and specific segments of patrons (e.g., retirees).
9.1.2. Overview of patron benefit today
The military resale system provides numerous benefits to its patrons today. Some patrons view
the commissaries and exchanges as critical components of their overall compensation, and
many see military resale as a part of what allows the Department of Defense to maintain an all-
volunteer military.378 Our patron survey confirms the importance of these programs,
highlighting high share of wallet and satisfaction among commissary users today.379
At the highest level we can separate military resale benefits into five major categories:
Savings: Both DeCA and the military exchanges provide a variety of products at prices
below private sector competitors. These benefits effectively reduce the cost of living for
eligible patrons that use these stores.
Contribution to MWR: While DeCA does not retain any profits, the military exchanges
all accrue earnings in excess of their costs. They distributed roughly 63% of these
earnings to each branch's morale, welfare, and recreation (MWR) programs, which
provide valuable quality of life programs on base.
Service on base: DeCA and the military exchanges provide familiar, American goods
across their 4,000+ facilities worldwide.380 Patrons value the convenience, selection of
products, and connection they provide to the military, particularly in remote and
OCONUS locations (e.g., the Navy Exchange in Djibouti).
Employment: DeCA and the military exchanges employ many military-connected
individuals, such as spouses. For these families, employment provides an additional
378 One respondent noted: "Commissary benefits at current level are critical to recruiting and retaining an all volunteer force." 379 Commissary users spend roughly 65% of their total grocery budget at DeCA (unweighted N = 13,095); about 70% rate the commissary as "better" or "much better" than their nearest competition (unweighted N = 2,336). Source: May 2015 BCG patron survey 380 Includes grocery stores, department stores, marts, and quick-service restaurants
201
benefit to household income. Especially in OCONUS locations, these jobs may be the
only option depending on the language skills of the family member.
Mission support: DeCA and the military exchange support a variety of branch-specific
programs, such as providing school lunches on some Army, Air Force, and Navy bases
and facilitating the motorcycle safety program for the Marines. These are just a few of
the many programs managed by the exchanges and DeCA.
In the subsequent sections, we first work to understand the value and perception of these
benefits today across the eligible patron base. Then, using the customer survey and additional
inputs, we analyze how each proposed initiative could impact each element of the benefit,
quantifying the impact wherever possible.
9.1.2.1. Savings
Access to low-priced goods is a critical part of the benefit DeCA provides. Our customer survey
shows that over 50% of patrons view "value for the money" or "low prices" as the most
important reason they shopped at the commissary (see Figure 9.1).
202
Figure 9.1: Reasons for shopping381
Similarly, the price savings are the most communicated benefit of the commissary. DeCA itself
suggests a 30% average price discount to competitors. However, as discussed in Section 4, our
analysis suggests the savings rate is approximately 16-21%. In this case, the total dollar value of
the savings would be $1.1 - $1.6B annually (see Figure 9.2).
Figure 9.2: Aggregate value of DeCA savings
DeCA FY14 retail revenue382 $5.9B
Average DeCA discount 16 – 21%
Equivalent sales at cheapest competitor $7.0B - $7.5B
Aggregate patron savings $1.1B - $1.6B
381 Source: May 2015 BCG patron survey, unweighted N = 11,057 382 Includes sales and the 5% surcharge
318987-02-DeCA-03Jun15-VA-WAS-v04_PJF Updatesv2.pptx 32Draft—for discussion only
That being said, the perception of the benefit is not aligned with the actual savings. When
asked about the difference between DeCA's prices and the lowest priced nearby competitors,
patrons provided a wide range of answers (see Figure 9.4).385
383 Annual grocery spend, DeCA share, and average income based on customer survey, income assumes midpoint of range for reported income levels (e.g., $0-$25,000 treated as $12,500), Source: May 2015 BCG patron survey, unweighted N = 11,057 384 Implied discount estimated at 16-21% based on market basket study 385 Note: Excludes all respondents that thought DeCA prices were at a 20% or greater premium than competitors. Source: May 2015 BCG patron survey, unweighted N = 6,930
204
Figure 9.4: Range of perceived savings
62% believe the discount is lower than 10%, well lower than the savings rates calculated by
DeCA and suggested by our market basket analysis. Furthermore, many of the write-in
comments convey skepticism around the value of the commissary. In particular, respondents
mention the surcharge (often much higher than grocery sales taxes) and tips to baggers as
elements of the commissary that detract from the apparent value at the shelf.386 The patron
feedback suggests that DeCA does not get full credit from patrons on the savings provided
today.
Furthermore, the price savings are perceived differently by different sets of patrons. As
expected, OCONUS patrons tend to perceive greater discounts than CONUS patrons (15%
versus 9% on average).387 Also, price perception differs by rank and status, with active junior
enlisted members perceiving the least savings (see Figure 9.5).388 When looking across the
386 One respondent mentioned: "With the surcharges and baggers tips you end up paying about the same as the other stores. The prices sometimes are higher than other stores if you are not careful." 387 Source: May 2015 BCG patron survey, unweighted N = 6,930 388 Source: May 2015 BCG patron survey, unweighted N = 6,930
Patrick Exhibitsv6.pptx 17Draft—for discussion only
How do prices at the Commissary compare to other local grocery stores?
6
98
11
12
1615
11
6
33
0
5
10
15
20
% of weighted respondents
11-20%6-10%1-5%Same price
1-5%6-10%11-20%21-30%31-40%41-50%>50%
1. Unweighted N = 6,930 2. Question: "How do prices at the Commissary compare to other local grocery stores for the same products across all the items you buy?"; discount based on lowest priced competitor based on perceived discount
DeCA cheaper DeCA more expensive
Patron perception of Commissary prices
205
initiatives, we consider the impact on specific segments (e.g., junior enlisted) as well as the
aggregate impact.
Figure 9.5: Perceived discount by rank and status389
The exchanges offer discounts on their products which they value at 20 – 25%.390 However,
evaluation of this benefit is out of scope for this study.
9.1.2.2. Contributions to MWR
Unlike DeCA, the exchanges generate earnings, of which a large portion is transferred towards
Morale, Welfare, and Recreation (MWR) programs annually.391 These contributions support
quality of life improvements for military members and their families. The exchanges
389 Implied average based on midpoint of range (e.g., 16% discount for 11-20% discount) and 50% for >50% cheaper option; Other includes Medal of Honor recipients, 100% disabled veterans, and DoD civilians stationed overseas (and their family members); Source: May 2015 BCG patron survey, unweighted N = 6,930 390 AAFES, NEX, and MCX annual reports and prior studies 391 Exact distribution percentages can vary from year to year
Patrick Exhibitsv6.pptx 18Draft—for discussion only
>30% cheaper1-10% cheaper11-30% cheaper0-10% more expensive
11-20% more expensive
Implied
average7% 8% 8% 11% 16%
206
contributed a combined $304M to MWR in 2013, representing 63% of earnings. (see Figure
9.6).392
Figure 9.6: Summary of 2013 MWR contributions393
MWR Earnings MWR (%)
AAFES MWR $209M $332M 63%
NEX MWR $52M $73M 71%
MCCS MWR $43M $76M 57%
Total $304M $481M 63%
Any initiative that impacts the exchanges' earnings would affect contributions to MWR. These
impacts can be direct and indirect. For example, any cost savings to the exchanges would
directly impact net earnings, and thus MWR contributions. Other initiatives, such as improving
DeCA's in-store merchandising, would have no direct impact on the military exchanges, but by
increasing traffic to the commissary, may have a secondary positive impact on exchange traffic.
These second order implications were considered to evaluate the total impact and should be
monitored by DoD when implementing any changes.
9.1.2.3. Service on base
Beyond the savings and MWR contributions, DeCA and the exchanges provide a host of less
quantifiable benefits that are highly valued by patron base. On the whole, they provide a
consistent set of quality, American products through convenient on-base locations. Within
CONUS, patrons mention "supports the military", "meat quality and selection", and
"convenient location" as key reasons for shopping at the commissary.394
These benefits are even more important to patrons in remote and overseas locations. For these
military members, the commissary and exchange can often be the only place to shop for
familiar, American goods. Not surprisingly, in OCONUS locations, "convenient location" and
392 Contributions are made proportionally to each military branch's MWR program 393 AAFES, NEX, and MCX annual reports 394 Based on the percentage of patrons that marked each statement as a Top 3 reason for shopping at the commissary (31%, 22%, and 13% respectively); Source: May 2015 BCG patron survey, unweighted N = 11,057
207
"availability of American products" are the most important reasons for shopping at the
commissary after the discount (see Figure 9.7).395
Figure 9.7: OCONUS versus CONUS value of convenience
Similarly, NEXCOM's ship stores are a good example where availability of basic American
products can be a major benefit to patrons (in this case sailors deployed on a Navy vessel).396
Morale factors like these provide additional benefit beyond the traditional measures, such as
savings.397
9.1.2.4. Employment
The military resale system employs a large number of military-connected individuals (i.e.,
veterans, spouses, and other family members). A recent study suggests more than 60% of
DeCA's employees have some military connection, as well as roughly 30% of the exchanges'
employees.398 Though the primary focus of potential reforms in the military resale system
395 Source: May 2015 BCG patron survey, unweighted N = 2,081(for OCONUS) 396 During our visit on board the USS George H.W. Bush several ship store servicemen mentioned their patron affinity for familiar, American products 397 One commissary patron mentioned, "Have American products overseas in the DeCA Commissary is awesome!" Many similar comments highlighted the desire for American products at a reasonable price while overseas 398 The Military Resale and MWR Center for Research, "Resale and MWR CFR Costs and Benefits of the DoD Resale System"
2015-06-24 Materials for our discussion - Patron Impact and SurveyvCommentsv2.pptx 9Draft—for discussion only
"Convenient location" "Availability of American production"
30
20
0
10
20
30
40
CONUS
% of respondents marking as a top 3 reasonfor shopping the commissary
OCONUS
34
4
0
10
20
30
40
CONUS
% of respondents marking as a top 3 reasonfor shopping the commissary
OCONUS
208
should be preserving or enhancing the patron benefit and reducing reliance on APF, any
change to employment or wage levels may have second-order impacts on patron households
through changes in employment opportunities and benefits.
9.1.2.5. Mission support
The military resale system provides numerous other benefits through specialized programs
around the globe. For example, AAFES provides school lunches in 89 cafeterias on overseas
bases. MCX and NEXCOM run similar programs for the benefit of the patrons and the
communities they are part of. In addition to these programs, the military exchanges support a
number of other non-traditional businesses, such as Navy Ship Stores, which further enhance
the impact of military resale on the broader military community.
9.2. Impact on the benefit
To evaluate the patron impact of our proposed initiatives, we look at each dimension across all
possible initiatives to understand the aggregate impact. This approach allows us to see the end
result from pursuing a variety of initiatives that often offset one another in terms of patron
impact.
For example, in isolation, a small price increase could negatively impact the aggregate savings
that patrons experience at DeCA by lowering the discount to competition and reducing store
traffic.399, 400 However, introducing private label products concurrently would increase the
average savings rate and provide patrons with a better selection of products.401 Depending on
the level of penetration and degree of discount on the private label products, the net patron
impact could be positive in the form of a lower cost basket of goods.
In some circumstances, the impact to a given benefit depends on how government decision-
makers treat the initiative from a financial perspective. For example, lowering COGS, in today's
environment, would result in an increase to patron savings (through lower prices) and not
reduce APF. On the other hand, if DeCA is given the ability to move to variable pricing,
lowering COGS would reduce APF needs but not necessarily increase patron savings. In these
399 See Section 4: Pricing 400 Though we are not recommending a price increase, we evaluated the option in response to the study objectives. 401 See Section 5: Private Label for additional detail
209
cases, we indicate the likely impact under DoD's current policies, noting the future policy
tradeoff in the subsequent discussion.
Overall, we believe the net impact on patrons across all initiatives discussed in this study would
be positive. The primary benefits that affect all patrons (savings, MWR contributions, and
service on base) should all improve with the proposed initiatives. Similarly, we believe the
proposed initiatives would have little to no impact on mission support programs. Though some
initiatives (e.g., consolidation) may negatively affect a subset of employees, the full set of
initiatives would increase the overall benefit while also reducing the need for APF (see Figure
9.8).
Figure 9.8: Patron impact summary
9.2.1. Savings
DeCA's aggregate patron savings are driven by both the average savings rate provided by DeCA
on each purchase as well as total sales at the commissary. It is important to consider both
factors when evaluating the impact of any proposed initiatives. As an example, DeCA could
Impact all patrons Impact some patrons
SavingsMWR
contributions
Service on
baseEmployment
Mission
support
Positive
impact
Accept Military Star card
Improve merchandising and
reduce COGS
Improve store operations
Introduce private label
Expand the patron base (Long-
term initiative)
Increase store hours (Long-term
initiative)
Mixed
impact
Consolidate military exchanges
with each other and DeCA
Introduce beer / wine at DeCA
Small
negative
impact
possible
Convert to NAF
· Adjust wages and benefits
· Adjust labor mix (FT/PT/Flex)
Increase local sourcing
Realign above-store organization
Small price increase
No
impact
Rationalize goods not for resale
Rationalize surcharge / capex
Positive impact to patrons
Potential negative impact to patrons
210
choose to decrease store hours and days of operation to reduce the need for appropriated
funds, which it has done in the past. While these changes would not impact the average rate of
savings, patron traffic and sales volume would likely decline, as stores would be closed more
frequently when patrons may want to shop. As a result, the aggregate savings benefit provided
would decline. Therefore, we looked at initiatives that impact the savings level (e.g., price
increases) as well as those that impact sales volume (e.g., store hours).
Across all proposed initiatives, the only change that would negatively impact patron savings is a
potential 1-3% price increase. If government decision-makers were to proceed with a 1-3% price
increase at DeCA (which carries some risk to patron benefit and we do not recommend in the
near-term),402 the impact would likely be twofold. The direct impact would be a proportional
decrease in the discount rate for all patrons (e.g., a 1% price increase in prices would result in a
1% decrease in the discount). Second, a price increase would likely reduce patron traffic, as
they shift share of wallet to other retailers.
As mentioned in the pricing section, our patron survey suggests patrons are sensitive to any
perceived increase in prices, potentially reducing trips to the commissary by as much as roughly
25% if DeCA were to take a 5% price increase (implying an elasticity403 of roughly -5). Assuming
the reaction to a 1-3% price increase is similar, such an increase may drive a 5-15% decrease in
traffic. In this scenario, the price increase could drive a $340M decrease in aggregate patron
savings. However, since this is self-reported elasticity, we believe the traffic response should be
less dramatic and may be closer to -3 (the average across all suggested price increases).404
Other than a price increase, we believe all the other initiatives should have neutral to positive
impacts on aggregate patron savings. Price normalization, for instance, should not impact
average patron savings. This process would entail moving towards a consistent regional savings
rate for all CONUS locations (e.g., all CONUS locations price all products at a 21% discount to
local competition). These small changes would involve disparate impacts to different patron
groups, as certain geographies would see increases in price levels while others see decreasing
prices. However, the net impact would be neutral, and the overall result would be a more
402 See Section 4: Pricing 403 Elasticity refers to the percent change in traffic for a percent change in price (e.g., -5 means that customers will shop 50% fewer times if DeCA increases prices by 10%) 404 This data is self-reported so while directionally accurate the magnitude may differ when executed. Source: May 2015 BCG patron survey, unweighted N = 6,930
211
consistent spreading of the benefit. The normalization process would positively impact
segments of the eligible patron base that do not experience the communicated level of benefit
today (e.g., junior enlisted members that live in areas with lower discount rates, such as rural
Georgia.405
Furthermore, price normalization could help restore DeCA's price perception. Today, many
patrons appear to underestimate the value of the commissary benefit, partially as a result of
differing savings level across products and geographies. By moving towards a more consistent
savings level, patrons could shop at DeCA confident in how much they would save. This
improvement in price perception would likely increase share of wallet and patron traffic.406
A host of other initiatives would further improve patron savings. The introduction of private
label products would reduce the average price level and likely outweigh the impact of any
small price increase. Since new private label products are sold at a discount, they would drive
down the price for a normal grocery basket as they gain popularity. Since approximately 60% of
patrons are willing to purchase a DeCA private label,407 we feel confident that DeCA could
eventually reach market-level private label penetration (19%) with a 20% average discount to
their national brand offering. At full penetration, private label products would drive a 4%
decrease in average prices.
In addition, DeCA can utilize other levers to further increase patron share of wallet. One such
example is in-store merchandising. "Ease of finding what I want" is an important predictor of
how much patrons spend at the commissary versus other grocery stores.408 However, DeCA
experiences several challenges today that limit ease of shopping. Out-of-stocks were a relatively
common issue in several locations that we visited. Furthermore, some patrons mention
difficulties navigating the stores and finding products in the customer survey.409 By improving
405 Roughly 80% of eligible patrons near Ft. Benning (a low cost of living area) are active enlisted compared with Annapolis (a high cost of living area with stronger commissary discounts) where a large portion of eligible patrons (up to 60%) are retirees 406 Low prices had a strong and statistically significant correlation with customer share of wallet. Source: May 2015 BCG patron survey, unweighted N = 2,344 407 Source: May 2015 BCG patron survey, unweighted N = 3,843 408 Results from stepwise regression of satisfaction levers on customer share of wallet. Source: 2015 May BCG patron survey, unweighted N = 2,344 409 Example verbatim from commissary patron: "Overall, the commissary is hard to get around in"
212
along these and other dimensions, DeCA could likely improve share of wallet and drive
additional patron traffic.410
Once DeCA earns a positive contribution margin on each sale in the longer term,411 additional
opportunities exist to enhance the patron benefit. Once profitable, DeCA can expand store
hours and days of operations to increase convenience for its patrons. Since convenience is such
an important aspect of grocery shopping, these changes would further increase store traffic and
overall savings.
Overall, we believe the net impact on customer savings from executing on all savings levers.
Estimating the impacts of a hypothetical scenario, the patron savings impact could be positive
even if DeCA executes a small price increase.412 Price normalization could have a neutral
overall impact. The introduction of private label could reduce average price levels by almost
4%, increasing the benefit by $352M at penetration. Given this benefit, even if DeCA executes a
2% price increase that elicits a strong traffic response (elasticity of -5), the negative impact of a
price increase would not outweigh the strong benefit provided by private label. Furthermore, if
DeCA pursues other initiatives to improve share of wallet, the aggregate benefit to patron
savings could be even greater than shown below (see Figure 9.9).
410 Reaching satisfaction along certain dimensions (e.g., improving merchandising) associated with a 3% or greater increase in customer share of wallet. Source: 2015 May BCG patron survey, unweighted N = 2,344 411 The point at which an incremental sale results in a positive net margin (versus loss) for DeCA 412 Calculations exclude longer-term initiatives such as expanding store hours; these changes present additional upside down the road for DeCA
213
Figure 9.9: Run-rate impact of initiatives on aggregate patron savings413
9.2.2. Contributions to MWR
As mentioned in Section 9.1.2.2, MWR contributions are an important aspect of the patron
benefit. Funded by the military exchanges' earnings, these programs provide quality of life
improvements such as on-base golf courses. Therefore, any impact to exchange earnings is
important to consider when evaluating the patron impact of proposed initiatives.
Across our proposed initiatives there are direct and indirect potential impacts to MWR. Direct
impacts include any changes that influence the earnings ratio for the military exchanges.
Indirect impacts include initiatives at DeCA that potentially influence traffic to the military
exchanges.
Consolidation of the military exchanges is the biggest topic that needs to be assessed.
Consolidation could reduce operating costs without negatively impacting sales potential
413 Assumes patron savings of 18.5% (midpoint of 16-21% range)
2015-06-07 DeCA slidesv4.pptx 72Draft—for discussion only
Run-rate impact on aggregate patron savingsEven with conservative assumptions run-rate impact is flat to positive
0
1,400
1,200
800
600
400
200
1,600
1,800
1,000
Normalize prices
352
Introduce private label (increase savings rate)
Run-rate savings (with price increase)
1,682
Run-rate savings (without price increase)
-168
Price increase (discount impact)
Price increase (traffic impact)
1,343
-170
Aggregate patron savings at DeCA ($M)
Baseline savings
1,330 0
A 2% price increase with a strong response would still result a positive impact to aggregate savings when
combined with private label
Price normalization should have an unquantifiable
benefit of improving price perception
214
(discussed in detail in Section 8: Consolidation). The first phase of consolidation efforts would
combine the back-office functions of the military exchanges into a shared services business unit
(SSBU). The net impact would be a reduction in personnel costs and an increase in earnings
and MWR contributions. The second phase would build on these savings, further integrating
their above-store organization, aligning supply-chain, merchandising, and store operations.
Beyond headcount savings, these changes should also yield reduction in cost of goods sold due
to increased purchasing volume. All in all, consolidation of the military exchanges could yield
roughly $220M in annual synergies, contributing an additional $140M to MWR.414, 415
In the second phase of consolidation, we propose incorporating DeCA into the SSBU.
Integrating DeCA's back office functions could generate approximately $50M in additional
savings, the majority of which comes from DeCA. It is unclear whether these savings would
flow to MWR or be used to reduce DeCA's APF. As with other savings categories, DoD should
carefully consider the range of options for allocating the savings between reducing DeCA's APF
or increasing the military exchanges' earnings.
However, consolidation of any kind can be difficult, and some changes may be visible to
patrons. To achieve full COGS savings, for example, the exchanges may need to selectively
harmonize their assortments (e.g., move to the same manufacturer in some categories).
Currently, each exchange offers an assortment it believes is best suited to its patrons' shopping
habits and preferences. Sales performance across branches in each category would need to be
monitored as changes towards a common assortment are made, and the stores of each
exchange would need to maintain some level of customization to their respective military
branches to off-set this impact. However, all other aspects of consolidation would not be visible
to the patron and should have little impact on the patron experience.
In addition to consolidation, the introduction of beer and wine at DeCA presents a potential
indirect impact to the military exchanges. In 2013, the military exchanges sold approximately
$447M in beer and wine, representing roughly $96M in gross margin.416 Based on our survey,
we estimate that patrons spend 53% of their total beer and wine expenditure at military
414 Applied a 63% flow-through from earnings to MWR based on Figure 9.6 415 In the short-term, consolidation one-time costs could negatively impact MWR depending on how the costs are financed, see Section 8: Consolidation for additional detail 416 Category sales and margin data from NEX, MCX, and AAFES; NEX estimates assumes similar margin rates to MCX given beer and wine margin data was not provided
215
exchange outlets. If DeCA introduced beer and wine, patrons suggested they would increase
the overall share purchased at military resale outlets by 46% ($204M in sales), but they would
reduce the amount spent at the military exchanges by 42% ($189M in sales) (see Figure 9.10).
Figure 9.10: Impact of introducing beer and wine at DeCA417
The overall impact to the military resale system would be positive, but under current rules, this
shift in spend would reduce the military exchanges' contributions to MWR by $26M. That being
said, DoD could choose to mitigate this potential impact with a change in policy (e.g., allocate
some portion of the beer and wine margin earned at DeCA to the military exchanges).
The various impacts to DeCA's traffic could also have a small impact on the military exchange's
sales. Our customer survey suggested that commissary trips drive 20% of trips to the
exchange.418 Therefore, any initiative that drives a 10% increase or decrease in DeCA would
lead to a corresponding 2% increase or decrease in traffic at the military exchanges (a $6M
impact to MWR at current levels). So, a modest increase in DeCA's prices would lead to a small
417 Source: May 2015 BCG patron survey, unweighted N = 2,667 418 46% responded that they visited a military exchange during their last trip to the commissary and 44% suggested that they would not have visited the exchange if they had visited a different grocery store; Source: May 2015 BCG patron survey, unweighted N = 5,945
2015-06-24 Materials for our discussion - Patron Impact and SurveyvComments.pptx 8Draft—for discussion only
Adding beer / wine can increase overall share for military
resale, but would likely reduce share for exchanges
Note: Unweighted N = 2,667 (individuals that answered the question and purchase beer and wine today)Source: May 2015 BCG patron survey
1,000
800
600
400
200
0
Annual beer and wine sales ($M)
+204
(+46%)
With addition of beer and wine at DeCA
392(46%)
258(30%)
198(23%)
Today
447(53%)
402(47%)
DeCANon-military Exchange
Introducing beer and wine a net positive for
military resale...
...but could adversely impact exchange
sales and MWR under current rules
• $392M increase in sales
• $86M increase in margin, which could be used to offset APF
DeCA
Military
Exchanges
(shift to
DeCA)
• $189M decrease in sales
• $41M decrease in margin, leading to a $26M decrease in MWR
Military
Resale
• $204M increase in sales
• $44M increase in margin
-189
(-42%)
Private sector and footnote
DeCA – military exchanges
= military resale
216
decline in exchange traffic. Conversely, the host of DeCA share of wallet initiatives would not
only improve DeCA's aggregate savings but also lead to increased MWR contributions.
In total, the initiatives at DeCA should eventually lead to increases in traffic at the military
exchanges. Consolidation of the military exchanges would lead to a $140M increase in MWR
across the two phases. While introduction of beer and wine at DeCA could reduce MWR by
$26M under the current set of policies, the net increase to MWR would still be $115M (see
Figure 9.11).
Figure 9.11: Consolidation impacts on MWR contributions419, 420
9.2.3. Service on base
Convenience is an important reason patrons use the commissary today. Patron satisfaction with
store location and open hours is positively correlated with how often they use the
419 Assumes that roughly $48M of consolidation savings flow through to DeCA (versus the exchanges) in Implementation Phase II 420 Impacts below reflect what would likely happen before DoD or Congress make decisions to change the current financial arrangement (e.g., shift some savings from MWR to DeCA APF or vice versa)
2015-06-24 Materials for our discussion - Patron Impact and SurveyvCommentsv2.pptx 7Draft—for discussion onlyC
Run-rate impact on MWRConsolidation outweighs potential downside from other DeCA initiatives
200
600
400
0
419
SSBU integration with DeCA
0
Further exchange integration
90
Introduce beer / wine to DeCA
-26
Exchange SSBU
50
Baseline MWR contributions
304
Exchange contributions to MWR ($M)
Run-rate MWR contributions
Implementation Phase I Implementation Phase II
217
commissary.421 Furthermore, 80% of heavy commissary users422 find the commissary location as
equally or more convenient than competitors whereas roughly 72% of individuals who do not
use the commissary find the commissary location less convenient than competitors.423
None of the proposed initiatives would impact the convenience of the commissaries and
military exchanges. Store closures or reductions in store operating hours would pose a risk, but
we would not recommend closure of commissaries as the opportunity is small and poses
definite risk to patron benefit.424
Likewise, we do not recommend exploring further reductions in commissary hours or days of
operation. Instead, we would actually recommend expanding operating hours once the cost
savings have begun to phase in.425 Such a change would only serve to increase customer share
of wallet and satisfaction with DeCA's convenience.
Another important benefit is the selection and availability of products that DeCA and the
exchanges offer, particularly for patrons located OCONUS or in remote locations. Our survey
showed that 89% of OCONUS eligible patrons mention that having the "products I want always
available" is important when choosing where to shop for groceries.426 Both consolidation of the
military exchanges and further expansion of local sourcing could impact the assortment and
availability of products.
In consolidation, the new combined entity would likely move closer to a common assortment
across the different stores as mentioned above. These changes should not reduce the overall
breadth of products offered, but they may result in discontinuing certain brands (e.g., offer one
brand in a category versus two). DeCA and the exchanges should monitor any changes closely
and carefully consider the patron impact concurrently with the potential APF savings.
421 Stepwise regression of 15 satisfaction levers on share of wallet yielded coefficients of 10.6 and 4.7 respectively (both statistically significant, overall R-sq of .15). Source: May 2015 BCG patron survey, unweighted N = 2,344 422 Patrons who spend more than 50% of their total grocery budget at the commissary (unweighted N = 1,671) 423 Unweighted N = 1,499; Source: May 2015 BCG patron survey 424 Only 5 CONUS commissaries are within a 10 minute drive of another commissary 425 See Section 10.4 426 Includes patrons that responded "Important" or "Very Important". Source: May 2015 BCG patron survey , unweighted N = 474; only includes those who responded to question on most important factors
218
Similarly, local sourcing could replace some American, name-brand items with regional
equivalents. These options often come in different languages and may make the patron
shopping experience somewhat more difficult in some circumstances. As a result, we propose
primarily locally sourcing items that will still remain familiar (e.g., sourcing Coca Cola from
their OCONUS distribution centers). This conservative approach to local sourcing would help
minimize the potential impact to patron perception and ensure the products that patrons are
used to are still available. In some cases (e.g., produce), the product patrons get may actually be
higher quality or fresher, so this will help mitigate any impact of local sourcing on the patron.
Overall, the set of proposed initiatives should maintain or enhance the actual service provided
on base and we believe that if all initiatives were implemented the experience of shopping at
the commissary would be improved.
9.2.4. Employment
The proposed set of initiatives poses the largest downside risk to employment benefits. Many of
DeCA's employees are connected to the military, either as veterans or through family
members. For example, it is very common for spouses to work in an exchange or the
commissary while stationed in OCONUS locations. Consolidation and re-aligning DeCA's above
store organization could pose a risk to a small number of headquarters employees. NAF
conversion and improving store operations could impact a broader set of military resale
employees, including in-store workers.
Consolidation could also result in an overall reduction in employees. In private sector merger
contexts, we often see 30-40% reduction in headquarter resources. Given the limitations of a
Federal workforce, the proposed downsizing would occur over a number of years through an
attrition model. Nevertheless, the net result would be a reduction in jobs available. To
minimize the impact on current employees, the combined entity should make judicious use of
relocation assignments, early retirement incentives, and attrition. Furthermore, any
organization changes should be communicated clearly and early to reduce uncertainty for the
employees. By making implications as transparent and fair as possible, the combined
organization could reduce negative employee impact. Finally, most military connected
employees work in stores, as opposed to headquarters. So while the broader employee impact
should be considered, the second-order impact on military resale patrons should be limited
because stores will see minimal or no reductions as a result of consolidation.
219
Separate from potential reductions, converting DeCA to a NAFI poses a risk to the in-store
employee base through wage and benefit reduction. These changes would phase in gradually
over time and primarily impact new hires (as current employees would be protected through
save pay). That being said, DeCA's in-store workforce would eventually command wage and
benefit rates 15-25% less than their current levels. This shift would impact some patron families
and therefore should be a consideration.
Conversely, in-sourcing contractor labor could counteract some of the employee risk and
extend additional employment opportunities to military-connected individuals. Under a NAF
regulatory framework, DeCA would be able to support a larger employee base at compensation
levels commensurate with private sector grocers. However, in-sourcing may negatively impact
contractor employees,427 many of whom are disabled individuals employed through
SourceAmerica.428 While this impact should be considered, this implication would not directly
affect the patron community.
9.2.5. Mission support
As mentioned before, the military resale system supports a number of unique programs for the
military community outside of traditional retail, including the motorcycle safety program at
MCX and school lunch programs at AAFES and NEX. Understandably, each service branch and
military exchange has concerns surrounding how consolidation could impact these important
aspects of their organizations.
As mentioned in Section 8.2.5, consolidation need not negatively impact these branch-specific
programs and activities. Meeting the needs of military servicemembers and their families
should always be the core mission of military resale. The synergies (and improvements to
MWR) would stem from integration in core back office and retail functions. As such, we believe
consolidation can reap the benefits of headquarters integration without jeopardizing the
execution of these programs.
427 It should be noted that DeCA's contractors often serve special purposes, such as employing disabled or minority individuals (e.g., Ability One) 428 DeCA spent approximately $100M on contract labor with SourceAmerica in FY14
220
9.3. Summary
Overall, we believe DeCA and the military exchanges can take great strides towards reducing
APF requirements or increasing MWR while also generating positive net impact to the patron
community. While some individual initiatives may generate adverse impacts to some patrons,
the potential downside can be carefully monitored and mitigated. Furthermore, many
initiatives would result in positive impacts that outweigh the potential downside and overall we
expect the patrons to have a stronger military resale system that delivers greater benefit as a
result of the initiatives in this study.
221
Section 10: Additional Opportunities Identified
10.1. Merchandising and cost of goods sold (COGS)
10.1.1. Background
Managing COGS is an essential activity for retailers and is a major driver of profitability. The
two components of COGS are the actual price paid by the retailer to the manufacturer for a
product and the additional funding or discounts provided by the manufacturer to the retailer.
This additional funding or discounts, often referred to as vendor funding, can come in many
different varieties. A few common examples are:
Funding for support of promotional activities
Funding for specific shelf space, such as endcaps429
Volume discounts applied when retailers sell larger quantities of product
Discounts for buying in larger quantities or certain formats (e.g., full truck loads)
Private sector retailers typically have category managers or merchants who have the
responsibility of maintaining manufacturer relationships. These merchants are very focused on
getting the best terms from manufacturers. A portion of merchants' incentives are typically tied
to the profitability of their category, which creates a strong incentive to manage COGS down.430
DeCA's current business model and incentives are not set up to make managing COGS a
priority. As discussed earlier, DeCA is required to use a cost-plus pricing approach. One
implication of this is that any savings resulting from reduction in COGS is passed directly
through to the patron. While this is good for patrons, it does not directly benefit DeCA's
economics. Because DeCA charges a 5% surcharge on the total cost of a product, lowering
DeCA's COGS actually results in less funding produced by the surcharge. Therefore, the DeCA
business model does not create an incentive to focus on continually improving COGS over time.
In addition, without moving away from cost-plus pricing, any benefit of improving DeCA's
COGS would not actually be captured and reduce APF needs.
Nevertheless, DeCA has taken some steps to improve its COGS. First, DeCA's standard resale
agreement stipulates that DeCA will get "best bucket" pricing from all of its manufacturers (see
429 Refers to the product displays at the end of an aisle in a store that are commonly used by retailers to generate higher sales on select products 430 Based on BCG's experience working with private sector grocers and other retailers
222
Figure 10.1. This agreement covers pricing but does not necessarily extend to cover some of the
types of vendor funding discussed above. Second, DeCA actively works with its manufacturers
to get support for promotional activity and monitors private sector grocery competitors to
ensure that if major promotions are run in the market DeCA is able to participate.
Figure 10.2: "Best bucket" pricing clause from DeCA standard resale agreement431
The average of all price offers made over a Calendar Year (January 1 through December 31) by the
Contractor for all products covered by this agreement shall be as low, or lower than, those offers made
to supermarkets in the United States under similar terms and conditions. The price offers made to
DeCA may or may not be accepted for ordering by the Contracting Officer or an authorized individual
located within DeCA. The terms and conditions of price offers shall include such factors as, but are not
limited to, quantity / dollar discounts, delivery requirements, delivery location or zone, period of
purchase, promotional discounts and terms, retailer performance, discount payment terms or any
other factor that results in or ultimately could have an effect on the prices offered to DeCA.
10.1.2. Opportunity
Based on our experience with private sector retailers, we believe there is likely opportunity for
DeCA to further reduce its COGS.
In the private sector, merchants typically go to much greater efforts to get funding support from
manufacturers. There are several ways retailers approach getting manufacturer support which
could represent opportunities for DeCA. Two good examples are leveraging endcaps and
rationalizing brands. Endcaps are commonly used in the private sector and reflect a tool that
DeCA could likely use to a greater extent. Most private sector grocers charge manufacturers a
fee for placing the manufacturer's product on an endcap because the sales associated with
placing a product on an end cap are typically higher than placing a product in an aisle. DeCA
does not currently use endcaps to this extent (see Figure 10.23). Another common private
sector lever to increase manufacturer support is brand rationalization. By reducing the number
of national brands it carries, DeCA could concentrate sales volume through specific
manufactures to help deepen partnerships with manufacturers and ensure greater support.
Vendor support can have a significant impact on a retailer's economics, it is thus critical to
DeCA could further reduce its COGS by adapting its overall approach to 1) analyze the
profitability of each category and patron preferences; and then 2) negotiate with manufacturers
based on the insights gained. Even at the most sophisticated retailers with very skilled
merchants focused on reducing COGS on an on-going basis, a targeted effort with strong
analytical support and consumer insight will yield savings. We have typically seen these types
of efforts yield a 2-3% reduction in COGS, which for DeCA would be worth $110-170M (see
Figure 10.3). 432 DeCA has not previously undergone a targeted effort to improve COGS, thus,
savings from a COGS effort may be even greater in this case (i.e., 4-5 % reduction). However,
because of some of the challenges DeCA will face in pursuing this opportunity (see discussion
below) we assume a more conservative 2-3% savings for our estimate.
Figure 10.3: COGS estimation calculation
Low High
DeCA FY14 COGS $5,662M
Deli / Bakery / Seafood COGS433 $151M
Addressable COGS $5,511M
Estimated COGS reduction potential 2% 3%
Estimated savings / APF reduction $110M $165M
While better management of COGS would be beneficial to DeCA, there are some potential
challenges. DeCA's cost of goods sold includes several elements that other retailers do not
include.434 Because DeCA does not manage its own supply chain, manufacturers deliver
products to DeCA stores through a network of brokers. The cost of this third-party supply chain
is built directly into the cost of the product, which makes the actual cost DeCA is paying for the
product itself difficult to determine. In addition, some manufacturers also have contractors put
the product on the shelves for DeCA, which is also built into the cost the manufacturer charges
DeCA. This lack of transparency would make some of the analyses necessary for negotiation
more challenging; however, by looking at profitability on a more granular level (e.g., by SKU
and by distributor) this can be overcome.
4322-3% savings generally seen among leading retailers in BCG experience. Savings captured in a form that can directly impact retailers' bottom line 433 DeCA operates its Deli/Bakery/Seafood via contracts whereby DeCA does not directly negotiate COGS 434 Because DeCA is "cost-plus" any costs that are included in COGS are paid for by the patrons. This reduces the need for APF funding which would otherwise be required to cover these costs
224
Another potential challenge is the introduction of private label. Private label would be a
competitor to existing brands, and DeCA has received feedback in the past that manufacturers
would offer DeCA less support if it began offering private label.435 While private label does
present competition to some national brands, virtually all retailers have a private label offering
and still get substantial support from the national brands that they partner closely with. In
addition, private label would actually help DeCA during negotiations because DeCA would
then have a credible alternative to national brands in case national brands decide to reduce
presence at DeCA. So while the introduction of private label adds complexity to the COGS
opportunity, it should not be a barrier to capturing the value of COGS. Many private sector
grocers actively look to grow their private label but still maintain very close relationships with
manufacturers and receive substantial support from the manufacturers. That does not mean
that conversations with manufacturers will not be challenging at times, but we believe DeCA
can pursue both private label and COGS opportunities successfully. Similarly, we do not expect
that any of the other proposed changes to DeCA's business model (i.e., introduction of variable
pricing, category expansion, etc.) to have a negative impact on the industry support DeCA can
receive from partnering closely with vendors.
There are several key factors to a successful COGS negotiation. Determining sound
has invested in electronic price tags. These tags are unable to carry information regarding
promotional pricing, thus in many situations vendor stockers or DeCA employees visit shelves
to post prices in addition to the electronic tags. If DeCA's use of surcharge dollars was less
restricted, there might be better uses for the funds that are spent on these electronic price tags.
Of the five categories of surcharge spend (see Figure 10.5), all except for store maintenance
and repair would qualify as Capex. Therefore, to calculate a directional estimate for the
surcharge savings opportunity at DeCA, we benchmark DeCA's surcharge of 5% against the
annual capital expenditures of private sector grocers. We exclude from the benchmark $12.1M
of DeCA's surcharge budget which was spent in non-Capex categories (i.e., store maintenance
and repair).439 This makes DeCA's annual Capex budget approximately 4.8% of COGS. By
comparison, typical Capex spend for private sector grocers is about 3.3%. This 1.5% gap implies
a savings opportunity $70-100M based on DeCA's FY14 COGS of $5.6B (see Figure 10.6).
437 Booz Allen Hamilton Independent study of the Defense Commissary Agency Engineering Directorate 438 BCG experience with 60 grocery retailers in the last five years 439 $12M spend on store maintenance and repair is instead considered in the GNFR opportunity
229
Figure 10.6: DeCA Capex versus industry benchmark440
There are several reasons why the actual savings opportunity at DeCA may be higher than this
estimate:
Private sector retailers make significant Capex investments to build new stores to
expand their footprint. This is not a relevant expense for DeCA; thus, DeCA could
be expected to operate with lower than average Capex
Private sector retailers make significant Capex investments in their supply chain
and distribution centers. This is not a relevant expense for DeCA in CONUS; thus,
DeCA could be expected to operate with lower than average Capex
Some of DeCA's costs not included in the benchmark analysis may also be
considered Capex (i.e., above-store IT purchases) resulting in a artificially low
savings estimate
440 Industry benchmark based on publically available financial statements from 12 North American grocery chains (Publix, Harris Teeter, Village Supermarkets, Weis Markets, Ingles Markets, Kroger, Roundy's, Safeway, Tops, Winn-Dixie, SpartanNash, SUPERVALU)
CapEx benchmark v6.pptx 6Draft—for discussion only
Source: Capital IQ, Peer set includes Publix, Harris Teeter, Village Supermarkets, Weis Market, Ingles, Kroger, Roundy's, Safeway, Tops, Winn-Dixie, SpartanNash, Supervalu
230
On the other hand, there are some factors that could reduce the total size of this opportunity:
DeCA is subject to a number of statutes, regulations, executive orders and DoD
instructions which may limit its ability to execute Capex projects at the same cost as
private sector retailers
Some of DeCA sub-category level surcharge costs included in the benchmark
analysis may not be directly comparable to private sector Capex resulting in an
artificially high savings estimate
Since FY14 DeCA has made efforts to reduce Capex, so some of this opportunity
may already be captured
Since there are factors that both increase and decrease the potential size of this savings
opportunity, we feel that the estimate is directionally accurate and that this is a big opportunity
which DeCA should pursue if given the flexibility needed.
10.2.3. Roadmap
To enable improved investment decision making at DeCA, limitations on how DeCA can spend
the surcharge dollars would need to be removed. This approach would better align DeCA's
incentives to make only the highest ROI investments and would allow DeCA to capture the
benefit of any reduction in surcharge spend. Restrictions on DeCA's surcharge could be
removed in two ways:
With the introduction of variable pricing, the surcharge could be entirely eliminated.
This would allow DeCA full flexibility in how it prices goods and how it spends the
margin it earns on sales
Surcharge legislation could be maintained and adjusted to allow surcharge dollars to be
spent on operating costs to offset APF
In either case, the process for improved management of surcharge related expenses would be
similar. As a critical first step, DeCA would need to create a framework for how to evaluate all
proposed construction, maintenance and equipment investments based on clear tradeoffs and
total project ROI. An ROI approach would then drive all investment decisions going forward
and lower cost alternatives should be evaluated wherever possible (e.g., renovation instead of
replacement for stores). DeCA is currently in the process of reevaluating its construction
231
projects, which we expect to be a significant step forward. Adherence to a strict ROI process
and discipline in decision making would be important to sustaining savings over time.
Giving DeCA flexibility in its budget for store construction, maintenance and repair by
eliminating restrictions on the surcharge would also come with some risk. DeCA would
continue to need to make investments in stores to stay competitive with other grocers.
Investment needs will change over time. It is important that the budget for these expenses be
able to flex both up and down in order fill these needs. In particular, if DeCA goes too far
towards letting stores age without additional investment, it could cause problems in areas
where competition is increasing. To mitigate this risk, DeCA should continue to monitor store
conditions closely to ensure quality is maintained. The savings estimate presented here retains
a normal average Capex budget with the assumption that DeCA will continue to make
recurring investments in its infrastructure at levels similar to the private sector.
Figure 10.7: Summary of Surcharge next steps
Eliminate restrictions on how DeCA can spend surcharge funds
Create system and processes to track ROI of current and future construction,
maintenance and equipment investments
Establish framework to prioritize proposed construction, maintenance and equipment
investments based on ROI
Continue to monitor store conditions to keep stores competitive
232
10.3. Military Star card
10.3.1. Background
As part of its business portfolio, AAFES operates a credit card business called the Exchange
Credit Program (ECP). The ECP's offering includes two credit cards. The first card is the
Military Star card. For this card, AAFES / ECP manages the entire credit card value chain (i.e.,
payment acquirer / processor, payment network, and card issuer). This card can be used for
purchases at any of the three exchanges, but it is currently not authorized for use at DeCA.441
The second card is the Military Star Rewards MasterCard. This card is a co-branded card that
AAFES / ECP operates in partnership with Chase. This card has two lines of credit. The first is
funded by AAFES / ECP that is used to cover any purchases made at the three exchanges. The
second line of credit is funded by Chase for all purchases made outside of the exchanges. For
both cards, AAFES / ECP owns and generates profit on the receivable resulting from any
purchases made at the exchanges. For the purpose of this discussion, we will consider only the
line of credit that is associated with exchange purchases. We will also refer to both credit cards
together under the general term Military Star card.
The Military Star card generates revenue for AAFES in two ways. The first source of revenue is
merchant fees which is a standard practice in the credit card industry. AAFES / ECP takes a
small percentage fee on all purchases that are made at on-base concessions using the Military
Star card.442 The second source of revenue is finance revenue which is also a standard practice
in the credit card industry. AAFES / ECP captures revenue from the interest that cardholders
pay on outstanding balances. The Military Star card has an APR of 10.24% which is lower than
market rates and therefore offers cardholders a benefit over other credit card options.
Unlike most commercial credit cards, the Military Star card does not have any annual, over-the
limit or late payment fees. This is not typical of most cards in the industry, and is an additional
benefit to cardholders. In general, the Military Star card's value proposition to patrons is as a
card with low APR, no fees and select loyalty benefits.
441 The Treasury covers DeCA credit/debit card transactions such as MasterCard/Visa; however, the Treasury does not recognize private cards such as the Military Star card 442 Because concessions are also overseen by the exchanges, the exchanges can require that they all accept the Military Star card
233
The Military Star card also provides indirect financial benefits to the exchanges in the form of
avoided merchant fees and the potential for increased customer loyalty. Ordinarily, merchants
(like the exchanges) are required to pay credit card processors a fee of approximately 2% on all
debit and credit card purchases.443 By operating its own credit card, AAFES / ECP avoids these
fees on any purchases that are made with the Military Star card. Increased customer loyalty is a
second key benefit of a store credit card offering and is driven primarily though credit card
associated loyalty offerings. The Military Star card provides a 10% discount on all exchange
purchases on the day of opening an account, exclusive promotions, deployment benefits, and
free standard shipping on orders from the exchange website.
AAFES incurs costs to operate this business, namely interest associated with financing the
credit card receivable, debt that is never collected (bad debt), loyalty benefits, and personnel
and general operating expenses.
AAFES has separate agreements that allow the Military Star card to be used at both NEXCOM
and MCX. As part of this arrangement, Military Star card profits are partially allocated to
NEXCOM and MCX based on the number of accounts held by members in the different services
(i.e., NEXCOM earns profit proportional to the number of Navy Military Star card accounts).
10.3.2. Opportunity
We believe expanding the Military Star card to DeCA could benefit the U.S. Government
through avoided merchant fees. DeCA could benefit directly from expansion of the Military
Star card through increased charge volume and finance revenue. The exchanges would also
benefit from increased finance revenue. DeCA's customer base overlaps heavily with the
exchanges. Thus, many DeCA customers are likely already Military Star cardholders. The large
portion of existing cardholders could lead to very rapid adoption of the Military Star card for
DeCA purchases.
The Treasury covers the cost of all merchant fees for DeCA. Savings on merchant fees resulting
from the introduction of the Military Star card would thus not impact DeCA's APF requirement.
It would, however, generate savings for the U.S. Government more broadly. The average
penetration for the Military Star card at AAFES is approximately 18%, with CONUS main stores
often having even higher penetration. Assuming penetration for the Military Star card at DeCA
could reach 10%-20%, savings on merchant fees would be $10-25M (see Figure 10.8).444
Figure 10.8: Estimate of merchant fee savings to the U.S. Government following
expansion of the Military Star card to DeCA
Low High
Military Star card penetration rate 10% 20%
DeCA FY14 Sales ($M) 5,969
Est. DeCA purchase volume 597 1,194
Average merchant fee 2%
Merchant fee savings ($M) 12 24
Increased purchase volume on the Military Star card driven by purchases made at DeCA would
also increase overall finance revenue generated from the card (AAFES believes this opportunity
could be worth up to $47-93M).445 Depending on the agreement established between DeCA and
AAFES / ECP to expand use of the card, DeCA could share a portion of this benefit. Within the
profit sharing agreement between DeCA and AAFES / ECP, there will necessarily be a tradeoff
between using increased profits to drive AAFES MWR funding versus reduce DeCA's APF
requirement. Introduction of the Military Star card at DeCA also has the potential to increase
both patron loyalty and the overall penetration rate for the Military Star card at both DeCA and
the exchanges.
As a result of expanding the card, cardholders could make greater use of the Military Star card
benefits (i.e., reduced APR, no annual fees, no late fees, no over-the-limit fees and select in
store rewards). AAFES believes this opportunity could be worth up to $50-80M.
Depending on the agreement established between DeCA and AAFES / ECP, DeCA would likely
need to share the costs of expanding Military Star card usage. Costs associated with financing
the receivable, bad debt, loyalty costs and operational costs would all increase as the total
444 This estimate is sensitive to which customers switch to using the Military Star card. For this calculation we assume that customers are switching from using other credit cards (avg. interchange fee approximately 2%). However, if customers were switching from paying in debit cards or cash savings could be either higher or lower, respectively 445 It is important to recognize that this finance revenue would come directly from interest payments charged to military card holders; however, these balances would otherwise be likely to be carried on other cards which may charge fees or higher interest rates
235
purchase volume on the Military Star card increases. Additionally there will be one-time costs
associated with introducing the card including the cost of IT infrastructure to support use of the
card. Nevertheless, we feel that the financial upside from expanding the card outweighs these
costs.
10.3.3. Roadmap
To roll-out the Military Star card in Implementation Phase I, DeCA would first need to secure
permission from the Treasury to accept the card. DeCA and AAFES / ECP would then need to
negotiate a profit sharing model to define how Military Star card profits would be allocated to
DeCA. DeCA would also need to designate a liaison or a manager to manage the Military Star
card relationship with AAFES / ECP and to troubleshoot any issues which may arise
surrounding the use of the card at DeCA.
Once this is complete, AAFES / ECP and DeCA would need to work to integrate DeCA's POS
with the Military Star card IT infrastructure so that payments made at DeCA using the Military
Star card can be processed. POS integration should not present a major hurdle given the
experience AAFES / ECP has integrating with POS systems from the other exchanges and
concessions. Once POS integration is complete, DeCA and AAFES / ECP would be prepared to
introduce the card and grow usage at DeCA.
Figure 10.9: Summary of Military Star card next steps
Secure permission from the Treasury to accept the Military Star at DeCA
Designate a liaison at DeCA to manage Military Star card relationship with AAFES /
ECP
Negotiate terms for profit sharing and implementation cost sharing with AAFES / ECP
Integrate DeCA POS with AAFES / ECP IT to enable processing of DeCA purchases
made on the Military Star card
Communicate expansion of Military Star card to cardholders and DeCA patrons
236
10.4. Store hours
10.4.1. Background
Under its current operating model, DeCA's variable costs exceed its variable margins (i.e.,
5% surcharge). As a result, DeCA's incremental sales create the need for additional APF.
However, applying the levers in this study could progress DeCA to a point where it is
generating positive contribution margins with each sale.446 In this scenario, DeCA could
consider other opportunities to increase sales as a way to reduce the need for APF. One way
to increase sales would be increasing the number of days and hours that some of DeCA's
top performing stores are open.
In recent years, DeCA has faced cost pressures. In response, DeCA has proposed reducing costs
by decreasing the number of days and hours its stores are open.447 This reduces in-store labor
costs DeCA incurs and helps DeCA manage its APF needs. The number of days DeCA's stores
are open per week varies significantly, with 15% open 5 days; 51% open 6 days; and 34% open 7
days448 (which we will reference as "5 days stores", "6 days stores", and "7 days stores" for the
remainder of this section). DeCA stores are open 56 hours per week on average, compared to 134
in the private sector.449
446 Contribution margins are revenue less variable cost 447 Recently, DeCA has proposed reducing APF by reducing store days and hours. However, the reduction proposed from the RMD study Part I has not been fully implemented. The FY16 budget includes a reduction of store hours; Congress may choose to restore funding as was done in FY15 448 Based on analysis of DeCA data from 169 CONUS stores 449 Average open hours for grocery stores >20,000 sq ft (Source: http://www.energystar.gov/ia/business/tools_resources/target_finder/help/Space_Use_Information__Supermarket_Grocery_Store.htm) – sample includes 24 hour and non 24 hour stores-hour stores
237
10.4.2. Opportunity
After DeCA begins to generate positive contribution margins, extending days and / or hours in
some of DeCA's top performing stores could be a win-win for both patrons and DeCA.
Assuming DeCA successfully executes the savings levers contained in this study to reach
profitability, expanding store days / hours could have a number of benefits:
Enhance the patron experience with increased convenience
Increase store traffic, which could help underperforming stores achieve scale benefits450
Further reduce DeCA's APF requirement
Marginal impact to APF at first, but grows as DeCA increases profitability
10.4.2.1 Days of service
Our analysis suggests that extending the number of days DeCA is open could increase sales.
DeCA's stores generate relatively consistent sales levels across weekdays with peaks on the
weekends. This suggests that there would be demand from patrons to shop on all days
(consistent with the broader grocery market). In addition, 7 days stores average higher sales per
day than 6 day stores (see Figure 10.10).
Our analyses also suggest that a number of 6 days stores have similar average daily sales and
serve as similar number of patrons as some 7 days stores.451 Therefore, there is likely an
opportunity to open these 6 days stores an additional day and generate sales similar to the 7
days stores. Under a profitable business model, converting the 6 days stores that serve over
50,000 patrons could generate up to $200M in additional revenue (see Figure 10.11).452
450 Patron survey reveals price and location as leading patron concern, but also highlights that improvements to store hours and merchandising can grow patron share of wallet 451 Assumes a 10 miles radius and includes both sponsor and dependent figures 452 Based on sales data provided for 155 CONUS stores for March 2015; figures based on the product of the avg. sales per week day and avg. sales per weekend day for 7 days stores that are local to 75,000+ patrons
238
Figure 10.10: Analysis of sales by day and patron base
Figure 10.11: Potential additional earnings from expansion of days
Description StoresAvg. sales/weekday
Avg. sales/weekend day
Total sales Net new sales
6 days stores serving 50-75K
patrons5 - 15
~$90K ~$100K
$160 - 500M $20 - 70M
6 days stores serving 75K+
patrons15 - 30 $500 -1000M $70 - 130M
Total $600 -1,500M $90 - 200M
# of stores converted
depends on the success of pilot efforts
261 days 104 daysN x sales per
day x days
N x sales per
week day x 52
239
10.4.2.2 Store hours
Similarly, we believe that DeCA can add to the impact of increasing store days by extending
store hours. Patron survey results and analysis of historical sales volumes show a strong
presence of DeCA patrons that already shop or would shop more during the hours outside of
traditional working hours.453 Currently, more than 20% of total daily revenue is earned during
the first two hours and last two hours of each day
(see Figure 10.12). This suggests that there is
demand from patrons to shop early and late in the
day (i.e., before 0900 and after 2000). Additionally,
patron survey data and comments suggest that
DeCA's patrons might increase their spending at the
commissary, shifting away from competitors, if
hours were extended.
Figure 10.12: Summary of sales within first and last two hours of operations454
453 More than 31% of visits occur before 11AM and 15% of visits occur after 5PM. This observation suggests a strong demand during shoulder hours; May 2015 BCG patron survey, unweighted N = 13,065 454 Based on analysis of 154 CONUS stores using data provided from DeCA
240
Excluding Monday, the percentage of sales for the two hours before closing is more than 10% of
the average sales per day (see Figure 10.13).455 Moreover, sales traffic spikes significantly in the
final hour of business for both the day before and the day after a store's closed day. This buying
behavior could reflect diverse qualitative impacts such as patrons' attempts to avoid out-of-
stocks. There could be related opportunities to adjust store hours to reflect the realities of
DeCA's unique patron base (pay day volumes) and the fact that DeCA has closed days. For
example, DeCA might be able to increase revenue effectively by extending hours specifically on
days before and after closed days or after pay days.
Sales during shoulder hours (i.e., hours immediately after stores open and before stores close)
are particularly pronounced when viewed in the context of sales throughout the course of a
day. While sales are fairly constant during typical operating hours, there is a significant ramp
up at the beginning of the day and a slow decline near the end of the day. This further suggests
the potential for extending store hours to cater to patron demand (see Figure 10.13).
Figure 10.13: Sales by hour and day as % of daily total
455 Monday excluded to normalize data analyzed (many stores closed on Monday)
Significant percentage of sales occur near start and end of day
241
According to the survey on patron satisfaction, convenience is a key factor in patrons' decision
to shop at the commissaries. Survey results show that 77% of current patrons view DeCA's store
hours the same or worse than market competitors. Additionally, 91% of eligible patrons that are
non-users view DeCA's store hours as the same or worse. Therefore, we believe, DeCA could
increase patron satisfaction with these store hour levers, resulting in increased share of wallet.
10.4.3. Roadmap
Figure 10.14: Extending store days and hours roadmap
Before moving forward with any change to store days or hours, DeCA needs to have improved
its economics to the point that incremental sales generate positive contribution margin.
Therefore, in the Planning Phase and Implementation Phase I of the overall transformation
agenda, DeCA should focus on the other levers laid out in this study. We believe that some
DeCA stores could achieve marginal profitability by Implementation Phase II. At that point,
DeCA should evaluate labor costs required to extend days / hours to understand the expected
incremental margin.
We suggest that DeCA take a "test-and-learn" approach to changing store days and hours. For
example, if DeCA expands hours in a sample of stores but does not see any increase in sales
(which we believe is unlikely), further rolling out increased hours might not be practical. Using
this approach would mitigate risk to DeCA and is incorporated to the figure above.
242
Related to the above roadmap, we have included milestones for extending DeCA's hours of
operations in Figure 10.15.
Figure 10.15: Summary of adjusting store hours next steps
Confirm the stores generate sufficient contribution margin to support new traffic
Analyze sales for the two hours following opening and preceding closing for candidate
stores to verify attractiveness of the opportunity
If attractive, formulate strategy for expanding hours (i.e., days, hours)
Design pilot plan (e.g., success measures, schedule, communications plan, staffing)
Launch pilot across sample of candidates
If successful, roll out effort to remaining candidates
243
10.5. Store labor / store operations
10.5.1. Background
Commissaries require similar store-level operating activities as private sector grocery stores.
Some examples of these activities are:
Unloading incoming inventory from suppliers and placing items on the shelves
Cutting and packaging meat and seafood
Preparing fresh deli options
Guiding customers through the shopping and payment process
Managing inventory levels and reordering product
Cleaning the store selling and backroom areas
Overseeing the whole process to ensure a quality customer experience
While the activities are the same, DeCA takes a very different approach to managing and
executing these activities than private sector grocers.
DeCA's status as an appropriated fund (APF) activity imposes various limitations on workforce
management. DeCA's wage rates are set by the Office of Personnel Management (OPM)
through General Schedule (GS) pay scales and tend to be higher than both the equivalent
nonappropriated fund (NAF)456 and private market wage rates by approximately 20%.457 DeCA
also has limited capability to terminate employees, alter their full-time or part-time status, or
adjust their hours worked per week.458 Furthermore, recent budgetary pressures in DoD have
forced DeCA to operate within a 90% employee ceiling.459 Given these challenges in labor
management, DeCA's operating model differs from a standard private sector grocer in a
number of ways:
Higher labor cost per FTE460 due to wage and benefit requirements461
Heavy use of third-parties462 to complete in-store activities
Limited store-level autonomy to manage labor
456 Non-appropriated fund activities are DoD entities are not primarily funded by Congressionally appropriated funds and operate under a different, more lenient set of workforce management and contracting rules 457 Source: NEX and DeCA employee data; NAF wage survey 458 Source: Store director interviews 459 Source: Interview with DeCA HR and Resource Management teams 460 Full-time equivalent (e.g., a 20-hour work week corresponds to 0.5 FTEs) 461 Discussed in detail in Section 6: NAF Conversion 462 Includes contractors and vendor stockers
244
As a result of these differences, third parties comprise approximately 23% of DeCA's in-store
labor spend (see Figure 10.16).
Figure 10.16: DeCA in-store labor costs
Category FY 2014 cost Percent of total
labor cost
US payroll $564M 71%
Local national payroll $51M 6%
Shelf-stocking contractors $65M 8%
Vendor stockers463 $30M 4%
Custodial contractors $59M 8%
Receiving, storage, and holding contractors $22M 3%
Other contractors $1M 0%
TOTAL $790M
In addition, DeCA uses contract labor to run the entire deli / bakery and seafood departments
at most stores. Utilizing third-party labor in such proportions is rare in private sector grocers.
However, given DeCA's unique business model (driven by APF guidelines and cost-plus
approach), DeCA has a clear rationale to do so. DeCA's relatively inflexible labor model creates
incentives to outsource activities wherever practical either to shift costs to COGS and therefore
patrons, or to retain flexibility. From a scheduling perspective, contractors have more ability to
flex their workforce up and down to meet peak demand periods, while the DeCA hiring process
is often slow and inflexible.464
In DeCA's current environment, third-party labor is often financially beneficial as well. Third-
party labor rates are generally cheaper than the GS wage rates (discussed in further detail
below), and some third-party costs can be included in COGS (e.g., vendor stocking) and not
impact APF requirements.
However, contractor and vendor labor can also negatively impact the customer experience.
DeCA has had difficulty getting consistent performance from third-party labor in the past.465
463 Estimated vendor stocking cost assumes volume equal to the contractor case stocking volume and rate per case of $0.35 464 Source: Store director interviews 465 Store director interviews
245
DeCA's contracting rules leave few avenues for quick recourse if a contractor or vendor
underperforms. For example, a DeCA deli / bakery contractor started underperforming in
January 2015, but it took until April to finally terminate the vendor as DeCA navigated the
lengthy process of notifying the contractor, allowing the contractor time to respond and rectify
the issue, and eventually terminating the contract. DeCA then needed to onboard a new
contractor, which took further time and caused additional disruption in the patron shopping
experience.466
For the set of activities that does not involve contractors, the CLASS system governs hiring
targets, allocating workers to each location and role. DeCA developed the CLASS system in
2009 to establish a consistent benchmark of service levels worldwide and ensure proper
distribution of labor resources across stores. First, 70 store level experts mapped out roughly
3,000 tasks that support over 220 processes in-store and established standard service levels for
each process. Then, Resource Management conducted time measurements in a sample of
stores to understand the FTE requirements necessary to reach desired service levels. The end
output is an authorized set of FTEs by position for each store, which is updated as needed.
Overall, the CLASS system does a good job determining the labor needs for individual stores.
The methodology is logical and rigorous in how it builds bottoms-up estimates of labor needs.
The system is generally well-received by store directors, and the estimated FTE requirements
display scale similar to what we see in private sector grocers (see Figure 10.17).
466 Interviews with DeCA merchandising and contract teams; http://www.militarytimes.com/story/military/benefits/on-base/2015/03/06/delis-bakeries-close-commissaries/24446081/
246
Figure 10.17: CLASS model FTEs by store sales
However, under the right circumstances, there could still be opportunities to reduce costs and
improve the patron experience. Benchmarking DeCA's all-in labor costs467 suggests that DeCA's
in-store labor spend is at the high end of private sector grocers (11% of adjusted sales versus 8-
12% range in the private sector).468 Furthermore, the stocking issues noted before suggest room
to improve upon the customer experience. Though not exhaustive, we see three key areas of
opportunity for DeCA to reduce in-store labor costs and enhance execution:
1. In-source469 third party labor
2. Adjust DeCA's part-time labor mix
3. Reduce variability in labor cost between stores
These initiatives only make sense if DeCA changes its operating model. All of the savings levers
require converting to NAF. In addition, variable pricing is necessary to enable in-sourcing
vendor stocking. Furthermore, in order to manage a larger workforce, DeCA would have to
operate with more agile labor processes and attract talent competitive with private sector
grocers to provide a quality customer experience.
467 Includes associated contractor and vendor stocking spend 468 Grocery benchmarks based on BCG experience working with 68 grocery retailers and wholesalers in the last five years; "Adjusted sales" includes adjustments for discount (estimated at 20%), contractor labor, vendor stocking, and deli/bakery and seafood 469 In-source refers to replacing third party employees with DeCA employees
247
10.5.2. Opportunity
10.5.2.1 In-sourcing third-party labor
While the heavy use of third-party labor likely makes sense for DeCA in the current APF
environment, there is strong logic to move towards a DeCA-managed workforce after NAF
conversion. The economics of DeCA employees would improve under a NAF wage and benefit
structure, allowing DeCA to reduce costs while improving the customer experience. Our
analysis suggests DeCA could consider in-sourcing the following activities:
Contractor and vendor stocking
Deli / bakery and seafood management
Custodial work and receiving, storage, and holding (to further analyze)
Shelf-stocking costs comprise the largest portion of DeCA's third-party labor spend and present
the greatest savings opportunity. That being said, there are multiple ways DeCA can reduce
cost from today's baseline.
DeCA stores pay a wide range of case rates470 for contractor stocking today. Case rates vary by
over 20%, and the variance does not appear to be correlated with household (HH) income in
the area, a proxy for local wage rates (see Figure 10.18 and Figure 10.19).
470 Amount paid to contractor for each case stocked on the shelf
248
Figure 10.18: Range of case rates versus cases picked471
Figure 10.19: Range of case rates versus HH Income472
471 Volume correlated with case rate (a 1M increase in volume correlated with $0.19 reduction in case rate), but explains small portion of the total variance (R2 = .13) 472 Avg. HH Income calculated by taking the household-weighted average median zip code income for zip codes where an individual commissary was the closest commissary; coefficient of variation not statistically significant and R2 = 0
0.0
0.5
1.0
1.5
2.0
0 25,000 50,000 75,000 100,000 125,000
Avg. HH Income ($)
Cost per case ($)
249
This variance suggests DeCA can likely negotiate better terms with existing contractors and
move towards a more consistent rate across stores. Shifting all stores currently above the $0.79
per case median to the median level would drive $4M in annual savings. Since many
contractors are used across geographies and contracts are negotiated centrally, accomplishing
the majority of these savings is likely feasible.
Furthermore, the fully loaded cost of an average contractor stocker (including overhead and
other costs) is more than $50,000 per year (see Figure 10.20). For more expensive locations, the
cost of contractor stocker would be higher and likely exceed the all-in cost of adding a DeCA
store worker (with associated management costs).473
Figure 10.20: Median contractor salary
To size the total opportunity, we need to estimate the all-in cost of in-sourcing these contractor
activities. On the low end, DeCA may be able to in-source the activities with non-benefitted
store workers at NAF wage levels and repurposed QAE's to manage these new employees as
necessary. On the high end, DeCA could offer these employees full benefits and add some
additional managers to the store. Either way, the average all-in cost would likely be in the
range of $23,000 - $44,000 per year (see Figure 10.21).
473 Cost with benefits of roughly $49,000; including management oversight could further increase the potential cost to over $50,000
Median contractor
Rate
$0.79 per case
Cases stocked per hour
35
Hourly rate
$27.65
Hours per year
1,776 – 2,080
Implied annual salary
$49,000-56,000
250
Figure 10.21: Potential all-in cost for in-sourcing a contractor stocker
Low High
Avg. Salary for NAF stocker Cost of NEX store worker Cost of NEX store worker
$23,000 $23,000
Benefits for NAF stocker No benefits 30% of salary
$0 $7,000
Additional administrative support
Fully covered by existing managers / QAEs
1 new manager ($50,000 salary) per 4 in-sourced FTEs
$0 $14,000
TOTAL $23,000 $44,000
Looking across all current DeCA stores, we see that a large portion currently pay contractor
rates exceeding the range outlined above. Depending on the actual all-in cost for the in-sourced
employee, DeCA could like save approximately $15-35M from in-sourcing contractor stockers
(sensitivity shown in Figure 10.22). Though in-sourcing may require some additional training
and recruitment costs, we assume the current HR team could likely complete these activities
with minimal incremental hiring need.
Figure 10.22: Sensitivity table for in-sourcing stockers
251
DeCA should also consider in-sourcing vendor stockers. Currently, DeCA receives $30M of
vendor stocking activities each year (roughly 85M cases per year at $0.35 per case) which is
passed through to patrons as part of COGS.474 At current wage rates, an equivalent DeCA store
worker would cost roughly twice as much as a vendor stocker.475 Therefore, in the current APF
environment, shifting from vendor stockers to DeCA associates would not be a financially
sound decision.476 In a NAF environment with variable pricing, however, shifting away from
vendor stockers may be worth evaluating. At NAF wage rates, DeCA labor would cost a similar
amount to the prevailing vendor stocker rates. As such, in-sourcing could be financially neutral.
Incorporating the hidden costs of DeCA employees finishing tasks that the vendor stockers do
not complete today, the net financial impact could be more favorable.477
Beyond the financial incentive, shifting all shelf-stocking responsibility to DeCA employees
should improve the overall customer experience. When interviewed, store directors frequently
mentioned difficulties with vendor stockers' performance. The vendor stockers are paid based
on what arrives in the store (not what is placed on the shelf), so they are not properly incented
to meet quality standards. Furthermore, the store director has little recourse to ensure proper
and timely execution. This struggle manifests itself through out-of-stocks and poorly managed
endcaps, which are more common at DeCA than nearby private sector grocers (see Figure
10.23). Moving towards a DeCA-managed
workforce would give store directors greater
ability to manage stockers and allocate their
activities (across the store and shifts) to ensure
necessary quality standards.
474 MCRMC team conducted selective vendor interviews suggesting while some may provide this benefit for free, many pass through the expense at cost or even at a premium 475 Assume $48,000 all in salary and benefits cost, 35 case per hour productivity, and 2,080 hours per week 476 The in-sourced labor would cost $57M, $27M more than the current rates, and the full expense would be charged to APF (instead of being passed through COGS). There could also be some additional costs for increased manager capacity 477 The risk of increased labor cost is likely overstated. DeCA already estimates that the equivalent of 143 FTEs is expended each year re-doing tasks not completed by the vendor stockers ($7M of cost)
252
Figure 10.23: Endcap from commissary in southern US478
Though in-sourcing presents a win-win opportunity for DeCA's APF requirement and patrons, it
would potentially impact DeCA's contractors. Both DeCA and the exchanges support Federal
socio-economic programs, an example of which is the AbilityOne program which provides
employment opportunities for the blind and the severely disabled. These programs align with
public policy goals by supporting disadvantaged people and businesses. Any reduction in the
use of contractors would negatively impact these stakeholders, and this impact should be
considered in any decision.
A final opportunity to evaluate is deli / bakery. Today, DeCA offers deli / bakery and seafood
products primarily through contractors. Except in a small number of locations (e.g., Europe), a
third-party contractor supplies the materials and employees to operate these departments, and
DeCA earns the 5% surcharge for each sale. In return, DeCA allows the contractors to use the
commissary space rent-free and keep the revenues, allowing for any incremental earnings
above the cost of goods sold and labor to be retained as profit. In-sourcing deli / bakery and
478 Ft. Benning commissary visit in April 2015
253
seafood services presents an opportunity for DeCA to enhance patron benefit (through
increased discount) and reduce the need for appropriations by capturing this profit.479
The key driver of savings is how much profit deli / bakery and seafood contractors are
generating today. As for-profit entities, these companies are clearly generating revenue that
exceeds costs, and many exist solely to serve the military resale system. Therefore, a
conservative estimate would be 2-5%. Assuming DeCA converts to a NAFI and can hire
employees at similar wages, DeCA could run these departments at similar price levels and use
the profit to reduce the need for APF. Even at these modest margin levels, this margin could be
worth at least $5-10M annually.480 The margin opportunity could be even greater should DeCA
decide to raise overall prices in these enhancement categories as part of its overall pricing
strategy.
Furthermore, in-sourcing the deli / bakery would help DeCA build internal capabilities in
prepared foods. The expansion of prepared food offerings is a major trend in private sector
grocers (see Figure 10.24), serving as an important category that drives traffic into the store. By
in-sourcing the deli / bakery, DeCA will be able to better capitalize on this trend if it becomes a
strategic priority and DeCA sees demand from patrons.
479 It should be noted that the profit level seen by contractors is already decreasing due to recent changes in DeCA's contracting policy. Historically, deli / bakery contractors were required to hit a 20% discount for a core set of 10 items. Beyond that subset of products, the contractor could charge anywhere between 1-20% discount from nearby grocers. The only way to track discount was by the store director going mystery shopping nearby. Now, contractors bid on the discount for all products offered, each at a minimum 13% discount. That being said, moving completely away from contractor-operated departments will drive further patron benefit and contribute to DeCA's reduction in appropriated funds 480 Some remote stores may not be profitable (and likely are not today), but the overall deli / bakery segment could achieve these margins across the full set of commissaries
254
Figure 10.24: Growth in fresh prepared foods481
Beyond potential cost savings, in-sourcing third-party labor provides a host of operational
benefits for DeCA. First, completing more activities with DeCA workers would greatly reduce
the complexity of in-store management. Today there are roughly 320 contractor monitors
throughout the DeCA system who manage the contractors. By shifting to a self-managed
workforce, these managers could be redeployed throughout the rest of the store to manage
DeCA's associates, all under the purview of the store director. Second, moving towards a self-
managed workforce would likely result in increased quality control and an enhanced customer
experience. This improvement in customer satisfaction should result in increased sales and
therefore increased patron benefit (in conjunction with other initiatives). Finally, this reduced
complexity may even allow DeCA to rethink their store design. Currently stores require a large
amount of backroom space to stage pallets from multiple third party stockers (46% of DeCA's
square footage is selling space versus 70% in other private sector grocers). By reducing the
backroom, DeCA can potentially expand floor selling space, which could have a big positive
impact on both patrons as well as DeCA's economics.
481 Source: Technomic and AT Kearney, "Fresh Prepared Foods: Cracking the code for U.S. Retailers"
255
10.5.2.2 Labor mix adjustment
Grocery retailers typically hire primarily part-time workers to fill their in-store labor needs.
Part-time workers command a lower wage rate, require fewer or no benefits, and are more
flexible to schedule throughout the week. As a result, private sector grocers generally target
hiring 70-75% of their workforce as part-time. DeCA currently has 63% of its workforce in a part-
time role. Several factors contribute to this model. First, with a 90% hiring freeze, DeCA store
directors are forced to increase labor hours of part-time employees to meet labor demands and
convert many employees to full-time status. Second, DeCA's APF structure and current
collective bargaining agreement apply pressure to keep a significant full-time mix. Finally, APF
employees are required to receive benefits, so even low-hours, part-time employees receive
proportional benefit packages.
Once DeCA begins transitioning towards a NAF workforce, it may make more sense to mirror
the employee mix seen in the private sector and at the exchanges. By shifting 5-10% of full-time
workers to part-time and bringing DeCA more in-line with benchmarks, DeCA could save $3-9M
through effective wage reduction (as part-time employees are paid 10-15% less than equivalent
full-time employees). Furthermore, shifting 15-30% of part-time workers (about 30% work fewer
than 30 hours per week) to a non-benefitted status could save an additional $8-16M.482 All in all,
these adjustments have the potential to reduced DeCA's costs by roughly $10-25M when fully
implemented.
However, these changes would likely have a negative impact on the current employee base.
Similar to other wage and benefit changes, DeCA should manage these adjustments through
attrition where feasible to minimize adverse impact on current employees. Furthermore, when
coupled with the broader "in-sourcing" opportunities, DeCA would ultimately be able to
employ a greater number of individuals, including military family members, and provide
greater opportunity for these employees to build new skills (e.g., deli / bakery management). So
while the impact on employees needs to be carefully considered before moving forward, DeCA
has some levers to mitigate the downside impact to employees while reducing the need for
appropriated funds.
482 These savings are incremental to the reduction in benefits rates from transitioning to NAF
256
10.5.2.3 Variability of store labor costs
As mentioned, DeCA's current labor model does many things well. DeCA's overall in-store
labor costs are within the range of industry benchmarks, albeit on the higher end, and overall
costs scale as we would expect. That being said, DeCA exhibits a wide range of labor cost as a
percentage of sales. In fact, many stores are more than 15% above expected costs (see Figure
10.25).
Figure 10.25 Distribution of labor costs as a percentage of sales483
Some of this variation could be explained by extraneous factors (e.g., local wage rate), but some
are difficult to explain. For example, in the pair of stores below in Figure 10.26, the Langley
commissary is roughly the same size as the Fort Bragg commissary, with fewer store hours and
sales. Nevertheless, it spends nearly double what the Fort Bragg commissary spends on
contractor costs.
483 1. Ln(Labor as % of sales) = 4.04 - .35ln(Sales); R2 = .87 Note: Only includes 169 CONUS stores that have contract data available Source: DeCA store data
257
Figure 10.26: Comparison of two similar commissaries
When re-thinking DeCA's approach to labor in a NAF environment, it would be important to
re-examine the in-store staffing model and processes. Looking at similar store pairs, such as
these, can help identify root causes of high cost stores. In addition, a comprehensive approach
would look at all of the key labor processes, including the new DeCA-managed departments
such as the deli, and examine their execution along a number of dimensions (e.g., across stores,
by time of day) to look for opportunities to enhance efficiency. In our private sector experience,
we generally see 5-10% savings opportunities from such efforts and believe DeCA could
potentially see similar results.
20150415 Store Labor Updated Storyv5notes.pptx 13Draft—for discussion only
Based on our assessment, we believe there is opportunity to save 7-12% on DeCA's addressable
GNFR spend ($134M) for potential savings of $10-15M.485 As an APF entity, DeCA faces
contracting restrictions that may limit its ability to renegotiate prices as effectively and as
quickly as the private sector does. 486 To account for these policies, our estimates have been
kept relatively conservative compared to savings we have observed working with private sector
clients. Given the uncertainty around the timeline for savings, we have also excluded GNFR
savings from our APF savings summary. GNFR savings are nevertheless worth pursuing.
Should DeCA become a NAFI, DeCA would no longer be subject to FAR and DFARS and, as a
result, DeCA's GNFR savings opportunity could be even larger than our initial conservative
savings estimate. The process for pursuing the GNFR savings opportunity would be the same
regardless of whether DeCA operates as an APF or NAF.
10.6.3. Roadmap
In other GNFR efforts that we have supported, our clients have achieved the greatest results by
executing in sequenced waves that focus on a few categories at a time. Implementing in waves
enables focusing attention on a manageable number of categories at a time and leveraging
lessons learned from each wave. DeCA would be able to pursue this opportunity with limited
upfront preparation and without any legislative change. See Figure 10.31 for a summary of the
suggested roadmap.
485 Note that we have rounded to nearest multiple of 5 in order to avoid false precision 486 For additional context on contracting regulations, refer to Sections 6.1.3 and 6.2.1.3
263
Figure 10.31: Summary of implementation roadmap for GNFR
Before beginning implementation, DeCA should set up an implementation team487 and conduct
some basic preparation to facilitate the savings effort in subsequent waves. First, the
implementation team should collect basic facts around the current level of GNFR spend. This
analysis should provide an overall understanding of annual GNFR spend segmented by expense
category (e.g., plastic bags) and vendor. Based on this analysis, the team could then develop a
prioritized list of categories to pursue in each wave. Next, the team should identify the internal
requirements in each category. It is imperative to understand the specifics of demand for each
good and service, such as volume, quality, and service level, before entering the sourcing
process. Finally, the team should also investigate the procurement process and organizational
structure (including responsibilities and decision rights) for each category. With a stronger
understanding of the internal operating model, stakeholders can better coordinate and develop
a logical category strategy. These preparatory steps could ease the capture of savings in the
execution phase by clarifying the strategic context for each category.
487 In our experience (77 GNFR projects in the last five years), GNFR implementation teams typically consist of a team leader and one analyst per 1-2 categories in each wave
264
Although the details of the sourcing process would differ by category, an effective GNFR
process follows the same basic steps. First, the team should identify all potential suppliers that
meet minimum requirements. Next, the team should conduct an RFP process, which involves
sharing the required specifications with the suppliers and requesting a proposal concerning a
particular contract.488 Based on the outcome of the RFP, the team should select suppliers for
negotiation. Before entering the negotiation process, the team should align on supplier
negotiation strategy and develop negotiation templates. After conducting negotiations, the
team should select supplier(s), sign contracts, and measure the savings achieved. To minimize
transition costs and risks to continuity of supply, the team should evaluate vendors for not only
the prices they offer but also their overall ability to support the transition for DeCA. Finally, the
team should establish a savings tracking mechanism to sustain achieved savings in the long-
term.
In the sourcing process, DeCA could consider using some of the levers that typically generate
the most savings in the private sector. These levers include bundling, product and service
redesign, and supplier management. Bundling entails aggregating purchases that are currently
negotiated separately to create greater scale and enhanced opportunity for partnership.
Product and service redesign requires a review of the current specifications and revision to
minimize cost without compromising key requirements. This process could also imply redesign
of the demand management process. For example, DeCA could review the level of current
usage of janitorial services, conclude that commissaries could operate as efficiently with a
significantly reduced level of janitorial support, and renegotiate based on this updated
specification. Supplier management involves systematically reviewing supplier base and
collaborating with suppliers to improve performance.
Figure 10.32: Summary of GNFR next steps
Establish leadership, timeline and process for GNFR negotiations
Develop a financial baseline for GNFR, segmented by specific expense category (e.g.,
plastic bags) and vendor
Develop a prioritized list of expense categories to pursue in each wave of negotiations
Define internal requirements, such as specifications, volume, and quality
488 Request for Proposal
265
Define negotiation strategy, including savings levers and sourcing tactics
Execute the RFP process and conduct face-to-face negotiations
Track savings and regularly review contracts in the long-term
266
10.7. Patron base expansion
10.7.1. Background
As discussed earlier, DeCA's variable costs exceed its variable margins (i.e., 5% surcharge).
As a result, each incremental sale has a negative contribution margin and creates a greater
need for APF. However, applying the various levers in this study has the potential to enable
DeCA to reach the point where its incremental sales generate positive margins. In this
scenario, DeCA would be able to further reduce the need for APF by growing sales. One
such opportunity is the expansion of its patron base.
DeCA is currently authorized to serve 5.3M patron households, including:
Active duty servicemembers
Guard and Reserve members
Military retirees
Medal of Honor recipients
100% disabled veterans
Authorized family members
DoD's planned troop drawdown is likely to contribute to a decrease in the number of eligible
DeCA patrons. Specifically, the number of active duty, guard, and reserve members in the
Army and Marines is projected to drop by roughly 57,000 by 2019, which could reduce DeCA
sales by roughly 2% (about $65M).489, 490 The Department of Veterans Affairs also projects that
the number of veterans will continually decline over the coming years.491 If DeCA is able to
reach a point where it generates positive margin on sales, a loss in eligible patrons could result
in additional need for APF. Expanding the patron base could help DeCA compensate for the
impending decline in eligible patrons.
489 Based on DoD FY16 President's Budget Request; troop drawdown includes reductions to Army active duty (about 40,000), Army National Guard (about 15,000), and active duty Marine Corps (about 2,000); if DoD returns to FY11 levels, servicemember reductions could increase to approximately 115,000 490 Based on DeCA FY14 average sales per patron household 491 See page 2 of http://www.va.gov/vetdata/docs/quickfacts/Population_slideshow.pdf
267
Today 90% of all veterans lack access to DeCA stores.492 This includes roughly 22M veterans
that were honorably discharged from service with less than 20 years of tenure and a disability
rating below 100%. In addition, veterans continuing to serve in the Executive Branch and
civilians on CONUS bases cannot shop at the commissaries.
10.7.2. Opportunity
If DeCA is able to generate a positive margin on sales, expanding the patron base could be a
way to further advance DeCA's mission without disrupting its economics. Assuming DeCA's
successful execution of levers contained in this study to reach profitability, expanding the
patron base could have a number of benefits:
Provide the benefits of shopping at DeCA to a broader audience
Increase store traffic, which could help underperforming stores achieve scale
benefits493
Further reduce DeCA's APF requirement
Marginal impact to APF at first, but increases as DeCA increases profitability
Grow sense of community across veterans and military support functions
There is a large population affiliated with the military that is currently not authorized to shop
at DeCA. Two potential examples to consider for testing patron expansion include veterans
employed at Executive Branch Agencies and Federal civilian employees on CONUS bases.
These patron segments present an opportunity to test the feasibility of serving a larger military-
affiliated population. The addition of these example patron segments would grow the base of
eligible patrons by 1.3M households to 6.6M total (see Figure 10.33). Successfully serving these
patrons would provide DeCA a proof-of-concept and valuable lessons learned if DeCA should
ever wish to expand eligibility more broadly.
492 Based on data from 2014 AAFES proposal to provide honorably discharged veterans with online shopping access 493 Patron survey reveals price and location as leading patron concern, but also highlights that improvements to store hours and merchandising can grow SOW with patrons
268
Figure 10.33: Patron segments for consideration
Households Patron segments Rationale
607,000 Veterans at Executive
Branch Agencies
Extend benefits to the broader military servicemember
community
Integrate pre-screened, low-risk patrons
Reward veterans for continued support of Agency
missions
690,000
Federal civilian
employees on CONUS
bases
Benefit personnel aiding military readiness, recruitment,
and retention
Take advantage of existing on-base patron traffic
Provide employee perks to DeCA employees to raise job
satisfaction
Before expanding eligibility to any patron segments, DeCA should complete further analysis to
determine the right mix of veterans for inclusion and develop a clear business case for
expansion. The business case should include criteria for evaluating patron segments for
inclusion; costs of identifying and providing access to veterans that are not currently authorized
on bases; clear mission / business rationale; and a study of the impact of patron expansion on
private sector competitors. Moreover, DeCA and DoD should thoroughly assess how expanding
eligibility to one group of veterans could impact any excluded groups.
DeCA should consider the impact of expanding its patron base on its business economics. DeCA
should perform an analysis to understand the cost and challenges of identifying and enabling
commissary access to veterans that are not currently authorized on base. Estimating the
potential revenues begins with understanding how many patrons could be converted. We
believe DeCA could convert up to approximately 800,000 households of the 1.3M target total.
This estimate reflects the triangulation of data on the patrons' purchasing factors, proximity to
stores, and potential status as military spouses or dependents (see Figure 10.34).494
494 Based on spectrum of DeCA and BCG surveys regarding the driving factors for patron loyalty
269
Figure 10.34: Estimates on patron conversion
Today, each active patron household spends roughly $1,100 / year at DeCA.495 This means
patron expansion could generate up to $900M in incremental revenue.496 Assuming DeCA is
able to pursue the other opportunities identified in the study, the increased sales from
expanding the patron base could drive down DeCA's APF requirements.
Figure 10.35: Impact of patron expansion on business economics
The initial win for DeCA in pulling this lever is not the reductions to APF; rather, it is the ability
to serve more veterans without disruption to DeCA's economics. And while pulling this lever
495 Annual spend per household calculated by dividing total sales by the number of eligible households 496 Sales figures assume a designated fraction of the available households per segment are likely to convert
270
only yields marginal impact to DeCA's APF needs initially, there could be a significant upside to
this lever later in DeCA's journey when sales generate positive contribution margin.
DeCA should also consider how expanding the patron base may impact the patron experience.
Expanding eligibility could lead to more out-of-stocks, longer checkout lines, congested parking
lots, a higher reliance on self-checkout stations, etc. Additionally, inventory management and
store staffing may require more tactical shifts during ramp up and run rate periods.497 These
potential impacts are all things DeCA can monitor and address during the expansion process.
10.7.3. Roadmap
DeCA needs to improve its economics such that each sale generates positive contribution
margin before it can consider expanding the patron base. We believe achieving profitable sales
should be possible by Implementation Phase II. Prior to this, DeCA could complete the related
decision-making and strategy design. Again, there are many potential impacts to patron
expansion, thus its success requires a carefully phased implementation (see Figure 10.36).
Figure 10.36: Patron expansion roadmap
As a part of implementation, DeCA would need to develop a detailed strategy for patron base
expansion. We suggest doing this during Implementation Phase I of the broader transformation
agenda. A key element of the strategy is the determination of whether new patrons should be
497 Period where implementation activities have been completed and the Agency is able to experience the full and desired benefits of the lever pulled and implemented
Implementation
Phase I
Implementation
Phase IIBeyond Phase II
N/A N/A Determine whether to
pursue expansion
• Perform related analyses to build business case
• Define target groups and approach
Define patron
expansion strategy
• Make decision on surcharge utilization and rate
Request Congressional
and DoD approval for
expansion
If approved, prep for
policy amendments
Execute policy
amendments
Rollout initiative to
approved patron
segments
• Pilot initiative • Archive lessons
learned for broader release
Evaluate results and
business case for
broader expansion
271
charged a fee or additional surcharge in order to be able to shop at the commissary. Potential
approaches for assessing an additional fee / surcharge would be: a flat rate fee across all
purchases; a flat rate fee for purchases of specific items; or a monthly / yearly access fee.
Without DeCA's future pricing strategy, calculating DeCA's price position relative to the market
or the economic impact of an additional surcharge is impractical. Insights gained from survey
responses from eligible patrons do offer clues regarding the buying profile of military affiliated
patrons,498 such as:
Patrons perceive DeCA discount to be less than communicated savings level
Patrons perceive DeCA discount to be less than 10% compared to value competitors
Data suggest a high sensitivity to any perceived reduction in the discount
Regardless of the decision regarding use of an additional fee / surcharge, DeCA should aim to
balance protection of the current patron experience and conversion of new patrons (see Figure
10.37)
Figure 10.37: Sample considerations for application of a fee / surcharge
Expanding the patron base could deeply impact a significant number of stakeholders external
to the broader DoD community. For example, when newly eligible patrons shift a percentage or
all of their grocery purchases to DeCA, there could be an increase in costs or negative impacts
to business and tax revenues in the private sector. As a result, government decision-makers are
likely to apply a high level of scrutiny to any patron expansion requests. Applying this rigor
would help to balance the impacts of patron expansion across private and public sector
stakeholders alike.
498 Based on feedback from 7,500+ eligible patrons; survey of target patron segments could be used to validate findings and collect additional insights around conversion
Option Considerations
Without surcharge to new patrons
Extends the full earned benefit to a broader based of veterans
Could generate some resentment among some existing patrons
Erodes the current benefit
With surcharge for new patrons
Reduces the perceived dilution of the earned benefit
Generates contribution margins to support operational needs and ancillary programs
Could deter potential patrons if the savings achieved, after the surcharge, is below the
threshold required for conversion
272
Given the time, sponsorship, and justification required to alter Federal policies, DeCA should
fully examine these potential impacts and plan for the required policy changes in advance of
any patron expansion. Overall, our analysis suggests that DeCA would need to coordinate
amendments to DoD Instruction 1330.17 to expand the patron base (see Figure 10.38):
Figure 10.38: Required eligibility amendments499
Beyond Implementation Phase II, the actual implementation would occur through individual
and consecutive pilots in smaller, lower-risk markets within each CONUS region. The purpose
of these pilots would be to test and monitor the impact of patron expansion on business
economics (e.g., sales, margins, conversion), patrons (e.g., inventory, crowding), and the private
sector. During this time, DeCA would utilize the data gained to confirm whether its existing
capabilities are sufficient to handle the increased volume from expansion of the patron base.
DeCA would also archive any lessons learned during the pilots and could adjust the broader
expansion strategy accordingly. Once DeCA is confident in the pilot results, it would then
launch expansion activities more broadly, beginning with the states with the smallest veteran
populations first.
Figure 10.39: Summary of patron base expansion next steps
Complete suggested analyses to develop business case
If pursuing expansion, submit business case to Congress to request approval
If approved, formulate strategy for expansion
499 DoD Instruction 1330.17, Armed Service Commissary Operations, Enclosure 4 2.j
273
Convene policy representatives and DeCA leaders to ratify eligibility changes
Set up system capabilities (e.g., additional fee / surcharge)
Design pilot plan (e.g., success measures, schedule, communications plan, risk strategy)
Launch pilot while testing performance and archiving the lessons learned
If successful, roll out initiative to all stores in waves
274
10.8. Organizational redesign
10.8.1. Background
As of Jan. 31, 2015, DeCA had approximately 15,500 employees worldwide, with about 14,000
employed within stores and 1,000 serving in functions performed above the store level (i.e., HQ
functions) (see Figure 10.40).
Figure 10.40: DeCA employees as of January 31, 2015
US Employees Local Nationals Total
In-store 12,475 1,278 13,753
Above-store 900 73 973
CDCs and CMPP500 245 516 761
Total 13,620 1,867 15,487
DeCA's above-store personnel are organized into five major divisions and perform many
functions that are analogous to a private sector grocer:
Operations: store operations and area management teams
Sales, Marketing and Policy: merchandising functions such as category management,
customer insights, eCommerce and smaller health, safety, and policy groups
Infrastructure: IT, procurement, supply chain / logistics, and real estate
Additional functions reporting directly to the Chief Executive Officer (CEO): legal,
internal audit, and military advisors
Additional functions reporting directly to the Chief Operating Officer (COO): finance,
HR and corporate communications
500 CDC refers to employees at DeCA's OCONUS Central Distribution Centers, CMPP refers to employees at DeCA's OCONUS Central Meat Processing Plant
1. Denotes SES position 2. DeCA General Counsel is part of the Defense Legal Services Agency
276
negotiations. This is one example of an organizational decision made within DeCA's current
operating model (in which DeCA cannot improve its economics by reducing COGS) which may
no longer make sense following changes at DeCA.
10.8.2. Opportunity
After the other transformation levers have been executed, it will be important for DeCA to
have the right organization in place to support its new operating model. An organizational
redesign would allow DeCA to build out new capabilities, align with industry best practices and
right-size functions based on new redefined roles. DeCA would likely want to pursue any
organizational redesign efforts after the approval of legislative enablers (i.e., variable pricing
and NAF). DeCA would also benefit from aligning any organizational redesign effort with
consolidation (which would also have organizational implications) to ensure consistent
communication and decision making and to reduce the overall amount of organizational
change for employees.
Under a new operating model, there would be several new activities that DeCA will need to
perform, including managing a private label portfolio and developing and executing a pricing
strategy. To roll-out private label, DeCA would not only need to bring on new talent to staff a
private label team but also create supporting infrastructure to make that team effective. The
same would be true for pricing. By taking a look at the whole organization rather than
individual functions, DeCA can ensure that these teams are more quickly integrated into
existing operations and positioned for success.
Organizational redesign may also present the opportunity to improve effectiveness within
different teams at DeCA. As discussed above, in the private sector, category managers are
generally responsible for both category assortment and buying to enable better decision
making and increase effectiveness in vendor negotiations. Organizational shifts towards
industry norms like this could help DeCA become much more competitive in the marketplace.
Though an organizational redesign process, DeCA should also seek opportunities to right-size
functions where appropriate. Right-sizing functions would have a dual benefit of creating more
agile, streamlined teams while also freeing up resources that can be redeployed to support the
broader transition. For example, if DeCA moves shelf-stocking and deli / bakery operations in-
277
house, there may be excess capacity in the non-resale procurement team; however, deli /
bakery merchandising would require more support.
10.8.3. Roadmap
As discussed above, DeCA would likely want to pursue any organizational redesign efforts after
the approval of legislative enablers and in concert with consolidation to reduce the overall
amount of organizational change for employees. In the short term, we believe that a piecemeal
approach of reducing above-store employees may be counterproductive as it offers minimal
financial benefit to DeCA and runs the risk of reducing morale and distracting from key
transformation priorities.
DeCA would likely face certain challenges to redesigning its organization in the public sector
context. For example, it may be difficult to hire talent to build capabilities for private label,
marketing, and pricing because of less competitive compensation than in the private sector.
However, conversion to NAF would allow DeCA greater flexibility to hire at the appropriate
grade to recruit talent and greater flexibility to right-size functions. An organizational change of
this kind would typically have no impact on customers and given DeCA's experience in
organizational efforts in the past, we think this could be managed effectively such that it has no
impact on patrons. 502, 503
502 Oct. 6 2013 – DeCA underwent a reorganization of Sales directorate; Resale contracting was also realigned as a division under the acquisition management directorate 503 Oct. 9 2011 – DeCA underwent a major restructuring of the above-store organization, as required by the Secretary of Defense's memorandum, Track Four Efficiency Initiatives Decisions
278
Section 11: Roadmap to Move Forward
The magnitude of change required to accomplish this study's recommendations should not be
underestimated. Achieving the transformation would entail significant legislative / policy
change, extensive capability building, and noticeable impacts to the broad set of stakeholders
who support or work with the four organizations in the military resale system today.
Stakeholders, especially Congress and DoD, should be prepared to support a multi-year, phased
change effort.
As with all large transformation efforts, there is some risk involved in these changes that would
need to be carefully managed. We have seen many efforts of this magnitude succeed by
focusing on building strong capabilities, executing on a well-defined roadmap, and following a
clear set of guiding principles.
While the DoD team responsible for moving forward should own the guiding principles for this
effort, there are some important principles we suggest considering. These principles are
incorporated in the approach for the overall roadmap and include the following:
Ensure patron benefit is maintained or enhanced unless there is a deliberate
decision to change benefit levels (e.g., if government decision-makers decided to raise
prices in a manner that would significantly impact patron benefit)
Be transparent in communication and decision making to minimize the uncertainty for
stakeholders, especially the employees of each organization and patrons
Balance speed with appropriate phasing in areas where there is risk, such as
consolidation or moving away from cost-plus pricing
Test wherever possible to understand impacts on a small scale before rolling out
broadly (e.g., a new DeCA pricing strategy)
Prioritize initiatives based on impact (understanding there are some dependencies
that necessitate sequencing) and focus on tangible, sustainable improvements in early
phases
Coordination across DeCA, the exchanges, and the governance board (including DoD) will be
critical to realize the potential savings from the changes and protect patron benefit. To manage
279
the level of complexity involved, we suggest dividing the effort into three phases, which we
refer to as: Planning Phase, Implementation Phase I, and Implementation Phase II. Each of
these phases would require different activities from DeCA, the exchanges, and the governance
board.
There are a number of important considerations that should guide the overall roadmap. First,
many of the opportunities have interdependencies with other organizations and activities. For
example, many of DeCA's opportunities require legislative changes. As such, our roadmap
highlights these interdependencies and sequences activities accordingly. Second, there is a
maximum amount of change any organization can handle without compromising the ability to
deliver on its core mission. We designed our roadmap with this in mind, balancing the level of
effort required by each organization. Finally, transformations should allow time to test, learn,
and make real-time refinements. This phased approach provides ample opportunity to pilot
changes and leverage lessons learned. For example, experience from consolidating the
exchange back offices in Implementation Phase I could inform the back-office integration with
DeCA in Implementation Phase II.
Our roadmap presents the full set of activities necessary for the DoD to pursue all of the
recommended initiatives, including consolidation. However, it is entirely possible for DeCA
specific initiatives to move forward independent of consolidation. DoD could pursue these
opportunities regardless of decisions on consolidation and the governance board. Therefore,
the roadmap should be interpreted as an ideal state plan to accomplish all recommended
initiatives for the military resale system, acknowledging that DeCA can take action on many
initiatives without the full governance structure. Our roadmap is outlined in Figure 11.1.
280
Figure 11.1: Overall roadmap for path forward
In summary, the Planning Phase would involve standing up the governance board and
preparing DeCA and the exchanges to pursue cost-savings opportunities and consolidation. For
DeCA, the start of Implementation Phase I would be marked by the removal of the cost-plus
pricing requirement, which would enable DeCA to capture benefits from levers like COGS
renegotiation and the introduction of private label. For the exchanges, the start of
Implementation Phase I would be marked by the launch of the consolidated back-office shared
services business unit (SSBU). DeCA would transition to Implementation Phase II when NAF
conversion is approved, which would enable DeCA to capture savings from labor-related
opportunities as well as efficiencies from the SSBU. At the same time, the exchanges could
begin consolidating front-office functions such as merchandising, store operations, and supply
chain.504
504 All DeCA-specific opportunities should be pursued regardless of consolidation path forward (only exception is, of course, DeCA back-office consolidation with SSBU)
Implementation Phase I Implementation Phase IIPlanning phase
Prepare to launch "win-wins"
enabled by variable pricing
• Plan for implementation• Secure legislative changes
Build GNFR fact base and begin
first wave of opportunities
Continue local sourcing efforts
and add quick win categories
Pursue "win-win" opportunities
• Introduce variable pricing and test "normalized" prices
• Secure legislative changes• Develop NAF general ledger and
map back-office processes
Continue executing "win-wins"
Begin converting to NAF and
pursuing related opportunities
• Convert personnel to NAF with incentives and attrition
• Redesign labor model, including in-sourcing contract labor
Transfer NAF back-office
functions to exchange SSBU
Prepare for back-office
consolidation
• Develop functional plans, synergy estimates, etc.
• Build fact base for IT integration
Consolidate back-office functions
• Transfer HR, IT, finance, and contracting capabilities to SSBU
• Integrate back-office IT systems• Align organizational structure
Prepare to consolidate
merchandising and supply chain
Consolidate merchandising and
supply chain functions
Stabilize back-office SSBU and
integrate DeCA
Begin to migrate headquarters
• Initiate relocation process
DeCA
Exch.
Launch consolidation
Approve variable pricing
Approve and begin
DeCA NAF conversion
Establish Military Resale
Governance Board
Establish governance boardOversee planning
Oversee improvement and integration effortsEnsure investments aligned across military resale system
Gov.
Board
281
Savings for the military resale system would materialize across these phases, starting with some
quick wins for DeCA in the Planning Phase. DeCA can achieve a significant amount of savings
from actions launched in Implementation Phase I, with some additional savings in the
following phase.505 Similarly, consolidation of the exchanges would begin to drive value in
Implementation Phase I and reach full value after Implementation Phase II actions are
completed. After successfully securing these opportunities, DeCA would still likely require some
level of APF in order to operate (see Figure 11.2). Deciding how to fill this gap will present an
important policy consideration for the governance board, DoD, and Congress to resolve.
It will also be important to consider how to account for the savings generated by DeCA and the
exchanges. Depending on the opportunity, savings may have to be treated differently. We have
classified savings opportunities into four categories:
Direct APF savings – These savings would directly impact DeCA's APF requirement
under current legislation and policy
APF savings requiring variable pricing and flexible funds – These savings would
reduce DeCA's APF requirement if DeCA is allowed to variably price and has greater
flexibility in how to allocate the margin earned on sales (i.e., no surcharge restriction)
Exchange NAF savings – These savings would flow to the exchanges and could be used
to increase MWR dividends. Separate action would be necessary if government
decision-makers wanted to use any of these savings to offset APF
Decision required to allocate savings – There is no obvious answer to how these
savings would be allocated based on today's rules and regulations. A decision would be
required to balance offsetting APF and increasing MWR
505 "Quick wins" are opportunities that don't require legislative change and can reduce APF needs under DeCA's current business model
282
Figure 11.2: Projected savings (assumes midpoint of all savings ranges) 506
506 APF impact shown versus FY14 APF budget ($1,366M). Actual budget execution in FY14 was $1,300M. Note: incorporates the midpoints of ranges in opportunity size. May be slightly different than Figure 1.1 and 2.12 due to rounding.
1,366 60 310
175821
0
500
1,000
1,500
Gap to zero APF
Annualized run rate APF impact ($M)
Phase IIPhase IPlanningFY14 APF
$545M(40%)
Phase IIPhase IPlanning
Phase I savings require variable pricing
and flexible funds
DeCA savings levers
•Increase local sourcing
•Reduce GNFR
•Improve merchandising / COGS
•Rationalize surcharge / Capex
•Introduce private label
•Adjust wages and benefits
•Adjust labor mix (FT/PT/Flex)
•Improve store operations
•Increase price 1-3%, if needed ($30M - $90M)
•Selectively close stores, if needed
•Expand patron base
•Increase store day/hours
Consolidation impact
(Annualized run rate savings for total military resale system)
Exchange savings (NAF) – $80M
Exchange savings (NAF) – $220M
DeCA savings$50M
283
Figure 11.3: Summary of savings opportunities by accounting category
Direct APF savings
$M
APF savings requiring variable
pricing and flexible funds
$M Exchange /
NAF savings $M
Decision required to
allocate savings
$M
NAF conversion
Adjust wages and benefits
Adjust labor mix (part-time / flex)
95-155
10-25
Improve merchandising and reduce cost of goods sold
110-165 Exchange consolidation
175-265 DeCA back office consolidation
40-60
Improve store operations
20-45 Rationalize surcharge / Capex
70-100 Expand Military Star card
Local sourcing 55-60 Introduce private label
60-120
Increase price (1-3%)
30-90
Total 1180-285 Total 270-475 Total 175-265 Total 40-60
Planning Phase
Regardless of how subsequent phases are structured, a planning phase in which DoD
establishes a clear governance board for the broader military resale system is critical (as
described in Section 8). The governance board would then develop change management plans
for the overall effort, onboard appropriate teams from DeCA and the exchanges to own each
workstream, and work with those teams to create detailed implementation plans.
In addition, some early quick wins for DeCA could move forward during this phase, such as
renegotiating goods not for resale and increasing local sourcing. These early wins would help to
build momentum and savings for the longer-term journey. During the Planning Phase, DeCA
should also prepare for required legislative or policy changes including NAF conversion and
moving away from cost-plus pricing.
In parallel, the exchanges should begin preparing for back-office consolidation. During this
phase, some of the important activities include cataloging processes and systems, aligning on
how to organize the SSBU, and finalizing the process and sequencing of consolidation. Getting
284
full alignment and buy-in to targets during this process is important to successful execution as
consolidation begins. Overall, the Planning Phase would likely take between six and 12 months.
Implementation Phase I
After the Planning Phase DeCA should start down a path of transformation by prioritizing the
most important and actionable opportunities. In Implementation Phase I, we suggest focusing
on moving away from cost-plus pricing and capturing the broader value it unlocks, including
COGS renegotiation and the introduction of private label. These efforts would have significant
downstream implications for how DeCA merchandises and prices, manages its relationships
with brokers and distributors, and approaches its finances. When DeCA is no longer required to
price at cost-plus, it would be possible to generate additional margin on each sale that could be
used to fund operations and reduce needs for APF. This phase will be challenging and involve
complexity (i.e., normalizing prices, renegotiating COGS, introducing new private label
products, etc.), but we believe it is a necessary and manageable first step that would begin to
unlock a significant amount of value for DeCA and improve patron experience.
For the exchanges, we believe they should first integrate back-office functions into the SSBU
before including front-office functions or DeCA (as discussed earlier). This would enable the
organizations to act quickly but maintain a focused approach. This phase of change would be
difficult and require investment to accomplish, but it is a critical first step to unifying the
military resale system and unlocking substantial savings potential. Creating one back-office
function would also put the exchanges in a position to support DeCA's back-office needs after
NAF conversion. Therefore, sequencing back-office consolidation first in exchange
consolidation is the best approach for the military resale system overall. Implementation Phase
I initiatives will likely take one to three years, with some of DeCA's APF reduction initiatives
(i.e., COGS and Capex) reaching run-rate early on and others ramping up over time.
Implementation Phase II
The timing of NAF conversion is also a major decision for DeCA. Given the magnitude of
change implied by Implementation Phase I, we believe DeCA should plan to officially convert
to NAF at the beginning of Implementation Phase II.507 Sequencing NAF conversion after the
507 Recognizing that NAF conversion of personnel (driven through early retirement benefits and attrition) will take multiple years
285
removal of cost-plus pricing would give DeCA time to plan for and solve some of the challenges
associated with NAF conversion. This approach would also give the exchanges time to execute
back-office consolidation so they are in a position to service DeCA's NAF back-office needs once
it has converted. NAF conversion would unlock further opportunities for DeCA to reduce its
need for APF, including better aligning wages and benefits with private sector rates and
rethinking the approach to outsourcing (such as contractor stockers and receiving, storage, and
handling).
During Implementation Phase II, DeCA should continue to refine its approach to the
opportunities from Implementation Phase I, including implementing a holistic pricing strategy
and broadening its private label offering.508 All of these changes should contribute to DeCA
generating positive contribution margins and shifting the incentives and logic for some of their
business decisions (e.g., store hours). While DeCA would likely still require APF at the end of
Implementation Phase II, DeCA would likely be generating positive margin on each sale at this
point, and would therefore have the incentive to grow sales.
At the same time, we believe the exchanges would then be ready to take the next step in
consolidation. This would involve consolidating headquarters; integrating more functions such
as merchandising, supply chain, and store operations; and further streamlining and integrating
key business processes. However, we would expect the exchanges to maintain separate
branding or banners. We would also expect little change in the stores aside from some product
rationalization where it is economically advantageous and has minimal patron impact.
The back-office SSBU should also begin to service DeCA's NAF needs for finance, HR, and
contracting during this phase. We expect Implementation Phase II to take one to three years.
However, significantly more time may be required to realize full run-rate savings, especially for
DeCA labor based initiatives which rely on attrition (i.e., NAF conversion).
Beyond Implementation Phase II
At this point, the military resale system would look very different than it does today. The
exchanges would be largely unified under one organization fully leveraging its scale. DeCA
508 The implementation of a holistic pricing strategy does not necessarily imply an overall increase in price
286
would be a profit-driven, market-oriented grocer much less reliant on APF. There are further
enhancements that the organizations could consider at this point, such as whether the
exchange supply chain should also service DeCA's needs. Driven by a positive contribution
margin, DeCA would have the opportunity and incentive to pursue sales growth levers,
including expanding its current patron base, increasing overall store hours, optimizing
merchandising and pricing strategies, and refining store operations.
It is important to recognize that after these changes are implemented, DeCA would likely still
have a gap between its costs and revenues. Increasing sales by growing the patron base and
adjusting store hours could help close some of that gap. DeCA and stakeholders would also
need to decide whether to raise prices more broadly to try to close the gap further. DeCA could
continue to receive some APF support as a NAF as the exchanges do today. The governance
organization and policymakers will need to carefully weigh these options to choose the path
that balances patron benefit with policy considerations at that point.
Risks to roadmap
It is also important to note that this roadmap is entirely dependent on when decisions are
made and when required legislation or policy is changed. As a result, assigning specific dates
and even firm timing is impossible at this point. We can confidently say that this will be a multi-
year journey that will require significant resources and coordination to execute. While difficult,
we believe this roadmap is the right path to ensure the long-term sustainability of the military
resale system and patron benefit. The proposed sequencing of this effort also enables the
military resale system to realize partial benefits if only some of the recommended opportunities
are pursued. Given that this effort would likely span presidential administrations and
congressional terms, it will be critical to ensure continuity in governance and vision to bridge
any changes in the broader political environment.
Figure 11.4: Summary of overall next steps
DoD stakeholders
Establish defense resale governance board and related authorities
DeCA
Establish project leadership, guiding principles, and timeline for transformation