38
Climate Change Millbrae General Plan Update Public Review Draft Existing Conditions Report 9-1 August 2016 9
Climate Change
Millbrae General Plan Update
Public Review Draft Existing Conditions Report 9-1 August 2016
9

9-2 Public Review Draft Existing Conditions Report August 2016
Climate Change
Millbrae General Plan Update
Public Review Draft Existing Conditions Report 9-3 August 2016
9

9-4 Public Review Draft Existing Conditions Report August 2016
TABLE 9-1 STATEWIDE GREENHOUSE GAS EMISSIONS INVENTORY
California 1990-2013
Emissions Sector MMTCO2e Percent of
Total (2013)
Percent Change
(1990-2013) 19901 2000 2010 2013
Transportation 151 176 170 169 37 12
Electricity Generation2 111 105 90 90 20 -19
Industrial 103 98 92 93 20 -10
Commercial and
Residential Fuel Use
44 43 45 44 10 0
Agriculture 23 32 35 36 8 57
High GWP -3 7 15 19 4 n/a
Recycling and Waste -3 7 8 9 2 n/a
Total4 432 469 456 459
Notes: GWP = global warming potential; MMTCO2e = million metric tons of carbon dioxide equivalent 1California’s first 1990 GHG emissions inventory was prepared in 2007 by ARB using GWP values from the IPCC Second Assessment Report. All other inventory years shown use GWP values from the IPCC Fourth Assessment Report. 2Includes both in-state electricity generation and out-of-state imported electricity. 3High GWP and Recycling and Waste sectors were included in the Industrial sector for the 1990 inventory only. 4Totals may not sum exactly due to rounding. Source: ARB 2007, ARB 2015; data compiled by Ascent Environmental, 2016.

Climate Change
Millbrae General Plan Update
Public Review Draft Existing Conditions Report 9-5 August 2016
9
TABLE 9-2 GREENHOUSE GAS EMISSIONS, BY SECTOR AND COUNTY (MMTCO2E)
San Francisco Bay Area 2011
Alameda Contra Costa
Marin Napa San
Fran-cisco
San Mateo
Santa Clara
Solano2 Sonoma2 Total SF Bay Area
Industrial/
Commercial 2.7 17.8 0.4 0.2 1.2 1.4 4.1 2.7 0.5 31.0
Residential Fuel 1.3 1.0 0.3 0.1 0.9 0.8 1.5 0.3 0.4 6.6
Electricity/Co-
Generation 0.9 7.2 0.1 0.1 0.5 0.4 2.2 0.4 0.2 12.0
Off-Road
Equipment 0.2 0.2 0.0 0.0 0.2 0.1 0.4 0.0 0.1 1.2
Transportation 7.9 5.0 1.3 0.9 3.0 5.0 7.6 1.6 2.0 34.3
Agriculture/
Farming 0.1 0.2 0.2 0.1 0.0 0.0 0.2 0.1 0.2 1.1
TOTAL
(All Sectors)1 13.2 31.4 2.4 1.5 5.7 7.7 16.0 5.1 3.5 86.5
Notes: MMTCO2e = million metric tons of carbon dioxide equivalent. 1Totals may not sum exactly, due to rounding of figures. 2Portion within San Francisco Bay Air Basin. Source: BAAQMD 2015; compiled by Ascent Environmental, 2016.
9-6 Public Review Draft Existing Conditions Report August 2016
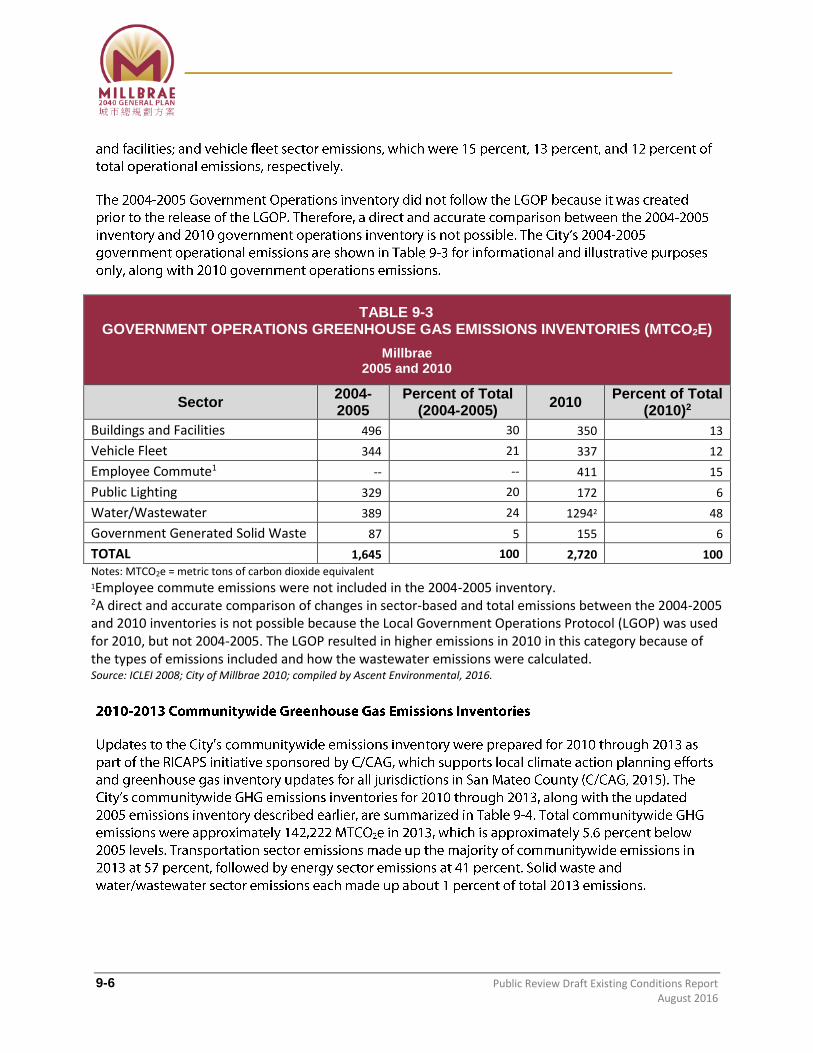
TABLE 9-3 GOVERNMENT OPERATIONS GREENHOUSE GAS EMISSIONS INVENTORIES (MTCO2E)
Millbrae 2005 and 2010
Sector 2004-2005
Percent of Total (2004-2005)
2010 Percent of Total
(2010)2
Buildings and Facilities 496 30 350 13
Vehicle Fleet 344 21 337 12
Employee Commute1 -- -- 411 15
Public Lighting 329 20 172 6
Water/Wastewater 389 24 12942 48
Government Generated Solid Waste 87 5 155 6
TOTAL 1,645 100 2,720 100 Notes: MTCO2e = metric tons of carbon dioxide equivalent 1Employee commute emissions were not included in the 2004-2005 inventory. 2A direct and accurate comparison of changes in sector-based and total emissions between the 2004-2005 and 2010 inventories is not possible because the Local Government Operations Protocol (LGOP) was used for 2010, but not 2004-2005. The LGOP resulted in higher emissions in 2010 in this category because of the types of emissions included and how the wastewater emissions were calculated. Source: ICLEI 2008; City of Millbrae 2010; compiled by Ascent Environmental, 2016.
Climate Change
Millbrae General Plan Update
Public Review Draft Existing Conditions Report 9-7 August 2016
9
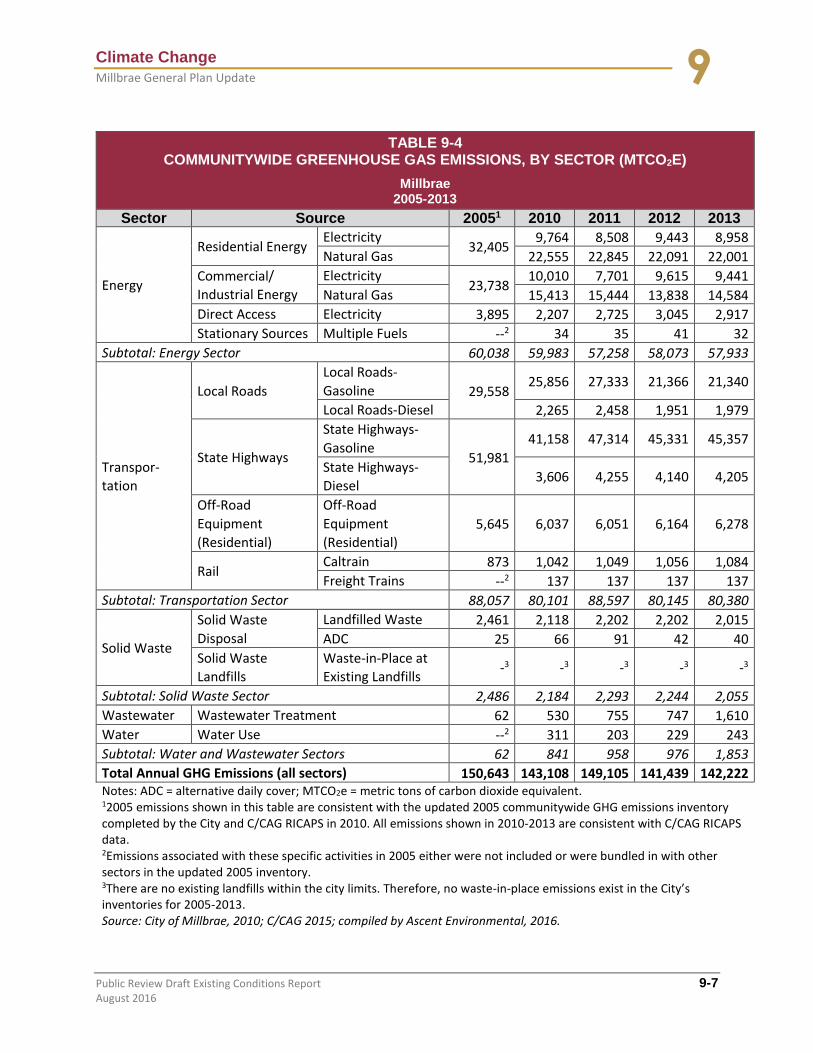
TABLE 9-4 COMMUNITYWIDE GREENHOUSE GAS EMISSIONS, BY SECTOR (MTCO2E)
Millbrae 2005-2013
Sector Source 20051 2010 2011 2012 2013
Energy
Residential Energy Electricity
32,405 9,764 8,508 9,443 8,958
Natural Gas 22,555 22,845 22,091 22,001
Commercial/
Industrial Energy
Electricity 23,738
10,010 7,701 9,615 9,441
Natural Gas 15,413 15,444 13,838 14,584
Direct Access Electricity 3,895 2,207 2,725 3,045 2,917
Stationary Sources Multiple Fuels --2 34 35 41 32
Subtotal: Energy Sector 60,038 59,983 57,258 58,073 57,933
Transpor-
tation
Local Roads
Local Roads-
Gasoline 29,558 25,856 27,333 21,366 21,340
Local Roads-Diesel 2,265 2,458 1,951 1,979
State Highways
State Highways-
Gasoline 51,981
41,158 47,314 45,331 45,357
State Highways-
Diesel 3,606 4,255 4,140 4,205
Off-Road
Equipment
(Residential)
Off-Road
Equipment
(Residential) 5,645 6,037 6,051 6,164 6,278
Rail Caltrain 873 1,042 1,049 1,056 1,084
Freight Trains --2 137 137 137 137
Subtotal: Transportation Sector 88,057 80,101 88,597 80,145 80,380
Solid Waste
Solid Waste
Disposal
Landfilled Waste 2,461 2,118 2,202 2,202 2,015
ADC 25 66 91 42 40
Solid Waste
Landfills
Waste-in-Place at
Existing Landfills -3 -3 -3 -3 -3
Subtotal: Solid Waste Sector 2,486 2,184 2,293 2,244 2,055
Wastewater Wastewater Treatment 62 530 755 747 1,610
Water Water Use --2 311 203 229 243
Subtotal: Water and Wastewater Sectors 62 841 958 976 1,853
Total Annual GHG Emissions (all sectors) 150,643 143,108 149,105 141,439 142,222 Notes: ADC = alternative daily cover; MTCO2e = metric tons of carbon dioxide equivalent. 12005 emissions shown in this table are consistent with the updated 2005 communitywide GHG emissions inventory completed by the City and C/CAG RICAPS in 2010. All emissions shown in 2010-2013 are consistent with C/CAG RICAPS data. 2Emissions associated with these specific activities in 2005 either were not included or were bundled in with other sectors in the updated 2005 inventory. 3There are no existing landfills within the city limits. Therefore, no waste-in-place emissions exist in the City’s inventories for 2005-2013. Source: City of Millbrae, 2010; C/CAG 2015; compiled by Ascent Environmental, 2016.
9-8 Public Review Draft Existing Conditions Report August 2016

Climate Change
Millbrae General Plan Update
Public Review Draft Existing Conditions Report 9-9 August 2016
9
9-10 Public Review Draft Existing Conditions Report August 2016
Climate Change
Millbrae General Plan Update
Public Review Draft Existing Conditions Report 9-11 August 2016
9
9-12 Public Review Draft Existing Conditions Report August 2016
Climate Change
Millbrae General Plan Update
Public Review Draft Existing Conditions Report 9-13 August 2016
9
9-14 Public Review Draft Existing Conditions Report August 2016
o
o
o
Climate Change
Millbrae General Plan Update
Public Review Draft Existing Conditions Report 9-15 August 2016
9
9-16 Public Review Draft Existing Conditions Report August 2016
Climate Change
Millbrae General Plan Update
Public Review Draft Existing Conditions Report 9-17 August 2016
9
9-18 Public Review Draft Existing Conditions Report August 2016
‐ ‐
Climate Change
Millbrae General Plan Update
Public Review Draft Existing Conditions Report 9-19 August 2016
9
9-20 Public Review Draft Existing Conditions Report August 2016

Climate Change
Millbrae General Plan Update
Public Review Draft Existing Conditions Report 9-21 August 2016
9
9-22 Public Review Draft Existing Conditions Report August 2016
Climate Change
Millbrae General Plan Update
Public Review Draft Existing Conditions Report 9-23 August 2016
9
9-24 Public Review Draft Existing Conditions Report August 2016
Climate Change
Millbrae General Plan Update
Public Review Draft Existing Conditions Report 9-25 August 2016
9
9-26 Public Review Draft Existing Conditions Report August 2016

SKYLINE
MILLBRAE AVE
S A N B R U N O
SAN FRANCISCOINTERNATIONAL AIRPORT
¬«82
£¤280
£¤101
S A NF R A N C I S C O
B A Y
HELEN
HILLCREST
MAGNOLIA
PALM
MURCHISON
BROADWAY
ASHTON
EL CAMINO REAL
ANITA
TAYL
OR
POPLAR
LOMITA
ELDER
HAZEL
BAY
RICHMOND
PAR
K
CRESTVIEW
SEQUOIA
LAUREL
AVIADOR
CLEARFIELD
LUDEMAN
TIO
GA
HEMLOCK
CHADBOURNE
ADRIAN
BAYVIEW
LARKSPUR
MILLWOOD
LEWIS
PIN
ON
JUAN
ITA
RIDGEW
OO
D
CENTER
ROLLINS
PARAMOUNT
BARCELONA
WILLO
W
CASTENADA
EL PASEO
CUARDO
BEVERLY
PINE
MONTEREY
LA PRENDA
SYCAMORE
TUOLUMNE
CYPRESS
MCDONNELL
HACIENDA
MARCELLA
SILVA
GARDEN
SERRA
ROBLE
AUR
A VI
STA
MINO
RCA
AH
WA
HN
EE
BROOKSIDE
EL CAPITAN
BANBURY
ELMW
OOD
OAKWOODGLENW
OOD
MATEO
VICTORIA
BON
ITA
FERNWOOD
SAN ANSELMO
VISTA GRANDE
PALMITO
SAN
TA B
ARBA
RA
CAPUCHINO
MICHAEL
CEDAR
VIA CANON
BERKSHIRE
BARCLAY
CO
LOR
ADO
S
EL BONITO
VIEW
OLD BAYSHORE
LANDING
LINCOLN
LOREE
LIBRARY
NADINA
SPRUCE
HERMOSA
ALTO LO
MA
RIVERTON
FINEHURST
HEIDI
LANSDALE
EVERGREEN
SANTA TERESA
MADRONE
MA
PLE
DUMONT
CAMINO ALTO
HENRY
COAS
TGUAR
D
MEADOW GLEN
DEXTERRO
BERT
ROBLAR
SPRING VALLEYLA MANCHA
JASMIN
ECYPRESS
LAUREL
PAR
K
VISTA GRANDE
M I L L S C R E E K
H I GH
L I N E CR
E E K
J O N C R E E K
MI L L S C R E E K
¯0 0.5 1Mi
Figure 9-1: Sea Level Rise: Threatened Areas Map
Source: Knowles, Noah, USGS (2010).Map Date: 3/31/2016
Intermodal Transportation Station: BART/Caltrain/Future HSR
Millbrae City Limits
¹º Schools
Inundation Area
Current With 100-year Flood Event Exposure
Current + 0.5 m sea-level rise
Current + 1.0 m sea-level rise
Current + 1.4 m sea-level rise
G150100110 01 002
Note: These layers represent current coastal flooding projections,based on a 100-year flood event in and around the City of Millbrae,as well as projected vulnerable areas due to a 100-year flood eventand up to 1.4 m of sea-level rise. This “bathtub” model does notaccount for protective structure, such as levees; or hydrodynamicalprocesses such as wave run-up. More information on assumptionscan be found on Cal Adapt’s website: http://cal-adapt.org/sealevel/. Data was prepared by the USGS and can be found athttp://cascade.wr.usgs.gov.
9-28 Public Review Draft Existing Conditions Report August 2016
Climate Change
Millbrae General Plan Update
Public Review Draft Existing Conditions Report 9-29 August 2016
9
9-30 Public Review Draft Existing Conditions Report August 2016
Climate Change
Millbrae General Plan Update
Public Review Draft Existing Conditions Report 9-31 August 2016
9
9-32 Public Review Draft Existing Conditions Report August 2016
Climate Change
Millbrae General Plan Update
Public Review Draft Existing Conditions Report 9-33 August 2016
9
9-34 Public Review Draft Existing Conditions Report August 2016

Climate Change
Millbrae General Plan Update
Public Review Draft Existing Conditions Report 9-35 August 2016
9
9-36 Public Review Draft Existing Conditions Report August 2016
Climate Change
Millbrae General Plan Update
Public Review Draft Existing Conditions Report 9-37 August 2016
9
9-38 Public Review Draft Existing Conditions Report August 2016


