Earth Sciences 2016; 5(6): 123-134 http://www.sciencepublishinggroup.com/j/earth doi: 10.11648/j.earth.20160506.16 ISSN: 2328-5974 (Print); ISSN: 2328-5982 (Online) Mineralogy and Geochemistry of Soil in Ondo State Bitumen Environment, Nigeria Tomori W. B. 1, 3, * , Yanful E. K. 1 , Flemming R. L. 2 , Amoo I. A. 3 , Aiyesanmi A. F. 3 , Adekoya J. A. 4 1 Department of Civil and Environmental Engineering, Western University, Ontario, Canada 2 Department of Geology, Western University, Ontario, Canada 3 Department of Chemistry, Federal University of Technology, Akure, Nigeria 4 Department of Applied Geology, Federal University of Technology, Akure, Nigeria Email address: [email protected] (Tomori W. B.), [email protected] (Yanful E. K.), [email protected] (Flemming R. L.), [email protected] (Aiyesanmi A. F.), [email protected] (Amoo I. A.), [email protected] (Adekoya J. A.) * Corresponding author To cite this article: Tomori W. B., Yanful E. K., Flemming R. L., Amoo I. A., Aiyesanmi A. F., Adekoya J. A. Mineralogy and Geochemistry of Soil in Ondo State Bitumen Environment, Nigeria. Earth Sciences. Vol. 5, No. 6, 2016, pp. 123-134. doi: 10.11648/j.earth.20160506.16 Received: October 3, 2016; Accepted: November 22, 2016; Published: January 4, 2017 Abstract: The geochemistry and bulk mineralogy of surface (0-30 cm) and subsurface (60-90 cm) soil samples in the bitumen environment of Ondo State Nigeria was studied using X-Ray Florescence and X-Ray Diffraction techniques. The bulk minerals were qualitatively studied with EVA software and quantified using Rietveld refinement method. The mineralogy was found to be essentially quartz, kaolinite and feldspars with respective abundances of 83.76-93.76%, 4.38-10.60% and 1.86- 3.82%. The geochemistry reveals that the order of abundance of major oxides is SiO 2 > Al 2 O 3 > Fe 2 O 3 > TiO 2 ≥ K 2 O > MgO > CaO > Na 2 O ≥ P 2 O 5 > MnO > Cr 2 O 3 . Only Fe 2 O 3 shows a little leaching into the subsurface layer while TiO 2 was relatively stable between the two layers. The high quartz, low kaolinite, low feldspar and low gibbsite content may indicate moderate to high degree of weathering; higher contents of silica and alumina as well as alkalis and calcium in the surface layer may equally suggest an aeolian additions and/or relative enrichment of minerals during weathering and nutrient cycling by vegetation. Keywords: Mineralogy, Geochemistry, Soil, Bitumen, Environment, XRF, XRD 1. Introduction Southwestern Nigeria lies in the humid tropics and its geology may be broadly divided into basement complex rocks either igneous or metamorphic which are Precambrian (570 M.y.) in age. These occupy most of the northern part of the region. Whereas, the sedimentary rocks that are cretaceous (136 M.y.) to recent in age [1] occupy the southern part. The concentrations of trace and major elements in residual soils depend mainly upon the bedrock type from which the soil parent material is derived [2-4] and pedogenic processes acting upon it [5-8]. The influence of the parent material on trace and major elements tends to decrease with soil development [9]. The most important aspects of pedogenesis relating to the behavior of trace and major elements are those affecting (i) the release of metals from the parent material by weathering, (ii) the translocation and accumulation of sorbents such as clay minerals, oxides and organic matter. These are controlled by leaching, eluviation, salinization, calcification, podzolization, ferralitization, gleying and organic matter accumulation [10]. Under tropical and sub-tropical climate, geochemical weathering is intense and consequently mineral solubility and elemental redistribution often present different kinds of scenarios [11-12]. Mineralogical analysis may provide information on the relative fate of pollutants and plant nutrients as well as soil physicochemical properties. The understanding of soil mineralogy is therefore recognized as very important in influencing the retention capacity, bioavailability of heavy metals and their mobility in specific environments (soil chemistry and ion exchange reactions) [13-15]. Mineralogy has also been related to the
Transcript
Earth Sciences 2016; 5(6): 123-134
http://www.sciencepublishinggroup.com/j/earth
doi: 10.11648/j.earth.20160506.16
ISSN: 2328-5974 (Print); ISSN: 2328-5982 (Online)
Mineralogy and Geochemistry of Soil in Ondo State Bitumen Environment, Nigeria
Tomori W. B.1, 3, *
, Yanful E. K.1, Flemming R. L.
2, Amoo I. A.
3, Aiyesanmi A. F.
3, Adekoya J. A.
4
1Department of Civil and Environmental Engineering, Western University, Ontario, Canada
2Department of Geology, Western University, Ontario, Canada
3Department of Chemistry, Federal University of Technology, Akure, Nigeria
4Department of Applied Geology, Federal University of Technology, Akure, Nigeria
To cite this article: Tomori W. B., Yanful E. K., Flemming R. L., Amoo I. A., Aiyesanmi A. F., Adekoya J. A. Mineralogy and Geochemistry of Soil in Ondo
State Bitumen Environment, Nigeria. Earth Sciences. Vol. 5, No. 6, 2016, pp. 123-134. doi: 10.11648/j.earth.20160506.16
Received: October 3, 2016; Accepted: November 22, 2016; Published: January 4, 2017
Abstract: The geochemistry and bulk mineralogy of surface (0-30 cm) and subsurface (60-90 cm) soil samples in the
bitumen environment of Ondo State Nigeria was studied using X-Ray Florescence and X-Ray Diffraction techniques. The bulk
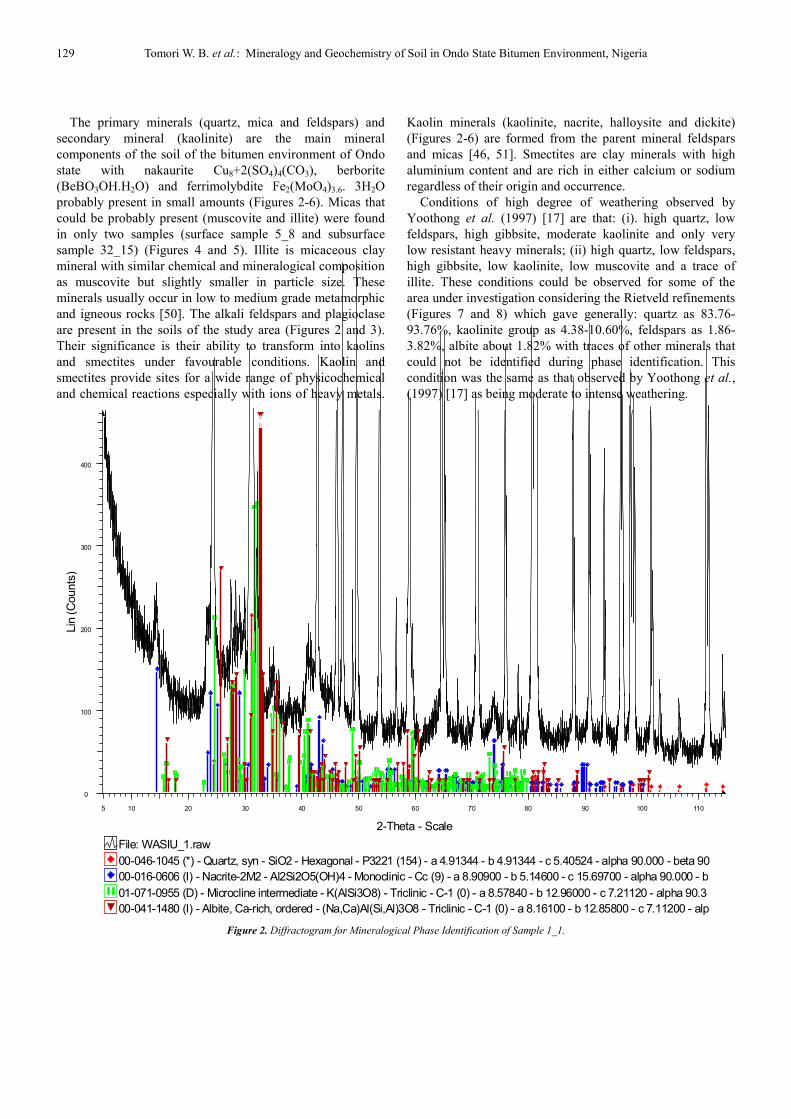
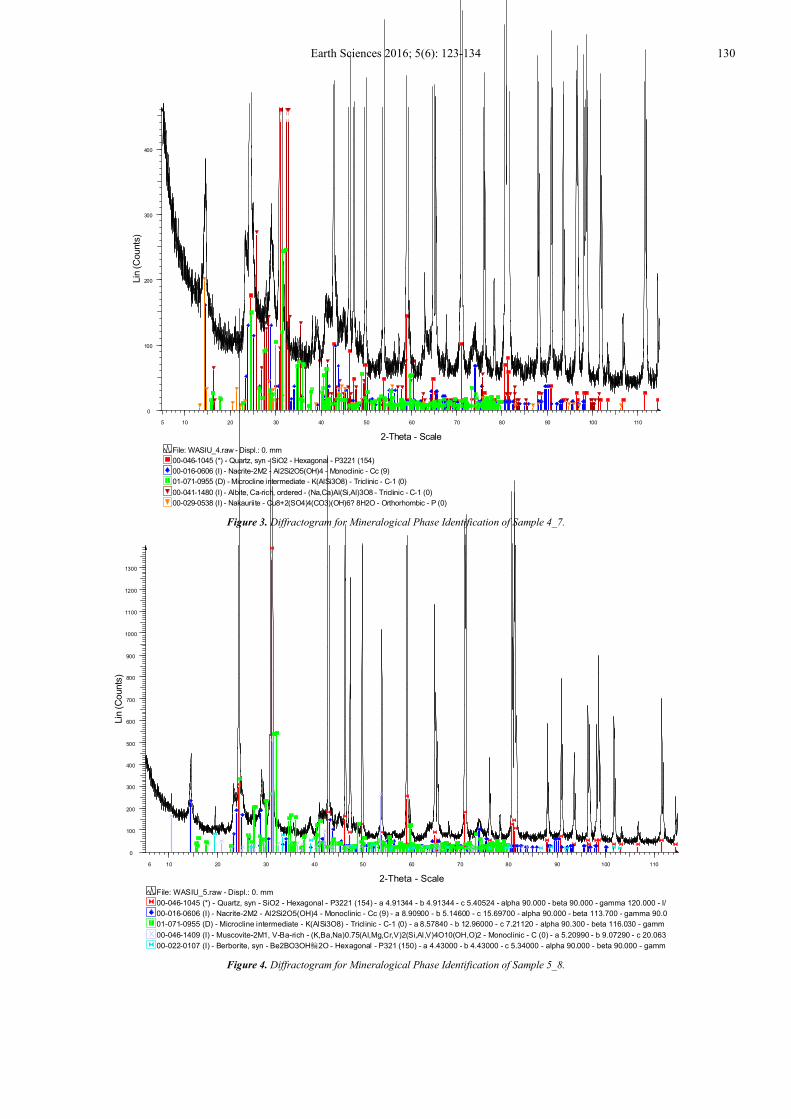
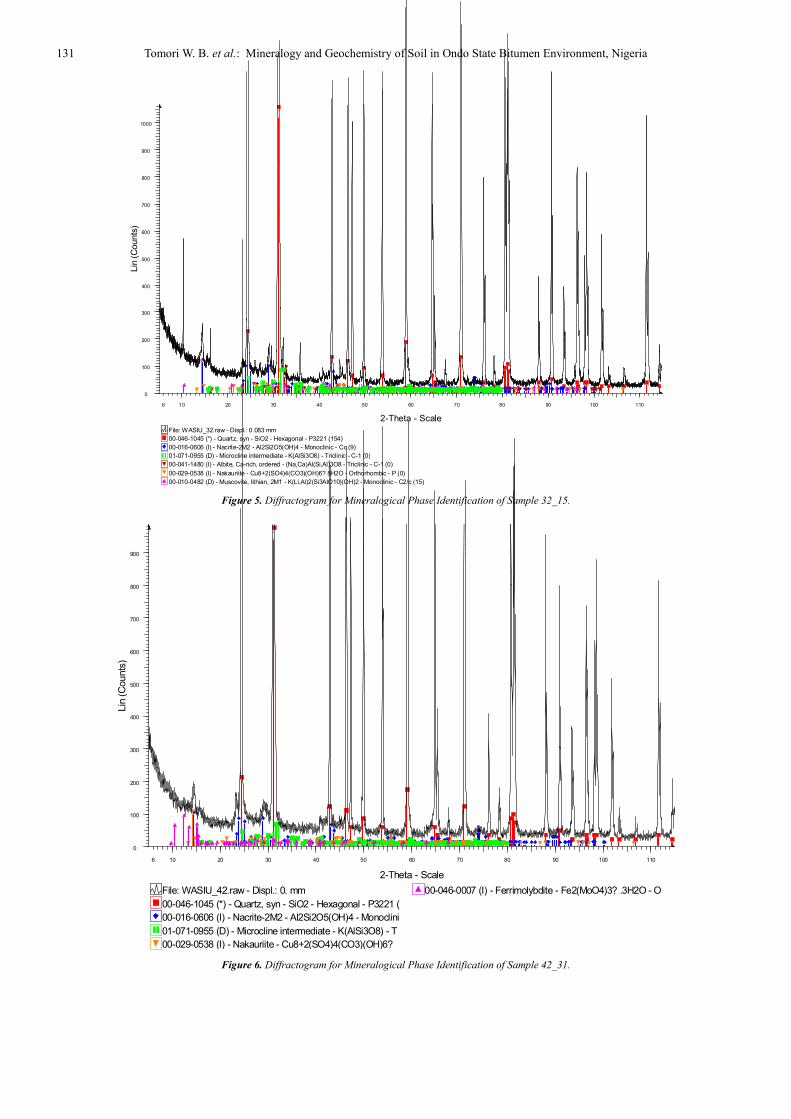
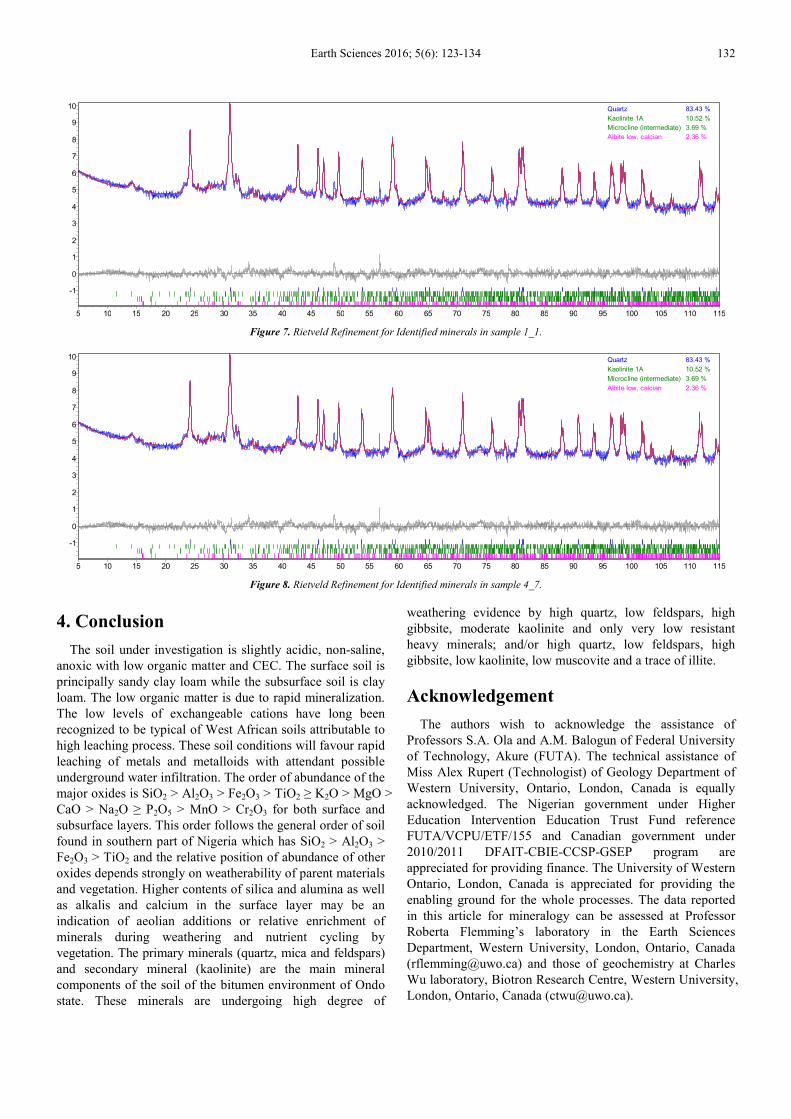
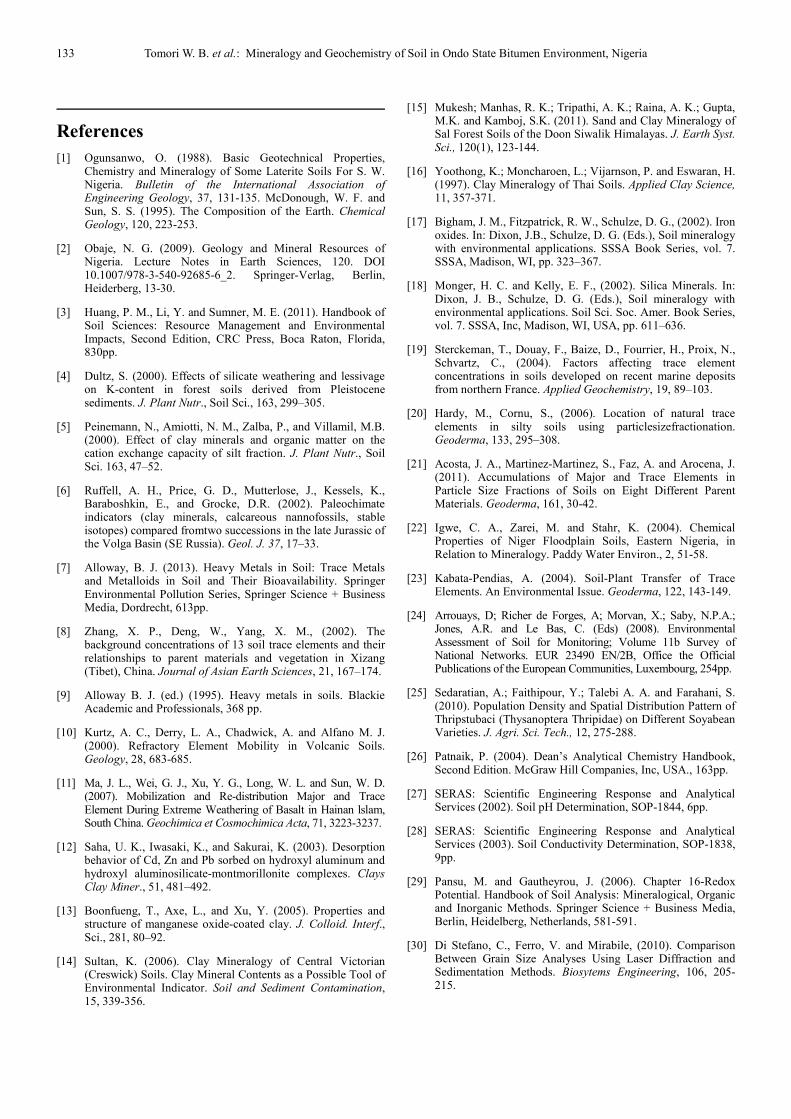
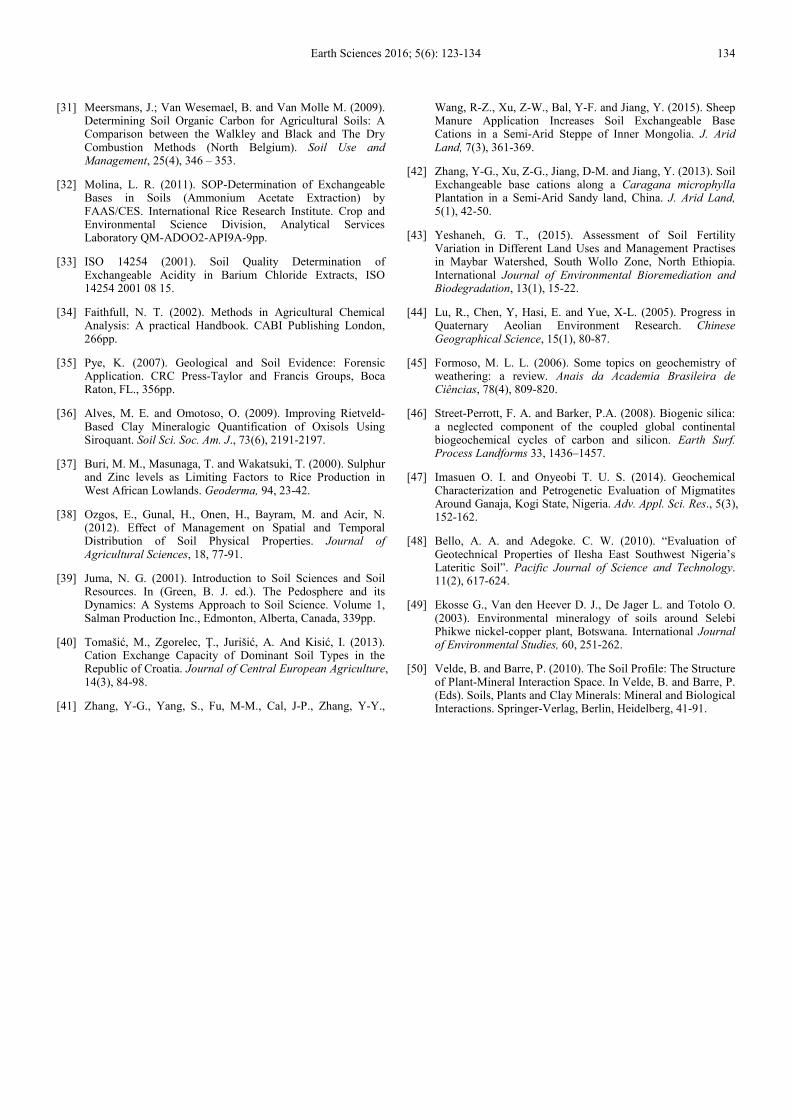
minerals were qualitatively studied with EVA software and quantified using Rietveld refinement method. The mineralogy was
found to be essentially quartz, kaolinite and feldspars with respective abundances of 83.76-93.76%, 4.38-10.60% and 1.86-
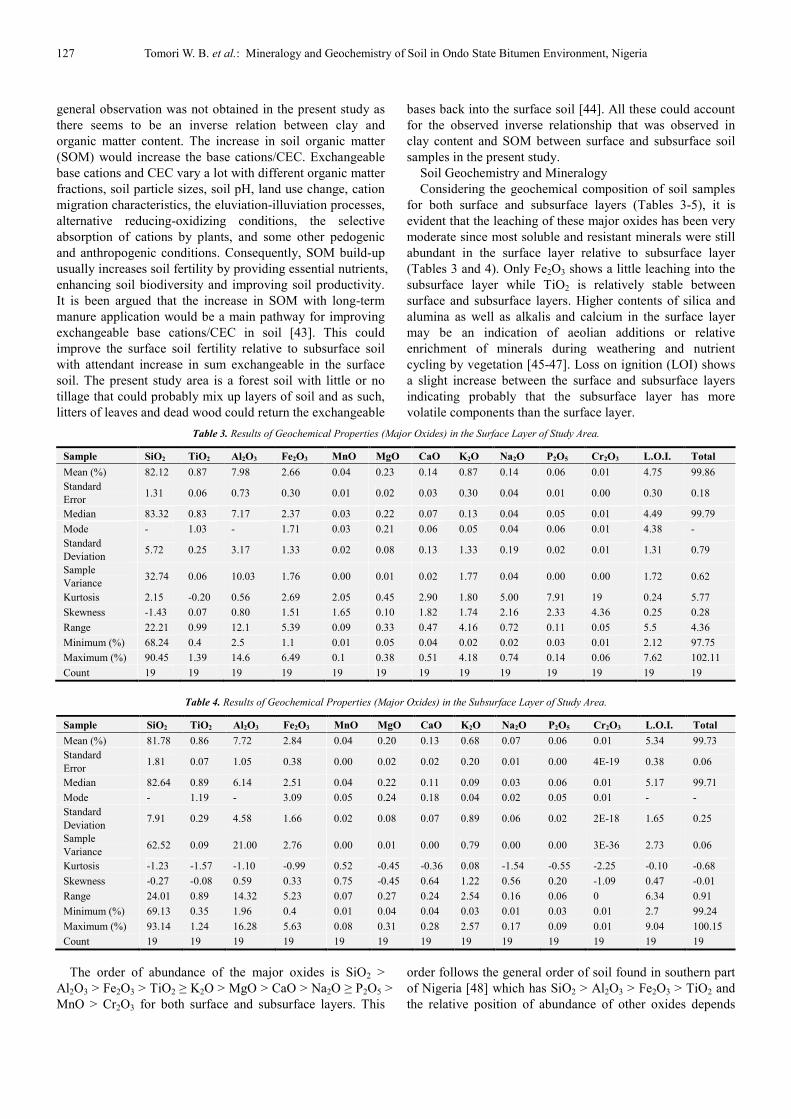
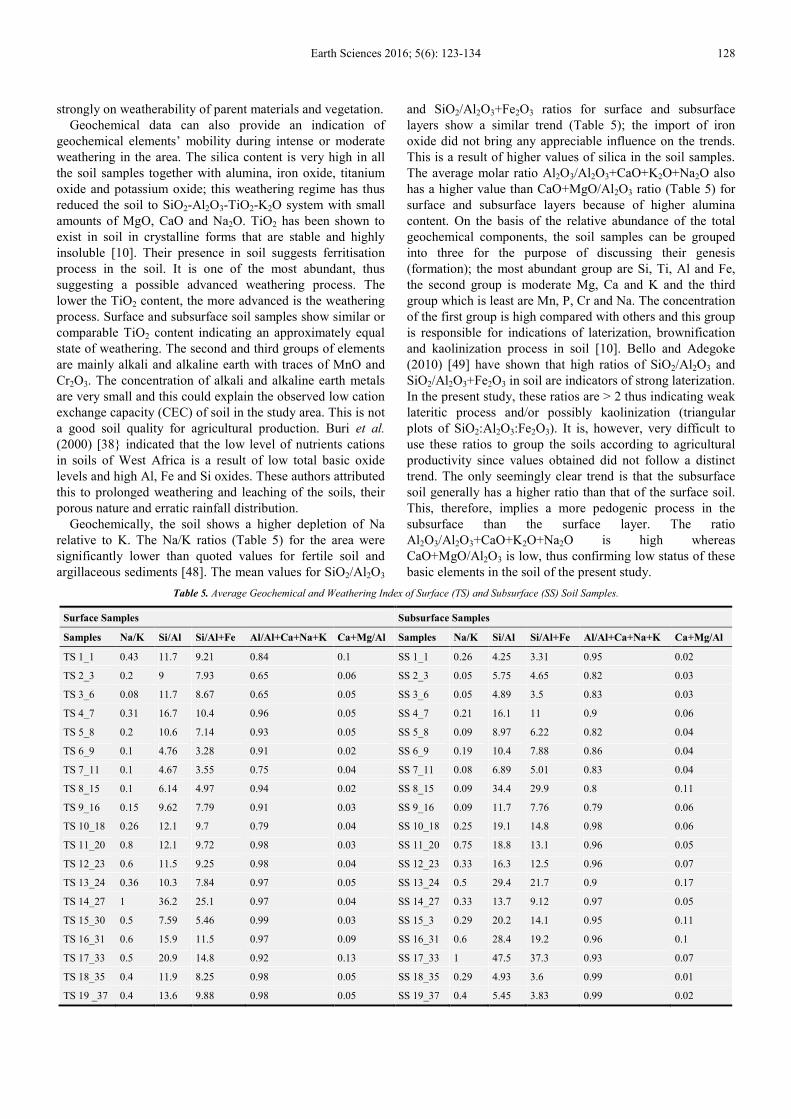
3.82%. The geochemistry reveals that the order of abundance of major oxides is SiO2 > Al2O3 > Fe2O3 > TiO2 ≥ K2O > MgO >
CaO > Na2O ≥ P2O5 > MnO > Cr2O3. Only Fe2O3 shows a little leaching into the subsurface layer while TiO2 was relatively
stable between the two layers. The high quartz, low kaolinite, low feldspar and low gibbsite content may indicate moderate to
high degree of weathering; higher contents of silica and alumina as well as alkalis and calcium in the surface layer may equally
suggest an aeolian additions and/or relative enrichment of minerals during weathering and nutrient cycling by vegetation.
133 Tomori W. B. et al.: Mineralogy and Geochemistry of Soil in Ondo State Bitumen Environment, Nigeria
References
[1] Ogunsanwo, O. (1988). Basic Geotechnical Properties, Chemistry and Mineralogy of Some Laterite Soils For S. W. Nigeria. Bulletin of the International Association of Engineering Geology, 37, 131-135. McDonough, W. F. and Sun, S. S. (1995). The Composition of the Earth. Chemical Geology, 120, 223-253.
[2] Obaje, N. G. (2009). Geology and Mineral Resources of Nigeria. Lecture Notes in Earth Sciences, 120. DOI 10.1007/978-3-540-92685-6_2. Springer-Verlag, Berlin, Heiderberg, 13-30.
[3] Huang, P. M., Li, Y. and Sumner, M. E. (2011). Handbook of Soil Sciences: Resource Management and Environmental Impacts, Second Edition, CRC Press, Boca Raton, Florida, 830pp.
[4] Dultz, S. (2000). Effects of silicate weathering and lessivage on K-content in forest soils derived from Pleistocene sediments. J. Plant Nutr., Soil Sci., 163, 299–305.
[5] Peinemann, N., Amiotti, N. M., Zalba, P., and Villamil, M.B. (2000). Effect of clay minerals and organic matter on the cation exchange capacity of silt fraction. J. Plant Nutr., Soil Sci. 163, 47–52.
[6] Ruffell, A. H., Price, G. D., Mutterlose, J., Kessels, K., Baraboshkin, E., and Grocke, D.R. (2002). Paleochimate indicators (clay minerals, calcareous nannofossils, stable isotopes) compared fromtwo successions in the late Jurassic of the Volga Basin (SE Russia). Geol. J. 37, 17–33.
[7] Alloway, B. J. (2013). Heavy Metals in Soil: Trace Metals and Metalloids in Soil and Their Bioavailability. Springer Environmental Pollution Series, Springer Science + Business Media, Dordrecht, 613pp.
[8] Zhang, X. P., Deng, W., Yang, X. M., (2002). The background concentrations of 13 soil trace elements and their relationships to parent materials and vegetation in Xizang (Tibet), China. Journal of Asian Earth Sciences, 21, 167–174.
[9] Alloway B. J. (ed.) (1995). Heavy metals in soils. Blackie Academic and Professionals, 368 pp.
[10] Kurtz, A. C., Derry, L. A., Chadwick, A. and Alfano M. J. (2000). Refractory Element Mobility in Volcanic Soils. Geology, 28, 683-685.
[11] Ma, J. L., Wei, G. J., Xu, Y. G., Long, W. L. and Sun, W. D. (2007). Mobilization and Re-distribution Major and Trace Element During Extreme Weathering of Basalt in Hainan lslam, South China. Geochimica et Cosmochimica Acta, 71, 3223-3237.
[12] Saha, U. K., Iwasaki, K., and Sakurai, K. (2003). Desorption behavior of Cd, Zn and Pb sorbed on hydroxyl aluminum and hydroxyl aluminosilicate-montmorillonite complexes. Clays Clay Miner., 51, 481–492.
[13] Boonfueng, T., Axe, L., and Xu, Y. (2005). Properties and structure of manganese oxide-coated clay. J. Colloid. Interf., Sci., 281, 80–92.
[14] Sultan, K. (2006). Clay Mineralogy of Central Victorian (Creswick) Soils. Clay Mineral Contents as a Possible Tool of Environmental Indicator. Soil and Sediment Contamination, 15, 339-356.
[15] Mukesh; Manhas, R. K.; Tripathi, A. K.; Raina, A. K.; Gupta, M.K. and Kamboj, S.K. (2011). Sand and Clay Mineralogy of Sal Forest Soils of the Doon Siwalik Himalayas. J. Earth Syst. Sci., 120(1), 123-144.
[16] Yoothong, K.; Moncharoen, L.; Vijarnson, P. and Eswaran, H. (1997). Clay Mineralogy of Thai Soils. Applied Clay Science, 11, 357-371.
[17] Bigham, J. M., Fitzpatrick, R. W., Schulze, D. G., (2002). Iron oxides. In: Dixon, J.B., Schulze, D. G. (Eds.), Soil mineralogy with environmental applications. SSSA Book Series, vol. 7. SSSA, Madison, WI, pp. 323–367.
[18] Monger, H. C. and Kelly, E. F., (2002). Silica Minerals. In: Dixon, J. B., Schulze, D. G. (Eds.), Soil mineralogy with environmental applications. Soil Sci. Soc. Amer. Book Series, vol. 7. SSSA, Inc, Madison, WI, USA, pp. 611–636.
[19] Sterckeman, T., Douay, F., Baize, D., Fourrier, H., Proix, N., Schvartz, C., (2004). Factors affecting trace element concentrations in soils developed on recent marine deposits from northern France. Applied Geochemistry, 19, 89–103.
[20] Hardy, M., Cornu, S., (2006). Location of natural trace elements in silty soils using particlesizefractionation. Geoderma, 133, 295–308.
[21] Acosta, J. A., Martinez-Martinez, S., Faz, A. and Arocena, J. (2011). Accumulations of Major and Trace Elements in Particle Size Fractions of Soils on Eight Different Parent Materials. Geoderma, 161, 30-42.
[22] Igwe, C. A., Zarei, M. and Stahr, K. (2004). Chemical Properties of Niger Floodplain Soils, Eastern Nigeria, in Relation to Mineralogy. Paddy Water Environ., 2, 51-58.
[23] Kabata-Pendias, A. (2004). Soil-Plant Transfer of Trace Elements. An Environmental Issue. Geoderma, 122, 143-149.
[24] Arrouays, D; Richer de Forges, A; Morvan, X.; Saby, N.P.A.; Jones, A.R. and Le Bas, C. (Eds) (2008). Environmental Assessment of Soil for Monitoring; Volume 11b Survey of National Networks. EUR 23490 EN/2B, Office the Official Publications of the European Communities, Luxembourg, 254pp.
[25] Sedaratian, A.; Faithipour, Y.; Talebi A. A. and Farahani, S. (2010). Population Density and Spatial Distribution Pattern of Thripstubaci (Thysanoptera Thripidae) on Different Soyabean Varieties. J. Agri. Sci. Tech., 12, 275-288.
[26] Patnaik, P. (2004). Dean’s Analytical Chemistry Handbook, Second Edition. McGraw Hill Companies, Inc, USA., 163pp.
[29] Pansu, M. and Gautheyrou, J. (2006). Chapter 16-Redox Potential. Handbook of Soil Analysis: Mineralogical, Organic and Inorganic Methods. Springer Science + Business Media, Berlin, Heidelberg, Netherlands, 581-591.
[30] Di Stefano, C., Ferro, V. and Mirabile, (2010). Comparison Between Grain Size Analyses Using Laser Diffraction and Sedimentation Methods. Biosytems Engineering, 106, 205-215.
Earth Sciences 2016; 5(6): 123-134 134
[31] Meersmans, J.; Van Wesemael, B. and Van Molle M. (2009). Determining Soil Organic Carbon for Agricultural Soils: A Comparison between the Walkley and Black and The Dry Combustion Methods (North Belgium). Soil Use and Management, 25(4), 346 – 353.
[32] Molina, L. R. (2011). SOP-Determination of Exchangeable Bases in Soils (Ammonium Acetate Extraction) by FAAS/CES. International Rice Research Institute. Crop and Environmental Science Division, Analytical Services Laboratory QM-ADOO2-API9A-9pp.
[33] ISO 14254 (2001). Soil Quality Determination of Exchangeable Acidity in Barium Chloride Extracts, ISO 14254 2001 08 15.
[34] Faithfull, N. T. (2002). Methods in Agricultural Chemical Analysis: A practical Handbook. CABI Publishing London, 266pp.
[35] Pye, K. (2007). Geological and Soil Evidence: Forensic Application. CRC Press-Taylor and Francis Groups, Boca Raton, FL., 356pp.
[36] Alves, M. E. and Omotoso, O. (2009). Improving Rietveld-Based Clay Mineralogic Quantification of Oxisols Using Siroquant. Soil Sci. Soc. Am. J., 73(6), 2191-2197.
[37] Buri, M. M., Masunaga, T. and Wakatsuki, T. (2000). Sulphur and Zinc levels as Limiting Factors to Rice Production in West African Lowlands. Geoderma, 94, 23-42.
[38] Ozgos, E., Gunal, H., Onen, H., Bayram, M. and Acir, N. (2012). Effect of Management on Spatial and Temporal Distribution of Soil Physical Properties. Journal of Agricultural Sciences, 18, 77-91.
[39] Juma, N. G. (2001). Introduction to Soil Sciences and Soil Resources. In (Green, B. J. ed.). The Pedosphere and its Dynamics: A Systems Approach to Soil Science. Volume 1, Salman Production Inc., Edmonton, Alberta, Canada, 339pp.
[40] Tomašić, M., Zgorelec, Ţ., Jurišić, A. And Kisić, I. (2013). Cation Exchange Capacity of Dominant Soil Types in the Republic of Croatia. Journal of Central European Agriculture, 14(3), 84-98.
Wang, R-Z., Xu, Z-W., Bal, Y-F. and Jiang, Y. (2015). Sheep Manure Application Increases Soil Exchangeable Base Cations in a Semi-Arid Steppe of Inner Mongolia. J. Arid Land, 7(3), 361-369.
[42] Zhang, Y-G., Xu, Z-G., Jiang, D-M. and Jiang, Y. (2013). Soil Exchangeable base cations along a Caragana microphylla Plantation in a Semi-Arid Sandy land, China. J. Arid Land, 5(1), 42-50.
[43] Yeshaneh, G. T., (2015). Assessment of Soil Fertility Variation in Different Land Uses and Management Practises in Maybar Watershed, South Wollo Zone, North Ethiopia. International Journal of Environmental Bioremediation and Biodegradation, 13(1), 15-22.
[44] Lu, R., Chen, Y, Hasi, E. and Yue, X-L. (2005). Progress in Quaternary Aeolian Environment Research. Chinese Geographical Science, 15(1), 80-87.
[45] Formoso, M. L. L. (2006). Some topics on geochemistry of weathering: a review. Anais da Academia Brasileira de Ciências, 78(4), 809-820.
[46] Street-Perrott, F. A. and Barker, P.A. (2008). Biogenic silica: a neglected component of the coupled global continental biogeochemical cycles of carbon and silicon. Earth Surf. Process Landforms 33, 1436–1457.
[47] Imasuen O. I. and Onyeobi T. U. S. (2014). Geochemical Characterization and Petrogenetic Evaluation of Migmatites Around Ganaja, Kogi State, Nigeria. Adv. Appl. Sci. Res., 5(3), 152-162.
[48] Bello, A. A. and Adegoke. C. W. (2010). “Evaluation of Geotechnical Properties of Ilesha East Southwest Nigeria’s Lateritic Soil”. Pacific Journal of Science and Technology. 11(2), 617-624.
[49] Ekosse G., Van den Heever D. J., De Jager L. and Totolo O. (2003). Environmental mineralogy of soils around Selebi Phikwe nickel-copper plant, Botswana. International Journal of Environmental Studies, 60, 251-262.
[50] Velde, B. and Barre, P. (2010). The Soil Profile: The Structure of Plant-Mineral Interaction Space. In Velde, B. and Barre, P. (Eds). Soils, Plants and Clay Minerals: Mineral and Biological Interactions. Springer-Verlag, Berlin, Heidelberg, 41-91.