THE MINERALOGY, GEOCHEMISTRY AND ORIGIN OF LOWER TERTIARY SMECTITE-MUDSTONES EAST COAST DEFORMED BELT NEW ZEALAND A thesis submitted in partial fulfilment of the requirements for the Degree of Master of Science in Geology in the University of Canterbury by L.J. Fergusson :~:. University of Canterbury 1985
Transcript
THE MINERALOGY, GEOCHEMISTRY
AND ORIGIN OF
LOWER TERTIARY SMECTITE-MUDSTONES
EAST COAST DEFORMED BELT
NEW ZEALAND
A thesis
submitted in partial fulfilment
of the requirements for the Degree
of
Master of Science in Geology
in the
University of Canterbury
by
L.J. Fergusson :~:.
University of Canterbury
1985
CONTENTS
CHAPTER
ABSTRACT
ONE INTRODUCTION 1.1 Scope 1.2 Previous Work 1.3 The 'Bentonite' Problem
TWO FIELD GEOLOGY 2.1 Introduction 2.2 Marlborough 2.3 Wairarapa 2.4 Hawkes Bay 2.5 Synthesis
THREE LABORATORY METHODS 3.1 Sample Preparation 3.2 Analytical Techniques
FIVE GEOCHEMISTRY 5.1 Introduction 5.2 Major Element Geochemistry 5.3 Trace Element Geochemistry
SIX ORIGIN OF THE SMECTITE-MUDSTONES 6.1 Introduction 6.2 Sedimentology 6.3 Mineralogy 6.4 Geochemistry 6.5 Summary and Conclusions
ACKNOWLEDGEMENTS
REFERENCES
APPENDICES
PAGE
1
3 3 4 5
8 8 11 35 43 54
58 58 61
69 69 69 91 ll5
123 123 123 136
143 143 144 149 156 161
164
166
170
TABLE
2.1
4.1 4.2
4.3 4.4
4.5
4.6 4.7 4.8
5.1 5.2
5.3
5.4
5.5
5.6
LIST OF TABLES
Marlborough sample localities
XRD standard mixture compositions Results of quantitative XRD analysis of smectitemudstone clay fractions Classification of smectites Results of Li+-saturation test for smectite in mudstone clay fractions Results of K+-saturation tests for smectite in mudstone clay fractions DTA results for smectite-mudstone clay fractions Characteristics of montmorillonite subspecies Heavy mineral suites of selected smectite-mudstones
Example of a structural formula calculation Accuracy of XRF major element analyses of bentonite standards Average structural formulas of smectite + illite in smecti te-mudstone· clay fractions Exchangeable cations in smectite-mudstone samples and duplicates Trace element analyses of smectite-mudstone whole-rock samples Trace element analyses of other lithologies associated with the smectite-mudstones
5.7 Correlation coefficient matrix for trace elements in smectite-mudstones
6.1 Trace element abundances in shale and carbonate and
PAGE
13
81
86 91
96
102 108 112 116
125
127
132
135
137
138
140
mean shale-carbonate values 157
FIGURE
1.1
1.2
LIST OF FIGURES
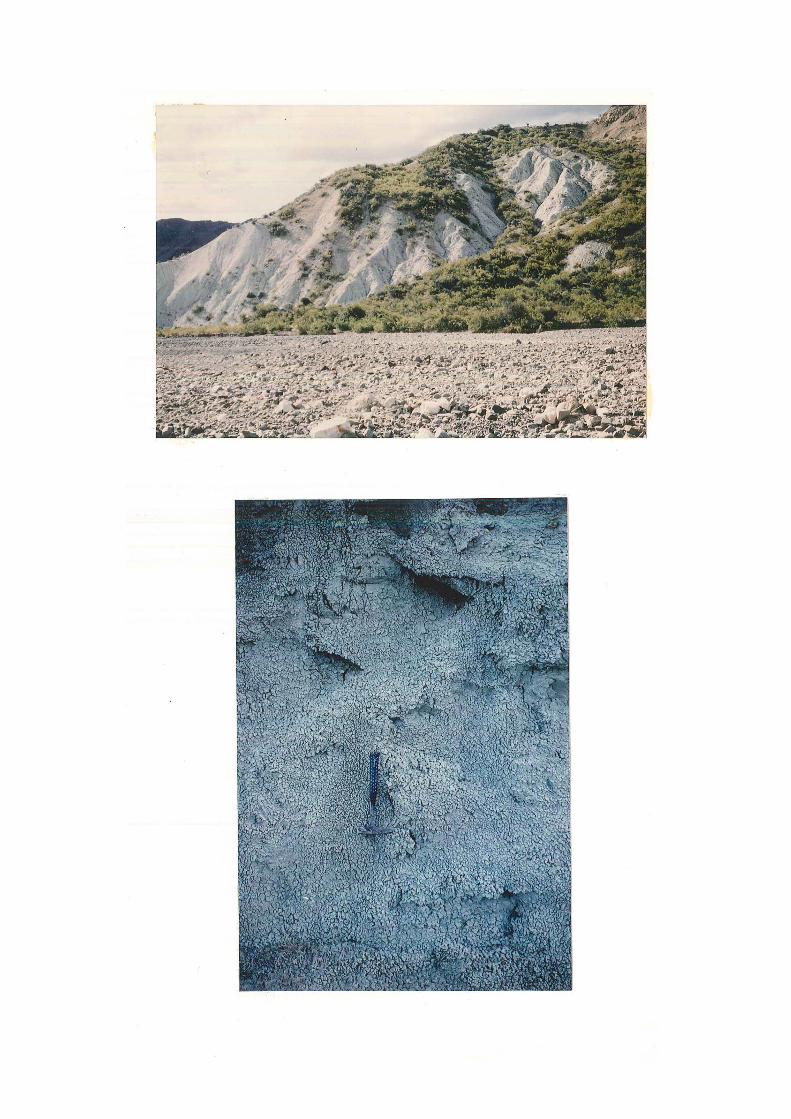
Eroded and slumped smectite-mudstone, Seymour Stream Shrinkage cracks in smectite-mudstone, Porangahau Quarry
2.1 The East Coast Deformed Belt and the present
2.2 2.3
2.4
2.5
2.6
2.7
2.8 2.9
2.10 2.11 2.12 2.13
2.14 2.15 2.16 2.17 2.18 2.19 2.20 2.21 2.22
2.23 2.24 2.25
2.26
2.27
2.28, 2.29
2.30 2.31
2.32 2.33
2.34
2.35 2.36
day plate·boundary system Generalised geology of Marlborough Summary stratigraphic columns of the Arouri Limestone in Marlborough Surnmary stratigraphic columns of the Marl units of the Arouri Limestone in Marlborough Interbedded smectite-mudstone and limestone, Seymour Stream Interbedded smectite-mudstone and limestone, Mead Stream gorge Typical internal stratigraphy of the Marls. Lower Marl, Chalk Range The geology of Woodside Creek Alternating marl-limestone, Lower Marl, Woodside Creek The geology of the upper Ure River View of part of the Chalk Range The Lower Marl, Chalk Range Detailed stratigraphic column of the Lower Marl, Chalk Range Highly sheared Upper Marl, Chalk Range Whales Back ridge The geology of Mead Stream gorge Lower Marl, Mead Stream gorge Marl unit, Bluff Stream The geology of the Lower Seymour outlier Massive marl lithology, Seymour Stream Marl unit, Fells Basin Detailed stratigraphic column of the Arouri Limestone, Fells Basin The geology of the Limestone Hill outlier The geology of the Tora area Summary stratigraphic column of the Kandahar Formation, Pukemuri Stream Interbedded sandstone, limestone and smectitemudstone, Kandahar Formation, Pukemuri Stream Alternating marl-limestone, Kandahar Formation, Awheaiti Stream Marl interbeds in the Mungaroa Limestone, Mungaroa Point Generalised geology of southern Hawkes Bay Summary stratigraphic columns of the Wanstead Formation, Waimarama Beach and Waewae Stream The geology of Waimarama Beach Interbedded sandstone and smectite-mudstone, Wanstead Formation, Waimarama Beach Sedimentologic cycle, Wanstead Formation, Waimarama Beach Melange zone, Waimarama Beach The geology of Waewae Stream
PAGE
6
6
9 12
15
16
18
18
20 21
20 23 25 25
26 27 27 28 29 29 31 32 32
33 34 36
37
40
40
42 44
46 47
49
50 49 51
FIGURE PAGE
2.37 The geology of the coastal slope near Red Island 53
2.38 Lower Tertiary stratigraphic columns for Marlborough, Wairarapa and Hawkes Bay 55
4.1 Layer structure of smectite clay minerals 71 4.2 X-ray diffractograms of basal peaks of untreated
smecti tes 7 2 4.3 X-ray diffractograms of the basal peak of untreated
and glycerol treated smectite 74 4.4 X-ray diffractograms of the basal peak of heat
treated smectite 74 4.5 X-ray diffractogram of the clay fraction of a
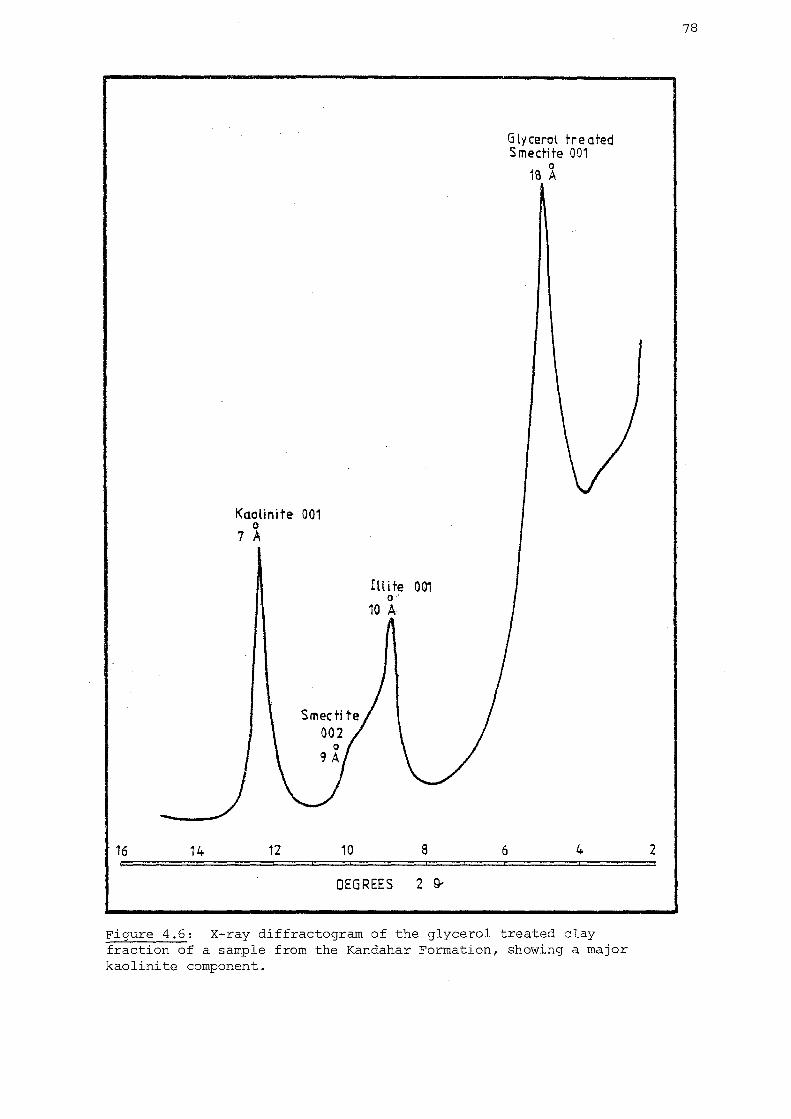
smectite-mudstone 76 4.6 X-ray diffractogram of a sample from the Kandahar
Formation 78 4.7 X-ray diffractograms of three standard mixtures 82 4.8 Calibration curves for determination of% quartz
4.9
4.10 4.11
4.12
4.13
4.14
4.15,4.16
4.17
4.18
4.19
4.20 4.21
4.22 4.23 4.24 4.25 4.26
4.27
5.1
5.2
6.1
6.2
from XRD Calibration curve for determination of% smectite and% illite from XRD X-ray diffractograms of three size fractions Scanning electron micrograph of mudstone from Marlborough Scanning electron micrograph of mudstone from Wairarapa Scanning electron micrograph of mudstone from Hawkes Bay Scanning electron micrograph of mudstone from the melange, Waimarama Beach Scanning electron micrographs of clay particles in two mudstone clay fractions X-ray diffractograms of smectite basal peaks after the Li+-saturation test X-ray diffractograms of smectite basal peaks after K+-saturation X-ray diffractograms of smectite basal peaks after K+/300°C/E.G. treatment DTA curves of four smectite-mudstone clay fractions Representative DTA, TGA and DTGA curves of smectitemudstone clay fractions Micrograph of sample C7 heavy sand fraction Micrograph of sample Ll4 heavy sand fraction Micrograph of sample S2 heavy sand fraction Micrograph of sample SB heavy sand fraction Micrograph of Paoanui red smectite-mudstone heavy sand fraction Micrograph of sample SB light sand fraction
Scatter plots of %K20 against other variables in smectite-mudstone clay fractions Scatter plot of ppm Sr vs %Caco 3 in smectitemudstones
Trace element abundances in smectite-mudstones normalised against the mean shale-carbonate abundances Scatter plots of trace element concentrations in smectite-mudstones and associated lithologies
83
83 85
88
88
89
89
90
98
104
105 109
114 118 118 120 120
122 122
130
140
158
160
l
ABSTRACT
Marine smectite-mudstones of Lower Tertiary age (Teurian to Runangan)
occur throughout the East Coast Deformed Belt of New Zealand. In
Marlborough, Marl lithofacies of the Amuri Limestone comprise calcareous,
siliceous smectite-mudstone alternating with biomicrite. In Wairarapa,
the Kandahar Formation consists of calcareous smectite-mudstone, micritic
limestone beds and mass-flow greensand beds; Calcareous smectite-mudstone
is also a minor interbedded lithology in the Mungaroa Limestone of
Wairarapa. The Wanstead Formation in Hawkes Bay comprises uncemented
smectite-mudstone with interbedded mass-flow greensands. Lower Tertiary
sequences throughout the East Coast Deformed Belt are typically
disrupted by thrust faults and associated shear/melange zones which have
developed in the weak smectite-mudstone lithology.
Insoluble clay fractions of the smectite-mudstones are composed of well
crystallised sme.ctite + illite ±_ quartz (chert). Both the smectite and
illite clays are discrete phases with no interstratification suggestive
of post-sedimentary transformation of smectite to illite. From detailed
phase analysis, the smectite clay overall is a montmorillonitic species,
but with varying interstratification of other dioctahedral smectite
species and varying layer charge. No distinct stratigraphic trends in
clay fraction mineralogy or smectite mineralogy are apparent. Sand
fractions of the mudstones are dominated by authigenic or non-volcanic
detrital minerals.
Average smectite + illite structural formulas calculated from chemical
ana~yses are commonly non-ideal, with deficiencies in aluminium
particularly apparent. The dominant exchangeable cations are calcium in
Marlborough mudstones and sodium in Hawkes Bay mudstones. Trace
element geochemistry of the smectite-mudstones is similar to that of
typical shale and carbonate rocks. Variations in trace element
abundances· reflect the lithological character of the mudstones and do
not appear to be a useful tool for regional stratigraphic correlation.
Combined sedimentological, mineralogical and geochemical features of the
smectite-mudstones indicate a non-volcanic origin. They did not form
by in-situ alteration of ash-falls and are unlikely to have formed from
transported/reworked ash. Previous use of the term 'bentonite' for the
sme~tite-mudstones implies such a mode of genesis and should be
or not (e.g. Schultz, 1963). Despite efforts to redefine
bentonite on a mineralogical basis only (e.g. Wright, 1968;
Roen and Hosterman, 1982), the 'bentonite = volcanic origin'
concept is firmly entrenched in the geological literature.
In New Zealand, a volcanic origin for the mudstones has often
been assumed when the term bentonite has been used, although
most authors in practice based their usage on either the field,
commercial or mineralogical descriptions of bentonite. Only
Fyfe (1934) and Ritchie (1962) discuss the evidence of
a volcanic origin (see Chapter 6). The currently accepted view
on the origin of the mudstones is summarised by Grim and Guven
(l978) p.115:
"In view of the abundant volcanic activity in
New Zealand, it is not surprising that bentonites
have been reported in many areas".
In this study, the term 'smectite-mudstone' is used to avoid the
genetic connotations of 'bentonit§'.
7
2.1 INTRODUCTION
CHAPTER TWO
FIELD GEOLOGY
Lower Tertiary smectite-mudstones occur in the structural/tectonic
zone known as the East Coast Deformed Belt (Sporli, 1980) which
extends from Marlborough to East Cape. The belt and its main
features are shown in Fig. 2.1.
The mudstones are part of a widespread east coast marine sequence
of Upper Cretaceous to Oligocene age, which is characterised by
fine grain-size and siliceous and carbonate lithologies. The
sequence reaches a maximum thickness of not more than 1500 metres
in Marlborough (Prebble, 1980). This condensed sedimentary
succession represents a quiescent period of marine transgression
in Upper Cretaceous and Lower Tertiary time. Relief on land is
inferred to have been subdued (Suggate et al., 1978;
8
Pettinga, 1982), with the supply of terrigenous detritus to the
marine environment being much reduced in both volume and grain-size.
As a result, broad patterns of chemical/biogenic marine
sedimentation predominated, particularly in Marlborough where the
Arouri Limestone is a widespread unit. Coarser grained sandstone
lithologies in the sequence contain glauconite and are considered
AUSTRALIAN PLATE
arlborough ,..--
PACIFIC PLATE
O 100km .. -=
N
t
Figure 2.1: The East Coast Deformed Belt and major elements of the present-day plate boundary system (after Suggate et al, 1978; Walcott, 1978) .
9
to have been remobilised within the marine environment (Waterhouse
and Bradley, 1957; Pettinga, 1980).
10
The present day distribution of the smecti te.-mudstones is largely
controlled by the structural features of the East Coast Deformed
Be.l t which reflect late Cenozoic plate-margin tectonics (Fig. 2 .1) .
Subduction under the North Island has resulted in a dominance of
thrust faults in Wairarapa and Hawkes Bay. Many of the thrusts
have developed in the weak smectite-mudstone lithology (Pettinga,
1980, 1982). The subduction complex in the north changes to a
transform boundary in the. South Island. North-east trending
dextral shear faults are the main structural feature in
Marlborough and Cretaceous-Tertiary rocks are preserved in narrow
fault-bounded zones which are internally thrust-faulted and folded
(Prebble, 1980).
Fieldwork was carried out primarily in Marlborough, and later
extended to the North Island areas of Wairarapa and Hawkes Bay.
Fieldwork involved stratigraphic description and detailed
sampling at various localities. Fresh samples were excavated
where possible. General field mapping was not attempted and
geological maps made by previous workers are utilised to show
sample localities. Representative samples are held by the
Geology Department, University of Canterbury and their University
of Canterbury numbers are listed in Appendix I. The field
numbers of samples are used within the thesis. The geology of the
smectite-mudstones in Marlborough, Wairarapa and Hawkes Bay is
discussed in the following sections.
11
2.2 MARLBOROUGH
2.2.1 General Geology
The geology of Marlborough comprises basement rocks of Jurassic
and Lower Cretaceous age overlain by Upper Cretaceous and Tertiary
cover strata which include the smectite-mudstones (Prebble, 1980)
The general distribution of basement and cover rocks is shown in
Fig. 2. 2.
Upper Cretaceous and Tertiary sequences are preserved on the
downthrown side of each of the major dextral shear faults
(Awatere, Clarence, Kekerengu and Hope faults) in the region.
Two major areas of Lower Tertiary outcrop occur (Fig. 2.2):
(l) the prominent Benmore Anticline structure,
where a thick thrust-faulted and folded
cover sequence is wrapped around a basement
core (Prebble, 1976, 1980).
(2) an extensive fault-bounded northeast-south
west trending block in the Clarence Valley.
Fieldwork was carried out in the Kekerengu, Coverham and Middle
Clarence Valley areas. General sample localities are shown in
Fig. 2.2 and listed in Table 2.1.
The Kekerengu area has been mapped by Prebble (1976) and the
geology of the adjoining Coverham area to the west was described
by Hall (1964). Further southwest in the Middle Clarence Valley,
Cretaceous and Tertiary outliers were mapped by Reay (1980).
N
t
O==:JX)km
D
l<ekerengu River
Middle Clareixe Volley
Seymour Stream
Figure 2.2: Generalised geology of Marlborough (after Lensen, 1962).
~ ~
LEGEND
Undifferentiated Upper Tertiary and Quaternary
Lower Tertiary Amuri Limestone
Mesozoic
0 5 10 15 20km -----===== .... --...i::::==~
N
r
13
Table 2.1: Marlborough Sample Localities
Area Locality
(1) Woodside Creek, lower and upper
Kekerengu gorges
(2) Upper Ure River
( 3) N.E. end of Chalk Range Cover ham
( 4) Mead Stream gorge
( 5) Bluff Stream
Middle (6) Seymour Stream
Clarence Valley ( 7) E. edge Fells Basin
( 8) Limestone Hill
The smectite-mudstones in Marlborough are stratigraphically
included by previous workers in the Amuri Limestone, which was
first described by Hutton (1874) from Haumuri Bluff where the
lithology is thinly-bedded micritic limestone. The Amuri
Limestone name has since been applied to similar fine-grained
calcareous lithologies which are widespread throughout
Marlborough (Fig. 2.2) and form a major part of the Tertiary
column, spanning the Dannevirke and Arnold Series. The
nomenclature and status of the Amuri Limestone have not been
formalised and are currently under review by the N.Z. Geological
Survey.
This thesis follows the informal stratigraphic subdivision of the
Amuri Limestone into seven units by Hall (1964) and Prebble (1976)
for the Coverham and Kekerengu areas respectively and the
14
stratigraphic description of Reay (l980) for the Middle Clarence
Valley. The member terminology used by these workers is not used
here however, due.to pending formalisation of the nomenclature.
Summary stratigraphic columns for the Arouri Limestone in Kekerengu/
Coverham and the Middle Clarence Valley are presented in Fig. 2.3
and columns for sample localities are given in Fig. 2.4.
Smectite-mudstones form two units in the Arouri Limestone in the
Kekerengu and Coverham areas, known as the Lower Bentonite and the
Upper Bentonite (Hall, 1964; Prebble, 1976). In this thesis, the
names Lower Marl and Upper Marl are used, which more closely reflect
their calcareous mudstone lithology. The Marls are on the order of
50-100 metres thick and have conformable gradational contacts with
the Lower Limestone, Middle Limestone and Fells Greensand units of
the Arouri Limestone (Fig. 2.3).
Microfossil dating of the Marls gave age ranges of Waipawan to
Heretaungan for the Lower Marl and Porangan to Runangan for the
Upper Marl (see Appendix II and sample locality maps). These ages
are in general agreement with previous respective determinations
of Mangaorapan to Heretaungan and Porangan to Runangan (Prebble,
19761. However, a condensed sequence in lower Woodside Creek
yielded older ages of Teurian to Waipawan for the Lower Marl and
Mangaorapan to Heretaungan for the Upper Marl (Prebble, 1976).
The Marls are a relatively weak lithology in the Upper Cretaceous
Tertiary succession and are cormnonly disrupted by major thrust
faults. Consequently the Marls are characteristically highly
sheared with complex internal faulting and folding.
AMURI LIMESTONE, COASTAL MARLBOROUGH
Lw Wai ma Siltstone
--
Lwh-Lw Whales Back Limestone
Ar-Lwh Fells Greensand
Op-Ar Upper Marl
Oh-Ab Middle Limestone
Amuri Limestone
~-
Ow-Oh Lower Marl ~--
Ow Lower Limestone
Mh-Dt Flint Beds
--------------------
Mh Whangai Shale
1:0 J
AMUR! LIMESTONE, PART OF
THE MIDDLE CLARENCE VALLEY
lwh -------Op- Ab Grass Seed Volcanics
Marl
I0t-Dw Baso.l Limestone ------------
Ow
Cookson Volcanics
Amuri Limestone
Dip Basin Green sand
Figure 2.3: Schematic summary stratigraphic columns of the Arnuri Limestone in coastal Marlborough (after Prebble, 1976) ~ and in part of the middle Clarence Valley (after Reay, 1980). ~
Figure 2.4: Schematic summary stratigraphic columns of the Marl units of the Arouri Limestone in Marlborough. See Appendix II for dated samples.
In the Middle Clarence Valley, only one Marl unit is mapped
(Figs 2.3, 2.4) which occurs in the Seymour Stream outlier and
ranges in age from ?Teurian to at least Porangan (Appendix II)
An upper age of Bortonian is given by Reay (1980). The Marl
constitutes almost the entire thickness of the Arouri Limestone
of approximately 100 metres and has a gradational lower contact
with a 10 metre thick basal limestone unit. The upper contact of
the Marl with overlying Cookson Volcanics of Whaingaroan age is a
sharp disconformity (Reay, 1980).
The Arouri Limestone in the Middle Clarence Valley also contains a
localised unit known as the Grass Seed Volcanics (Reay, 1980)
17
which occurs in the Limestone Hill outlier. The Grass Seed
Volcanics is Arnold Series in age (Reay, 1980) and does not occur
together in stratigraphic sequence with the Marl unit with which it
is partly time-equivalent.
2.2.2 Local Stratigraphy and Sedimentology
The Marls of the Arouri Limestone have very similar lithology and
internal stratigraphy throughout the Marlborough region and a
description is given below which applies to the sample localities
discussed in the following sections unless otherwise stated.
The typical lithology of the Marls is alternating green, soft to
moderately indurated, calcareous smectite-mudstone (marl) and
white-green, well indurated biomicrite (Figs 2.5 and 2.6).
Recognition of alternating marl-limestone sequences in the field
requires that carbonate and mud contents oscillate around the
transition line between marl and limestone at approximately 70%
carbonate and 30% mud (Einsele, 1982). Carbonate contents
determined for marl beds range from 30% to 67% (Appendix III) and
Figure 2.5: Interbedded calcareous smectite-mudstone and micritic limestone, west bank of Seymour Stream, Middle Clarence Valley.
Figure 2.6: Interbedded calcareous smectite-mudstone and micritic limestone, south bank of Mead Stream gorge.
18
the limestone beds (>67% caco 3 ) yielded acid-insoluble mud
residues. The only cormnon sedimentary structure in the Marls
is burrows, including zoophycos trace fossils. The contacts
between marl and limestone beds are gradational, although sharp
contacts are common where the marl beds are highly sheared as a
result of bedding-plane slip. The less cemented marl beds
(CaC0 3 <50%) invariably show some degree of development of a
fissile shear fabric approximately parallel to bedding.
In more highly calcareous marl beds, a platy fracturing may be a
result of both sedimentary/diagentic processes and shear
deformation. Very intense deformation along major faults trans
forms the marl into soft plastic clay, such as at Blue Slip on
the Kekerengu coast.
The Marls have a characteristic internal three-part stratigraphy
(Fig. 2.7). The basal and top sections of the Marls consist of
regularly alternating marl and limestone beds 10-30 cm thick, with
an overall increase in the thickness of the marl beds towards the
centre of the unit. The middle interval consists of more massive
marl in bands up to several metres thick with intermittent
interbedded limestones.
(1) Woodside Creek. Sequences through the Marls occur in both
the lower and upper gorges of Woodside Creek and are separated by
a major thrust fault (Fig. 2.8).
A typical section through the Marls is exposed in the upper gorge
and the geology and sample locations are shown in Fig. 2.8. The
Lower Marl is approximately 80 metres thick and is relatively
undeformed. The typical regularly alternating marl-limestone
lithology near the basal contact of the Lower Marl with the Lower
19
Figure 2.7: Typical internal stratigraphy of the Marls. Lower Marl, northeastern end of Chalk Range, looking north.
Figure 2.9: Alternating marllimestone at the base of the Lower Marl, south bank of Woodside Creek upper gorge.
20
LEGEND
jWaiS I Waima Siltstone
j WBL J Whales Back limestone
~ Fells Greensand
• Upper Marl
~ Middle Limestone
Lower Marl
~ Lower Limestone
~ Flint Beds
~-Whangai Shale
~ Woodside Formation
___-, Formation Boundary
,,,.,.- Fault
~~ Coastline
? River stream
~ Road
W1 • Sample localities
O 250 500 750 1000 m
Figure 2.8: The geology of Woodside Creek, (from Prebble, 1976) and sample localities.
21
Limestone is shown in Fig. 2.9. The thickness of the Upper Marl
is uncertain due to thrust-fault repetition and complex internal
deformation. The Upper Marl in the upper gorge of Woodside
Creek is exceptionally calcareous with Caco3 contents greater
than 60% (WlO, Wl3, W14).
The sequence through the Marls in the lower gorge of Woodside
Creek is considerably thinner and older than at other localities
in the Kekerengu and Coverham areas and structural complexities
are apparent. Approximate thicknesses are 20 metres for the
Lower Marl and 40 metres for the Upper Marl. The Marls are
separated by the Middle Limestone which at this locality is red
purple in colour. The Upper Marl is overlain by the Waipawan to
Heretaungan Woodside Formation (Prebble, 1976) consisting of
alternating graded glauconitic sandstones and dark mudstones.
The contact appears to be gradational with some sandy glauconitic
limestone beds occurring towards the top of the Upper Marl. A
similar interbedded sequence of glauconitic calcareous sandstone,
micritic limestone and marl occurs at the head of Te Rapa Stream.
22
(2) Upper Ure River. As in upper Woodside Creek, the Ure River
section consists of a complete relatively undeformed sequence
through the Lower Marl (70 metres) and a fault-disrupted Upper
Marl sequence (Fig. 2.10). Approximately 15 metres of deformed
Upper Marl is present beneath a sharp thrust fault contact with
Middle Limestone. At the base of the Upper Marl, a graded 1 metre
thick bed was observed, comprising silty limestone with parallel
lamination and rare cross lamination defined by concentrations of
darker coloured mud, which grades up with increasing mud component
into marl (U7, US). Similar graded beds were described by
Prebble (1976) from the Upper Marl.
~ I/ !wsL I
~
@]
U9
N
vvvvvvvtv vvvvvvvvv
vvvvvvvvv vvvvvvvvv vvvvvvvv
v Blue Mountain v v Station v v v v
v • v v v
~iz,i,~~,u~·~~,~~~~·~
LEG ENO 0 250 500 750 1000m
Cookson Volcanics
Whales_ Bad~ limestone
Upper Marl ~ Formation Boundary
Middle Limestone _,,,,,.,. Fault
Lower Marl ·~ River, stream
Lower Limestone U1 • Sample localities
Figure 2.10: The geology of the upper Ure River (from Prebble, 1976) and sample localities.
23
(3) Northeastern end of Chalk Range. The basal four units of
the Arouri Limestone form a prominent strike ridge in the Coverham
area known as the.Chalk Range (Fig. 2.11). The Lower Marl is
exposed in the steep scarp slope of the Chalk Range just below
24
the summit and crosses over the summit at the northeastern end of
the range (Fig. 2.12). A detailed section through the well-exposed
Lower Marl at this locality is given in Fig. 2.13. The Upper
Marl {Cll-Cl9} occurs on the dip-slope side of the Chalk Range.
Occasional exposures indicate a high degree of deformation in the
Upper Marl (Fig. 2.14). The Upper Marl is overlain by Fells
Greensand and Whales Back Limestone - the latter forming Whales
Back ridge immediately north of the Chalk Range. The gradational
contact of the Upper Marl with the Fells Greensand is exposed in
the scarp slope of Whales Back ridge (Fig. 2.15) and consists of
5-10 cm thick beds of laminated glauconitic calcareous sandstone
(Cl2) which grade up into marl beds less than 5 cm thick.
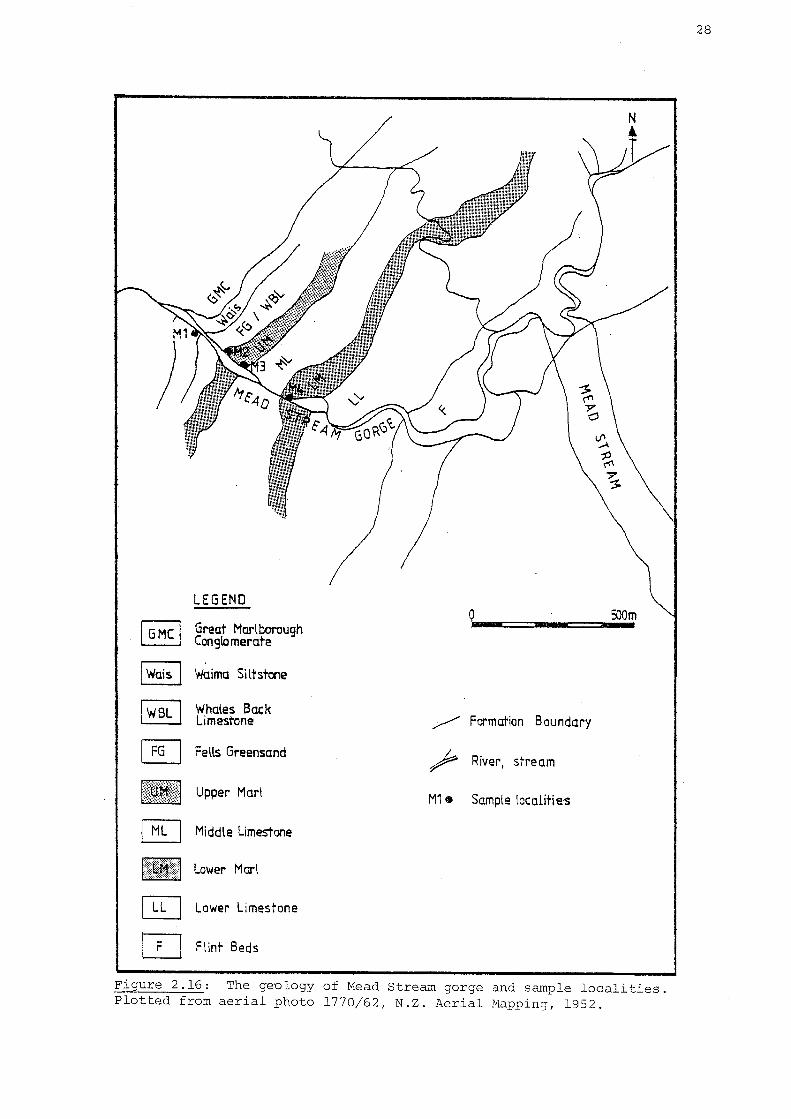
(4) Mead Stream Gorge. A well exposed complete section through
the Arouri Limestone occurs in the gorge of Mead Stream (Fig. 2.16)
Relatively undeformed sequences through both the Lower and Upper
Marls are present, although the contact of the Upper Marl with
overlying glauconitic sandy limestone (Fells Greensand/Whales Back
Limestone?) is uncharacteristically sharp and is probably a
bedding plane fault. Approximate thicknesses are 60 metres for
the Lower Marl and 80 metres for the Upper Marl. The typical
lithology and internal stratigraphy of the Marls are illustrated
in Fig . 2 .17 .
(.5) Bluff Streai.-n. A syncline of Upper Cretaceous-Lower Tertiary
rocks is exposed in lower Bluff Stream. Approximately the basal
50 metres of the Arouri Limestone forms the core of the syncline
Figure 2.11: View of part of the Chalk Range in the middle distance, looking northwest. The Lower Limestone, Lower Marl and Middle Limestone are exposed.
Figure 2.l2: The Lower Marl (60 metres thick) exposed at the northeastern end of the Chalk Range, looking northeast.
25
NZ FR F Sample Stage no. no. m
(9110 60
so
:z < I..::> 40 z :::)
< I-u..l a: w 30 C,8 ::i::
C,7
:z <(
20 3 < a.
C,6 < 3 C4,5
10 P29/ C1, 2 n,a
C3
LOWER MARL CHALK RANGE
P29 /850204
u.J :z
i.uO ...JI-
20-30cm bedded Cl l/l ClUJ
lime stone _z: Z:::J
20·50cm bedded limestone with some 5·30cm marl interbeds
20-50 cm bedded alternating marl limestone
_, er: <( z:
a: w 3
Massive-marl 0 ..J with occasional 10 cm limesrone interbeds
1-L.--.--1-.--i.....-..i....,.--'--,--.._,._._.,......... 2 0 -3 0 c m 3 ~ 0-
bedded limestore..J....J
I.U
z 0
I-
l/l
,. l.u
~
..J
Cl!
:::)
z: <(
Figure 2.13: Schematic detailed stratigraphic column of the Lower Marl at the i:i,ortheastern end of the Chalk Range.
26
Figure 2.14: An exposure of highly sheared Upper Marl on the dip-slope side of the Chalk Range, looking west.
Figure 2.15: Whales Back ridge capped by Whales Back Limestone and underlain by Fells Greensand and Upper Marl, looking north.
27
LEGEND
I GMC I Great Marlborough Conglomerate
I Wais r Waima Siltstaie
I 1HBL I Whales Back Limestone
@] Fells Greensand
Upper Marl
~ Middle Limestone
- Lower Mar\
~ Lower Limestone
QJ Flint Beds
/ Formation Boundary
~ River, stream
M1 • Sample localities
':OOm •
Figure 2.16: The geology of Mead Stream gorge and sample localities. Plotted from aerial photo 1770/62, N.Z. Aerial Mapping, 1952.
28
Figure 2.17: Lower Marl comprising alternating marl-limestone and a middle interval of massive marl, north bank of Mead Stream gorge.
Figure 2.18: Folded and faulted Marl unit, west bank of Bluff Stream.
29
--
and comprises flinty micritic limestone (Bl) of Haumurian age
overlain with conformable and gradational contact by a (Lower?)
Marl unit (B4) shown in Fig. 2.18. Tight internal folding
characterises the Amuri Limestone at this locality.
(6) Seymour Stream. A section through the folded Upper
Cretaceous-Tertiary sequence of the Lower Seymour outlier is
exposed in Seymour Stream. Fig. 2.19 shows the detailed geology
and sample localities for both Seymour Stream and the Fells Basin
(see below). The Arouri Limestone is represented by one Marl unit
exposed on the eastern bank of Seymour Stream. The Marl consists
of basal alternating marl-limestone beds which are overlain by a
thick massive interval of moderately soft smectite-mudstone with
Caco 3 contents around 40% (Sl, 82) and which is eroded into
pinnacles (Fig. 2.20). The massive marl is truncated by a sharp
disconforrnable contact with overlying Cookson Volcanics.
(7) Eastern edge Fells Basin. Further exposure through the
Lower Seymour outlier sequence occurs to the west of Seymour
Stream in the Fells Basin (Fig. 2.19). A 100 metre section
through the Marl very similar to the section in Seymour Stream,
is well exposed on the steep eastern slope of the Fells Basin
(Fig. 2.21). A detailed stratigraphic column for the Marl is
given in Fig. 2.22.
30
(8) Limestone Hill. The P..muri Limestone in the Limestone Hill
outlier contains the Grass Seed Volcanics. The geology of the
Limestone Hill outlier is shown in Fig. 2.23. The Grass Seed
Volcanics unit CL3, L5) re-aches a maximum thickness of 160 metres
(Reay, 1980) in the vicinity of Grass Seed Stream and consists of
fine-grained basaltic tuff containing clasts of basalt up to
0 500 1000 m LE GENO
G2] Upper Tertiary --- Formation Boundary
~ Lower Tertiary ~ Fault Amuri limestone ;;;;--
[Q Cretaceous ~ Thrust Fault
+ .A.nticline Fold Axis ~ River stream
• S1 Sample Loe aliti es ~ Syncline Fold Axis
Figure 2.19: The geology of the Lower Seymour outlier (from Reay, 1980) and sample localities.
31
Figure 2.20: Massive marl lithology, east bank of Seymour Stream.
Figure 2.21: Marl unit (-100 metres thick) comprising basal interbedded marl-limestone and massive marl, eastern edge Fells Basin, looking north.
32
.. '
A MURI LIMESTONE FELLS BASIN 031 / 417 844
NZ FRF Sample Stage No. No.
1--~~--1-~~--1~~--.m
z <( I.!)
z <(
0::: 0 a. I
z <(
0::: :::) UJ I-c-,..
031 / t 145
031 / f 146
S 13
90
30
vvvvvvv vvvvvvv
vvvvvvv Tuff
Massive marl with occasional S-20cm limestone interbeds
...J a:: < l:
Dem bedded /...J 1-'-.,...._ ......... ...,_,_......,_~c..,......-,-J'--,--'-,-....._. l i m esto n e ~ t:i ~.L..,-J'-,-1-,-1..,....J...,.....l-,....L.,....L.,_.!...-,-1..-.-1 <...J 1-'--r-'-,--'-,--'-T-....,..;.-,-J-.,....c-,........_-,-J-...,.......~ cQ
Greensand
v, _u =-oz v, <( :::.::u O....J oo u>
UJ
z 0
f-
v,
1.1.J
l:
.....
...J
a::
Figure 2.22: Schematic detailed stratigraphic column of the Arouri Limestone on the eastern edge of Fells Basin.
33
34
N
t
1000m
,. _. ...... - Formation Boundary
LEGEND .-,,,.--- Fault
@iJ Up per Tertiary -\- Anticline Axis
jv/v\vl Grass Seed } Lower Tertiary x Syncline Axis Volcanics
~ Limestone Amuri
~ River, stream lime stone
IT] Cretaceous • L 1 Sa.mpl e Localities
Figure 2.23: The geology of the Limestone Hill outlier (from Reay, 1980) and sample localities.
boulder size and occasional lenses of marly micritic limestone
(L4). The Grass Seed Volcanics is underlain by marly micritic
limestone (Ll) but a well developed Marl unit was not observed
at the Grass Seed Stream locality.
2.3 WAIRARAPA
2.3.1 General Geology
35
Smectite-mudstones in Wairarapa occur in faulted Upper Cretaceous
Lower Tertiary sequences along the eastern coast of the region.
The Tora area was mapped by Waterhouse (1955) and the geology
summarised by Waterhouse and Bradley (1957). To the north, the
· Mt Adams, Flat Point and Tinui-Awatoitoi areas have been mapped by
Eade (1966), van den Heuvel (1960) and Johnston (1980) respectively.
ThBre are no reported complete stratigraphic sections through the
smectite-mudstones as a result of faulting and poor exposure. The
best stratigraphic sections occur in the Tora area (J.R. Pettinga,
pers. comm.) where fieldwork for this study was carried out.
A geological map for the Tora area is given in Fig. 2.24. A
sequence of Upper Cretaceous-Lower Tertiary rocks occurs on the
western limb of an anticline trending approximately parallel to
the coast. The sequence is exposed in the stream sections cutting
across the structure. The localities visited were: Awheaiti
Stream, Pukemuri Stream, Oroi Stream and Mungaroa (Te Kau Kau)
Point. A summary stratigraphic column for the Pukemuri Stream
locality is given in Fig. 2.25.
Smectite-mudstones form the youngest unit in the area named the
Kandahar Formation (Waterhouse, 1955; Waterhouse and Bradley, 1957).
HUNGAROA POlt-H
LEGEND
1111 Kandahar Formation
I'·\(} I Pul<e muri Siltstone
~ Mungaroa Limestone
D S st I M st lithologies
~ Whangai Formation
... --~
WAt•
-r --=-,......_~ ..,... __ :::::
Formation Boundaries
Rives stream
Sample Localities
Thrust Fault
Anticline Axis
Shear Zone
Figure 2.24: The geology of the Tora area, southeast Wairarapa (from Waterhouse and Bradley, 1957) and sample localities.
36
PUKE MURI
Om-Oh
metres
0
so
100
STREAM
Large blocks of interbedded
greensand, marly limestone
and smectite - muds tone in
a matrix of soft highly
sheared smectite - mudstone.
Thinly bedded greensands
and marly limestones
interbedded with calcareous
smectite-mudstone
? Slump unit of clasts of light green sm ectite -mudstone in a dark brown siltstone matrix
Laminated dark brown
z 0
lo-< ::z: a:: 0 u.
a:: < J: <(
a :z <(
~
siltstone containing exotic clasts,
Figure 2.25: Schematic summary stratigraphic column of the Kandahar Formation in Pukemuri Stream. See Appendix II for dated sample.
37
An age range of Heretaungan to Bortonian is given by Waterhouse
and Bradley (.195 7) for the Kandahar Formation. Microfossil
dating in this study gave a similar range from Mangaorapan
Heret.aungan to Bortonian (Appendix II). However, stratigraphic
control on the samples was poor as the Kandahar Formation is
extremely complexly deformed. The formation has an upper west
ward-dipping thrust fault contact with Lower Cretaceous rocks and
much of what has been previously mapped as the Kandahar Formation
is essentially a major shear zone in which occasional blocks of
coherent bedded lithology are preserved. The Kandahar Formation
is underlain by the Pukermuri Siltstone. The contact between the
two formations is obscure, but probably sedimentary.
Waterhouse and Bradley, 1957).
(See also
38
A lithological correlative of the Arouri Limestone named the
Mungaroa Limestone (Waterhouse and Bradley, 1957) occurs as part
of the Upper Cretaceous-Lower Tertiary sequence in the Tora area.
Smectite-mudstones are a minor component of the Mungaroa Limestone
and occur as thin partings·between limestone beds. A sample of
the smectite-mudstones from Mungaroa Point yielded a Teurian age
(Appendix II). Waterhouse and Bradley (1957) described a
foraminiferal assemblage containing Cretaceo-Tertiary elements
from Mungaroa Point but considered the assemblage to be
redeposited. Subsequent revisional and additional work however
does not support redeposition (Browne, in prep). The Mungaroa
Limestone thins rapidly northwest from a maximum thickness of
approximately 100 metres at Mungaroa Point and passes laterally
into Lower Tertiary alternating sandstone and mudstone lithologies
(Waterhouse and Bradley, 1957).
2.3.2 Local Stratigraphy and Sedimentology
(1) Pukemuri Stream. Pukemuri Stream provides the best exposure
through the Kandahar Formation. The inferred stratigraphic
thickness is of the order of several hundred metres but the upper
contact is faulted and the internal stratigraphy is highly
disrupted by shear deformation. The contact between the
Kandahar Formation and the underlying Pukemuri Siltstone appears
39
to coincide with an olistostrome or slump unit in which light green
clasts of the Kandahar Formation, up to several metres in size,
occur within a matrix of dark brown Pukemuri Siltstone. Further
detailed mapping would be required to establish with certainty the
relationship between the two formations. The Pukemuri Siltstone
is also characterised by the occurrence of exotic pebbles and
boulders from underlying formations and large bedded blocks of
sandstone, indicating substantial redeposition. (See also
Waterhouse and Bradley, 1957).
The dominant lithology of the Kandahar Formation is a highly
sheared soft green smectite-mudstone which forms a matrix to large
floater blocks in which the sedimentary features of the Kandahar
Formation are preserved. Glauconitic sandstone is a common
lithology interbedded with calcareous smectite-mudstone (Fig. 2.26)
The sandstone beds are often channelised with a coarse granular
base composed largely of glauconite and rip-up clasts of mudstone.
Parallel and cross lamination structures occur in the upper
portions of the sandstone beds and gradation up into dark brown
grey smectite-mudstone is typical. The dark mudstone then passes
gradationally up into light green calcareous smectite-mudstone.
The sandstone beds are generally less than 10 cm thick and the
smectite-mudstone beds are up to 50 cm thick. The carbonate
Figure 2.26: Interbedded glauconitic sandstone, marly limestone and smectite-mudstone in the Kandahar Formation, Pukemuri Stream.
Figure 2.27: Alternating marllimestone lithology of the basal Kandahar Formation, west bank of Awheaiti Stream.
40
41
content of the mudstones is variable, reflecting a range of
lithologies from soft plastic mudstone to well cemented marl.
Moderately cemented marls range from 30-40% Caco 3 (WPl, WP2, WP3).
(2) Awheaiti Stream. The Kandahar Formation in Awheaiti Stream
shows several additional features to those described from Pukemuri
Stream.
Red coloured smectite-mudstone occurs near the base of the
formation, mixed with green smectite-mudstone and both are highly
sheared. The red colouration appears to be a secondary alteration
feature (see also Waterhouse, 1955). The basal part of the
Kandahar Formation in Awheaiti Stream also includes thinly-bedded
packets of alternating green marl and chalky white limestone
(Fig. 2 .27). The Caco 3 content determined for one marl bed (WA3)
is 56.5%. Occasional exotic angular pebbles of a fine-grained
carbonate lithology (cf Mungaroa Limestone) occur in both sandstone
and smectite-mudstone beds of the Kandahar Formation.
(3) Mungaroa Point. The Mungaroa Limestone is well exposed in
the shore platform at Mungaroa Point and consists of interbedded
micritic limestone, marl and laminated calcareous glauconitic
sandstone. Non-calcareous glauconitic sandstone diapirs also
occur. The Marl is present as thin interbeds less than 5 cm
thick between limestone and sandstone beds up to 30 cm thick
(Figs 2.28, 2.29).
Figures 2.28, 2.29: Thin sheared marl interbeds in the Mungaroa Limestone, Mungaroa Point shore platform.
42
2.4 HAWKES BAY
2.4.1 General Geology
The smectite-mudstones of southern Hawkes Bay occur in three
structural highs comprising Cretaceous and Paleogene rocks, as
shown in the generalised geological map in Fig. 2.30. Sampling
of the mudstones was mainly restricted to the Coastal High with
the best exposure. The main sample localities are: Waimarama
Beach, Waewae Stream, the coastal slope near Red Island, and the
bentonite quarry near Porangahau.
43
Detailed geological mapping in southern Hawkes Bay has been carried
out by Lillie (1953), Kingma (1971) and Pettinga (1980). The
smectite-mudstones are stratigraphically included in the Wanstead
Formation - a name applied by Lillie (1953, p.36) to "soft beds
of clay-like character overlying the Whangai beds" and ranging in
age from Teurian to Bortonian. Later workers in Wairarapa, who
encountered a greater variety of Lower Tertiary lithologies,
adopted a Wanstead Group status (Waterhouse and Bradley, 1957;
van den Heuvel, 1960; Eade, 1966; Johnston, 1980). Pettinga (1980)
renamed the smectite-mudstones in southern Hawkes Bay as the
Mackintosh and Raratu Formations without reference to a Wanstead
Group. In view of the need for clarification of the stratigraphic
nomenclature (which at the time of writing is in progress), the
Wanstead Formation name of Lillie (1953) is retained in this study.
The distribution of the Wanstead Formation smectite-mudstones in
coastal southern Hawkes Bay is closely related to the complex
structure dominated by thrust faults. No complete unfaulted
sections through the Wanstead Formation occur and only the basal
part of the formation exposed at Waimarama Beach and Waewae
Figure 2.30: Generalised geology of southern Hawkes Bay (from Pettinga, 1982).
S km
44
N
t
Stream is stratigraphically coherent. Summary stratigraphic
columns for these two localities are presented in Fig. 2.31.
Microfossil dating of the base of the Wanstead Formation gave
ages of Teurian and Waipawan-Heretaungan at the Waimarama Beach
and Waewae Stream localities respectively (Appendix II). These
ages indicate a conformable contact with the underlying Whangai
Formation of Haumurian-Teurian age (Lillie, 1953).
A characteristic mode of occurrence of the Wanstead Formation is
as a component of melange zones, which are tectonic mixtures of
different lithologies associated with thrust faults (Pettinga,
1980}. Sampling of unrecognised melange zones, particularly at
Porangahau, is a shortcoming of some previous mineralogical
studies (Gordon et al, 1955; Ritchie, 1962).
2.4.2 Local Stratigraphy and Sedimentology
45
(1) Southern End of Waimarama Beach. A stratigraphic section
through approximately 30 metres of the basal Wanstead Formation is
present at Waimarama Beach. The detailed geology is shown in
Fig. 2.32.
The contact of the Wanstead Formation with the underlying Whangai
Formation mudstone appears to be conformable and is distinguished
on the appearance of soft, relatively pure smectite-mudstone.
Clay mineralogical analysis of the top of the Whangai Formation
(HBlBl showed a major smectite component, but the Whangai
mudstone is well cemented by caco 3 (35%) and silica and is
lithologically distinct from the uncemented Wanstead mudstone.
metres 0
20
40
WAIMARAMA BEACH
W22 I 524451
Melange Zone
Thick and thinly bedded greensands alternating with thin sheared smectite- mudstones
Alternating greensond and dork mudstone
FAULT ____ _, <Cw l!J _.
Thinly bedded light z 4: and dork induroted ~ti mud stones 3
FAULT ____ __._ _ ___,
WAEWAE STREAM
V22/425308
FAULT
Shear zone
Thick and thinly bedded green sands alternating with sheared smectitemudstones and occasional marls
Thinly bedded Ii ght induroted mudstones
Figure 2.31: Schematic surmnary stratigraphic columns of the Wanstead Formation at the southern end of Waimarama Beach and in Waewae Stream (after Pettinga, 1980). See Appendix II for dated samples.
• D ' .
LEG ENO
w'anstead Formation
Whangai Formation
Und iff erenti ated Upper Cretaceous Formations
N
T
Bluff
0 100 200m
Formation Boundary
Thrust Fault
Melange Zone
•HB 11 Sample locality
Figure 2.32: The geology of the southern end of Waimarama Beach (from Pettinga, 1980) and sample localities.
47
The smectite-mudstones at the base of the Wanstead Formation
occur in beds up to 10 cm thick which alternate with
glauconitic sandstones in beds up to 1 m thick (Fig. 2.33). A
typical sedimentological cycle is shown diagrarrunatically in
Fig. 2.34. The internal features of the sandstone beds are
medium to very-fine size grading and parallel, cross and
convolute types of lamination which are defined by thin layers
48
of mud. Rip-up clasts of mudstone are occasionally present. The
sandstones have sharp basal contacts and gradatiqnal tops into
dark brown-grey smectite-mudstone. The dark mudstone in turn
grades up into light green smectite-mudstone. The mudstones, when
unsheared, show mottling resulting from bioturbation. Carbonate
analysis of the dark (HB15) and light (HB14) mudstones gave
contents of 7.6% and 2.3% respectively.
The basal Wanstead sequence at Waimarama Beach is cut by a
melange zone shown in Fig. 2.35, in which highly sheared smectite
mudstone forms a matrix to large exotic clasts. The melange has
a well-developed lozenge shear fabric and shear surfaces in the
mudstone matrix are highly polished and striated.
(2) Waewae Stream. A similar succession through the Wanstead
Formation to that at Waimarama Beach, is exposed in Waewae Stream.
The detailed geology is shown in Fig. 2.36.
The Wanstead Formation conformably overlies the Whangai Formation
and the basal 50 metres present comprises interbedded sheared
smectite-mudstone and glauconitic sandstone. The lithology and
sedimentology are very similar to that described at Waimarama
Beach, except the mudstone carbonate content is higher
(.e.g. Grim and Kulbicki, 1961; Schultz, 1969). The subspecies
nomenclature is not standardised and that used by Schultz (1969)
is referred to here. Table 4.7 summarises the DTA characteristics
and also the results of K+-saturation for montmorillonite
subspecies.
Table 4.7: Characteristics of Montmorillonite Subspecies (after Schultz, 1969)
Montmorillonite Dehydroxylation Decomposition First Exotherm K+-Saturation Subspecies 0 c 0 c 0 c Result
Wyoming 700-725 900+10 -950 Low-Charge
Otay 650-690 840+20 1000-1100 High-Charge
Tatatilla 710-730 Variable Variable High-Charge
Chambers 660-690 850+20 -900 High-Charge
113
The smectites in the mudstones do not match any subspecies very
well, as they generally have relatively low dehydroxylation and
decomposition temperatures but moderately high exotherm
temperatures. The Wyoming and Chambers montmorillonites however
appear to most closely resemble the smectites in the mudstones
and chemical analyses presented in Chapter 5 support this
interpretation.
Thermal gravimetric analysis CTGA) was run simultaneously with
DTA and measures the sample weight during heating. Differential
TGA was also carried out, showing the change in sample weight with
temperature. Representative TGA and DTGA curves are shown together
with a DTA curve in Fig. 4.21. The TGA curve for all the mudstone
samples consist of four segments:
(l) A steep slope up to -200°c corresponding
to rapid loss of interlayer water;
C2l 0 0 A gradual slope up to 450 - 500 C;
Ll) A steep slope up to -7oo0 c corresponding to
loss of structural hydroxyls;
(Al 0 A gradual slope up to -900 C after which no
further weight loss occurs.
The gradual slopes of segments (2) and (4) indicate that
dehydration and dehydroxylation reactions continue above their
main reaction temperatures. The DTGA curve closely resembles the
DTA curve up to -7oo0 c in all samples, showing that the marked
changes in weight correspond to dehydration and dehydroxylation.
Reactions above -7oo0 c are not accompanied by significant weight
changes.
0 OTGA
1
2
3 ( 1 }
4
~5 0 ....J
I- 6 ::r ':2 LU
-:,: 7 I-z LU
~a LU a.
9
10
11
12 200 400 600 800 1000 1200
TEMPERATURE oc
Figure 4.21: Representative Differential Thermal and Gravimetric Analysis curves (see text for explanation of TGA curve) of smectitemudstone clay fractions.
114
115
4.4 SAND FRACTION MINERALOGY
Sand-sized material is a very minor component in the bulk
smectite-mudstone samples, although samples of the Marl in the
Clarence Valley are relatively sandy in comparison to the other
units sampled. The mineralogy of 63-250µm fractions separated
from selected mudstones and further separated into heavy and light
fractions was determined by optical microscopy.
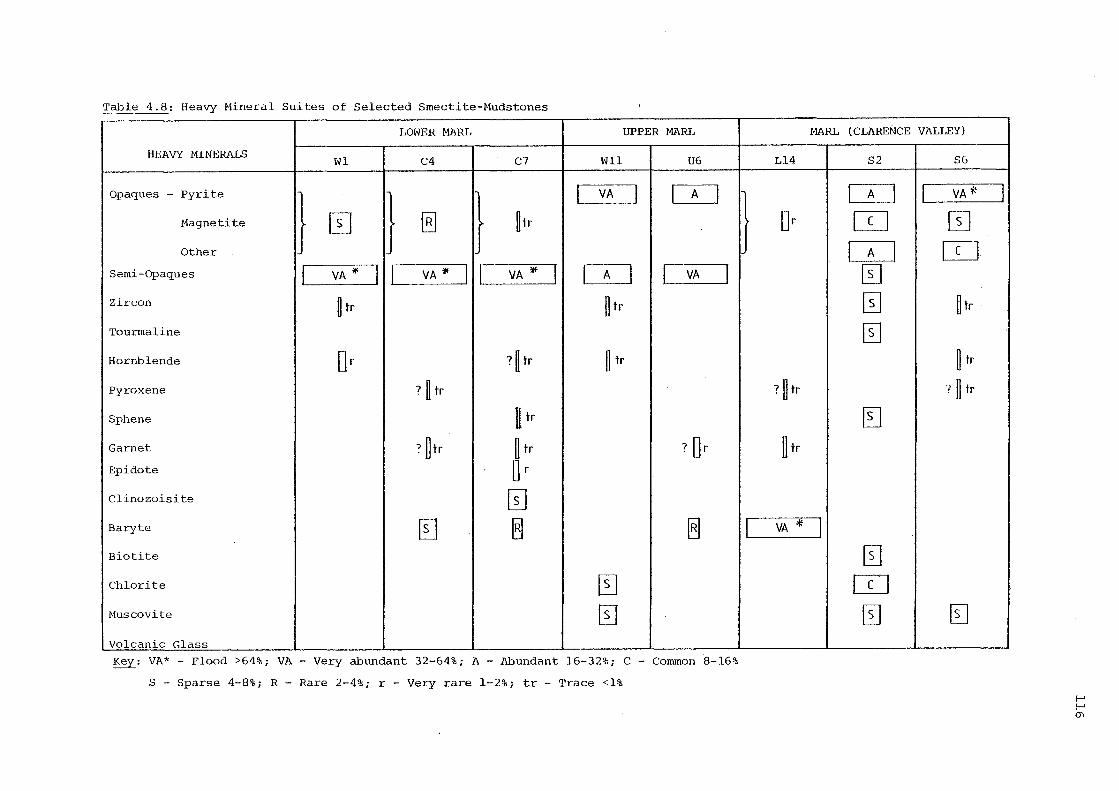
The mineralogy of the heavy fractions is summarised in Table 4.8
using a semiquantitative system developed by Dr D. Smale, N.Z.
Geological Survey. The samples analysed show a wide variation in
heavy mineral suites.
Samples from both the Lower and Upper Marls of the Arouri Limestone
are characterised by abundant semi-opaque material which is not
rnineralogically identifiable. Heavy fractions from the Upper Marl
also contain abundant pyrite. Non-opaque minerals which are
present in proportions >2% in heavy mineral suites from the Lower
and Upper Marls are: baryte, clinozoisite/epidote (Fig. 4.22),
chlorite and muscovite. Siliceous microfossils, dominantly
spumellarian radiolaria (D. Mackinnon, pers. comm.), which are
infilled with pyrite or semi-opaque material are common in the
heavy fractions of some samples (Fig. 4.22).
Heavy mineral suites from the Marl in the Clarence Valley are more
distinctive than those from the Lower and Upper Marls. Samples Ll4
and B4 yielded virtually monomineralic suites comprising baryte
(Fig. 4.23) and pyrite respectively. The suite of sample S6 is
also dominated by pyrite. Samples S2 and SS, both taken from the
massive mudstone interval of the Marl, contain significant amounts
Table 4.8: Heavy Mineral Suites of Selected Smectite-Mudstones
LOWER MARL UPPER MARL
HEAVY MINERALS Wl C4 C7 Wll U6
Opaques - Pyrite
} } } I VA I I A I Magnetite 0 0 ~ tr
Other
Semi-Opaques I VA ;io I I VA* I I VA* I I A I I VA I Zircon ~ tr ~ tr
Tourmaline
Hornblende Or ? ~ tr ~ tr
Pyroxene ? ~ tr
Sphene Il tr
Garnet ? ~tr ~ tr ? Or Epidote Or
Clinozoisite 0 Baryte @] ~ ~ Biotite
Chlorite [TI Muscovite [J Volcanic Glass
Key: VA* - Flood >64%; VA -·very abundant 32-64%; A - Abundant 16-32%; C - Common 8-16%
S - Sparse 4-8%; R - Rare 2-4%; r - Very rare 1-2%; tr - Trace <1%
MARL (CLARENCE VALLEY)
Ll4 S2 S6
} I A I I VA* I
Dr IT] [I]
I A I [CJ [I]
0 ~ tr
m ~ tr
? ~ tr ? ~ tr
[] ~ tr
I VA* I [J
IT] [] []
Table 4.8: Heavy Mineral Suites of Selected Smectite-Mudstones (Continued}
MARL (CLARENCE VALLEY} WANSTEAD FORMATION RED SMECTITE-MUDSTONES
HEAVY MINERALS SB 84 HB3 HB21 Paoanui Mangamauk~ Gilray Bay Stream
Opaques - Pyrite I VA I I VA * I I A I I VA I I VA I Magnetite
Other I A I [I] [D Semi-Opaques 0 I VA I Zircon ~ ~ tr ~ tr
Tourmaline 0 Hornblende @ ~tr
Pyroxene ? ~ tr [ tr
Sphene II] Garnet [tr [ tr [ tr H tr
Epidote ~ tr
Clinozoisi te
Baryte ~ 0 I VA I I VA I Biotite I VA ;)ff I [I] 0 Chlorite m ~ tr [] [I] Muscovite CD fl tr 0 [I] [TI Volcanic Glass
7 ~ tr 7 ~tr
Key: VA* - Flood >64%; VA - Very abundant 32-64%; A - Abundant 16-32%; C - Common 8-16%
s - Sparse 4-8%; R - Rare 2-4%; r - Very rare 1-2%; tr - trace <1%
Figure 4.22: Clinozoisite/epidote and infilled siliceous microfossils in the heavy fraction of sample C7. Plane-polarised light, 40x magnification.
Figure 4.23: Baryte in the heavy fraction of sample Ll4. Crossedpolarised light, 40x magnification.
118
.
·• ..
of zircon, tourmaline, hornblende, sphene, biotite, chlorite
and muscovite (Figs 4.24, 4.25). The grains of zircon and
tourmaline are commonly euhedral in shape.
119
Two samples of the green smectite-mudstone of the Wanstead
Formation yielded heavy mineral suites consisting largely of
pyrite and baryte. In contrast, suites from the red smectite
mudstones of Hawkes Bay contain abundant phyllosilicates - biotite,
muscovite and chlorite - in addition to opaques. The sample from
Paoanui cliffs in particular is very rich in biotite (Fig. 4.26).
Two of the red smectite-mudstone suites also contain trace amounts
of isotropic material which may be volcanic glass.
The mineralogy of the light fractions of all the smectite-mudstone
samples was found to consist of chert-clay fragments±. quartz+
feldspar±. muscovite±. glauconite. The fragments composed of
chert and clay are very abundant and the other minerals, if
present, are minor components in all light fractions except those
of samples S2 and SS. The light mineral suites of S2 and SS
contain abundant quartz and feldspar. Both minerals occur as
subangular, anhedral grains and no euhedral shapes were observed.
Two types of feldspar are present in both samples - sodic
plagioclase and microcline with distinctive cross-hatched twinning
(.Fig. 4. 27) .
Previous studies of the sand fraction mineralogy of samples from
Porangahau quarry have been reported in the literature
(Gordon et al., 1955; Ritchie, 1962). In addition to the
mineralogy determined in this study for sample HB3 from
Porangahau, Gordon et al. (1955) noted the presence of volcanic
glass. The mineralogical analysis given by Ritchie (1962)
Figure 4.24: Euhedral zircons, sphene, green tourmaline and pyrite (opaque} in the heavy fraction of sample 82. Planepolarised light, 40x magnification.
Figure 4.25: Brown/green tqurmaline, chlorite and pyrite (opaque) in the heavy fraction of sample S8. Planepolarised light, 40x magnification.
120
•
•
'
includes biotite, apatite, volcanic glass and volcanic
fragments, but no haryte which is the dominant heavy mineral
in sample HB3.
121
Figure 4.26: Biotite in the heavy fraction of red smectite-mudstone from Paoanui. Plane-polarised light, 40x magnification.
Figure 4.27: Microcline showing crosshatched twinning, quartz and glauconite in the light fraction of sample 88. Crossedpolarised light, 63x magnification.
l22
5.1 INTRODUCTION
CHAPTER FIVE
GEOCHEMISTRY
123
The geochemistry of the smectite-mudstones was studied in two parts:
Cl) Major element geochemistry of clay fractions
involving analysis of structural elements
and exchangeable cations to determine clay
mineral chemistry.
(2) Trace element geochemistry involving analysis
of whole rocks and exchangeable cations with
emphasis on stratigraphic trends.
5.2 MAJOR ELEMENT GEOCHEMISTRY
A study of the major element geochemistry of smectite-mudstone
clay fractions was carried out to determine the chemistry and
structural formulas of the smectite clay and to supplement the
phase analysis techniques in distinguishing smectite species.
Structural elements were analysed by x-ray fluorescence and
exchangeable cations in leachate solutions from the leaching
procedure were analysed by atomic absorption.
5,2.l Method of Structural Formula Calculation
The calculation of clay mineral structural formulas from chemical
data involves locating each element in a structural position
based on a general ideal structural formula. For dioctahedral
smectites, the following ideal structure is generally accepted
(Ross and Hendricks, 1945):
(Al FebMg ) a-y c
octahedral sheet
(.Si4
Al ) -y y
tetrahedral sheet
anions hydrated exchangeable
cations
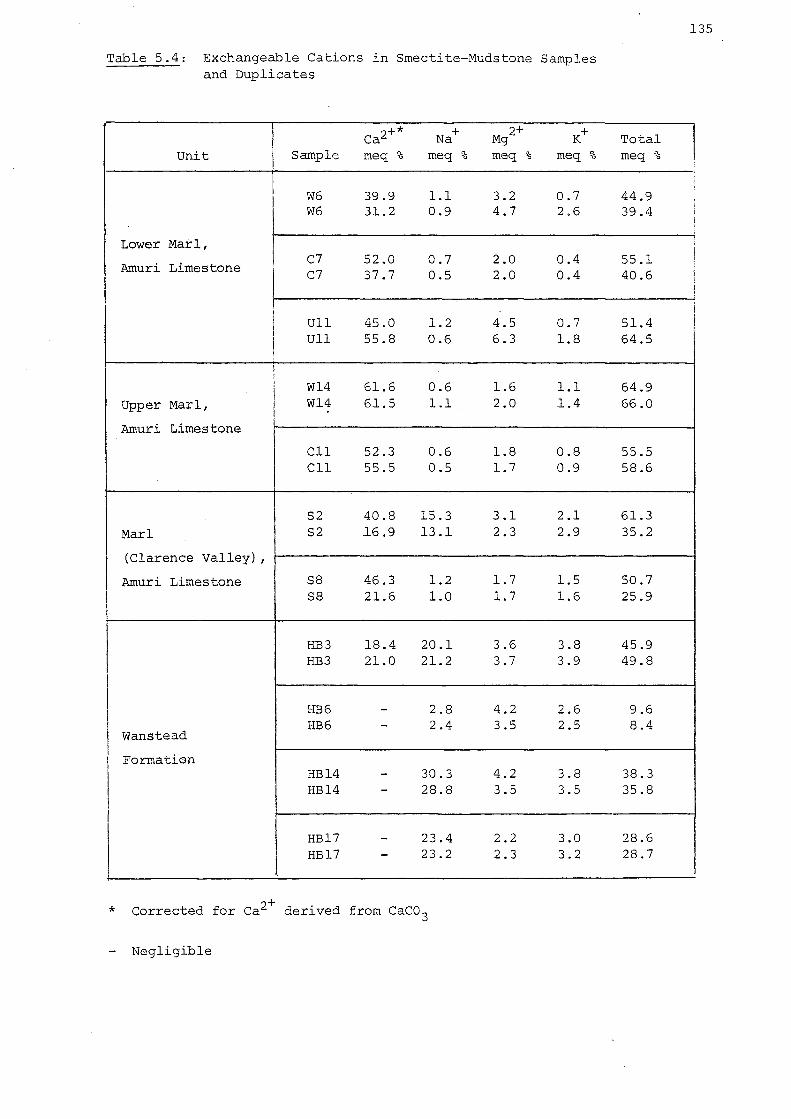
The ideal structural formulas for the three end-member species of
dioctahedral smectite are:
Montmorillonite
Beidellite
Nontronite
Isomorphous substitution series between the three end-members
do not appear to be continuous (Brigatti and Poppi, 1981;
Nemecz, 1981). The validity of the Greene-Kelly Li+-test in
distinguishing montmorillonite from beidellite and nontronite
suggests that there is a miscibility gap between montmorillonite
and the other two dioctahedral species. A miscibility gap is
3+ also evident between nontronite and the other species, as Fe
constitutes >75% of the octahedral cations in nontronite and
usually <30% in montmorillonite and beidellite. The dioctahedral
smectite species can therefore usually be readily differentiated
by chemical analysis.
124
The method of calculating structural formulas of dioctahedral
smectites is given by Ross and Hendricks (1945) and is described
below with a worked example.
(1) Given a chemical analysis expressed in weight% of oxides
(.Table 5.1, column 2), atomic proportions of the elements
are calculated (column 3):
At. Prop.= wt% (.no. cations in oxide) M.W. oxide
Table 5.1: Example of a Structural Formula Calculation (Chemical analysis of API no. 24 bentonite from Schultz (1969) t
Element wt% Atomic Proportions Structural Formula oxide
Si 63 .Cl4 l.049 = z 3.98
J Tetrahedral cations
0.362 A/ 0..006=Y 0.02
Al 18.44 = '- 0.356=A-Y l.35
] 0.06 Octahedral
Fe 1.20 0.015 =.B cations
Mg 7.30 0 .J.8J. = c 0.69
Ca 0.08 a.ao] Na 3.40 O..llQ = x 0.42
Exchangeable cations
K 0..02
(2) The atomic proportions are multiplied by a factor K to
give the structural formula (column 4). K is
calculated from the equation:
22 K = 3A + 3B + 2C + 4Z + X
This equation expresses the condition that the sum of
the cation valences equals the sum of anion valences -
2+ A= XRF analyses in this study of Ca -saturated insoluble residues
B = XRF analyses from the literature (Schultz, 1969)
A second factor which must be assessed in the calculation of
structural formulas is sample purity. Components which are
present in addition to the one for which the formula is being
calculated may be able to be removed, or if not, have to be
accurately corrected for.
128
The smectite-mudstones were partially purified by treatment with
dilute acetic acid to dissolve caco3 . Carroll and Starkey (1971)
reported that only minor amounts of structural silica and alumina
are dissolved from montmorillonite and illite with prolonged
acetic acid treatment. The mild treatment used in this study
should therefore not have significantly altered the clay chemistry
and some analyses of untreated non-calcareous standards were
found to be comparable to the analyses after treatment (Appendix IV).
The acid-insoluble clay fractions of the majority of smectite
mudstones contain illite and quartz in addition to smectite
(Chapter 4, Section 4.2). Quartz impurities were corrected for by
subtracting the% quartz figure obtained by quantitative XRD
analysis from the weight% Si02 in the chemical analysis. A
similar correction for the illite component in the samples could
not be applied however. The chemistry of illite is variable
(Weaver and Pollard, 1973) and use of an average illite formula
may have induced considerable error in the correction of the
chemical analyses. It was more meaningful therefore to include
illite in the structural formula calculations and obtain overall
smectite + illite formulas, as is done in the case of interlayered
smectite-illite clays (e.g. Schultz, 1978). The method of formula
calculation for dioctahedral smectites is applicable to illite as
the two clays have the same structure. The chemistry of illite
differs from that of smectites in a higher degree of substitution
of Al3+ for tetrahedral Si4+. The resulting high layer charge of
illite is balanced by interlayer K+ cations which are generally
non-exchangeable.
A third major problem in structural formula calculations is the
validity of the assumption of an ideal structure and the
assumptions involved in assigning elements to certain structural
positions. The ideal structure for dioctahedral smectites, upon
which formula calculations are based, appears to be validated by
the numerous calculated formulas in the literature (e.g. Weaver
and Pollard, 1973) which are close to ideal. Schultz (1969)
however has shown that the amount of structural water may not
always be ideal. Errors in structural formulas may also arise if
it is not recognised that some elements occur in more than one
structural position, such as Al 3+ (octahedral, tetrahedral or
interlayer) and Mg2+ (octahedral or interlayer). The
exchangeable cations in the smectite-mudstone clay fractions were
replaced with ca2+ prior to analysis to alleviate this problem.
XRD analysis (Chapter 4, Section 4.2.1) also indicated that
· 3+ 2+ significant interlayer Al or Mg are not present.
5.2,3 Structural Formula Results
The XRF analyses of smectite-mudstone clay fractions are given in
129
Appendix V. All the samples chemically analysed were also analysed
by quantitative XRD and consist essentially of smectite + illite
+ quartz. The samples were pre-saturated with ca2+ by reciprocal
shaking to replace the interlayer cations except non-exchangeable
+ . 'll't K in i i e. The weight% K20 correlates with% illite determined
from quantitative XRD as shown in Fig. 5.1. K20 also shows a
positive correlation with Al 2o3 and a negative correlation with
Si0 2 corrected for quartz (Fig. 5.1), indicating the more
aluminous nature of illite relative to smectites.
2·87 r .. 0·529
%K2o
• •
1 ·'28 ~
30
• • %K
2o
1·~ 49·21
2·S7 r .::.0·692
•
1 ·28 11·32
•
•
• •
• • • • •
• • • •
• • • • • % Illite 51
• r--0· 541
• • .c
•• • •
• • • • • •
%Si0z - O/o Quartz 69·31
if
• • • • • • • • •
• • e • •
• • 0/o At 2 o3
19·11
Figure 5.1: Scatter plots and correlation coefficients (r) of %K20 vs %Illite, %K20 vs %Si0 2-%Quartz and %K20 vs %Al2o3 in smectite-mudstone clay fractions.
130
131
Average s.mectite + illite structural formulas calculated from
the chemical analyses of smectite-mudstone clay fractions are
given in Table 5.3. Octahedral Al3+ ranges from 0.99 to 1.49 with
an average of 1.31, Mg2+ ranges from 0.16 to 0.33 with an average
of 0.25 and Fe3+ ranges from 0.21 to 0.37 with an average of 0.27.
The amount of tetrahedral Al3+ ranges from 0.00 to 0.15, but
approximately two-thirds of the samples have no tetrahedral Al3+.
Total interlayer cations range from 0.23 to 0.43 with an average
of 0.34. Detailed analyses of exchangeable cations are presented
in the following Section 5.2.4.
The low amount of tetrahedral substitution in the structural
formulas is consistent with the overall result of the Li+-saturation
test that the smectite species in the mudstones are closest to
end-member montmorillonite. The Mg and Fe proportions in the
formulas are respectively low and high relative to the averages of
0.35 and 0.19 for montmorillonites (Weaver and Pollard, 1973).
Assuming the illite in the samples has average Mg and Fe contents,
this chemistry is similar to the Wyoming and Chambers subspecies of
montmorillonite (Shultz, 1969) as discussed in Chapter 4,
Section 4.3.3.
The most striking aspect of the calculated average smectite +
illite structural formulas is that many formulas are non-ideal
with octahedral cation totals that are considerably less than the
ideal total of 2.00 per o10 (0H) 2 . This deficiency appears to be
largely a result of low amounts of Al3+. Only four samples (WS,
W9, U4, U9) have formulas with significant Al3+ substitution in the
tetrahedral sheet even though illite typically contains on the
~+ order of 0.5 tetrahedral Al~ (Weaver and Pollard, l973). The
Li+-saturation test also indicated that the smectites in some
samples are tetrahedrally substituted, but there is no good
Table 5.3: Average Structural Formulas of Smectite + Illite in Smectite-Mudstone Clay Fractions
reconstructions of the east coast region during the Lower Tertiary
are presented by Kamp (in prep.) and show that the Hawkes Bay and
Wairarapa regions were more closely associated and contiguous
with Marlborough. Sedimentation is inferred to have occurred on
a passive continental margin with gross sedimentation patterns
controlled by extensional tectonics (Sporli, 1980; Kamp, in prep.)
The depositional environment of the smectite-mudstones is
envisaged as a regionally uniform, open oceanic environment
receiving a limited supply of elastic sediment and characterised
by slow average sedimentation rates. Paleontological evidence
suggests a deeper water outer shelf/slope environment
(C.P. Strong, 1983, pers. comm.) but does not rule out a
continental plateau setting where water depths may be in excess of
1000 metres, possibly similar to the present day Campbell Plateau.
Alternatively, a shallower water middle shelf setting may be more
appropriate, however further such considerations are beyond the
scope of this study.
Areally within the depositional environment, sedimentation of
hemipelagic clay and carbonate occurred concurrently. Fluctuations
in the input of detrital clay is favoured to account for the
internal cyclic sedimentology of the Marl units. Depths of
149
deposition were probably not great enough for cyclic dissolution
of carbonate to be an important factor. Local remobilisation of
carbonate and clay sediments however may have also been
significant. The Lower and Upper Marls overall represent a
major long-term pattern of alternating clay-carbonate
sedimentation during Lower Tertiary time, whereas the Clarence
Valley Marl represents essentially uninterrupted clay
sedimentation. These facies variations may reflect different
local conditions of deposition such as proximity to the source
of clay, seafloor relief and current activity, with carbonate
sedimentation also controlled by biogenic carbonate produc·tivity
factors.
In other areas of the regional depositional environment,
background hemipelagic sedimentation of clay was periodically
interrupted by mass-flow events which redeposited coarser
sediments interpreted as being derived from shallower water
environments. Large-scale slumping is indicated in one area
(Pukemuri Siltstone, Wairarapa) and facies changes are marked,
with implications of significant seafloor relief and instability
resulting from extensional tectonics.
6.3 MINERALOGY
The three types of smectite-rich deposits (Section 6.1) are
characterised by the following mineralogical features:
(1) Primary bentonites occur as horizons
with a distinctly different mineralogy
to that of the enclosing sediments.
They are composed of smectite (or
interstratified smectite-illite, see
Section 6.3.1) which is commonly
accompanied by authigenic silica and
zeolite minerals. Other clay mineral
components are very minor or lacking.
Non-authigenic heavy and light minerals
in primary bentonites form restricted
volcanic suites.
(2) Secondary bentonites have a mineralogy
dominated by smectite clay (or smectite
illite) .and volcanic heavy and light
minerals, similar to primary bentonites.
Non-volcanogenic components are also
likely to be present however, as a
result of mixing during transportation or
reworking.
(3) Other smectite-rich deposits are not
generally as mineralogically well defined
as primary and secondary bentonites and
typically show gradation into enclosing
lithologies. In addition to smectite,
other clays are commonly a major
component of the deposits and heavy and
light mineral suites are not dominated by
volcanic minerals.
150
6.3.l Volcanic Origin
The lithological aspect of the smectite-mudstones in the East
Coast Deformed Belt does not resemble that of primary bentonites
produced by the in-situ alteration of ash-fall beds. In
Marlborough, where stratigraphic and sedimentary relationships
are evident, the Marls have gradational contacts with underlying
and overlying limestone units. The smectite-mudstone beds within
the Marls are calcareous and the insoluble residues from the
interbedded limestones have the same mineralogy as the mudstones.
151
The dominant component of the clay fraction of the smectite
mudstones is generally a montmorillonitic clay. The type of
smectite does not appear to be definitive of a particular origin -
either volcanic or otherwise. Weaver and Pollard (l973} suggest
that the montmorillonite species is most likely to form from the
alteration of volcanic material, however their data base is
strongly biased towards volcanogenic bentonites. In recent
sediments, particularly in the South Pacific Ocean (Griffin et al.,
1968) basaltic volcanic material has altered to smectite and the
most common species appear to be trioctahedral saponite and
dioctahedral nontronite (Cole and Shaw, 1983). Weaver (1958)
suggested that smectites derived from volcanic material should not
collapse with K+-saturation in contrast to smectites which have
inherited a high tetrahedral charge from micaceous precursors.
However as discussed in Chapter 4, Section 4.3.2, K+-fixation
more probably reflects total layer charge and cannot'be simply
related back to a particular source.
It seems probable that uniformity in smectite mineralogy, rather
than a type of smectite, is more indicative of genesis by
alteration of a particular ash deposit in the marine environment.
152
The 'classic' bentonites of Cretaceous age in Wyoming, Montana
and South Dakota for example. have. a very similar smectite
mineralogy (Weaver and Pollard, l973). The detailed XRD analysis
of the smectites in the mudstones of this study showed up
significant variations in mineralogy and layer charge,
particularly within the Marl units. The lack of consistent
stratigraphic trends suggests the variability cannot be attributed
to changing volcanic ash composition.
Illite is a major component in the clay fraction of the smectite
mudstones and sometimes exceeds the amount of smectite. As
discussed in Chapter 4, Section 4.2.2, the illite and smectite
clays are discrete phases with no evidence of interstratification.
Interstratified smectite-illite clays are characteristic of
K-bentonite (or meta-bentonite) deposits which are well
documented in the literature (e.g. Weaver, 1953). These bentonites
are generally believed to be the result of burial diagenesis of
deposits that were originally composed of smectite only. Intense
deformation accompanied by localised elevated temperatures might
also be expected to convert some smectite into interstratified
smectite-illite given a sufficient period of time. However
illite in the highly tectonised units such as the Kandahar and
Wanstead Formations is a discrete phase like that in the less
deformed Marls and is therefore an original sedimentary constituent
of the mudstones. The abundance of illite suggests that the
smectite-mudstones are extensively transported/reworked secondary
bentonites or are not volcanic in origin.
Kaolinite is abundant in the Kandahar Formation, particularly
near the base where large-scale redeposition and mixing with the
Pukemuri Siltstone is apparent. The presence of kaolinite in the
Kandahar Formation is a likely result of this mixing.
The sand fraction mineralogy of bentonites is commonly used as
evidence of a volcanic origin. In a review of heavy mineral
suites in bentonites, Weaver (1963) found that primary bentonites
are characterised by restricted suites containing biotite,
euhedral zircon, apatite and sometimes titanite, hornblende and
pyroxene. In the light mineral suites of primary bentonites,
feldspar is generally dominant.
The heavy and light mineral suites in the majority of smectite
mudstones studied are characterised by a lack or only trace
amounts of minerals which are of possible volcanic origin.
Authigenic minerals such as pyrite and baryte dominate in the
heavy fractions. The light fractions are made up largely of
153
chert fragments, indicating a secondary origin for the quartz
component in the smectite-mudstones. Thin sections of two
greensand beds (HBlO, HB12) in the Wanstead Formation were also
studied. The sandstones are rich in quartz and contain only minor
amounts of possible volcanic feldspar. There is also no evidence
that the glauconite is derived from volcanic material.
The presence of volcanic minerals including glass shards in
smectite-mudstones from Porangahau and the Gisborne area is
reported by Fyfe (1934), Gordon et al. (1955) and Ritchie
(1962) and appears to be the only basis for previous use of
the term bentonite. No such volcanic suite was found in the
Porangahau mudstone in this study however and the occurrence of
a melange zone at Porangahau invalidates any genetic
interpretations from mineralogy (see also Pettinga, 1980, p.101).
Two groups of smectite-mudstones in this study differ from the
rest in their sand fraction mineralogy. Firstly, mineral suites
from two samples of the massive interval of the Marl in the
Clarence Valley contain biotite, euhedral zircon, hornblende and
plagioclase which may be volcanic. The laterally equivalent
Grass Seed Volcanics in the Clarence Valley is a likely source of
these minerals. Other non-volcanic minerals such as tourmaline,
chlorite, muscovite, quartz and microcline feldspar dominate the
mineral suites from the Marl however. Some of these minerals may
be authigenic in origin but it seems more probable that they are
detrital and represent a significant non-volcanic input into the
depositional environment of the Marl. The second group of
samples with distinctive sand fraction mineralogy is the red
smectite-mudstones from Hawkes Bay. Their heavy mineral suites
appear to be the closest examples of restricted volcanic suites.
Biotite is prominent and traces of volcanic glass are possibly
present in two samples. Some non-volcanic contamination however
is evident from the presence of muscovite+ chlorite and all the
red smectite-mudstone samples come from melange zones (P.R. Moore,
J.R. Pettinga, 1984, pers. comm.) ,making interpretation of heavy
mineral suites difficult. Red smectite-mudstones also occur in
East Cape (P.R. Moore, 1983, pers. comm.) and further
investigation of stratigraphically in-situ beds is needed. The
154
red colouration can be secondary (as observed in Wairarapa) as well
as a primary feature which may be indicative of a volcanic origin.
6.3.2 Sedimentary Origin
The mine'ralogical features of the smecti te-mudstones, with the
exception of the heavy mineral suites of red smectite-mudstones
from Hawkes Bay, do not indicate a wholly or dominantly direct
volcanic origin. Sedimentological features, as discussed in
155
Section 6.2.2 indicate that clay-rich beds represent
hemipelagic sedimentation and/or redeposition by mass-flow• events.
In the cas·e of hemipelagic deposits, the clay is likely to be
terrigenous detritus. Redeposited clays however may be originally
either detrital or neoformed (precipitated from solution in
sediments on the seafloor (Millot, 1970)).
The abundant illite in the smectite-mudstones is very probably
detrital and a similar origin is possible for the smectite clay.
Detrital illite and smectite may be derived from older sediments
and/or from soils. During the Lower Tertiary, the New Zealand
landmass is considered to have been low in relief and weathered
under a subtropical to tropical climate (Suggate et al., 1978,
p. 438-439, 718). The formation of smectite in modern soils is
favoured under warm climates in neutral poorly-drained
environments (Dixon and Weed, 1977) and it is likely that such
conditions existed on the low-lying landmass. A more extensive
study is necessary to further consider the possibility of the
smectite clay being derived from soils and to identify possible
smectite-bearing source rocks, as large quantities of smectite
clay have to be accounted for. There are also two other problems
evident in this study with advancing a detrital origin for the
smectite in the mudstones. Firstly, the smectite appears well
crystallised which is not typical of detrital clays, particularly
those formed in soils. Secondly, there is an absence of
interstratified clays (involving two different clay mineral types)
in the mudstones, whereas detrital clays are commonly
interstratified due to transformations during weathering,
transportation and deposition.
A neoformation origin is possible for the redeposited smectite
clay in the mudstones and is consistent with the high degree of
crystallinity and lack of interstratification of the clays.
Neoformation has been suggested as the origin of smectite clay
in the Upper Cretaceous European Chalk (Jeans, 1968; Millot,
J.970) and in Oligocene limestones in the North Island of
156
New Zealand (Hume, 1978). With chemical weathering on land, large
amounts of dissolved constituents such as Si, Ca and Mg are
supplied to the marine environment and chemical sedimentation
prevails (Millot, 1970). Such a situation during Lower Tertiary
time is indicated by the dominance of carbonate, chert and
glauconite in the Lower Tertiary sequences throughout the
East Coast Deformed Belt and a neoformation origin for smectite
clay appears likely.
6.4 GEOCHEMISTRY
The geochemical distinction between primary bentonites, secondary
bentonites and other smectite-rich deposits is not as well
documented as the sedimentological and mineralogical distinctions.
Two generalisations appear justified however from data presented
in the literature. Firstly, volcanogenic bentonites are composed
of smectite minerals with ideal structural formulas. Weaver and
Pollard (1973) collated nearly a hundred analyses of volcanically
derived montmorillonites-beidellites and all have structural
formulas which are close to ideal. Secondly, the trace element
geochemistry of primary and secondary bentonites reflects their
volcanic origin. Smith (1967), Jeans et al. (1982) and
Pacey (1984) have shown that bentonites have a distinctly different
trace element chemistry to that of surrounding sediments, which
can be related back to an original volcanic composition.
6.4.1 Volcanic or Sedimentary Origin
The smectite-mudstones for which structural formulas were
calculated in this study commonly contain smectite and illite
clays which appear from the formulas to be non-ideal. This result
suggests that the clays in the .mudstones have a different origin
to the structurally ideal smectites characteristic of bentonites.
Clays with structural irregularities are likely to be detrital
rather than neoformed. However, the paradox of structurally
irregular but well crystallised smectites requires further
investigation.
The concentrations of trace elements in the smectite-mudstones can
be compared with those in an average mudstone given by Turekian
and Wedepohl (1961). Since the majority of the smectite-mudstones
analysed are calcareous, the mean values of the trace element
concentrations in an average shale and an average carbonate were
used as a basis for comparison (Table 6.1). The trace element
concentrations in the smectite-mudstones were normalised against
the mean shale-carbonate concentrations and the resulting plot
showing the field of trace element compositions of the smectite-
mudstones is given in Fig. 6.1.
Table 6.1: Trace Element Abundances (ppm) in Shale and Carbonate (from Turekian and Wedepohl, 1961) and Mean ShaleCarbonate Values
Shale Carbonate Mean Shale-Carbonate
Sr 300 610 455 Rb 140 3 71.5 Zr 160 19 89.5 y 26 30 28 Nb 11 0.3 5.7 Pb 20 9 14.5 Th 12 1.7 6.9
Ga 19 4 11.5
157
10 9 8 7
6 QI ....
5 d c: 0
..c a 4 ....,
~ c:
.3 d QI
d -'= VI -0 2 c: d OJ E
' (11
0.. E d VI
1 c: := 0·9
OJ 0·8 ...., § 0·7 ~
§ 0·6 ..c <(
.... O·S c: OJ E ~ 0·4 L..i
OJ ...., 2 0-3 ~
0·2
Sr Rb Zr y Nb Pb ih Ga
Compositional field of Smectite Mud stones
Figure 6.1: Trace element abundances in smectite-mudstones normalised against the mean of the abundances in a typical shale and carbonate.
158
The compositional field of the smectite-mudstones encompasses
the mean shale-carbonate composition, with all elements varying
both above and below the mean concentration levels. In contrast,
Pacey (1984) found that bentonites in the Chalk of England had a
strongly differentiated trace element pattern enriched in some
elements and depleted in others relative to an average shale,
which could only be explained by inheritance from a volcanic
precursor. The concentrations of elements such as Zr, Nb and Th
in particular remain unchanged during alteration of volcanic ash
to smectite. The trace element pattern of the smectite-mudstones
in this study, which is undifferentiated with respect to an
average shale-carbonate, indicates a sedimentary rather than
volcanic origin.
The trace element geochemistry of two samples from the Grass Seed
Volcanics further suggests that the smectite-mudstones are not
volcanogenic. The Grass Seed Volcanics are characterised by high
concentrations of Zr, Nb and Ga and low concentrations of Rb, Pb
and Th relative to the smectite-mudstones. These differences
show up well in some scatter plots, for example Rb vs Nb and Ga
vs Th (Fig. 6.2). The Marl in the Clarence Valley at least would
be expected to have a similar trace element geochemistry to the
Grass Seed Volcanics, but this does not appear to be the case.
159
The red smectite-mudstones from Hawkes Bay differ from the other
smectite-mudstones and also the Grass Seed Volcanics in containing
relatively high levels of all the trace elements except Sr. This
geochemistry may be a result of their non-calcareous nature, but
could also reflect a volcanic parent with a different composition
to the Grass Seed Volcanics.
133·5
ppm Rb
• 1·6
20·4
ppm Ga
• 0 • •
H
Figure 6.2: and Ga VS Th showing the samples.
•
I • • • • • •
I
• • • •
•
• • • • ' •
• • • • • • • • • •
• • • •
I
• •
ppm Nb
Grass Seed Volcanics
Ii •
• • • • • • ..
• • • •• • ...
• • • • • • .o t
' • • • • •
ppm Th
Grass Seed Volcanics
/\ 32
• • • •
• • • •
14·2
Trace element concentration scatter plots of Rb vs Nb in smectite-mudstones and associated lithologies,
distinctive geochemistr_y of the Grass Seed Volcanics
160
161
Trace elements have been used successfully for regional
stratigraphic correlation purposes in the case of primary
bentonites, which are geochemically distinct from associated
lithologies and may show stratigraphic trends in composition
corresponding to volcanic differentiation trends (e.g. Huff, 1983).
In contrast, the trace element geochemistry of the smectite
mudstones in this study does not appear to be a useful means of
correlation.
6.5 SUMMARY AND CONCLUSIONS
(1) Lower Tertiary smectite-mudstones in the East Coast Deformed
Belt are considered to be non-volcanic in origin.
(2) Genesis by in-situ alteration of ash-falls is untenable as
the smectite-mudstones are not localised in thin
mineralogically/geochemically distinct horizons and are not
free of non-volcanic detritus. Discounting the possibility
that the. smectite-mudstones are secondary bentonites is more
difficult and depends on evidence of relative contributions
from possible volcanic and non-volcanic sources.
(3) The smectite-mudstones are laterally extensive over
kilometres and are on the order of tens of metres thick,
in contrast to secondary bentonites formed during phases
of volcanogenic sedimentation. There is no evidence of major
volcanic activity contemporaneous with the mudstones.
(4) The clay mineralogy of the mudstones consists of smectite
and illite. The smectite clay is montmorillonitic but
often contains interstratified layers of other dioctahedral
smectites and has variable layer charge. The smectite is
typically well crystallised although commonly appears from
structural formulas to have a non-ideal structure with a
deficiency in aluminium. These features, with the
exception of high crystallinity, are not characteristic of
volcanogenic smectites with uniform mineralogy and ideal
structures. Illite is a major sedimentary constituent of
162
the mudstones, indicating a significant non-volcanic detrital
input. No stratigraphic trends in clay mineralogy are
evident.
(5) The paucity of minerals of possible volcanic origin in the
sand fractions of the smectite-mudstones would not be
expected in volcanogenic deposits. Red smectite-mudstones
are possibly an exception and require further investigation.
(6) The smectite-mudstones have a typical sedimentary trace
element geochemistry, unlike that of associated localised
volcanics. Variations in trace element abundances do not
show distinct stratigraphic trends and the lack of success
in using geochemistry for regional stratigraphic correlations
further points to a non-volcanic origin for the smectite
mudstones.
(7) The lithology of the smectite-mudstone units varies
regionally from alternating marl-limestone to interbedded
mass-flow greensands and mudstones. The mudstone beds are
considered to represent hemipelagic sedimentation of
detrital clays and/or mass-flow redeposition of detrital
or neoformed clays.
163
(8) An open oceanic, relatively deep water environment of
deposition of the smectite-mudstones is envisaged. The
smectite-mudstone units pass laterally into other carbonate
and elastic lithofacies, reflecting local variations in
depositional conditions which were probably partly controlled
by offshore extensional tectonic activity.
ACK...l'iOWLEDGEMENTS
I wish to thank Dr J.R. Pettinga and Dr S.D. Weaver of the Geology
Department, University of Canterbury for supervision of this thesis.
I am indebted to Dr Pettinga who suggested the thesis topic and
contributed much time in the field and in discussion of many aspects
of the project. Dr Weaver provided valuable assistance in the area of
geochemistry. Financial support for the thesis was provided by DSIR
Research Contract (C-40) and this is gratefully acknowledged.
Fieldwork on several occasions was assisted by D.X. Lauw and
A.E. Alloway (Geology Dept, u. of C.) and W.M. Prebble (Geology Dept,
164
U. of Auckland). Much useful information and guidance was obtained from
discussions with Dr D.W. Lewis and Dr J.D. Bradshaw (Geology Dept,
U. of C.) and M.B. Reay, Dr M.G. Laird, P.R. Moore, G.H. Browne and
Dr G.J. van der Lingen (N.Z. Geological Survey). Mr and Mrs D. Parsons
of Woodside Creek provided acconunodation and hospitality for several
fieldtrips.
Paleontological age determinations were done by Dr C.P. Strong and
H.E.G. Morgans (N.Z.G.S.) and A.A. Cameron (Geology Dept, U. of C.)
Optical microscopy was assisted by Dr D. Shelley (Geology Dept, U. of C.)
and Dr D. Smale (N.Z.G.S.). Dr A.S. Campbell, Dr R. Harrison and F. Fox
of the Soil Science Department, Lincoln College advised and assisted
with DTA and cation exchange methods. Dr J.E. Fergusson (Chemistry
Dept, U. of C.) helped with AA analysis and computing work on chemical
data. Various technical assistance was provided by A.E. Alloway,
K.M. Swanson, A. Downing and D.J. MacDonald (Geology Dept, U. of C.);
J.B. Smith (N.Z.G.S.); Dr J.P.L. Walker and K.A. Card (Botany Dept,
U. of C.).
Typing was done by H.E. Licence and draughting by M.A. Perera both of
KRTA Ltd and the support of other staff at KRTA in the final stages of
the project is appreciated.
I wish to thank my parents and friends for their support and
encouragement throughout.
165
166
REFERENCES
Biscaye, P.E. (1965) Mineralogy and sedimentation of Recent deep-sea clay in the Atlantic Ocean and adjacent seas and oceans. GeoZ. Soc. Am. Bull. 76: 803-832.
Blakemore, L.C.; Searle, P.L.; Daly, B.K. (1977) A. Methods for chemical analysis of soils. N.Z. Soil Bureau Scientific Report lOA.
Brigatti, M.F.; Poppi, L. (l981) A mathematical model to distinguish the members of the dioctahedral smectite series. Clay Minerals 16: 81-89.
Brindley, G.W.; Brown, G. eds. (1980) Crystal structures of clay minerals and their x-ray identification. London, Mineralogical Society. 495 p.
Browne, G.H. Cin prep.) Redeposited beds and slump folds in the Amuri Limestone, Te Kau Kau Point, southeast Wairarapa, New Zealand.
Carroll, D.; Starkey, H.C. (l971) Reactivity of clay minerals with acids and alkalies. Clays Clay Minerals l9: 32.1-333.
Cole, T.G.; Shaw, H.F. (1983) The nature and origin of authigenic smectites in some Recent marine sediments. Clay Minerals 18: 239-252.
Dixon, J.B.; Weed, S.B. (1977)_ Minerals in soil environments. Madison, Wisconsin, Soil Science Society America. 948 p.
Duff, P. McL. D.; Hallam, A.; Walton, E.K. (1967) Cyclic sedimentation. Developments in Sedimentology 10. 280 p.
Dunn, L.R.L.; Wilkinson, L. (1941) An anomalous property of New Zealand bentonites. N.Z. J. Sci. Technol.B 22: 275-279.
Eade, J.V. (1966) Stratigraphy and structure of the Mount Adams area, eastern Wairarapa. Trans. Roy. Soc. N.Z. 4: 103-107.
Einsele, G. (1982) Limestone-marl cycles (periodites}: diagnosis, significance, causes - a review. In Einsele, G.; Seilacher, A. eds. Cyclic and event stratification. Berlin, Springer-Verlag. p. 8-53.
Fyfe, H.E. (1934) Bentonite and its occurrence in New Zealand. N.Z. J. Sci Technol. B 15: 386-394.
Gibbs, R.J. (.1965) Error due to segregation in quantitative clay mineral x-ray diffraction mounting techniques. Am. Mineralogist 50: 741-751.
Gordon, F.R.; Rogers, J.; Russell, B.; Trewern, L.C. (19551 The physicochemical properties of some New Zealand bentonites. N.Z. J. Sci. Technol. B 37: 132-141.
Greene-Kelly, R. (1953) The identification of montmorillonoids in clays. J. Soil Sci. 4: 233-237.
Griffin, J .J., Windom, H.; Goldberg, E.D. (1968) The distribution of clay minerals in the World Oceans. Deep Sea Res. 15: 433-459.
Grim, R.E.; Bray, R.H.; Br.adley, W .F. (1937) Mica in argillaceous sediments. Am. Mineralogist 22: 813-829.
Grim, R.E.; Guven, N. (1978) Bentonites: geology, mineralogy, properties and uses.. Developments in Sedimentology 24. 256 p.
Grim, R.E.; Kulbicki, G. (1961) Montmorillonite: high temperature reactions and classification. Am. Mineralogist 46: 1329-1369.
167
Hall, W.D.M. (1964) The geology of Coverham and the Upper Waima Valley, Marlborough. Unpubl. M.Sc. thesis. Victoria University, Wellington.
Huff, W.D. (1983) Correlation of middle Ordovician K-bentonites based on chemical fingerprinting. J. Geol. 91: 657-669.
Hume, T.M. (1978) Clay petrology of Mesozoic to Recent sediments of central western North Island, New Zealand. Unpubl. Ph.D. thesis. University of Waikato, Hamilton.
· Hutton, F. W. (187 4) Report on the geology of the north-east portion of the South Island, from Cook Straits to the Rakaia. N.Z. Geological Survey Reports of Geological Explorations (1873-74) 8. p.27-58.
Jackson, M.L. (1956) Soil chemical analysis - advanced course. Madison, Wisconsin, Dept. Soil Science, University of Wisconsin. 894 p.
Jeans, C.V. (1968) The origin of the montmorillonite of the European Chalk with special reference to the Lower Chalk of England. Clay Minerals 7: 311-329.
Jeans, C.V.; Merriman, R.J.; Mitchell, J.G.; Bland, D.J. (1982) Volcanic clays in the Cretaceous of southern England and Northern Ireland. Clay Minerals .17: 105-156.
Johnston, M.R. Cl980) Geology of the Tinui-Awatoitoi District. N.Z. Geological Survey Bull. 94. 62 p.
Kamp, P .J .J. (in prep.) Geotectonic development of a mid-Cenozoic rift system through western New Zealand and implications for the age of Alpine Fault inception.
Kerr, P.F.; Hamilton, P.E. (1949) Glossary of clay mineral names. Am. Pet. Inst. Project 49. Clay Mineral Standards Prelim. Report 1. 68 p.
Kingma, J.T. (1967) Sheet 12 - Wellington (1st ed.). Geological Map of New Zealand 1:250,000. Wellington, D.S.I.R.
Kingma, J.T. (1971) Geology of Te Aute Subdivision. N.Z. Geological Survey Bull. 70. 173 p.
Lensen, G.J. (1962) Sheet 16 - Kaikoura (1st ed.). Geological Map of New Zealand 1:250,000. Wellington, D.S.I.R.
Lillie, A.R. (1953) The geology of the Dannevirke Subdivision. N.Z. Geological Survey Bull. 46. 156 p.
Machajdik, D.; Cicel, B. (1981) Potassium- and ammonium-treated montmorillonites. II. Calculation of characteristic layer charges. Clays Clay Minerals 29: 47-52.
MacKenzie, R.C. ed. (1957) The differential thermal investigation of clays. London, Mineralogical Society. 456 p.
MacPherson, E.O. (1952) The stratigraphy and bentonitic shale deposits of Kekerangu and Blue Slip, Marlborough. N.Z. J. Sci. Technol. B 33: 258-286.
168
MacPherson, E.O.; Coventry, R.G. (1941) Bentonite in southern Hawkes Bay. N.Z. J. Sci. Technol. B 22: 265-275.
Miller, R.B. (1948) Chemical properties of two New Zealand bentonites. N.Z. J. Sci. Technol. B 30: 198.
Millot, G. (1970) Geology of clays. Weathering, sedimentology, geochemistry. N.Y., Springer-Verlag. 429 p.
Neroecz, E. (1981) Clay minerals. Budapest, Akademiai Kiado.
Norrish, K.; Hutton, J.T. (19691 An accurate x-ray spectrographic method for the analysis of a wide range of geological samples. Geochim. Cosmochim. Acta 33: 43l-454.
Pacey, N.R. (1984) Bentonites in the Chalk of central eastern England and their relation to the opening of the northeast Atlantic. Earth Planet. Sci. Lett. 67: 48-60.
Pettinga, J.R. (1980) Geology and landslides of the eastern Te Aute district, Southern Hawkes Bay. Unpubl. Ph.D. thesis. University of Auckland.
Pettinga, J.R. (1982) Upper Cenozoic structural history, coastal Southern Hawkes Bay, New Zealand. N.Z. J. Geol. Geophys. 25: 149-191.
Prebble, W.M. (.1976) The geology of the Kekerengu-Waima River District, north-east Marlborough. Unpubl. M.Sc. thesis. Victoria University, Wellington.
Prebble, W.M. (1980) Late Cainozoic sedimentation and tectonics of the East Coast Deformed Belt, in Marlborough, New Zealand. In Ballance, P.F.; Reading, K.G. eds. Sedimentation in oblique-slip mobile zones. Int. Ass. Sedimentologists Spec. Publ. 4. p. 217-228.
Reay, M.B. (1980) Cretaceous and Tertiary stratigraphy of part of the middle Clarence Valley, Marlborough. Unpubl. M.Sc. thesis. University of Canterbury, Christchurch.
Ritchie, J.A. (1962) Bentonite deposits in New Zealand: a review, D.S.I.R. Dominion Lab. Report 2053. 27 p.
Roen, J.B.; Hosterman, J.W. (1982) Misuse of the term 'bentonite' for ash beds of Devonian age in the Appalachian basin. Geol. Soc. Am. Bull. 93: 921-925.
Ross, C.S.; Hendricks, S.B. (1945) Minerals of the montmorillonite group - their origin and relation to soils and clays. U.S. Geological Survey Prof. Paper 205-B. 56 p.
Schultz, L.G. (1963) Nonmontmorillonitic composition of some bentonite beds. Clays Clay Minerals~ Proc . .llth Nat. Conf.: 169-177.
Schultz, L.G. (1969) Lithium and potassium absorption, dehydroxylation temperature and structural water content of aluminous smectites. Clays Clay Minerals 17: 115-149.
Schultz, L.G. (1978) Mixed-layer clay in the Pierre Shale and equivalent rocks, Northern Great Plains region. U.S. Geological Survey Prof. Paper 1064-A. 28 p.
Smith, D.G.W. (1967) Th.e: petrology and mineralogy of some Lower Devonian bentonites from Gaspe, P.Q. Canad. MineraZogist 9: 141-165.
Sporli, K.B. (1980) New Zealand and oblique-slip margins: tectonic development up to and during the Cainozoic. In Ballance, P.F.; Reading, H.G. eds. Sedimentation in oblique-slip mobile zones. Int. Ass. Sedimentologists Spec. Publ. 4. p. l47-170.
Suggate, R.P.; Stevens, G.R.; Te Punga, M.T. eds. (1978) The geology of New Zealand. Wellington, N.Z. Government Printer. 2 Vols. 820 p.
Thorez, J. (1976) Practical identification of clay minerals. A handbook for teachers and students in clay mineralogy. Dison, Belgium, G. Lelotte. 90 p.
Towe, K.M. (1974) Quantitative clay petrology: the trees but not the forest? Clays Clay Minerals 22: 375-378.
Turekian, K.K.; Wedepohl, K.H. (1961) Distribution of the elements in some major units of the Earth's crust. Geol. Soc. Am. Bull. 72: 175-192.
van den Heuvel, H.B. (1960) The geology of the Flat Point area, eastern Wairarapa. N.Z. J. Geol. Geophys. 3: 309-320.
Walcott, R.I. (1978) Present tectonics and late Cenozoic evolution of New Zealand. Geophys. J. Roy. Astro. Soc. 52: 137-164.
Waterhouse, J.B. (1955) Geology of the White Rock - Tora area. south east Wairarapa. Unpubl. M.Sc. thesis. Victoria University, Wellington.
Waterhouse, J.B.; Bradley, J. (1957) Redeposition and slumping in the Cretaceo-Tertiary strata of S.E. Wellington. Trans. Roy. Soc. N.Z. 84: 519-548.
Weaver, C.E. (1953)_ Mineralogy and petrology of some Ordovician K-bentonites and related limestones. Geol. Soc. Am. Bull. 64: 921-944.
Weaver, C.E. (1958) The effects and geologic significance of potassium 'fixation' by expandable clay minerals derived from muscovite, biotite, chlorite and volcanic material. Am. Mineralogist 43: 839.-,861.
Weaver, C.E. (1963) Interpretative value of heavy minerals from bentoni tes. J. Sed. Pet. 33: 343-349.
Weaver, C.E.; Pollard, L.D. (1973) The chemistry of clay minerals. Developments in Sedimentology 15. 213 p.
Wells, N.; Smidt, R.E. element analysis.
compilers (1978) D. Methods for mineral and N.Z. Soil Bureau Scientific Report lOD.
Wright, P.C. (1968) The Meandu Creek bentonite - a reply. J. Geol. Soc. Aust. 15: 347-350.
169
A;i?J?ENDIX I - UNIVERSITY OF CANTERBURY
ROCK CATALOGUE NUMBERS
Representative samples of smectite-mudstones and associated lithologies
Thesis Number
W6
Wl3
C7
ell
us Ul3
M2
Sl
SlO
B4
HB3
HBl4
HB.17
WPl
W04
WAl
Cl2 Greens and
U7 Limestone
U8 Limestone
LS Grass. Se.ed
HBlO Greens-and
HB12 Greens and
University of Canterbury Number
Smectite-Mudstones
10371
10372
10373
10374
10375
10376
10377
10379
10380
10381
10382
10383
10384
10385
10386
10387
Associated Lithologies
10390
10388
10389
Volcanics 10378
10391
10392
170
APPENDIX II - MICROFOSSIL AGE DETERMINATIONS
-·
FRF No. LOCALITY GRID REF. STRATIGRAPHIC POSITION SAMPLE NO. PALEONTOLOGIST AGE
P30/fl75 Woodside Creek, 945189 Base Lower Marl W4 C.P. Strong NZGS Dw
Upper Gorge
P30/fl76 Woodside Creek, 947188 Top Lower Marl W8 C.P. Strong NZGS Dm-Dh
Upper Gorge
P30/£177 Woodside Creek 954191 Base Upper Marl WlO C.P. Strong NZGS Ab
Upper Gorge
P29/f218 Chalk Range 850204 Base Lower Marl Cl A.A. Cameron D u. of C.
P29/f207 Chalk Range 844207 Top ,Upper Marl? Cl3 C.P. Strong NZGS • Dw
P30/fl81 Chalk Range 824196 Top Upper Marl Cl8 A.A. Cameron D-A u. of c.
I P30/£182 Mead Stream Gorge 756162 Base Upper Marl M3 A.A. Cameron I Ab
u. of c. I
P30/fl83 Mead Stream Gorge 755163 Top Upper Marl M2 A.A. Cameron j I Dp-Ar I
U. of c. ' I I
031/£146 Fells Basin 416844 Base Marl Sl2 C.P. Strong NZGS I ?Dt-?Dm i I
031/fl45 Fells Basin 417844 Massive Interval of Marl 88 C.P. Strong NZGS i Dp I
i
030/f44 Bluff Stream 585977 Base Amuri Limestone Bl A.A. Cameron I Mh I
u. of c. I !
i i
(Appendix II Cantin.)
APPENDIX II - Continued
FRF NO. LOCALITY GRID REF. STRATIGRAPHIC POSITION SAMPLE NO. PALEONTOLOGIST AGE