Ministry of Agriculture & Farmers Welfare Report of the Committee for Doubling Farmers’ Income Volume III “Post-production Agri-logistics: maximising gains for farmers” Agricultural Logistics is the Backbone of Agri-Business Agricultural Marketing is the Brain behind Value Realisation Document prepared by the Committee for Doubling Farmers’ Income, Department of Agriculture, Cooperation and Farmers’ Welfare, Ministry of Agriculture & Farmers’ Welfare. August - 2017
Transcript
Ministry of Agriculture &
Farmers Welfare
Report of the Committee for
Doubling Farmers’ Income
Volume III
“Post-production Agri-logistics:
maximising gains for farmers”
Agricultural Logistics is the Backbone of Agri-Business Agricultural Marketing is the Brain behind Value Realisation
Document prepared by the Committee for Doubling Farmers’ Income,
Department of Agriculture, Cooperation and Farmers’ Welfare,
Ministry of Agriculture & Farmers’ Welfare.
August - 2017
Doubling Farmers’ Income – Volume III
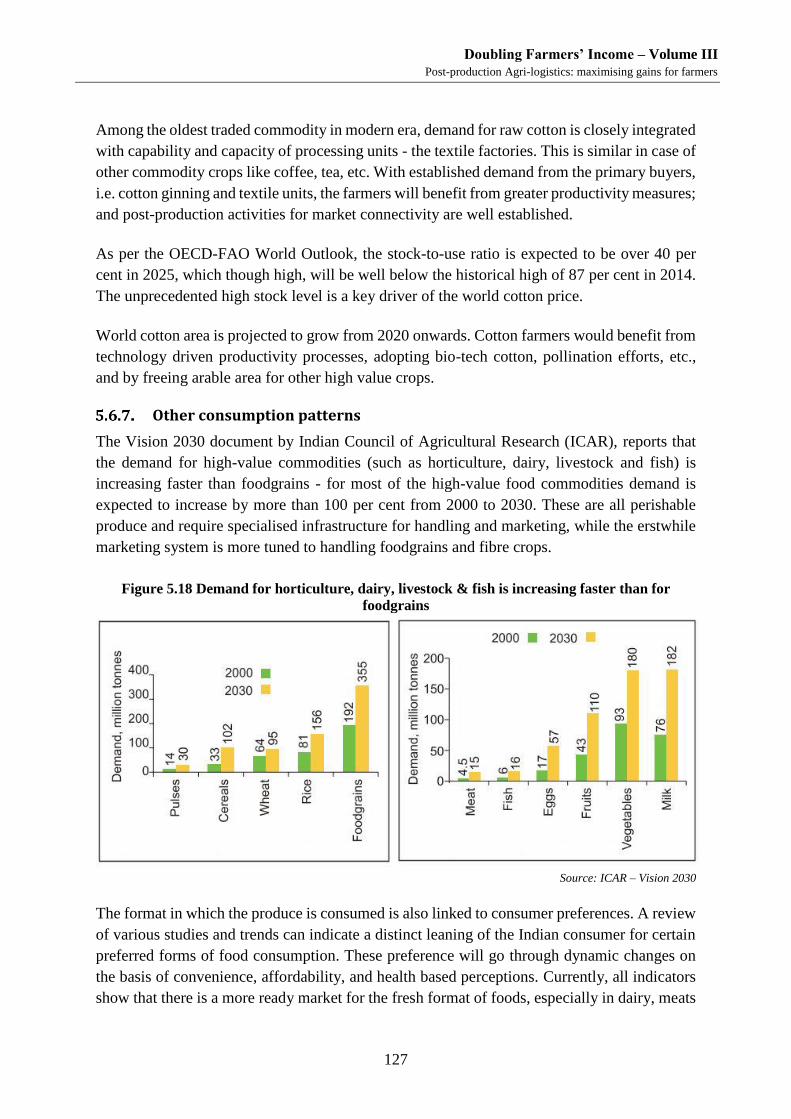
Post-production Agri-logistics: maximising gains for farmers
i
Foreword
The country has witnessed a series of concerted discussions dealing with the subject of
agriculture. In 1926, the Royal Commission of Agriculture was set up to examine and report
the status of India’s agricultural and rural economy. The Commission made comprehensive
recommendations, in its report submitted in 1928, for the improvement of agrarian economy
as the basis for the welfare and prosperity of India’s rural population. The urban population
was about 11 per cent of the whole, and demand from towns was small in comparison. The
Commission notes, that communication and physical connectivity were sparse and most
villages functioned as self-contained units. The Commission encompassed review of
agriculture in areas which are now part of Pakistan, Bangladesh and Myanmar. The net sown
area in erstwhile British India was reported as 91.85 million hectares and cattle including
buffaloes numbered 151 million. Almost 75 per cent of the cultivated area was under cereals
and pulses, with rice and wheat occupying 46 per cent of the net sown area. The area under
fruits and vegetables was about 2.5 per cent and that under oilseeds and non-food crops was
about 20 per cent. In the ensuing years, as well known, the country underwent vast changes in
its political, economic and social spheres.
Almost 40 years later, free India appointed the National Commission on Agriculture in 1970,
to review the progress of agriculture in the country and make recommendations for its
improvement and modernisation. This Commission released its final report in 1976. It refers to
agriculture as a comprehensive term, which includes crop production together with land and
water management, animal husbandry, fishery and forestry. Agriculture, in 1970 provided
employment to nearly 70 per cent of the working population. The role of agriculture in the
country’s economic development and the principle of growth with social justice, were core to
the discussions. The country was then facing a high population growth rate. After impressive
increase in agricultural production in the first two Five Year Plans, a period of stagnancy set in
and the country suffered a food crisis in the mid-1960s. The report in fifteen parts, suggested
ample focus on increased application of science and technology to enhance production.
Thirty years hence, the National Commission for Farmers was constituted in 2004 to suggest
methods for faster and more inclusive growth for farmers. The Commission made
comprehensive recommendations covering land reforms, soil testing, augmenting water
availability, agriculture productivity, credit and insurance, food security and farmers
competitiveness. In its final report of October 2006, the Commission noted upon ten major
goals which included a minimum net income to farmers, mainstreaming the human and gender
dimension, attention to sustainable livelihoods, fostering youth participation in farming and
post-harvest activities, and brought focus on livelihood security of farmers. The need for a
single market in India to promote farmer-friendly home markets was also emphasised.
The now constituted DFI (Doubling Farmers’ Income) Committee besides all these broad
sectoral aspects, invites farmers’ income into the core of its deliberations and incorporates it as
the fulcrum of its strategy. Agriculture in India today is described by a net sown area of 141
million hectares, with field crops continuing to dominate, as exemplified by 55 per cent of the
area under cereals. However, agriculture has been diversifying over the decades. Horticulture
now accounts for 16 per cent of net sown area. The nation’s livestock population counts at
more than 512 million. However, economic indicators do not show equitable and egalitarian
growth in income of the farmers. The human factor behind agriculture, the farmers, remain in
Doubling Farmers’ Income – Volume III
Post-production Agri-logistics: maximising gains for farmers
ii
frequent distress, despite higher productivity and production. The demand for income growth
from farming activity, has also translated into demand for government to procure and provide
suitable returns. In a reorientation of the approach, this Committee suggests self-sustainable
models empowered with improved market linkage as the basis for income growth of farmers.
India today is not only self-sufficient in respect of demand for food, but is also a net exporter
of agri-products occupying seventh position globally. It is one of the top producers of cereals
(wheat & rice), pulses, fruits, vegetables, milk, meat and marine fish. However, there remain
some chinks in the production armoury, when evaluated against nutritional security that is so
important from the perspective of harvesting the demographic dividend of the country. The
country faces deficit of pulses & oilseeds. The availability of fruits & vegetables and milk &
meat & fish has increased, thanks to production gains over the decades, but affordability to a
vast majority, including large number of farmers too, remains a question mark.
The impressive agricultural growth and gains since 1947 stand as a tribute to the farmers’
resilience to multiple challenges and to their grit & determination to serve and secure the
nation’s demand for food and raw material for its agro-industries.
It is an irony, that the very same farmer is now caught in the vortex of more serious challenges.
The average income of an agricultural household during July 2012 to June 2013 was as low as
Rs.6,426, as against its average monthly consumption expenditure of Rs.6,223. As many as
22.50 per cent of the farmers live below official poverty line. Large tracts of arable land have
turned problem soils, becoming acidic, alkaline & saline physico-chemically. Another primary
factor of production, namely, water is also under stress. Climate change is beginning to
challenge the farmer’s ability to adopt coping and adaptation measures that are warranted.
Technology fatigue is manifesting in the form of yield plateaus. India’s yield averages for most
crops at global level do not compare favourably. The costs of cultivation are rising. The
magnitude of food loss and food waste is alarming. The markets do not assure the farmer of
remunerative returns on his produce. In short, sustainability of agricultural growth faces serious
doubt, and agrarian challenge even in the midst of surpluses has emerged as a core concern.
Farmers own land. Land is a powerful asset. And, that such an asset owning class of citizens
has remained poor is a paradox. They face the twin vulnerabilities of risks & uncertainties of
production environment and unpredictability of market forces. Low and fluctuating incomes
are a natural corollary of a farmer under such debilitating circumstances. While cultivation is
boundarised by the land, market need not have such bounds.
Agriculture is the largest enterprise in the country. An enterprise can survive only if it can grow
consistently. And, growth is incumbent upon savings & investment, both of which are a
function of positive net returns from the enterprise. The net returns determine the level of
income of an entrepreneur, farmer in this case.
This explains the rationale behind adopting income enhancement approach to farmers’ welfare.
It is hoped, that the answer to agrarian challenges and realization of the aim of farmers’ welfare
lies in higher and steady incomes. It is in this context, that the Hon’ble Prime Minister shared
the vision of doubling farmers’ income with the nation at his Bareilly address on 28th February,
2016. Further, recognizing the urgent need for a quick and time-bound transformation of the
Doubling Farmers’ Income – Volume III
Post-production Agri-logistics: maximising gains for farmers
iii
vision into reality, a time frame of six years (2016-17 to 2022-23) was delineated as the period
for implementation of a new strategy.
At the basic level, agriculture when defined as an enterprise comprises two segments –
production and post-production. The success of production as of now amounts to half success,
and is therefore not sustainable. Recent agitations of farmers (June-July 2017) in certain parts
of the country demanding higher prices on their produce following record output or scenes of
farmers dumping tractor loads of tomatoes & onions onto the roads or emptying canisters of
milk into drains exemplify neglect of other half segment of agriculture.
No nation can afford to compromise with its farming and farmers. And much less India,
wherein the absolute number of households engaged in agriculture in 2011 (119 million)
outpaced those in 1951 (70 million).Then, there are the landless agricultural labour who
numbered 144.30 million in 2011 as against 27.30 million in 1951. The welfare of this
elephantine size of India’s population is predicated upon a robust agricultural growth strategy,
that is guided by an income enhancement approach.
This Committee on Doubling Farmers’ Income (DFI) draws its official members from various
Ministries / Departments of Government of India, representing the panoply of the complexities
that impact the agricultural system. Members drawn from the civil society with interest in
agriculture and concern for the farmers were appointed by the Government as non-official
members. The DFI Committee has co-opted more than 100 resource persons from across the
country to help it in drafting the Report. These members hail from the world of research,
academics, non-government organizations, farmers’ organizations, professional associations,
trade, industry, commerce, consultancy bodies, policy makers at central & state levels and
many more of various domain strengths. Such a vast canvas as expected has brought in a
kaleidoscope of knowledge, information, wisdom, experience, analysis and unconventionality
to the treatment of the subject. The Committee over the last more than a year since its
constitution vide Government O.M. No. 15-3/2016-FW dated 13th April, 2016 has held
countless number of internal meetings, multiple stakeholder meetings, several conferences &
workshops across the country and benefitted from many such deliberations organized by others,
as also field visits. The call of the Hon’ble Prime Minister to double farmers’ income has
generated so much of positive buzz around the subject, that no day goes without someone
calling on to make a presentation and share views on income doubling strategy. The Committee
has been, therefore, lucky to be fed pro-bono service and advice. To help collage, analyse and
interpret such a cornucopia of inputs, the Committee has adopted three institutes, namely,
NIAP, NCAER and NCCD. The Committee recognizes the services of all these individuals,
institutions & organisations and places on record their service.
Following the declaration of his vision, the Hon’ble Prime Minister also shaped it by
articulating ‘Seven Point Agenda’, and these have offered the much needed hand holding to
the DFI Committee.
The Committee has adopted a basic equation of Economics to draw up its strategy, which says
that net return is a function of gross return minus the cost of production. This throws up three
(3) variables, namely, productivity gains, reduction in cost of cultivation and remunerative
price, on which the Committee has worked its strategy. In doing so, it has drawn lessons from
the past and been influenced by the challenges of the present & the future.
Doubling Farmers’ Income – Volume III
Post-production Agri-logistics: maximising gains for farmers
iv
In consequence, the strategy platform is built by the following four (4) concerns:
Sustainability of production
Monetisation of farmers’ produce
Re-strengthening of extension services
Recognizing agriculture as an enterprise and enabling it to operate as such, by
addressing various structural weaknesses.
Notwithstanding the many faces of challenges, India’s agriculture has demonstrated
remarkable progress. It has been principally a contribution of the biological scientists,
supplemented by an incentivizing policy framework. This Committee recognizes their valuable
service in the cause of the farmers. It is now time, and brooks no further delay, for the new
breed of researchers & policy makers with expertise in post-production technology,
organization and management to take over the baton from the biological scientists, and let the
pressure off them. This will free the resources, as also time for the biological scientists to focus
on new science and technology, that will shift production onto a higher trajectory - one that is
defined by benchmark productivities & sustainability. However, henceforth both production &
marketing shall march together hand in hand, unlike in the past when their role was thought to
be sequential.
This Report is structured through 14 volumes and the layout, as the readers will appreciate, is
a break from the past. It prioritizes post-production interventions inclusive of agri-logistics
(Vol. III) and agricultural marketing (Vol-IV), as also sustainability issues (Vol-V & VI) over
production strategy (Vol. VIII).The readers will, for sure value the layout format as they study
the Report with keenness and diligence. And all other volumes including the one on Extension
and ICT (Vol. XI), that connect the source and sink of technology and knowledge have been
positioned along a particular logic.
The Committee benefited immensely from the DFI Strategy Report of NITI Aayog. Prof.
Ramesh Chand identified seven sources of growth and estimated the desired rates of growth to
achieve the target by 2022-23. The DFI Committee has relied upon these recommendations in
its Report.
There is so much to explain, that not even the license of prose can capture adequately, all that
needs to be said about the complexity & challenges of agriculture and the nuances of an
appropriate strategy for realizing the vision of doubling farmers’ income by the year of India’s
75th Independence Day celebrations.
The Committee remains grateful to the Government for trusting it with such an onerous
responsibility. The Committee has been working as per the sound advice and counsel of the
Hon’ble Minister for Agriculture and Farmers’ Welfare, Shri Radha Mohan Singh and Dr. S.K.
Pattanayak, IAS, Secretary of the Department of Agriculture, Cooperation and Farmers’
Welfare. It also hopes, that the Report will serve the purpose for which it was constituted.
12th August, 2017 Ashok Dalwai
Chairman, Committee on
Doubling Farmers’ Income
Doubling Farmers’ Income – Volume III
Post-production Agri-logistics: maximising gains for farmers
v
About Volume III
The third volume of the Report of the Committee on Doubling Farmers’ Income (DFI)
examines the status of post-production operations, with the perspective that a farmer’s produce
must connect with multiple avenues to obtain value at each place, across time & space and in
various forms. Physical connectivity to markets is the primary medium by which farmers can
access the opportunity to exchange the produce for money. Any lack of logistics connectivity
to convey their harvest to markets, results in a lowering of the farmers’ ability to monetise their
produce.
The Committee recognised that in the strategy for doubling farmers’ income the major
challenges lie in the post-production domain. Given that farmers have demonstrated their
ability to produce as targeted, it is the monetisation phase that should now support them in
capturing optimal value. In this context, it is generally seen that marketing comes into
discussion immediately. In the opinion of the DFI Committee, an efficient marketing system is
only a necessary condition, and does not ensure that the higher price discoveries are
automatically transferred to the farmer-producers. It therefore concluded, that monetisation and
not marketing alone should form the fulcrum of post-production phase. It logically decided to
consider a complement of agri-logistics, value addition and agri-marketing as integral to an
efficient monetisation system. In fact, the Committee also recognised that monetisation has to
be supported by appropriate farm harvest practices.
This volume focuses on agri-logistics, which enables connectivity between production and
consumption zones over both space and time with minimal loss of quality and quantity. It
considers various aspect of agri-logistics, with primary focus on preconditioning, storage and
transportation of farm produce. The farmer requires improved logistics to move the harvest; to
choose the time of transaction, they need the cold-chain for perishables, or safe storage for
foodgrains; and for a change in form, they need near-farm processing facilities to feed the raw
material. These aspects are discussed in this volume, riveted to a demand driven approach. The
focus is kept farmer-centric, so as to enable them with choice and connectivity to immediate
market opportunities, to minimise food loss and recover maximum value from the produce.
Other developments required over the longer term, are also indicated. However, this volume
emphasises on the immediate need to ensure that farmers as primary actors, get connected to
existing demand and available opportunities, to extract value from every grain, every ounce
and every drop they produce.
The guiding and governance aspects of the system of agricultural marketing is discussed in
detail in Volume IV that follows. There exists an organic link between agri-logistics and
markets, which entails a seamless transfer of produce to complete the monetisation process.
Ashok Dalwai
--- --- ---
Doubling Farmers’ Income – Volume III
Post-production Agri-logistics: maximising gains for farmers
vii
Doubling Farmers’ Income Volume III
“Post-production Agri-logistics:
maximising gains for farmers”
Contents
Foreword ------------------------------------------------------------------------------------ i
About Volume III ------------------------------------------------------------------------------- v
Figure 1.1 Global Food Loss & Waste ................................................................................................................... 4
Figure 1.2 Food Loss & Waste by Region .............................................................................................................. 5
Figure 1.3 Greenhouse gas emissions from Food Loss & Waste (FLW) ............................................................... 8
Figure 1.4 Pillars for post-production activities – maximising farmers gain as outcome ..................................... 12
Figure 2.1 Primary Points for Farmers to Monetise Produce ............................................................................... 16
Figure 2.2 Produce-wise primary channels to monetise output ............................................................................ 18
Figure 2.3 Supply is wasted unless linked with Demand ..................................................................................... 19
Figure 2.4 Availability of godowns & warehouses .............................................................................................. 20
Figure 2.5 Managing Inventory in Foodgrains .................................................................................................... 22
Figure 2.6 Regulated Market yards in India since independence ......................................................................... 24
Figure 2.7 Infrastructure Status for Cold-chain .................................................................................................... 26
Figure 2.8 Indicative Cost Build in the supply of Agri-Produce .......................................................................... 35
Figure 2.9 Inefficiencies in Logistics chain .......................................................................................................... 36
Figure 2.10 Inflation alongside Growth in Production ......................................................................................... 37
Doubling Farmers’ Income – Volume III
Post-production Agri-logistics: maximising gains for farmers
x
Figure 3.1 Individual Value Chains integrate into the Sectoral value system ...................................................... 44
Figure 3.2 Value chain system must consider both flow of value and flow of produce ....................................... 46
Figure 3.3 Post-production cost inefficiencies in Agri-Supply chain ................................................................... 49
Figure 3.4 Price build-up in Fruits & Vegetables ................................................................................................ 51
Figure 3.5 Aggregation & preconditioning for more value to Farmer Groups ..................................................... 51
Figure 3.6 Price pressure from Margin Seekers .................................................................................................... 52
Figure 3.7 Poultry - smallholder generic value chain ........................................................................................... 53
Figure 3.8 Cost and Margin of traditional poultry backyard (before the intervention) ......................................... 54
Figure 3.9 Re-engineered Poultry Value Chain system ........................................................................................ 55
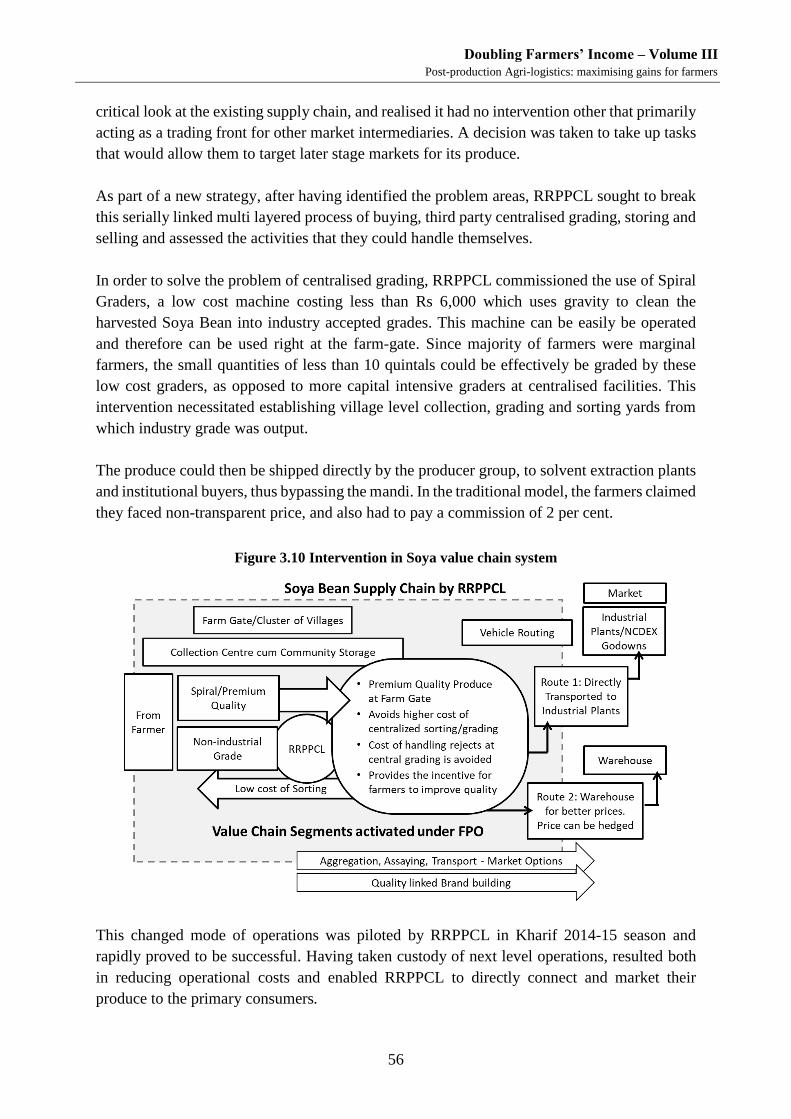
Figure 3.10 Intervention in Soya value chain system ........................................................................................... 56
Figure 3.11 JEEViKA intervention in Soya Marketing Model............................................................................. 57
Figure 3.12 Capturing greater Value for farmers .................................................................................................. 58
Figure 3.13 Price advantage from intervention ..................................................................................................... 58
Figure 3.14 Price Spread of Large Cardamom ..................................................................................................... 60
Figure 4.1 Options when planning an Agri-business ........................................................................................... 67
Figure 4.2 Next step interventions for farmer groups ........................................................................................... 69
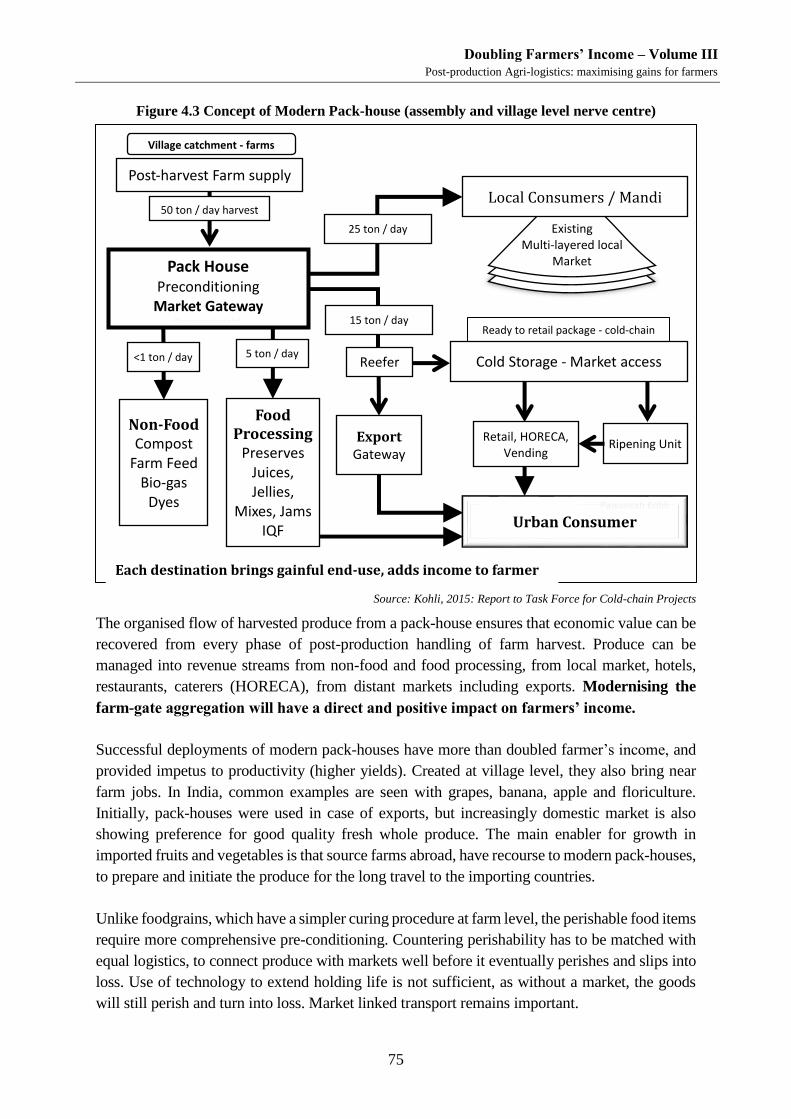
Figure 4.3 Concept of Modern Pack-house (assembly and village level nerve centre) ........................................ 75
Figure 4.4 Foodgrain procurement & distribution ................................................................................................ 76
Figure 5.10 Global trend in Meat prices ............................................................................................................ 122
Table 6.2 Sample Outcome based Targets to develop ........................................................................................ 138
Doubling Farmers’ Income – Volume III
Post-production Agri-logistics: maximising gains for farmers
1
Introduction In an effort to boost socio-economic growth in the agriculture sector, the Government has set the goal
of doubling farmers’ income by 2022-23. To achieve this, government support and policy interventions
need to shift from a production-driven approach to a demand-driven value system. While other
incremental efforts to optimise production continue, focus on the post-production logistics connectivity
is needed as a key transformation to redefine agriculture from cultivation alone, to gainful agriculture.
About the Report
Taking into consideration the target period to double farmers’ income, the Committee to
Double Farmers’ Income has assigned highest priority to interventions that will transform the
way the existing production can realise the maximum value for farmers. To achieve the desired
income growth, every grain, every ounce, every drop produced must connect with all market
avenues to reach gainful-end-use. This compels the need to direct immediate attention to the
post-production activities and marketing system for farmers produce.
Volumes III and IV of the report by the Committee, focus on the strategies to eliminate the
constraints faced by farmers and other players in the value system and to improve access to
agricultural markets, and for farmers’ produce to find full value. The analysis and strategies for
expanding agricultural trade in the country, with a focus on infrastructure creation, enhanced
access to marketing information, efficient flow of produce to markets, lowered transaction cost
and reduced food loss is among the topics covered in these volumes.
Volume III lays emphasis on the post-production activities that safeguard agricultural produce,
transfer the harvested value to markets, and allow to connect with markets across place, time
and form. The deliberations have been kept farmer-centric, concentrating on the capabilities
needed, such that the full quantity of production is monetised and delivered to their consumers
safely, in quantity and quality. Preparing the farmers’ produce for next stage handling after
harvest, connecting to their points of sale, storage where necessary, and other options to
maximise value gain for the farmers is discussed in this volume.
Volume IV of this report deliberates on the desired improvement and reforms in the agricultural
marketing system. The post-production activities need to be market linked and hence,
marketing is approached as a market intelligence function, to provide vital information of
consumer demand to the farmers, so as to direct their activities towards the relevant market
channels. Expanding the market breadth for farmers so as to promote competition and
transparency is another function of marketing. To capture greater value for farmers, also
requires a regulatory environment that works to increase alignment and collaboration with the
private sector and other stakeholders in the food system. Strategies to make the marketing
system demand linked and more relevant to farmers is discussed in Volume-IV.
The distinction is made, that from the famer’s perspective, post-production activities are those
that empower their access and physical connectivity with available market channels. Here, agri-
Doubling Farmers’ Income – Volume III
Post-production Agri-logistics: maximising gains for farmers
2
logistics is the backbone that connects the produce to destination points, where they can
conclude a desired transaction. The marketing system on the other hand, provides information
to direct the flow of produce to points of demand and facilitates the transaction. Marketing is
therefore expected to be the brain that ensures production and post-production activities are
appropriately market linked, and that markets channels are expanded to absorb future growth
in production.
To maintain a demand linked agenda, an inverse approach is needed, to work backwards from
Fork-to-Farm, to ensure that demand is integrated with supply side, rather than only selling at
a convenient market at available prices or pushing production into storage merely for
unplanned and deferred returns. A fork-to-farm approach has to be adopted, whereby the
reverse flow of information from markets to farmers would also enable the farmer to take
informed decisions about what to market, when to market and to whom. For connecting with
markets, logistics is the backbone, and functions to bridge supply to consumption centres.
Avoiding food loss in the post-harvest supply chain to result in an increase in the saleable
quantity of produce is vital towards fulfilling this agenda. It also requires integration of the
value chain segments that connect fork to farm, while providing farmers the options to take
part in post-production activities.
India's food security concerns had focused on maximising production. The Green Revolution
resulted in achieving not only food security but also generated large surpluses. However, this
has not always translated into equivalent economic development for the farming community.
The “Green Revolution” as was implemented all over the world, had focused on increasing
farm yields, especially in developing countries, with aim to cope with growing demand from
an increasing population. The green revolution involved use of agro-technologies on the
production side of the value cycle – improving quality of seeds including hybrids, promoting
double cropping and the increased use of fertilizers, irrigation and farm mechanisation.
Expanding the area under farms was also a thrust area and entire agenda was to produce more.
At Independence in 1947, the country’s population was about 335 million and many doubts
were expressed on India’s self-sufficiency to feed its rapidly growing masses. The farmers
responded robustly in past decades by producing ever more - as a result, with a population
about four times in size since independence, today the concerns are no longer about production
but about marketing the surplus, besides the cost effectiveness of production.
By the start of 1980, having benefited from initiatives taken under ambit of the green
revolution, the country transformed itself from a food deficit zone to become an exporter of
food. In addition, ‘Operation Flood’ fronted India’s white revolution in agriculture, wherein
the country is today the world’s largest producer of milk and dairy products. Today, India is
shifting focus from a purely production bias, towards market linked agriculture for realising
gains to farmers’ for their greater wellbeing and income.
Doubling Farmers’ Income – Volume III
Post-production Agri-logistics: maximising gains for farmers
3
Agriculture Production in India
Compared with farm production at the start of the 1960s, India now harvests 40 times as much
tomato, 14 times more potato, 8 times more wheat, thrice as much in poultry and meat, 13 times
more fish, 8 times more milk and almost 40 times more eggs. The scaling up of our food
production far surpassed the growth in population (which grew about 2.8 times from approx.
460 million in 1961). India is a net exporter of agricultural products and 7th largest globally.
India’s success in production manifests across various agrarian sectors. In some sectors like milk,
the country tops in the world production ranking with an output of 164 million tonnes in 2016-17.
Table 1.1 Production figures - India (annual 2015-16)
Source: MoAFW
Advance estimates for 2016-17 indicate that foodgrains output is to touch 275 million tonnes
with pulses at a record 22.95 and cereals at 252.73 (rice, wheat, maize, millets, etc.) million
tonnes. Oilseeds production is estimated at 32.1 million tonnes in 2016-17 and in horticulture
the production is reported to touch 300 million tonnes. Sugarcane, cotton, jute, tea, coffee,
tobacco, meat, fish, wool, etc. will add another 330-350 million tonnes to the farm produce.
India produces far more than one billion tons of agricultural produce. Agriculture can no
longer be viewed from the narrow prism of foodgrains alone. Today, horticulture, combined
with produce from fisheries, dairy and livestock, captures almost 70 per cent of agriculture’s
contribution to national GDP, making these sectors the prime drivers for rural wealth and
economic productivity. For example, horticulture utilises only 24.5 million hectares (approx.
16 per cent of total area under agriculture), yet contributes the highest (almost 38 per cent) to
agricultural GDP. The billion plus tonnes, has to be differentially addressed post-production,
and linked to multiple markets. Investments in post-production and market connectivity are
key to advancing agricultural growth, as well to ensure the resilience of the sector.
Public sector contribution in gross capital formation (GCF) in agriculture remains important,
though private sector share of GCF in agriculture is more than 80 per cent. However, it mostly
Horticulture (million tonnes)
Livestock (million tonnes)
Potato 43.42 Inland Fish 7.21
Onion 20.93 Marine Fish 3.58
Tomato 18.73 Fish 10.79
Mango 18.64 Butter & Ghee 5.4
Citrus 11.58 Meat & Poultry 7.02
Banana 29.14 Milk 155.5
Brinjal 12.52 Egg 83929 million pcs
Aromatics, Cashew,
Flowers, Honey, etc. 19.95
Field Crops (million tonnes)
Spices 6.99 Wheat 92.29
Fruits 90.18 Rice 104.41
Vegetables 169.06 Pulses 16.35
Total Horticulture 286.19 Sugar cane 348.45
Doubling Farmers’ Income – Volume III
Post-production Agri-logistics: maximising gains for farmers
4
comes from farmers’ investment and not the corporate sector. During 2011-12, GCF in
agriculture was 7.7 per cent of total gross capital formation in the country.
Having almost 141 million hectares under agriculture (second largest globally), India’s
concerns today, are about empowering farmers with greater market connectivity to achieve
greater value realisation. Producing food in sufficient quantity is no longer the immediate
concern; instead now, apprehensions relate more to minimising post-harvest losses, securing
of easy and affordable access to the food and in improving resource use and input management.
The country produces multiple crops across many States and production is being increasingly
developed in clusters so as to promote economy of scale at the farm-gate. This transformation
is expected to grow as more Farmer Producer Organisations (FPO) are created and through
impetus from Cooperatives or other collaborative farming practices. There is a likelihood that
entire villages will collaborate as farmer groups and operate farms collectively in the shape of
Village Producer Organisations (VPOs).
Modernisation of farming practices have led to the production of substantial surplus of produce,
concentrated at the cultivating region. This surplus is local to the producing area and there is
need to connect with consumption at urban clusters, which are concentrated at a distance from
the producing areas. In case of foodgrains, the surplus is captured by private sector (milling
units) and through procurement by FCI, NAFED and State government agencies. However, in
case of perishable produce, such as fruits, vegetables and others with lower holding life, the
surplus when not procured, tends to go waste causing a loss to farmer and of national resources.
Food Loss Concerns
Globally accepted reports of the Food and
Agriculture Organization (FAO) of the United
Nations, state that 1.3 billion tonnes of food
incurs loss and waste, with the highest share in
case of fruits, vegetables and tuber crops.
Internationally, various food loss studies are
done, though these were not structured under
common metrics and parameters, making
comparisons impractical. However, with greater
understanding of food loss and food waste, a
harmonised interpretation has emerged.
Food loss is now understood to occur when the food produced for human consumption is
discarded or suffers a reduction in quantity, or is diverted for non-food purpose. The cause is
primarily the miscarriage in post-harvest connectivity to markets, i.e., failure in the handling
and connecting of food produced to consumption points.
Figure 1.1
Global
Doubling Farmers’ Income – Volume III
Post-production Agri-logistics: maximising gains for farmers
5
Food waste, on the other hand, is understood as the waste that occurs in the hands of
consumers, conscious or unconscious due to habitual excesses or other rejection factors, i.e.,
food discarded at consumer-end, after monetisation of the farmers’ produce. Both food
loss and food waste are unproductive and constitute a measure of the physical mass squandered.
Figure 1.2 Food Loss & Waste by Region
Extracted from - HLPE, 2014. Food losses and waste in the context of sustainable food systems. (High Level Panel of Experts on Food Security & Nutrition of the Committee on World Food Security, Rome.
Globally, food loss is far higher than the waste that is incurred after monetisation. The food loss
that occurs post-harvest and before connecting to markets, is effectively a loss of saleable volume
and value, and is an economic burden on the food supply system. It is obvious, that for the
purpose of doubling farmers’ income, mitigating food loss in the supply chain is a first priority.
The need for scientific post-production management is obligatory to ensure that maximum
quantum of production can reach and fulfil market demand, and thereby add to farmers’ income.
Food losses must be understood in the light of frequent reports of unfulfilled demand of certain
vegetables in large cities, while the same crop is discarded alongside farms, for want of effective
market linkage. Coincidentally, most high perishable crops are also high nutrition foods and
comprise the bulk of high-value-agriculture (HVA).
The physical losses (weight loss and discards) were appraised at varied stages of movement to
market of the selected produce. Each stage of measure was where a change in custody occurred
and the produce entered the next step in its post-harvest journey to market.
a) At farm-gate (point of harvest);
b) At collection point (aggregation);
c) On loading onto transport;
d) During transportation;
e) On receiving at Wholesale point
Inclement conditions and poor handling results in loss of saleable quantity from farm to market.
The losses beyond point of wholesale or the waste in hands of the consumers were not assessed
in this study. The instances where post-production surplus could not even enter the market supply
chain, due to non-availability of logistics connectivity, were not evaluated. Unable to be directed
Doubling Farmers’ Income – Volume III
Post-production Agri-logistics: maximising gains for farmers
8
towards a market, much of such surplus is not even evacuated from farms and this quantity is
incurred as added total food loss.
A more comprehensive study of post-harvest food loss, under a harmonised yardstick, in all
regions of the country is indicated.
This Committee reviewed the unit level information from NSSO 70th round (refer Chapter-4,
Volume-II of the DFI report), to estimate that losses in case of fruits and vegetables are 34 and
44.6 per cent respectively. Grain inventory in central pool also incurs food loss when its usable
life expires within warehouses, due to an inadequate delivery and distribution mechanism.
The loss in the farm-to-market link segment, whether at 15 per cent or 40 per cent, is an
unmistakeable opportunity to add to farmers’ income. The physical loss of produce, denies
revenue off the production and detracts any motivation to produce more. Such high loss can be
averted with better physical connectivity, post-production. To ensure that the infrastructure
development is market linked, the planners can benefit from adopting an inverse approach,
working backwards from consumption to farms. Produce that reaches points of demand is less
likely to result in food loss. Lack of a delivery system, is the leading cause for recurring losses.
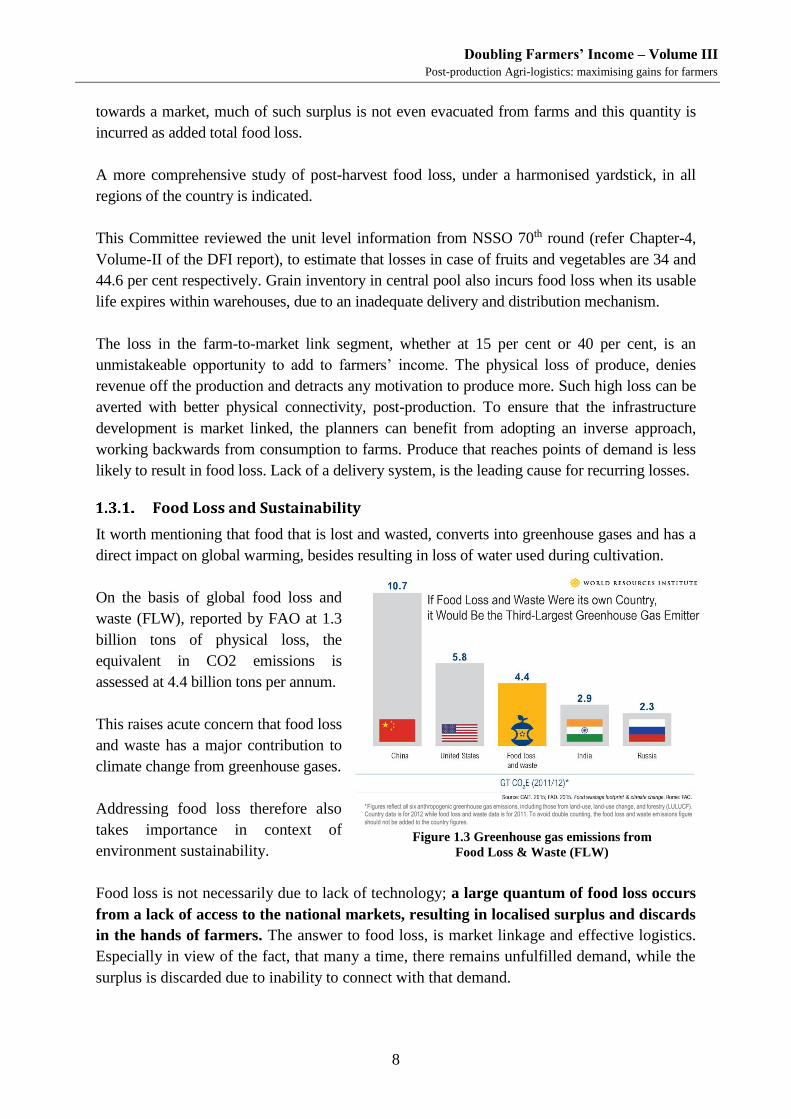
Food Loss and Sustainability
It worth mentioning that food that is lost and wasted, converts into greenhouse gases and has a
direct impact on global warming, besides resulting in loss of water used during cultivation.
On the basis of global food loss and
waste (FLW), reported by FAO at 1.3
billion tons of physical loss, the
equivalent in CO2 emissions is
assessed at 4.4 billion tons per annum.
This raises acute concern that food loss
and waste has a major contribution to
climate change from greenhouse gases.
Addressing food loss therefore also
takes importance in context of
environment sustainability.
Food loss is not necessarily due to lack of technology; a large quantum of food loss occurs
from a lack of access to the national markets, resulting in localised surplus and discards
in the hands of farmers. The answer to food loss, is market linkage and effective logistics.
Especially in view of the fact, that many a time, there remains unfulfilled demand, while the
surplus is discarded due to inability to connect with that demand.
Figure 1.3 Greenhouse gas emissions from
Food Loss & Waste (FLW)
* Figures reflect all six anthropogenic greenhouse gas emissions, including those from land-use, land-use change, and forestry (LULUCF). Country data is for 2012 while food loss and waste data is for 2011. To avoid double counting, the food loss and waste emissions figure
should not be added to the country figures.
Doubling Farmers’ Income – Volume III
Post-production Agri-logistics: maximising gains for farmers
9
Connecting with Consumers
Traditionally, agriculture production was met by ready demand, proximate to farms, which
allowed for quick evacuation of the output for use by local consumers. The consumer base
originally included the farmers themselves, the local populace and the local traders. Similarly, in
case of milk and other perishable produce, the farmer or his associated market retailer would
directly aggregate, select and retail the produce locally.
Decades ago, the flour millers were small scale service providers for the end consumer - the
consumers themselves carrying the whole grain to the local mill and paying for grinding service
to convert it into consumable flour. In effect, the number of actors between farmer and consumer
were at a minimum. In that same period, the selling range for the majority of the crops was also
limited and mainly local for perishable items like milk, fruits and vegetables.
In time, the increases in the volume being traded attracted the growth of intermediary traders and
processors. Initially this was more evident in the trade of jute, cotton and foodgrains, and
subsequently in case of other farm produce. With urbanisation resulting in mega population
centres, the city consumer became more remote from farming communities, in terms of physical
access as well as in terms of the pricing mechanism. This lack of connectivity, allowed for the
shift in control of the supply side into the hands of intermediaries, with increasingly non-
transparent monopolies surfacing in the demand side of agri-produce.
Further, as demand and the quantity being traded increased, the market attracted bigger scale in
food processing units. These units became another demand option for the farmers for selling their
primary produce. In consequence, the flour grinding service provider, became the large flour
miller who also became the branded product owner. This transformation of a service into a
market intermediary, delinked the farmer from direct consumer interface. For all intents and
purposes, the processing units became another wholesale buyer for certain primary produce.
The consolidation and organisation of the market linkages, resulted in the farmers being more
reliant on traders or intermediaries to connect with the markets. The system is expected to bring
efficiencies and improvement in market access, allowing for more productive use of the yield.
However, the system also tended to give rise to multiple intermediaries and positioned the farmer
at a disadvantage, by relegating control over the primary pricing to the intermediary procurement
level. This changed dynamics is a necessary aspect of supply chain, when needing certain vertical
integration for connecting with large demand that is remote to the production area. Such vertical
integration helps mitigate price risk for the farmers and the first consumer.
There are two major methods for price risk management in the agriculture sector. One is by
locking the price of the harvest in advance through contracts and/or by using the harvest as
collateral for credit. This option is discussed in other Volumes of this report. The traditional
method for farmers is to enter pre-harvest agreements at a specific price for future delivery. Also
known as forward contracts this allowed producers to lock-in at a predetermined price, thus
Doubling Farmers’ Income – Volume III
Post-production Agri-logistics: maximising gains for farmers
10
reducing risk, but also foregoing the possibility of benefiting from positive price deviations.
The other route to manage price risk, is developing a marketing network with the logistics ability
to link the harvest with multiple markets. The opportunity from price variation that arises from
demand-supply gaps, can then be taken advantage of, provided the capability to deliver the
harvest to markets is made possible, starting at village level. The advantage of agri-logistics is
that it allows for more immediate value realisation prospects, and in turn also helps smoothen
market fluctuations by directing produce to where demand remains unfulfilled.
To help in doubling farmers’ income and to make agriculture more viable and sustainable, there
is a need to develop holistic post-production management to enable efficient market connectivity
for perishable and semi-perishable produce. Such connectivity would entail cross-geographical
flow of fresh foods and preferably involve multi-modal transport connectivity.
There is also need to empower the farmers to develop horizontal integration with multiple market
channels and not remain restricted to only one market avenue. This is most relevant in case of
perishable produce where the consumer preference for fresh whole farm produce continues to
prevail. Direct access to multiple markets is most beneficial in case of perishables, as time is of
essence and the high quality produce can rapidly downgrade into non-saleable discards or a
depletion in the quantity. The marketing system also plays an important role in opening up
markets, and to ensure it also opens farmer’s options for crop diversification and crop planning.
Marketing Evolution
An important landmark in the agricultural marketing scene was the establishment of regulated
markets and advent of regulating the market practices in the country. Its roots were the first
legislation was the Berar Cotton and Grain Market Act of 1887 and the recommendations of the
Royal Commission on Agriculture 1928, which empowered the British Resident to take measures
to regulate the trade practices and to establish market yards in the countryside.
After independence, during the sixties and seventies, most of the States enacted and put into
operation the Agricultural Produce Markets Regulation (APMR) Acts. All primary wholesale
assembling markets were brought under the ambit of these Acts. Well laid out market yards and
sub-yards were constructed and for each market area, an Agricultural Produce Market Committee
(APMC) was constituted to frame the rules and enforce them. Thus, a form of organised
agricultural marketing came into existence through the regulated markets.
The main objective to regulate the practices at primary agriculture market yards was to protect
the interests of farmers by providing an environment of fair play and transparency in transactions.
The focus crops for these markets were mainly cotton and foodgrains.
The APMC regulated marketing system was more suited to the premise that the buyers would
transact at these yards for their primary requirements, with farmers. A principle understanding
was that the ensuing transactions would be a reflection of the demand and could be suitably
Doubling Farmers’ Income – Volume III
Post-production Agri-logistics: maximising gains for farmers
11
monitored for future growth and regulated for other development purposes. The markets were
designed to provide trading platform for farmers and to facilitate short supply chains to nearby
users, next stage terminal markets, or agro-processors.
At that time, the concept of population migration and urbanisation, leading to demand from cross
regional markets (pan-India) was not built into the mechanism. The mandatory physical flow of
produce through the designated markets, became a bottleneck when the produce needed to move
to remotely located demand. Also, as the amounts and demographics of the produce changed, it
was observed that the regulations had not considered any future changes in post-production
handling and the specific logistics of certain produce types. The established system of markets
could no longer efficiently cater to changed demand patterns from across the nation.
In order to overcome the shortcomings and challenges of traditional regulated marketing system
(APMCs), Government of India initiated reforms, the Model APMC Act of 2003 and the Model
APMC Rules 2007. A comprehensive review was undertaken in 2016-17, of the Model Acts &
Rules, which showed, that the market reforms at best had turned out to be patchy and incomplete.
The Department of Agriculture, Cooperation & Farmers’ Welfare (Ministry of Agriculture &
Farmers’ Welfare) thereafter formulated recommendations known as the Model Agricultural
Produce and Livestock Marketing (Promotion & Facilitation) Act, 2017 (APLM), which
incorporates changes to reflect the agenda of a unified national market for agriculture, besides
facilitating alternate market channels, including alternate online marketing platform. This Model
APLM Act recommends, inter-alia, establishing of markets in the private and cooperative sectors,
direct marketing and farmers markets and not only provides a level playing field to existing
stakeholders, but opens the marketing arena to new stakeholders. These initiatives will introduce
competition for fair play and transparency in price discovery.
The various aspects of the agricultural marketing system and its next level evolution and
implementation are discussed in detail in Volume IV of this report.
Focus on Post-production Activities
Greater value to farmers will arrive through assigning emphasis on post-production activities that
connect the farm harvest to markets for value realisation. This will include expanding the
marketing range of the farmers. Importance on reducing losses in the post-harvest supply chain
and providing pan-India marketing options will be part of this agenda.
The key strategy behind policy interventions that aid post-production market linkages, are:
i) to promote direct access by farmers to all avenues to monetise their produce;
ii) to organise post-harvest aggregation activities at farm-gate (village/gram panchayat
level) so as to build capacity to minimise handling loss and convert would-be-loss
into value;
Doubling Farmers’ Income – Volume III
Post-production Agri-logistics: maximising gains for farmers
12
iii) to modernise the agricultural logistics infrastructure to support safe-keeping of the
produce and fast-track the delivery to markets;
iv) to promote private sector participation in expanding the reach and range of farm
produce into consumption centres, both domestic and international.
Doubling real income will require the doubling the selling volume of farmer‘s produce,
expanding links with markets, including alternate marketing channels, while adding to near-farm
earning opportunities. In the first instance, provision of physical access from farms to point of
sales will be an important empowering capability.
For purpose of maximising the gain to farmers, the strategy indicates that fice pillars be adopted
to direct the post-production activities:
Figure 1.4 Pillars for post-production activities – maximising farmers gain as outcome
This ability for farmers to directly deliver to a range of wholesale markets or to an allied industry,
requires farm-gate (village level) aggregation capabilities in large scales, along with transport
integration. The ability to assemble and move their produce to markets of choice, will improve
the farmers’ access to each avenue, where their produce is monetised. Enhanced and independent
access to markets is expected to motivate and justify increase in production and improved farm
productivity.
This document lays emphasis on the post-production activities that advance the farmers
immediate access to avenues that monetise his/her produce, in more quantum, to capture greater
value. Post-harvest market links are presented as a key accelerator for doubling farmers’ real
income. Post-production activities improve handling, management, marketing and processing of
the produce. It also means infrastructure investment, as well as job creation, both of which are
allied to the core business of farming.
Promote the range & reach of farmers into multiple markets, including alternate channels for greater selling choice and to increase selling volumes; in turn promote greater farm yields.
Market Expansion & Access
Maximise the volume of farm produce that reaches gainful end-use and reduce the dilution of input resources; especially due to food loss in the output supply chain.
Reducing Produce Wastage
Improve inventory management in warehouses, enhance post-harvest care to retain quality; to empower farmer groups with physical connectivity to lead to scale in cultivation and post-harvest.
Upgrading Agri-Logistics
Unified market for agricultural produce, to support cross-regional agricultural trade. Promote alternate marketing channels including online marketing platforms with greater role for private sector.
Enabling Reforms & Investment
Maintaining a steady long term trade regime and ease of business at plant quarantine stations so as to promote international trade and long term export contracts.
Enabling Trade Regime for Exports
Doubling Farmers’ Income – Volume III
Post-production Agri-logistics: maximising gains for farmers
13
Annotation
Through policy measures initially adopted in mid-1960s, such as input subsidy, minimum
support price, public storage, procurement and distribution of foodgrains, trade protection
measures and regulation of markets, India has witnessed the transition from subsistence to
situation of surplus production. The policy interventions from 1960s, were primarily meant to
avert situations which may again lead to a deficit.
India’s agriculture has travelled a long way from the period of subsistence farming to that of
surplus output, calling for a paradigm shift in the management of the agricultural marketing
system. It emerges that agriculture markets established in 1960 to handle the deficit are now
required to undergo a paradigm shift to handle marketable surplus efficiently e.g provisioning
alternative marketing channels, participation of private sector and providing an enabling
environment to achieve faster growth including using e-platforms for market expansion.
Gross Capital Formation in the economy (in 2010-11) was Rs. 26,80,579 crore with public sector
share of 25 per cent. In agriculture and allied sector, GCF was Rs. 1,97,364 crore with public
sector share at 16 per cent. Future spend in agriculture and allied sectors, can look to aim at
suitably enhancing the market linkage and connectivity of farmers.
Business practices have undergone changes and old concepts or regionally isolated production
for a regions local consumption have been laid aside. For example, textiles can source raw fibre
competitively from any location in the world, process into products under large economy of scale
to sell to consumers worldwide, using supply chains having a global foot print. This practice is
most prevalent when raw produce and final product has longer and easily managed holding life.
In case of perishable produce, the saleable life cycle is short and the serviceable range of farmers
is normally restricted to local demand, within their delivery range. The lack of physical
connectivity with non-local (distant) domestic demand, is evidenced by produce being discarded
in growing regions, while high price situations are seen at consumption points in other States.
This food loss is due to unfulfilled demand in presence of available supply, and is an indicator of
shortfall in logistics. As a result, the resources that go into producing such high value crop, perish
with the food item adding more pressure on the pricing mechanism.
The reach of the post-production supply chain is decided by the usable and manageable life cycle
of the material. Any shortfall in market connectivity fails to bridge the gap between demand and
supply and this in turn detracts from the income of the farmer.
India has shifted direction to strategically drive a change that brings its harvest to more gainful
end-use, and to make its agriculture sustainable on both commercial and environmental terms.
Hence, the need for an inverse approach that works backwards from Fork-to-Farm, and ensures
that demand is integrated with supply side, rather than pushing production into storage merely
for unplanned and deferred (uncertain) returns.
Doubling Farmers’ Income – Volume III
Post-production Agri-logistics: maximising gains for farmers
14
Therefore, rushing to the conclusion of large scale diversification into high value crops would
amount to jumping the gun, in the absence of demand assessment over distance & time and
concurrently putting in place the attendant agri-logistics. From a post-production marketing
perspective, the key accelerator to reduce the time to double farmers’ income, is greater physical
access to a unified nation as one market. Enhanced physical connectivity from farms to markets
will enable farmers to trade with wholesale buyers of choice and capture more equitable value.
To double farmers’ income, the gains from productivity and production need to translate
into revenue generation. Augmenting direct connectivity to multiple market channels, so
as to reduce losses and increase the volume of produce sold, is an immediate opportunity.
Key Extracts
This volume focuses on post-production activities from the farmer’s perspective, and
the methods for farmers to connect with various market channels to realise maximum
value from the production.
Volume IV focuses on the agricultural marketing, to systemically direct the
production and selling activities in the right direction, and bringing growth in markets.
Indian agriculture has changed from a state of deficit into one of the world’s top
producers, generating on-farm surpluses in various crop segments.
Globally, and in India, there remains a high burden of Food Loss that happens in the
food distribution chain, from farm-to-consumers. Sustainability concerns arise.
Inefficient practices in the logistics chain, and restrictions to cross-national
connectivity contribute to food loss and detract from farmers’ income.
Single market concept of unified agricultural market is impeded by rules and
regulations that were not designed to expand agricultural marketing as one country.
Consumption has consolidated in dense pockets at cities and marketing rules need to
amend and adapt to the changed practices in the supply chain.
Globalisation allows certain hardy commodities to be sourced from across the world.
Price discovery is impacted by global signals for certain commodities.
Consumer preference, with growing affluence, shifts towards high nutrition foods.
Diversification into high-value agriculture will need high-technology logistics chains.
Farming will see transformative changes if empowered with organised logistics
starting at farm-gate with information that makes the activities become market linked.
Doubling Farmers’ Income – Volume III
Post-production Agri-logistics: maximising gains for farmers
15
Post-production Activities and Infrastructure Cultivators have mainly focused on production activities and the path to monetise the produce is
primarily through regulated markets. The changed dynamics in consumer preference, shifting from
hardy staple crops to more perishable high value and high nutrition foods has raised the need to revisit
the scope of agriculture, from cultivation alone into managing the overall agri-business eco-system.
A few decades ago, our cities adjoined lush fertile farmlands; whose farmers would harvest
their produce in morning hours, and aggregators would rush the produce to the local wholesale
centres. The normal practice for fresh food supply (to reach our homes), was quite simple and
a matter of routine. By the time the consumer visited to buy his/her daily basket, the local
grocer or street vendor was ready with that day’s fresh supply. This was an effective food
supply system, even though highly fragmented, which ensured that each morning’s harvest was
at the tables well within 24 hours. There were those awkward vagaries of weather and
unbalanced supply, but the consumer too was a friendly and understanding stakeholder.
Urbanisation has ensured that farmlands are distanced very many kilometres away, entry points
into our cities are becoming bottlenecks and transit time to reach markets is ever increasing.
No more can the harvest reach the consumer within its natural life cycle. What now reaches
the consumers’ homes, was harvested a previous couple of days or more ago! This extended
‘in-transit’ time is compounded by the perpetually growing demand, wherefore the increase in
handling volume adds to the delays. In case of perishable produce, the marketable life cycle is
under pressure, and food quality is degraded rapidly without recourse to enablers such as cold-
chain. Lack of cold-chain systems force farmers to monetise their produce at first instance by
selling into food processing units, inefficient wholesale markets; and these sales are the only
opportunity, low down in the value chain system, and do not empower the farmers
In case of cereals and grains, the post-production life cycle of the produce is naturally lengthier.
The foodgrains are procured and stored in godowns and warehouses, for the near future
requirements. These requirements can be consumption demand or as assessed for national
security purposes. The market tends to rely only on cues from ongoing government
interventions, by way of Minimum Support Price (MSP) and procurement targets of the
government, or Minimum Export Price (MEP) to arrive at the associated market value.
It seems that demand is not clearly established or regularly monitored in a fashion that provides
easily accessible market intelligence that informs market differentiated demand. With currently
established methods for price signals, the concerned farmers are influenced by the price
information that prevailed during the previous crop season. The infrastructure required to
market or monetise their produce, is also effected by the unstructured market environment.
Farmer’s Market Channels
Post-production, the farmers monetise their produce and, across agricultural produce segments,
having a series of market avenues as their selling points. These can be itemised to the following,
Doubling Farmers’ Income – Volume III
Post-production Agri-logistics: maximising gains for farmers
16
each being a destination of the first stage evacuation, where the primary monetisation of
farmers’ produce occurs:
a. Near-farm mandis, where farmers deliver produce for local buyers – for primary
assembly and wholesale transaction.
b. Near-farm ‘Farmers markets’, where farmers can sell to consumers – retail transaction.
c. Government procurement of foodgrains – a controlled and limited market avenue.
d. Near-farm processing units where farmers can deliver produce as raw material for new
product creation – contracted or wholesale transaction.
e. Near-farm aggregation points, such as milk-chillers and pack-houses, for extending
onwards market connectivity – very few developed for horticultural crops.
Figure 2.1 Primary Points for Farmers to Monetise Produce
Farmers perforce sell their produce at first points of evacuation, to local intermediaries (at-farm
or near-farm), constrained and limited in their selling range, and thereby have no further direct
role in the overall value system. Lack of logistics connectivity with farmer groups, effectively
means that the markets are getting farther away from the reach of most villages, and therefore,
the small and medium farmers find it technically and economically unviable to directly access
various markets. Currently, intermediaries as aggregators step in to complete the logistics link
for farmers, at times even upto the first level assembly markets (local mandi).
On the basis of produce type, the primary selling avenues for farmers are as follows -
Foodgrains
a. Central and State government procurement
b. Wholesale markets – local and APMC including eNAM
c. Private procurement by traders, milling factories and food processors
Doubling Farmers’ Income – Volume III
Post-production Agri-logistics: maximising gains for farmers
17
Perishable food (horiculture, fish, meats)
d. Wholesale mandis – local and national
e. Farmers markets for retail to local consumers
f. Private procurement by organised fresh food retailers
g. Private procurement by food processing units
Milk produce
h. Village level collection (pooling and cooling) – local collection
i. Local fresh to region – local retail
j. Private procurement – by cooperatives or private dairy processors
Non-Food produce
k. Wholesale mandis – local and APMC including eNAM
l. Private procurement by traders and manufacturers
m. Government Boards for Rubber, Silk Coffee, Tea, etc.
In case of foodgrains, the government procurement system is an important mode of monetisation
where implemented. Yet, further growth in this mode is linked to the capacity of the exchequer
to continue to spend on such procurement and develop a robust disposal mechanism like public
distribution system, sale in the markets, etc. Lack of secondary encashment or proper liquidation
of the surplus stocks held in inventory, eventually result in physical loss of the food stored and
amount to a waste of national resources. Expanding access of farmers to other market channels
is needed, to avoid wasteful procurement taking up the inefficient role of a market surrogate.
Depending on the crop type grown, farmers have more than one avenue to sell into, provided
there are options at hand to connect to each opportunity. However, between the farmer and each
primary user of the produce, there exists the need to aggregate/pre-condition/prepare the farm-
produce for the transaction, which the farmer is currently not empowered for. This inability to
manage the produce for market linkage, allows for intermediary players to step in as facilitators.
However, when there are too many intermediaries with too little facilitation, such mediation cost
detracts from the total value realised per unit of produce that was made available at farm-gate.
At first instance, from the perspective of empowering farmers, it is obvious that this warrants
focus on building their capacity as groups or individually, at farm-gate, to directly connect their
produce with their primary buyers – each one in effect, being the first instance for farmers to
monetise their produce.
Currently, the farmer is not even directly linked with his/her primary buyer and this transaction
is subject to multi-layered interfaces between the farmer and primary buyer. Any intermediary
between first level consumer or primary buyer, is an unproductive interface and damaging to the
farmer business dealing. Though the primary buyer is also an intermediary between the end-
consumer and farmer, he provides material linkage with the end-consumer.
There is also the option for farmers to directly connect with end-consumer though peri-urban
Doubling Farmers’ Income – Volume III
Post-production Agri-logistics: maximising gains for farmers
18
farmers markets and similar, but these only provide a short term gain on price point and do not
fully contribute to overall growth that can be harnessed by connecting and expanding their reach
to other markets. Holistically, farmers’ need the empowering ability to deliver to every market
channel for monetising all of their production.
The organised intermediary either safe-guards the harvested value on its passage to end-
consumer, or converts the raw produce into a more consumable format before selling to end-
consumer. At a policy level, the farmer needs to be empowered with ability to directly connect
with the primary buyer, and not necessarily with the end-consumer.
Figure 2.2 Produce-wise primary channels to monetise output
In most of the above market opportunities, the farmer is de-linked from the end-consumer at
first instance, and is not provided opportunity to scale his/her growth independent of these
established market channels. The ensuing business models tend to force the farmers to be
subservient and integrate vertically with a trader or marketer as fixed rate suppliers.
To transform the farmers’ income, models that promote their integration horizontally across
multiple avenues or consumption markets also need to be strengthened. This will empower
farmers with the ability to choose across multiple channels to sell. In practice, farmers would
be guided to partake in both, i.e. vertical and horizontal integration with market opportunities.
Horizontal integration expands links with multiple markets, encourages competition
and entrepreneurship, mitigates risk from localised demand fluctuations, offers access
to other earning options, and results in greater transparency in agricultural trade; but
requires associated development of suitable logistics capabilities and services.
Doubling Farmers’ Income – Volume III
Post-production Agri-logistics: maximising gains for farmers
19
Vertical integration with a single buyer, provides an assured off-take, mitigates risk
from price fluctuations from external factors, promotes fixed specified quality for
processors, and builds long term business interdependences… but limits farmers’
growth linked to the growth of the buyer.
Figure 2.3 Supply is wasted unless linked with Demand
Infrastructure status
The primary development focus for agricultural post-production infrastructure, has been in the
form of warehousing and cold stores, for holding inventory for extended durations. The
infrastructure needed to connect with markets after the storage phase may not have found
strategically linked policy support.
Warehousing for non-perishable produce
The country has established widespread godowns and storage for foodgrains, including cereals
and pulses. The Warehousing Development & Regulatory Authority (WDRA) estimated that
storage capacity of 126.96 million tonnes was available in the public, cooperative and private
sectors in the form of godowns and warehouses, in 2016.
Table 2.1 Status of available storage capacity in warehouses
SN Organisation / sector Storage Size
(in million tonnes)
1 Food Corporation of India (FCI) 35.92
2 Central Warehousing Corporation (CWC) 11.72
3 State Warehousing Corporations (SWCs) and State agencies 45.28
4 Cooperative Sector 15.07
5 Private Sector 18.97
Total 126.96
2015-16 Annual Report of the Warehousing Development and Regulatory Authority
Doubling Farmers’ Income – Volume III
Post-production Agri-logistics: maximising gains for farmers
20
On the basis of estimates by the National Institute of Agricultural Economics and Policy
Research (NIAP - ICAR) that foodgrain demand will reach 281 million tonnes by 2020-21 (179
for direct household consumption and 102 in indirect demand like fodder, seed, industrial use,
etc.), a need for approx. 196 million tonnes of warehousing (about 70 per cent of production)
is frequently projected. However, interventions to improve inventory turn-ratios will free
warehousing space, and should be kept in mind when planning new capacity.
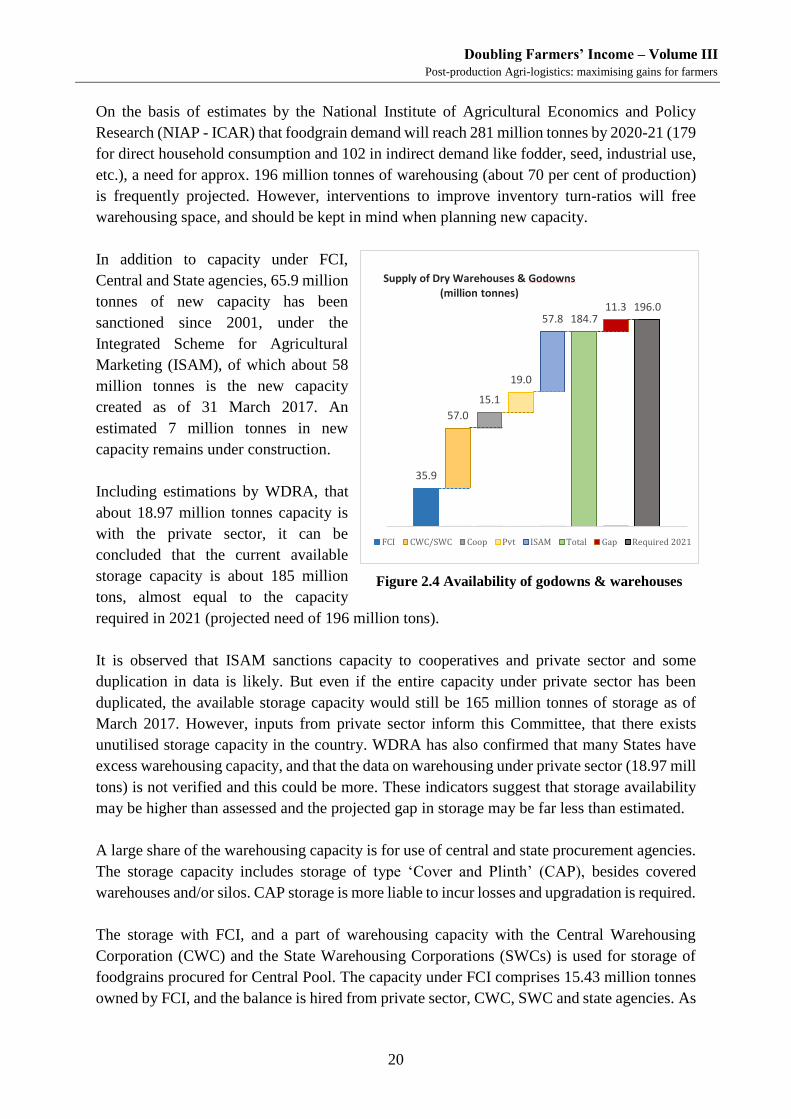
In addition to capacity under FCI,
Central and State agencies, 65.9 million
tonnes of new capacity has been
sanctioned since 2001, under the
Integrated Scheme for Agricultural
Marketing (ISAM), of which about 58
million tonnes is the new capacity
created as of 31 March 2017. An
estimated 7 million tonnes in new
capacity remains under construction.
Including estimations by WDRA, that
about 18.97 million tonnes capacity is
with the private sector, it can be
concluded that the current available
storage capacity is about 185 million
tons, almost equal to the capacity
required in 2021 (projected need of 196 million tons).
It is observed that ISAM sanctions capacity to cooperatives and private sector and some
duplication in data is likely. But even if the entire capacity under private sector has been
duplicated, the available storage capacity would still be 165 million tonnes of storage as of
March 2017. However, inputs from private sector inform this Committee, that there exists
unutilised storage capacity in the country. WDRA has also confirmed that many States have
excess warehousing capacity, and that the data on warehousing under private sector (18.97 mill
tons) is not verified and this could be more. These indicators suggest that storage availability
may be higher than assessed and the projected gap in storage may be far less than estimated.
A large share of the warehousing capacity is for use of central and state procurement agencies.
The storage capacity includes storage of type ‘Cover and Plinth’ (CAP), besides covered
warehouses and/or silos. CAP storage is more liable to incur losses and upgradation is required.
The storage with FCI, and a part of warehousing capacity with the Central Warehousing
Corporation (CWC) and the State Warehousing Corporations (SWCs) is used for storage of
foodgrains procured for Central Pool. The capacity under FCI comprises 15.43 million tonnes
owned by FCI, and the balance is hired from private sector, CWC, SWC and state agencies. As
35.9
57.0
15.1
19.0
57.8 184.711.3 196.0
Supply of Dry Warehouses & Godowns(million tonnes)
FCI CWC/SWC Coop Pvt ISAM Total Gap Required 2021
Figure 2.4 Availability of godowns & warehouses
Doubling Farmers’ Income – Volume III
Post-production Agri-logistics: maximising gains for farmers
21
on February 2017, the total capacity available for storing Central Pool Stocks was 77.625
million tonnes, with average utilisation of 66 per cent of capacity. This comprises covered
godowns of 62.608 million tonnes and CAP storage of 15.017 million tonnes. The idle capacity,
34 per cent in February, would vary through the year, depending on the cyclic procurement and
release patterns.
From 2013 to 2015, Central Pool held an average stock of 52 million tonnes of rice and wheat,
ranging from a low of 43.9 million tonnes in April 2014 to a peak of 77.7 million tonnes in
June 2013. The warehousing capacity in use by Central Pool in previous 6 years is tabled:
Table 2.2 Warehousing capacity used for Central Pool (2011 to 2017)
*Calculation of GVA-FPI for 2015-16 is based on the assumption that the per cent age share of GVA from FPI in total GVA
from Food Products, Beverages and Tobacco for 2015-16 is same as the per cent age share of GVA from FPI in total GVA of Food Products, Beverages and Tobacco for 2014-15
Source: MOFPI Annual Report, 2016
During 2015-16, the food processing industry as a component of manufacturing and agriculture
sectors, contributed 9.1 per cent and 8.6 per cent of gross value added (GVA), respectively.
The infrastructure needs of individual processing units are both crop and procedure dependent,
while the common intervention of warehouses and transport, either dry or refrigerated, are a
universally shared resource. Various industrial processes are undertaken in processing units
which may include multiple activities for milling, cooking, manufacturing, weaving or those
that are preservative in function.
Previous Reports
A series of studies have assessed the infrastructure status, especially in respect of cold-chain
for perishable produce.
High Level Expert Committee (1998)
The then Department of Agriculture & Cooperation had constituted the High Level Expert
Committee in 1998, under then Additional Secretary Shri JNL Srivastava. The committee
assessed an infrastructure gap of 3.9 million tonnes in cold storage capacity for horticultural
crops as in 1998. At that time, when the horticultural production stood at 130 million tonnes,
the total available cold storage capacity was 11.1 million tonnes.
In case of onions, this Expert Committee reported that the country had about half a million
tonnes (4.6 lakh tons) at hand in form of market godowns and on-farm storage.
Doubling Farmers’ Income – Volume III
Post-production Agri-logistics: maximising gains for farmers
31
Since 1998, horticultural production has more than doubled to about 300 million tonnes (in
2016-17) and the cold storage capacity has tripled to about 34 million tonnes of space.
However, a running gap of about 3 to 5 million tonnes is expected to remain as old cold stores
are shut down and replaced. This Expert Committee also observed, that besides cold storages
for potatoes and chillies, the concept of cold-chain, for the horticulture sector, had yet to make
headway. The report stated that a holistic approach to ensure appropriate supply chain
management from farm to consumer needed to be studied for appropriate development.
Planning Commission Committee (2012)
The erstwhile Planning Commission setup a Committee under Dr. Saumitra Chadhuri to
evaluate steps to encourage and strengthen supply chains for farm produce. The Committee
submitted its report6 in May 2012, laying special emphasis on integration of logistics activities
for more efficient market linkage. The Committee recommended modernising the grain storage
system by promoting modern grain silos.
A key recommendation was that the cold-chain system would expressly not follow a pure price
arbitrage business model, but should have objective to smoothen episodic output with regular
demand, to result in greater price stabilisation and market connectivity. The Committee
recommended the National Centre for Cold-chain Development (NCCD) be operationalised
and strengthened. This Committee also remarked, that the past push to build up cold storage
capacity had not borne successful results, especially in case of vegetables and most fruits. It
also inferred, that this was on account of large deficiencies in the logistics system between the
farms to the final consumers.
This Committee had made references to a primary review of cold storage capacity, by National
Spot Exchange Ltd. (NSEL) in 2010, and to the earlier report of the High Level Expert
Committee set up under Shri JNL Srivastava in 1998. There was no prior baseline study or
comprehensive infrastructure assessment available for perusal of this Committee for assessing
the state of integration of the distribution chain with the associated logistics infrastructure.
Nevertheless, the Committee emphasised on integration of logistics and food processing units
for more effective market linkage.
Baseline Survey of Cold storages (2014)
The National Centre for Cold-chain Development (NCCD), made operational under
DAC&FW, recommended carrying out a baseline survey of existing cold storages in the
country as a precursor to further assessment on status and gaps in the infrastructure. This survey
was conducted by National Horticulture Board (NHB), undertaken by Hansa Research Group
and completed in Dec-2014.7 The survey brought out that the recorded capacity created in the
country was 32.9 million tonnes (6586 units). Some capacity was not traceable or found
operational, which counted to 1219 units or approx. 6 million tonnes.
6 Planning Commission- The Committee on Encouraging Investments in Supply Chains Including Provision for Cold Storages
for More Efficient Distribution of Farm Produce (May 2012) 7 All India Cold Storage Capacity and Technology - Baseline Study; NHB-2014
Doubling Farmers’ Income – Volume III
Post-production Agri-logistics: maximising gains for farmers
32
Table 2.6 Baseline Survey of Cold storages
Type of cold store (CS) Distribution
(%)
Mean Size
(tons)
Mean age
(years)
Mean
Cooling
(KW)
Capacity
Utilisation
(%)
Farm-gate CSs 68 5,531 11.64 250 75
Dedicated to Mandi (wholesale markets) 8 5,004 12.29 476 69 Dedicated to pack-houses 0.5 2,861 11.12 124 65 PCC - port based – includes sea, air and railway
2 2,405 10.46 1,606 60 Part of network of cold stores – for distribution
1 4,870 7.27 85 79 Dedicated to industrial facilities or own use 5 4,624 10.52 227 68 Pharma use CSs 1 6,108 15.91 429 69 Animal husbandry CSs 7 1,681 12.57 232 74 Processed items only 5.1 4,043 12.64 209 71
Total 5,003 11.79 273 75
Source: All India Cold Storage Capacity & Technology – Baseline Study (NHB-2014)
The baseline survey included physical visits and geo-
tagging of each cold store unit and the information was
collected through questionnaires served to each
manager/owner. The data collated included information on
overall energy costs, manpower used, technology in use, etc.
Further, only 17 per cent were pre-engineered constructions.
The majority of cold stores are stand-alone units and do not
own direct connectivity in the form of refrigerated transport.
Overall, good capacity utilisation of 75 per cent every year
over the previous 3 years was reported. A product wise
segmentation of the cold stores showed that more than 80 per cent was used for horticultural
crops but only 0.5 per cent had any link with a pre-conditioning pack-house, thus limiting their
utility to a few crops only. Essentially, the majority of cold stores in horticulture were planned
for warehousing the more hardy crops types like potato and dried chilly.
The survey was designed only for cold storages, and hence similar comprehensive querying of
other cold-chain assets is unavailable.
Task Force for Cold Chain Projects (2014)
In September 2014, a Task Force for Cold Chain Projects was set up by the Ministry of Food
Processing Industries. This Task Force put aside the NSEL report which had recommended the
creating a total of 61 million tonnes in cold storages. The Task Force reported, that in
discussions it emerged that the gap in cold storage capacity, earlier assessed at 29 million
tonnes on the basis of the NSEL review, may not be required and recognised the need for a
more realistic assessment of cold storage/cold-chain capacity8.
8 Task Force for Cold-chain Projects – MoFPI – September 2014.
Doubling Farmers’ Income – Volume III
Post-production Agri-logistics: maximising gains for farmers
33
However, at that stage the Task Force agreed to target additional capacity of 7.5 million tonnes
over the next 5 years (2015-2020). The Task Force recommended to await the findings of a
more comprehensive assessment being undertaken by the NCCD 9.
Assessment of Cold-chain Status & Gaps (2015)
In 2015 the “All India Cold-chain Infrastructure Capacity - Assessment of Status & Gap”
(AICIC, 2015), was completed and the key findings are listed in table 2.4. This was the first
scientific assessment to evaluate the status of the entire chain of logistics for perishable crops.
The study segregated the infrastructure on the basis of categories and from a supply chain
perspective. The evaluations were made backwards from ‘Fork-to-Farm’ for short holding life
produce, and in case of long holding items, it assessed the need for storable surplus. The
assessment also took to differentiate between size and throughput capacity of the cold-chain,
by taking into consideration the total holding life of individual items in the cold-chain.
This study highlighted that the space available as cold storages was not as much in shortfall as
earlier felt, though a far larger gap remained in the form of village level modern pack-houses,
refrigerated transport units and ripening units. The report emphasises that lack of allied
infrastructure components, left the cold stores for the use of a limited number of produce types.
The associated inefficiencies in the supply chain meant that the majority of perishable produce
could not avail the benefits from the cold supply chain. Notwithstanding the world’s largest
capacity in refrigerated warehouses, India was falling far short of integrating the cold-chain.
Inefficiencies in the Infrastructure
Over the years, a number of organisations and institutions have been established with a mandate
to develop one or more areas of agricultural marketing such as procurement, storage and
Post-production Agri-logistics: maximising gains for farmers
46
In considering the overall, vertically integrated series of activates, in the agri-business value
system, there is opportunity for farmers or farmer groups to partake in additional activity
segments. Farmers as groups or as individuals, can be empowered to take on the next level of
activity in the post-production supply chain and thereby capture more value for themselves
within the larger marketing system. Otherwise their value chain ends at their first customer.
In evaluating a value system, observing one entity’s activities alone is not sufficient. The value
gained from each activity in the supply chain has to be assessed. Therefore, a value chain
assessment is incomplete unless market demand and total value to be realised are not part of
the agenda. When optimisation of backend activities is undertaken, without associated value to
be gained in mind, it only adds to the costs, without the intended realisation in value.
Figure 3.2 Value chain system must consider both flow of value and flow of produce
The marketing structure has usually limited its focus on enabling the forward flow of produce.
However, for every value chain, the driving information should be demand from its target
customer or market, which determines the reverse flow of value. Prior demand information,
applied judiciously, makes each activity, from pre-production to production to post-production,
market-led and market linked. This helps to make any business model effective and efficient.
Demand projection is vital to any value based system, so as to avoid cost over-runs and make
the venture profitable. Understanding market demand includes measures of quantity, quality,
food safety, and effects price discovery at time of transaction. This matter is also discussed in
DFI Volume IV.
Doubling Farmers’ Income – Volume III
Post-production Agri-logistics: maximising gains for farmers
47
Agri-business options
The strategic business interest & capability of each concerned enterprise would define the
scope and extent of the value chain segments they develop. Primarily the involvement would
preferably extend to manage a chain of activities, differentiated two primary business models:
a) Uninterrupted farm-to-market sourcing and distribution of agricultural produce. This is
globally seen in the fresh whole food trade.
This value chain system benefits from direct out-reach into multiple market locations,
empowered through the intervention of agri-logistics. This model allows farm produce to
directly access markets to generate a revenue stream linked to the quantum sold. Improved
market access and selling quantities, in turn support a resultant increase in productivity,
and also offer scope to stabilise demand-supply fluctuations. This intervention benefits
from procedures that lead to a seamless supply chain, having minimal intermediate
handling and low losses in the chain. The operation relies majorly on activities that entail
aggregation and transportation networks. The entire logistics chain should preferable
extend from farm-gate to consumption centres across regions, wherein the produce does
not undergo any change to its essential or natural characteristics
The produce handled is whole food as there is no real change to its intrinsic value through
any transformative value-addition to the goods. The value-add is to the farmer and it comes
from being able to access to destinations where demand dynamics offer a higher price than
the collective cost of production and cost of logistics.
This model allows to capture greater value by reaching out to markets, and akin to the
marketing chain of a finished product (e.g. packing and transporting coal to a point of
consumption). This is effectively distance based price arbitrage. Without such supply
connectivity, the product being handled has a limited market range, limited close to
producing region, and cannot capture optimal value. Collaboration among multiple
logistics asset owners is a norm for this system of value chain integration to operate.
In this model, the individual value chain of a farmer, group of farmers or farming company,
can be extended to partake in some of the aggregation and connectivity functions for
enhanced gains. The business growth is linked to the capability to expand reach to more
markets and market capture. The operational risks involved for the produce owner are based
on the speed and integrity of the handling in the supply chain.
At price discovery level, the demand supply dynamics will effect value at destination – this
model can profit greatly from spot market prices and can equally, suffer losses if produce
is directed to markets having surplus. The latter risk can be mitigated with advance market
information and with the ability to divert the supply to other markets. This sort of supply
chain is most applicable in case of perishable fruits & vegetables and high-value produce
where storing for a deferred sales would only add to storage linked risks, without any
assurance of an associated gain at the delayed date.
Doubling Farmers’ Income – Volume III
Post-production Agri-logistics: maximising gains for farmers
48
b) The interrupted market chain of agri-produce, which primarily can be of two types:
i. Suitable raw material is sourced by industrial processing units for transforming into a
manufactured food item. An interruption in the above chain occurs by way of an agro-
factory, wherein, the primary natural characteristics of raw produce is effected through
ingredient additives, physical or chemical change, etc. In this system, value-addition to
the produce is done in direct terms. The result is a new product with revised value. The
product is subject to labelling and other compliance, and can have a predetermined
expiry. The raw materials used can be multiple produce, by-products of other processing,
additives or non-agri-products like minerals, chemicals, polymers, colouring, etc.
This value chain system typically relies on sourcing special variety crops, through
contractual arrangements, and/or sourcing culled produce in case of some perishables.
The initial logistics intervention is mainly in the form of primary storage which can be
captive to an industrial facility, to feed the processing line(s). The output from the
production lines then utilise post-production market channels to reach end-consumers.
To a large extent, this value chain model is market linked or demand driven, highly
competitive and established at industry level. The scope of famers’ involvement is as a
vertically integrated supplier, growth being linked to the growth of the raw material
purchaser. The final product is no longer categorised as farm produce, but is a product of
industry. This agri-value chain system is unmistakably the most prevalent worldwide and
involves the agro-processing industry such as for cotton, cereals, medicinal products,
beverages, tea / coffee, and similar sectors. For the majority of this industry, they need
not purchase raw materials directly from farmers and can source the same on demand
from inventory held by traders or wholesalers. However, direct purchase from farmers
can be more beneficial, provided there is reasonably priced agri-logistics for conveyance
of the produce. In case of perishables like processing tomato or peas, the industry needs
to source more immediately from farms, as the raw material has a short holding life and
needs to be processed soon after harvest.
ii. Bulk inventory holding of farm produce for delayed or timed liquidation. The intended
model is to buffer against episodic production. This model is used when storing Central
Pool Stocks, where inventory is held to stock surplus produce for food security, and
consequently for timed public distribution.
The model is also in play for feeding processing units and for opportunistic trade. Stored
inventory allows produce owners to take advantage of timed price arbitrage, making it
partisan to any propensity to control supply to markets. Time based price arbitrage is a
waiting game, when delayed demand outstrips supply and also has various involved risks.
In both above business options (a & b), the primary value engaged is the farm produce, with
logistics is the tool that facilitates both the initial and final transaction/trade. To unlock the
Doubling Farmers’ Income – Volume III
Post-production Agri-logistics: maximising gains for farmers
49
agri-value chain system to its fullest extent, the strategic business interest has to consider
encompassing multiple activity components in the involved supply chain.
In cases where an infrastructure is not integrated with the produce-centric agri-value chain, the
business is automatically limited in scope, to realisation from rental or service fees on the
logistics infrastructure created. This approach is distinct from businesses that take ownership
of the produce and capture greater value by taking part in other value chain segments in the
overall supply chain.
The incentives by the government are designed to encourage wilful entrepreneur participation,
across the multiple infrastructure components that are understood to be necessary for building
integrated logistics chains in the output supply chain. Integration of value chains into a value
system, entails a common chain of custody across all logistics activities and necessitates
collaboration among existing activity owners. Increasingly, wholesalers are directly taking up
aggregation and transport to capture a larger share of value, resulting from their onus in
improving efficiencies.
To develop the entrepreneurial ecosystem further, so as to unlock value to its fullest extent and
to make it attractive without taking recourse to financial support from government, there is also
the need to make associated reforms to alleviate the compulsory physical movement of
harvested produce through ‘mandis’, as well to address the correlated base infrastructure (road
and power connectivity). DFI Volume 4 discusses desired changes in the market architecture.
Adding activities to capture value
The supply chain integrates value chain segments. When inefficient, the chain of activities
results in non-productive and incremental cost to the product. This adds-up and detracts from
the total value recovered from end-consumer. The inefficiency is loaded as an unnecessary cost
on the producer, the most
vulnerable link in the chain.
Figure 3.3 Post-production cost
inefficiencies in Agri-Supply chain
Some of these inefficiencies
can be mitigated by farmers, as
produce owners, expanding
their range of activities, to
include allied operations, such
as aggregation, packaging and
pre-conditioning, and as far as
practicable transportation. For
this, development of suitable
modern assembly or
aggregation centres at village level are needed. Individual on-farm units can supply the village
level aggregation hub, where larger loads are assembled and produce can be efficiently
Doubling Farmers’ Income – Volume III
Post-production Agri-logistics: maximising gains for farmers
50
communicated to distant markets of choice.
There is empirical evidence that establishes that successful coordination across the various
value chain segments, as partners in the overall supply chain, has significant impact on cost
reduction and farm-income enhancement. Involving producers in more value chain segments
by providing logistics, machines and tools, credit, information, and training can bring better
returns to them. Producers and farmers will gain by in three ways:
i. By increasing the selling quantity, which results in increase in absolute income.
ii. By improving the margin per unit, which adds to their absolute income.
iii. By expanding their range, to reach more markets, to allow future growth.
The Agri-value system approach, will therefore, include expanding the range of operations of
a cultivator or group of farmers into other activity segments, especially in post-production
phase of the produce’s life cycle to market.
Price versus Volume
The value realised is a multiple of two factors, the price and the total selling volume. Value is
not equal to price in isolation, especially, if outcome includes discarded produce (wasted input).
Therefore, value chains also need to target growth in total sales, not just a higher price.
Growth in total income is a result of growth in volumes sold through increased market capture,
or from transacting at higher price per unit, or from both. In simple terms,
Value realisation = Volume x Price (influenced by demand-supply status)
Final Value realised > Production cost + Supply chain costs + transaction costs
For purpose of doubling farmers’ income, placing singular aim to obtain a higher price for the
produce, may be a short-sighted strategy. The agri-value system must take aim to balance both
the selling volume and the unit price; they are inversely proportional and may not necessarily
move in tandem. Growth in selling volumes also results in higher productivity in the supply
chain and at farms, bringing down production costs and supply chain costs. An added aspect to
value chain efficiency is sustainability, of economic growth and environment.
Cost increments in the Agri-Supply chain
Greater involvement of the producer-owner, further up the agri-value chain system, adds onus
for better handling and mitigates losses in the supply chain. Expanding market reach implies
tapping unfulfilled consumer demand, and means more quantity of produce to monetise.
Long supply chains result in inefficiencies, where the sum total of the costs to deliver the
produce to markets, eat into the final value realisation of the produce. Shortening the supply
chain, does not mean shortening the distance to market, but be inferred as shortening the chain
of custody and reducing the physical handling of the produce.
Doubling Farmers’ Income – Volume III
Post-production Agri-logistics: maximising gains for farmers
51
The price build-up in marketing chain in case
of fruits and vegetables is normally higher,
given the perishable nature of the produce
and the higher handling losses in the chain.
The Farmer Producer Organisations
(including farmer producer companies/
groups/associations/cooperatives, etc.) are
expected to deal with a range of challenges
that confront individual farmers.
FPO members are expected to leverage
collective bargaining power to access
financial and non-financial services and
appropriate technologies, reduce transaction
costs, tap high value markets and enter into partnership in the agri-value chain.
Institutional support through SHG based shareholding, provides access to working capital
which is in line with the business interests of the enterprise, public expenditure and government
support to set up medium scale infrastructure is needed.
Figure 3.5 Aggregation & preconditioning for more value to Farmer Groups
Finally, strong market linkages with private enterprises are some of the pivotal challenges to
ensure that FPO/VPO get integrated with agri-value chains. Case studies in the next section
indicate differing price versus volume outcomes, resulting in higher income and value to
farmers.
- Aggregator - First mile assembly & transport
(Pooling / Collection)
Whole sellers
End-Consumer
Agro-processor (food & non-food)
Processed Item Retailer
Fresh Vendor or Retailer
Farmers / Producers
Private Markets
Regulated Market
Rural mandi Farmers Market
Agents on commission -at multiple levels-
Pawanexh Kohli
Pawanexh Kohli
Farmer Groups can function as aggregators and have freedom to select their first stage wholesale market
Small land holdings result in lowered production volume per farmer. A minimum scale for market connectivity is required for logistics purpose and this task needs to be developed as a service or as an enabling activity for a group of farmers.
Aggregation at village level of any farm produce, allows the produce owner to move the material value to any primary market of choice. With aggregation and transport, the village can reach out and link with multiple first stage wholesale buyers (processors, traders, retailers, exporters, etc.). Lack of choice allows for the extant multi-layered levels in
transaction.
Farmer’s Market offers a highest share of consumer spend – a stop gap measure, sales growth is limited to local population. Impacts individual farmer only.
Figure 3.4
Price build-up in Fruits & Vegetables
Doubling Farmers’ Income – Volume III
Post-production Agri-logistics: maximising gains for farmers
52
As seen in Figure 3.6, there are a number
of intermediary functions in a ‘farm-to-
fork’ supply chain, operating on
individual mark-ups. The final mark-up
can be more than 60 per cent to 75 per
cent, out of which the margin mark-ups
between farmers to wholesaler can be 30
to 35 per cent or even more.
To increase the relative income of the
farmers, this 30 per cent margin could be
captured by upgrading the role &
responsibility of the farmers in the overall
supply chain.
This added responsibility can happen
through FPOs (including farmer
groups/associations /cooperatives, etc.) and VPOs (Village Producer Organisations).
One of the ways of realising this is by integrating the farmer’s own value chain into the
next value chain segment, by him/her owning up the next level of operations, that will
take him/her to the wholesaler stage and not by limiting himself/herself to the role of
passive producer at the bottom of the system.
Case Studies
This section describes the various ways of expanding producers operations into other value
chain segments. The cases described below demonstrate how value chain interventions at
bottom of the pyramid, impacts favourably by improving organisational and marketing
efficiency to maximise gains to producers.
A. Intervention of Pradan NGO in transforming traditional backyard value chain to a
smallholder cooperative value chain
B. Aggregation and direct Marketing by FPO.
C. Intervention of Jeevika for linking Women farmers of Bihar to trade Maize on
Electronic Market
D. Spices Board in Sikkim in Procurement and Price Discovery of Organic Large
cardamom
A. Smallholder Cooperative Model for Poultry10
PRADAN’s intervention to enhance income from backyard poultry in Kesla block of Madhya
10 Case Studies of Successful Pro-poor Models in India, The World Bank, September 2015
Figure 3.6 Price pressure from Margin Seekers
Doubling Farmers’ Income – Volume III
Post-production Agri-logistics: maximising gains for farmers
53
Pradesh has successfully enhanced the income of the small holder tribal household by linking
and upgrading their role in the poultry value chain system.
The efforts led to the establishment of a model for small holding broiler farms, which is now
also being replicated in other states such as Jharkhand, Chhattisgarh and Orissa.
PRADAN has been working with more than 5,306 women broiler-farmers, organised into 15
Cooperatives, and one Producer Company, with a collective turnover of about Rs. 400 million.
This is the largest conglomeration of small-holder poultry farmers in India.
The beneficiaries of this intervention were predominantly poor smallholder tribal households.
Traditional backyard poultry farms were chosen as the area of intervention because of its
livelihood and social importance as described below:
a) The activity provided Rs. 1,200–1,800 of income in a good year, mainly meeting
requirements for emergency cash.
b) The activity has social significance as the country fowl was mainly reared for festive
occasions, ceremonial purposes and celebration.
Figure 3.7 Poultry - smallholder generic value chain
Prior to the intervention, the tribal household were involved in traditional backyard poultry,
maintaining about 10-15 birds. The value chain was characterised by low productivity. In this,
the birds attain the weight of 800-900 gm in six to seven months and lay 30 to 50 eggs a year.
A distinctive feature of the traditional backyard value chain is the scarcity of supply in a small,
niche market. Therefore, the revenue per bird to the farmer is high, and the farmer’s share in
of final price at market was the highest, at about 60 to 63 per cent. However, the annual earning
for a family is Rs 1,200–1,800, representing only about 10-12 per cent of the annual income.
Doubling Farmers’ Income – Volume III
Post-production Agri-logistics: maximising gains for farmers
54
Transformed Model and the intervention: keeping the weaknesses in mind, intervention was
planned to address the inefficiencies of backyard chain and increase the scale of poultry
production of the small farmers. The interventions are listed below:
a. Decentralized production infrastructure with 300-400 birds in the homestead
backyard, which could fit into the daily life of the tribal women was introduced
b. Rigorous training of producers, intensive production support was organised
c. A cooperative model was used to conduct collective purchase of inputs and for the
sale of birds, to achieve economies of scale in backward-forward transactions
d. Market volatility was addressed by de-linking production efficiency from enterprise
efficiency, and collective operations for dealing with markets was created
e. Customized financial and MIS software was introduced for decentralized operations
f. On-call referral veterinary services was organised, chargeable on production output
parameters
g. Larger market capture for chicken meat was developed in the nearby areas like Sami
Pathakheda, decreasing local consumers’ dependence on the far away Bhopal supply
The interventions resulted in the farmers developing a more organised back-end, and increased
their poultry production. The enhanced output meant that the farmers had more saleable harvest
and were also able to link with larger markets. The enhanced supply resulted in rationalisation
of the selling price and the proportion of a farmer’s income reduced to about 44 per cent of the
price at terminal market (lower than the 63 per cent share of market price in earlier traditional
backyard poultry value system). However, the there was a large increase in the absolute income
of the farmer, ranging from Rs. 15,000-18,000 (compared to Rs. 1,200-1,800 under the
traditional backyard value chain). The value chain intervention resulted in greater volumes
being sold and a ten-fold increase in income to the farmers.
Figure 3.8 Cost and Margin of traditional poultry backyard (before the intervention)
Doubling Farmers’ Income – Volume III
Post-production Agri-logistics: maximising gains for farmers
55
Figure 3.9 Re-engineered Poultry Value Chain system
The low-carrying capacity of the backyard value chain was hereby transformed into a high
volume business that resulted in ten time higher returns, in absolute terms for the farmers, and
more equitable prices for the consumers. The capacity to deliver to adjoining town also added
to the marketing range of the erstwhile traditional homesteads.
The value chain optimisation had a larger and sustained impact of increased market capture,
increase in the selling volumes and higher productivity at the back-end and across the supply
chain. All of this was to the benefit of both farmer and consumer. Optimising and increasing
the production, in tandem with market expansion, had a multiplier effect on income, even
though lower share of consumer spend was captured.
Value chain interventions are not necessarily for capturing a higher price or a larger share
of the consumer spend. Instead, value chain interventions can also aim to optimise the
productivity and capture a large share of market demand.
B. Aggregation and direct marketing by FPO
Ram Rahim Pragati Producer Company Ltd (RRPPCL)11 is based out of the Narmada Valley
in Dewas District of Madhya Pradesh and owned by 162 self-help groups having 2,662 women
of the Adivasi community. It has successfully tackled several institutional challenges of
integrating small and marginal farmers, to capture a better share of agri-value chain, including
aspects of innovation in operations, financing and forward market linkages.
RRPPCL wanted to look beyond the Mandi and expand their market frontiers. They took a
11 The Case of Ram Rahim Pragati Producer Company Ltd: Review of Challenges Overcome to Showcase a Viable and
Replicable Model for Farmer Owned Agri Value Chains
Doubling Farmers’ Income – Volume III
Post-production Agri-logistics: maximising gains for farmers
56
critical look at the existing supply chain, and realised it had no intervention other that primarily
acting as a trading front for other market intermediaries. A decision was taken to take up tasks
that would allow them to target later stage markets for its produce.
As part of a new strategy, after having identified the problem areas, RRPPCL sought to break
this serially linked multi layered process of buying, third party centralised grading, storing and
selling and assessed the activities that they could handle themselves.
In order to solve the problem of centralised grading, RRPPCL commissioned the use of Spiral
Graders, a low cost machine costing less than Rs 6,000 which uses gravity to clean the
harvested Soya Bean into industry accepted grades. This machine can be easily be operated
and therefore can be used right at the farm-gate. Since majority of farmers were marginal
farmers, the small quantities of less than 10 quintals could be effectively be graded by these
low cost graders, as opposed to more capital intensive graders at centralised facilities. This
intervention necessitated establishing village level collection, grading and sorting yards from
which industry grade was output.
The produce could then be shipped directly by the producer group, to solvent extraction plants
and institutional buyers, thus bypassing the mandi. In the traditional model, the farmers claimed
they faced non-transparent price, and also had to pay a commission of 2 per cent.
Figure 3.10 Intervention in Soya value chain system
This changed mode of operations was piloted by RRPPCL in Kharif 2014-15 season and
rapidly proved to be successful. Having taken custody of next level operations, resulted both
in reducing operational costs and enabled RRPPCL to directly connect and market their
produce to the primary consumers.
Doubling Farmers’ Income – Volume III
Post-production Agri-logistics: maximising gains for farmers
57
In other examples of farmer producer organisations having taken up activities other than
cultivation, the Samarth Kishan Producer Company is another that has capitalised in seed
production and certification business since 2006. Ajaymeru Kisan Samruddhi Producer
Company of Ajmer in Rajasthan has also linked its production to forward trading.
C. Electronic platform for small & marginal women farmers12
Integration of farmers with the Electronic trading platforms is finding participation of farmers.
The example from Bihar, where pilot work was done by JEEViKA (a World Bank supported
program for poverty alleviation) in partnership with Bill & Melinda Gates Foundation and
Technoserve shows how famers benefited when they integrated into more segment of the agri-
value chain for Maize through an electronic platform.
In this pilot, a shift from the traditional way of marketing was made, with the producer group
taking up responsibility in next level value chain segments. The producer group upgraded the
scope of their activities to include weighing, grading, aggregation and holding inventory in
accredited warehouse.
At the warehouse, a second quality check was done on the delivered maize by NCDEX
eMarkets Limited (NeML). The stock was then made available to institutional buyers via the
NCDEX electronic platform.
Figure 3.11 JEEViKA intervention in Soya Marketing Model
As many as 299 members belonging to 10 producer groups (32 per cent of the total maize
growers) participated in this pilot by providing their maize produce to the producer groups. On
an average, 78.5 per cent of their produce was transacted through the producer group, while
the rest was sold to local collection agents, continuing to involve the traditional mode. In
12 Creating Technology-Enabled Inclusive Markets Electronic Trading Platform for Small and Marginal Women Farmers in
Bihar, India, Technoserve 2015
Doubling Farmers’ Income – Volume III
Post-production Agri-logistics: maximising gains for farmers
58
analysing the impact of the value chain intervention, multiple benefits are ascertained,
including back-end organisation and collaboration between farmers. The data shows that price
per quintal of maize rose from Rs. 951 to Rs. 1060 per quintal, an increase of 11.46 per cent.
This result is attributed to the taking up of activities earlier done by multiple layers of
intermediaries, more transparent weighing and grading. Individual farmers also received a
patronage bonus by the group. The farmers were more closely linked to market’s quality
feedback and having taken custody of the next level activities, besides cultivation alone.
Figure 3.12 Capturing greater Value for farmers
The farmers also had option to hold the stock for off-season transaction, but all of them opted
out and preferred selling at the assured price.
Figure 3.13 Price advantage from intervention
The availability of moisture meters with every producer group helped the members to dry and
clean the maize before sale, thus turning it into Grade-A maize. This is because the members
Doubling Farmers’ Income – Volume III
Post-production Agri-logistics: maximising gains for farmers
59
reacted to market feedback and planned for Grade A maize (locally known as Shalimar Calcutta
Pass), which not only fetches a higher price but also comes with an option for future sales.
The producer company created a brand name ‘JEEViKA Maize’ and earned traction from
buyers, because of the higher quality of produce. The effort of collective marketing has also
built ownership among farmers and all the members acknowledge the same.
The report reveals, that this also resulted in disrupting the business ecosystem locally.
Through interviews with existing collection agents, it was learnt that the pilot raised the
competitive bar for them, and most incurred losses in their business (to the extent of 40%)
compared to last year. This, in turn, prompted them to increase their initial offer price to
farmers. A few of the collection agents have also started using electronic weighing scales as
farmers are reluctant to sell produce using traditional weighing scales.
Value chain intervention also resulted in building a more equitable and competitive
market environment.
D. Organic large cardamom13
India is the largest producer of large cardamom with 54 per cent share in world production.
With an estimated annual production of 4075 tons (2015-16) in Sikkim, large cardamom is the
main cash crop of Sikkim which contributes upto 88-90 per cent of India's production. Large
cardamom based agroforestry system generates Rs. 40-50 crores revenue to the state. A farmer
can earn revenue of Rs. 25,000 to 30,000 from one hectare plantation.
In Sikkim, Singtam and Jorthang are main market for large cardamom. These market are
dominated with large and small traders. Price of large cardamom which is paid to farmers varies
from Rs. 1,400 to 1,600 per kg. Value of large cardamom depends on moisture content, colour
and size of produce. Price to this value is on basis demand-supply status, and local trader sells
the produce with a margin of 9 to 10 per cent which mean Rs. 1,500 to 1,800 per kg. Wholesaler
price of large cardamom is 1,600 to 1,900 Rs/kg and retail price is around 2,000 Rs/kg.
Spices Board, regulates the cardamom market under the Cardamom (Licensing & Marketing)
Rules, 1987. Spices Board opened an auction centre at Singtam and the auction is conducted
fortnightly in the presence of growers. The auctioneers are required to submit monthly returns
to the Board in prescribed format stating the source of purchase and sale with price and quantity
details. The growers are allowed to withdraw any of their lot if they feel the highest bid is
unsatisfactory. Only registered traders under Spice Board of Sikkim, Siliguri, Kolkata and
Delhi can participate in auction of large cardamom. This intervention has helped in
streamlining the price discovery mechanism and the auction price in turn is acting as the
reference price at other markets.
13 Marketing Strategies for Organic Produce, NIAM 2017
Doubling Farmers’ Income – Volume III
Post-production Agri-logistics: maximising gains for farmers
60
In order to capture greater value, there is need to clean and cure the produce. In addition,
branding the organic produce will help. If storage is available, the selling can be staggered to
take advantage of seasonal window in November and December. Major assembly markets of
large cardamom are Gangtok & Singtam in Sikkim and Siliguri in West Bengal. Siliguri is a
large aggregation market for and the product also comes from neighbouring Nepal & Bhutan.
Due to larger size and colour, the quality of Large Cardamom produced in Sikkim is considered
better than produce from Nepal & Bhutan. At the auction centre in Singtam, the North Eastern
Regional Agricultural Marketing Corporation Limited. (NERAMAC) under Spice Board
facilitated the auction by providing temporary storage facility, free of cost for the growers.
The average quantity of large cardamom sold is 1.5 metric tonne per auction. Spices Board also
organized buyer-seller meet (BSM) to facilitate Sikkim famers to establish direct linkages with
exporters. The joint efforts of Spices Board and NERAMAC, resulted in the auction handling
at a minimum 50 per cent of the production in the State. Overall, this single platform has
organised the marketing of large cardamom and enhanced quantity as well as price for farmers.
The branding of this produce as organic by Sikkim Organic Mission is the next level to target
to enhance higher value realisation.
Annotation
Any value chain system needs to have market demand at the core of its assessments. To be able
to ascertain value to a product, the market is to be identified to work out the cost to deliver to
Figure 3.14 Price Spread of Large Cardamom
1500 Rs/Kg
Farmer Sale
Price
Wholesaler's
Purchase price
Consumer’s
Price
Local Trader
Purchase Price
Handling Charges by
Local Traders (2.74%)
Local Trader’s
Margin (9.33%)
1640 Rs/Kg
Retailer's Purchase
price
1760 Rs/Kg
Wholesaler’s Margin,
Handling & Transport
(7.32%)
Retailer’s
Margin (14.2%)
2010 Rs/Kg
1460 Rs/Kg
Doubling Farmers’ Income – Volume III
Post-production Agri-logistics: maximising gains for farmers
61
market. This will help the decision on what to produce and how much to produce. Optimisation
of value chain activities, without an associated gain in value realisation is an exercise in futility.
Value chain optimisation means optimising the processes and activities of individual firms or
commercial entities to make them more competitive against other firms indulging in the same
trade. A value chain belongs to an organisation. A combination of value chains (organisations),
functioning in an integrated manner on a product is the supply chain.
Supply chain optimisation means optimally managing and coordinating the chain of custody
of the goods from supply to demand. The supply chain is defined by the product. The chain of
custody in agricultural supply chains, is handled by a multiplicity of actors, each having their
own value chain. This functional permutation of actors is the sectoral supply chain system.
A small farmer who uses own seed to produce small quantity and directly retails his output to
a local consumer, owns his complete supply chain. Since the entire supply chain is under single
ownership, it is synonymous with the farmer’s value chain. The farmer-owner can optimise the
involved operations to capture more value inside this limited supply chain model. However,
when the farmer has to rely on other actors to produce and connect with the consumer, he does
not own the supply chain and his value chain is only a component of the larger supply chain.
Large marketable surplus of a farmer will not get optimal value unless it is connected with end-
consumer, usually remotely located from farms. This is done through intermediaries like the
primary market, processor, trader, transporter, etc. Here, the farmer is only another actor in the
larger sectoral supply chain. Such supply chain models extend the farmer’s reach into larger
markets.
Agri-supply chains are normally comprised of multiple firms under separate ownership, as
functional segments in the chain of collaboration for the flow of goods. The forward flow of
produce and the reverse flow of value defines the sector-wide agri-value system.
The sum total of all costs, to produce and deliver goods to market, should result in a higher
value at destination. The value realised is a multiple of two key factors, the price at market and
the total quantity or volume sold. The saleable quantities are rated by quality and demand at
the point and time of monetisation.
Such models benefit from facilitation support and coordination between the individual actors
who comprise the supply chain. Direct access to multiple market places, by empowering farm
level aggregation units, is one such facilitation. Initiatives like alternate marketing can also
result in expanding the range of farmers, to fulfil a wider market demand, provided it is met
with physical delivery of the produce.
Rural level market centres need to be developed, not only to function as an exchange to transact
local retail, but also to serve as aggregation platforms, that facilitate onwards connectivity to
Doubling Farmers’ Income – Volume III
Post-production Agri-logistics: maximising gains for farmers
62
other market centres of choice. Other interventions in the agri-value system, if they lead to
expand the farmers’ role in post-production operations, also add value to farmers. Farmers can
be encouraged to capture greater value, by driving a combination of price and total saleable
quantity across multiple markets. For this, farming groups need to take on next level activities
in their marketing chain, such as aggregation, pre-conditioning, packaging, primary processing,
and transportation. These services can be undertaken through employing village entrepreneurs,
linked to farmer groups.
Market information on qualitative and quantitative demand needs to be communicated to
farmers, well in advance, preferably from multiple markets. Price signals are post-facto
information and are not sufficient. Demand projection will make the post-production supply
chain and the overall value system more cost efficient.
The recent reforms effected by the Ministry of Agriculture & Farmers’ Welfare to the
agricultural marketing Act is a major step taken towards creating an enabling environment for
income enhancements of the farmer. The Model APMC Act, 2003 which provided the States a
template for adopting reforms have been replaced by the Model Agricultural Produce and
Livestock Marketing (Promotion & Facilitation) Act, 2017. The States will need to take
proactive steps to take full advantage of changed policy environs. As a first step the States will
need to add and modernise the agricultural marketing infrastructure (logistics, storage,
markets), immediately allow movement of agricultural commodities within and between states
and enable e-trading across the state and country.
In addition, the States need to adopt market linked quality standards and invite participation of
private players along with producer organisations, both for safeguarding value of fresh produce
while linking with markets, and for processing of raw material into consumable food and non-
food products.
Connectivity
•Providing farmers with role in marketing activties & options
•Connecting Production clusters with Urban clusters
Efficiency
•Minimising post-harvest losses for more gainful end-uses
•Promote economy of scale at farm-gate to enable onwards logsitics
Empowering
•Capacity building to take advantage of Digital initatives in market
•Expanding the share of farmers in overall value system
Doubling Farmers’ Income – Volume III
Post-production Agri-logistics: maximising gains for farmers
63
At the policy level, Farmers need to be empowered with capacity to take up next level
activities after harvest and not only push into the nearest outlet. Partaking in aggregation
and market connectivity will organise farming and expand it into agri-business.
Key Extracts
Higher value realisation does not merely mean getting higher price per unit of produce.
Produce value is a factor of unit price and the total volume sold, besides produce quality
and availability.
The farmer’s value chain needs to grow beyond mere cultivation, by promoting post-
production aggregation in custody of farmers, and undertake transport from farm-gate.
Interventions in the farmers’ value chain must aim to capture value from every grain,
ounce and drop produced.
The agricultural value system comprises of many individual farmers and other types of
actors, who integrate their indivual activities into the larger sector-wide supply chain.
The supply chain is not under a single ownership and hence cannot be approached as a
value chain.. Instead is is a value system, whose development calls for facilitating and
optimising of the associated supply chain management systems.
Ensuring that all produce finds gainful end-use will lead to better value realisation.
Private sector involvement in the post-production supply chain needs more emphasis.
Every market opportunity needs to get connected with, preferably with direct access to
farmer groups, or as a service to farmers.
Shortening the chain of custody, with more near-farm activities organised by farmers
in collaboration, adds value in form of organisational capacity as well as income.
Monetisation of all production brings gainful productivity; and aggregation is the first
stage of value optimisation in the post-production supply chain.
Doubling Farmers’ Income – Volume III
Post-production Agri-logistics: maximising gains for farmers
65
Strategy and Approach A shift in strategic direction, from a production based push into markets, towards a demand based pull
built on a ‘fork-to-farm’ approach is needed. The related development of interventions that suit the
produce being handled are discussed.
Market Linked Strategy
Agriculture economy of India is undergoing a natural progression of development, in terms of
trade practices, business opportunities and availability of technologies, enabled by policy
support. These dynamics offer opportunities and as well throw challenges for the agri-business
systems and trade. A shift in food preference of the consumers, towards high nutritional value
produce, characteristic of the rise in disposable income, is also resulting in a shift in trading
preferences both in value and practices. To fully harness these opportunities, farmers today have
the option to undertake crop diversification, vertically integrate as a value chain component of
existing processors, horizontally integrate with market through appropriate aggregation of the
produce and associated adoption of technology for the wider supply chain.
The required systemic and policy changes, however, need calibration to empower the farmers to
convert these opportunities into income growth, ensuring an inclusive approach, as in the country
there is a predominance of small and marginal farmers (>86 per cent). This calls for evolving an
enabling environment and infrastructure that will endow the farmers with the tools to overcome
the inherent constraints of the sector, for increasing their incomes from agriculture as well from
activities allied thereto.
To double the famers’ income by 2022-23, the strategies will need to bring key focus on
production enhancement, cost reduction through smart nutrient management, low input farming
system approach, non-farm income enhancement through diversification and skilling, stabilising
of income and risk management. However, these components which are mostly production-
centric need to be complemented with ease in market access with efficient post-production
logistics, as the first step to market arbitrage. All efforts towards enhancing the production and
productivity, along with diversification, require to be linked with market demand, with prime
emphasis on ensuring that the complete quantity produced has physical access to all possible
selling avenues and can get monetised. The priority has to be to increase the market reach of
farmers to enhance their selling volumes, while all other incremental revisions to optimise upon
the inputs would remain as ongoing interventions.
There are two key linkages that need to be strengthened between farmers and market in the post-
production stage of farming. These are the physical logistics linkage with markets and
information flow from markets, and this calls for significant attention on issues of access to
infrastructure, technology, the institutional arrangements; and support services for capacity
building, identification & development of markets.
Doubling Farmers’ Income – Volume III
Post-production Agri-logistics: maximising gains for farmers
66
The problem of access to market is more pronounced for the small and marginal farmers. These
farmers suffer from inherent difficulties, stemming from the absence of economy of scale that
restricts their ability to participate in markets a hundred kilometres away from the farm. These
economies of scale are necessary for post-production activities and can be achieved through
aggregation & pre-conditioning centres near farms.
Production
Ma
rketing
Facilitate Planned Production Organised logistics flow to reach multiple primary markets Manage food loss and divert to all forms of agro-processing Expand market reach for growth, link to growth in production
There is added importance attached to linkage to market for the farmers in the context of new
challenges and issues relating to market. There is a shift in demand and opportunities for a rapidly
changing market environment brought about by trade liberalisation and globalisation. Rising
incomes, population growth, urbanisation, changes in tastes and preferences, and increasing
attention to health among a substantive section of the population have brought about changes in
the consumption pattern. The consumers are increasingly aware about food safety and quality.
Globalisation also offers incremental opportunities for agricultural exports.
The bane of Indian agriculture has been the fragmentation of farm holding into small land
parcels14. At production level, this inhibits the ability to negotiate for inputs and has certain
repercussion on the scope of optimising upon the input resources including mechanisation.
However, the farms are effectively activity clusters around villages and some of these concerns
are more notional and are solvable. The more critical impact of the fragmentation of farms has
been on the post-production side as market linkage, has in turn, also become fragmented.
Farming is the primary exercise of cultivating, harvesting and monetising the production. The
exercise of optimising on the input side is secondary to the concerns that yields are converted
into loss, rather than generating income for farmers.
There is need to focus on strategies for development of an agricultural marketing system in the
country with thrust on infrastructure creation, efficient flow of produce, access to market
information and reduced food waste. Each aspect of strategy must aim to help farmers to organise
the aggregation into viable loads, transport and sell more of what they produce, and thereby,
leading to growth in income and in turn motivate further increase in production.
Inverse Approach, from Fork-to-Farm
The concept of seamless farm-to-fork connectivity is normally presented when relating to food
supply systems. However, to function in agri-business mode, there is need to adapt to demand
triggered supply chains. The farm-to-fork connectivity tends to infer, that farmers will directly
interact with the consumer. The concept stems from a mind-set that promotes a push model
14 See DFI -Vol 2, Chapter 1
Integrate Supply
and Demand
Doubling Farmers’ Income – Volume III
Post-production Agri-logistics: maximising gains for farmers
67
from farms to market end, from a time when the market could absorb all that was supplied.
However, the price and the quantities absorbed at markets are directly related, and require
understanding market demand. All businesses dealing with consumer products follow a demand
linked methodology when accessing market channels. While in case of certain crop types like
fibres, potatoes for chips, grapes for wines, etc. the demand is consolidated in the hands of the
agro-processing unit, in case of fresh consumables, such consolidation of demand is limited.
This has special import in case of India, which is the world’s largest concentration of
vegetarians, making the fresh market important. A reverse approach, to link demand with
agriculture is needed for the crop types where farmers depend on income from marketing of
fresh whole produce. Effectively, there is need to work backwards from demand, providing
information that can intelligently direct the physical flow of foods to linked markets.
Adopting an inverse, FORK-to-FARM strategy, to guide future developments, is needed. A
well designed strategy will look at capturing new markets so that subsequent ramping up of
production will be monetised optimally. The immediate concern is to connect the produce with
as many markets as possible and the business model requires linking the source with target
markets, and planning a delivery or settlement mechanism after farm-gate procurement.
Figure 4.1 Options when planning an Agri-business
Source: DFI Committee
In the long run, information flow of demand, backwards to farms, is critical. Information
Communications Technology (ICT) systems will play an important role in such market
information flow, from fork-to-farm. However, the current demand is easy to map using data on
per capita food consumption from surveys by the National Sample Survey Organisation (NSSO).
Doubling Farmers’ Income – Volume III
Post-production Agri-logistics: maximising gains for farmers
68
A region based matrix with tons consumed per month, categorised by crops, is a starting point to
help direct relevant quantity of produce to regional wholesale markets (samples in annexures).
Such demand assessment will also help improve cropping patterns and planning at farm level.
The fork-to-farm methodology should also observe that the country is one unified market, as too
often, the farm-to-fork approach promotes limited efforts to push into nearby markets, within the
boundaries of each state, or even within the circumference notified by the local APMC. It is
understood that while cultivation is the core activity of farmers and bounded by the location of
each farm and governed by the State, the farmers’ market is the entire country, at national level.
Hence, efforts for enhancing the agriculture marketing network and the physical flow of goods
may need to be implemented at a national level. In fact, farmers’ markets can also transcend the
national boundary and enter the global markets, with necessary institutional and logistics support.
To fulfil existing demand, the access and logistics connectivity for greater market outreach is the
immediate priority for gainful production activities.
Access and Tactic
To double farmers’ income, the first priority is to ensure that the entire production off the farms
finds a market to get monetised. To double income it is essential to double the selling volume of
the farmers. This is critical when a large percentage of produce is lost after production, detracting
from income, which results in the input costs being loaded on the remaining saleable volume. In
the shorter term, value can be recovered by targeting sectors, where food loss incurred is high
and demand goes unfulfilled.
The primary concern for India today, is to bring its immense farm-gate production to gainful and
effective end use - to reach the hands of consumers, regularly and efficiently. Every kilogram
wasted due to poor post-harvest handling & logistics capabilities is also a loss multiplied in terms
of resource wasted and in greenhouse gas emissions. Any loss on the supply side has an
immediate ramification on farmers’ income and inflation.
The ability to physically connect the material produced with markets is inhibited for individual
farmers due to low handling quantity per farmer. This inhibiting factor is due to the generational
fragmentation of land holding, leading to small lots of marketable surplus. All access to markets
is made via some mode of transport and a critical mass or viable quantity is required for this
purpose. Where the farmers are able to collectively pool their produce (milk is an example),
onwards market linkage is easily undertaken to the benefit of the farmers. Except in case of milk
and large plantation crops, there is little organised collection for onwards market linkage evident,
though hundreds of market yards have been developed.
The market yards enforce a certain aggregation of produce, by dint of being the local nodal point,
and some aggregation in paddy and wheat comes about due to collective buying by Food
Corporation of India (FCI) & State procurement agencies. Some aggregation of pulses and
oilseeds, as also potato and onions is seen to happen in recent years, largely on account of
Doubling Farmers’ Income – Volume III
Post-production Agri-logistics: maximising gains for farmers
69
procurement under government schemes. However, the scale is yet too small. The aggregation
that occurs in today’s scenario is acceptable for the purpose of crops that are suitable to handle
at market yards and subsequent godowns and warehouses. However, perishables like freshly
harvested fish, meats, milk, fruits, vegetables and flowers cannot survive the same methodology
followed for cereals, pulses and grains. These produce categories need immediate attention after
harvest, by way of pre-conditioning them, for further safe-keeping and market connectivity.
Without any organised and produce specific aggregation services, a major share of the
perishables produced face high risk of food loss.
Food loss results in less quantum of farmers produce left at last mile to generate value, and less
of the value realised trickles down to farmers. Selling volumes by farmers can be enhanced,
provided they are empowered with appropriate market connectivity services (logistics and
information) and/or by bringing the primary produce buyers closer to farmers. However, a spread
in markets is also required to avoid generating localised market surplus. Farming community is
also to be promoted to take up the next set of activities in the supply chain, especially those like
pooling and aggregation of produce, which can be managed at near farm locations and allow
them to convey their harvested goods to markets of choice.
Figure 4.2 Next step interventions for farmer groups
Source: DFI Committee
Currently, the farmers do not have access to organised logistics services that can take custody of
their produce, offering farmers a choice of market, to deliver to select wholesale points. The
empowering effect of having such physical logistics, will build confidence in the cultivators and
automatically induce and justify any additional efforts to increase their farm level productivity.
Doubling Farmers’ Income – Volume III
Post-production Agri-logistics: maximising gains for farmers
70
The recommended approach is to ensure that the maximum quantum of harvest:
i. is linked with multiple avenues of revenue as prime objective;
ii. is primarily connected with the markets, while the strategy of storing and biding time for
a delayed transaction becomes a secondary objective;
iii. which becomes non-saleable or handling waste is diverted to food and non-food
processing; and
iv. in case of specialised cultivars, produced for processing purposes only, the supply would
bypass the direct market linkage which is used for table variety.
To enable post-harvest produce to access all possible avenues for revenue generation, a
dedicated supply chain network is required.
Such a network will require at first instance, the establishment of first stage aggregation to create
viable unit loads for connecting transportation. Such facilities do exist at the regulated market
yards, but these have been mostly designed for the handling of foodgrains and cash crops as was
their original focus, rather than for handling perishable agricultural produce. It is not a
coincidence, that the milk trade is not handled through such market yards but through a network
designed for suitable and hastened handling of the liquid harvest.
In case of government managed foodgrains procurement, the network can focus more on
improved inventory management and with attempts to recover greater value from the stock.
The APMC market yards are designed more as premises where trade is transacted, rather than as
logistics hubs where services of aggregation and transport can be resourced by the produce owner
or farmer. The logistics activity that ensues at these yards, is an incidental development and after
the farmer is relieved of the produce, post primary transaction. This mechanism, delinks the
farmer from further market opportunity or choice of market, handing over this economic prospect
to the intermediary buyer. This ongoing mechanism is probably expected to stay and relevant to
the trade in cash crops and foodgrains, as the next level of consumption is at bulk handling
enterprises in the form of processors (food and non-food outputs).
It is proposed, that in order to improve the farmers’ revenue opportunity, separate facilitation of
logistics services system be developed, with primary sorting, assaying, transport, storage and
wholesale so that farmers can access markets further afield, remote from production areas and
hence interlink with the National Agricultural Market (NAM). This will be most relevant in high
value produce such as horticultural and livestock products. Except dairy, a specialised post-
production supply chain system is missing in agricultural sectors. There is scope to build first
stage of post-production logistics at the existing APMCs, which generally have vast parcels of
land. The implication is that the farmers, both individually and in groups, can be facilitated to
access market yards not only to sell produce but also for using the logistics infrastructure to
access other markets. The Model APLM Act, 2017 needs to be amended to offer this opportunity.
Doubling Farmers’ Income – Volume III
Post-production Agri-logistics: maximising gains for farmers
71
This document is intended to provide broad guidelines to transform the way farmers’ monetise
their produce, and offer recommendations on improving the post-production handling of farm
produce, so as to enhance the revenue streams for farmers. For the purpose of supply chain
linkages, the farm produce is rationalised into categories that reflect their holding life.
Categorising Agri-produce by Holding Life
Strengthening of the country’s agri-logistics for doubling the farmers’ income and improving the
post-production productivity is a necessary priority. Agriculture post-harvest logistics includes
a) first stage aggregation; b) first mile transport; and depending on type of produce, c) transitory
or long term storage; d) long haul or wholesale transportation (rail, road, water, air); e)
distribution hub; f) last mile transport; and g) intermediary processing or manufacturing for
certain produce types.
A modern supply chain needs to function within the holding life, or usable life of the produce.
This is a primary factor when planning the post-production phase of logistical activities to cover
the remaining life cycle of the farm harvest. Broad categories are long and short life cycles, as
explained below. The holding life indicates the “time spread” in hand for sales.
Produce with long holding cycle
This category of produce include the ones that either have a natural long marketable life cycle,
after harvest, or those that have an established pull by primary users and broadly includes –
a. Foodgrains such as rice, wheat, maize, millets and pulses
b. Field crops such as cotton, jute, sugarcane, and oilseeds
c. Plantation crops such as tea, coffee, tobacco, coconut and rubber
d. Other dry produce like nuts, spices, wood, silk, aromatics, etc.
This category of farm produce is distinct in two key aspects – that the commodities are capable
of long term storage in warehouses and that these have an existing market linked user/processor
network. Usually, the produce is purchased by an organised market network (FCI, millers,
processors, manufacturers, commodity boards and commodity traders). Although all agricultural
produce is eventually perishable, in these cases, with minimal post-production care, the inevitable
is deferred by many months or even a few years. Therefore, having a long time-spread, the
majority of such commodities are also readily brokered for purposes of hedging and arbitrage.
Produce with short holding cycle
This category of produce consists of those that quickly perish, possessing a short post-harvest
holding life, having a short “time spread” in their selling cycle. This category includes –
a. Milk
b. Fruits, vegetables, certain roots and tuber crops
c. Floriculture and mushrooms
d. Meats (including fish and poultry)
Doubling Farmers’ Income – Volume III
Post-production Agri-logistics: maximising gains for farmers
72
This category of short lived farm produce loses its saleability very fast, from within hours to a
few days, without technology aids to extend its marketable life. The harvest inherently does not
last until the next harvest or supply cycle and perforce has to rely on quick logistics to bridge the
disparity in demand and supply and thereby get a spatial spread in sales. Most of horticultural
production fits in this category including the sensitive trio – tomato, onion, potato (Volume VIII).
The market linkage is a factor of time taken to cover market distance and the holding life of the
produce and failure results in price fluctuation. In such produce, the main strategy of market will
be selecting the place to sell.
This category uses cold-chain intervention to extend its marketable life. Through extending the
holding life, the cold-chain connectivity also aids in increasing the marketing range of the
producers. The extended holding life is better utilised to safely move the produce to consumption
centres, rather than storing in-situ in cold stores. On account of poor holding capability of the
produce, the average commodity trader avoids the nature of risks in perishable produce.
The short time spread can be countered by bringing a spread in place of sale, and form of produce
being sold. Lack of concept clarity at policy level has also contributed to the absence of a
comprehensive logistics and marketing network, resulting in creation of storage capacity alone.
Farm-gate Aggregation for Agri-logistics
Logistics connectivity between an origin and destination (OD pair) requires aggregation at
primary location to accumulate initial capacity for logistics viability. At the point of origin, or
farm-gate, the aggregation points must have the associated basic food handling facilities.
Long holding produce
The foodgrains, cash crops and other long holding produce have the existing market yards as the
primary aggregation and care facility. The country is reported to have almost 6700 such markets
(inclusive of principal and sub-market yards) regulated under the APMC ambit. These markets
serve as the first node in the marketing of these crops, where farmers are able to monetise and
generate revenue against their produce. The inability of the farmers to directly access these
primary wholesale markets and the need for more decentralised aggregation platforms have been
examined in DFI Volume IV. Approximately 22,000 rural periodic markets at village level
should be upgraded into such centres, to allow village (grameen) level aggregation.
Subsequent to these markets, the produce is handled by traders and/or processors for onwards
marketing against demand. Farmers also have the option to store their produce in warehouses for
deferred transactions, in the hope of higher earnings from transactions at a future date.
Assuming no major change in price, the earning from such crops can only be enhanced with an
accompanying increase in selling volumes. Therefore, the interlinking of agricultural markets at
the national level will help to collate the country’s demand and will streamline the trade in such
crops. Within the country, spreading the silo and storage systems closer to high density
Doubling Farmers’ Income – Volume III
Post-production Agri-logistics: maximising gains for farmers
73
population centres will ease the distribution bottlenecks and allow for a more streamlined supply
system and help minimise losses. The increase in demand for these crops can importantly lead
and drive an increase in productivity at farm level. Since these crop types are normally processed
before consumption, for the farmer, the change in demand mainly originates from food/non-food
processors, traders and large retail organisations in the country. Future increase in demand under
this category, is expected to be organic growth; incrementally linked to population growth and
changing purchasing parity.
However, to enhance the farmers’ income in this segment, there is need to explore and link the
stored inventory with the demand outside of the country/region. This requires greater marketing
effort for export of surpluses, with suitable support provided to processing industry (food and
non-food) and marketers. The support would need to be directed towards increasing the global
level competitiveness of the products and to making the final products more acceptable.
Short holding produce
The perishable produce has a shorter post-harvest holding life and this category requires pre-
conditioning of the food item before it can be dispatched to distant markets. Pre-conditioning is
defined as activities that prepare the produce for market, without changing its essential
characteristics of the produce, i.e. it remains agricultural produce (whole food) and not a
manufactured product. The activities of pre-conditioning involve trimming, cleaning, pre-
cooling, waxing, retail packing, labelling of fruits and vegetables and ripening if needed. These
preparatory procedures extend the marketable life of the produce, for subsequent travel to
consumers, including short and long term storage to buffer the supply.
In case of milk, the pre-conditioning stage is the initial pooling, assaying and chilling of the milk
in chiller tanks at village level collection points. In case of fresh meats (fish, poultry, pork, etc.),
the preparatory activity after harvesting the animal includes rapid blast freezing at the abattoir or
processing factory. As the fresh meat is pre-cut into smaller sizes (no longer whole), even if no
additives or other preservation techniques are applied, the process is deemed under ambit of food
processing. Once cut into marketable lots, the meat is rapidly cooled (to less than -18 °C or 0 °C)
depending on the market requirements. If the meat is to be consumed shortly then freezing
temperature suffices, but if the intended consumption is weeks or months after, the carcass is
held at sub-zero (< -18 °C) temperatures.
In the case of milk, the success of this sector can be attributed to the fact that the raw milk supply
chain was developed by prioritising on establishing the first level pooling systems, to function as
the preliminary collection or aggregation centres. Individual farmers pool their milk at the
aggregation or milk collection centres for onwards linkage, getting their share of the value
ascertained at the milk receiving or processing facility – the value is not locally determined at the
near-farm pooling point, but is evaluated on the basis of demand and supply at the remote
processing unit. As such, the farmer is able to tap into value that is directly linked to the wider
market demand.
Doubling Farmers’ Income – Volume III
Post-production Agri-logistics: maximising gains for farmers
74
A similar aggregation system for the larger basket of perishable fruits and vegetables is needed
and is in deficit in the country. Modern pack-houses receive produce directly from farms, and are
a vital first step in pooling and organising the post-production handling of perishable farm
produce. These facilities have been developed in the country in case of grapes and bananas, and
have boosted trade including exports, which in turn have been aiding greater and sustained
productivity. In case of apples too, these pack-houses are increasingly seen to be assimilated into
the near-farm cold storages, specially designed for apples.
It is recommended that pack-houses at village level be promoted as a priority infrastructure, to
receive farm output. Pack-houses should be created with a small sized storage, only to stock
about two (2) or three (3) days of harvested quantities, so that onwards market connectivity using
transport is stimulated. If the transport arrival to a pack-house and dispatch to market is expected
to be delayed, the pack-house in turn signals the farmer to defer that day’s harvest, which
mitigates post-harvest distress. Pack-house units therefore, can serve as signalling centres to
decide the harvesting activities depending on market linkage. This signalling can be made robust
by application based information messaging to the registered farmers.
At such facilities, the produce is assorted into market lots by quality, physically graded for
packaging purposes to ease transportability, packed for onwards transport and eventually pre-
cooled to extend the freshness. Thereafter, the produce is staged in suitable lots for onwards
transport to wholesale markets. Since produce is initially assayed by quality, the pack-house is
the gateway that decides which destination will generate the most viable returns.
Integrated pack-houses are created at village level also called farm-gate, and are a necessary
requirement if the farmers are to extend their reach into markets. A modern pack-house is
actually the nerve centre of the fruit and vegetable supply chain. This food segment shows
faster growth in demand, fed by fast changing food preferences and growing affluence in country
and shows scope to transform the economic situation of farmers.
Individual on-farm collection units are not to be confused with the modern pack-house. The latter
is a logistics hub which service multiple farms, to communicate the produce forward to markets
and manage the reverse flow of information to guide decision making for market linked
harvesting. The pack-house allows to generate multiple revenue streams from the farm produce,
applying metrics such as,
a) the late harvest that has shorter pending market life is pushed into the local regional market;
b) the produce suitable to withstand rigours of transport is prepared and dispatched to distant
urban markets;
c) the produce that is unsuited for the fresh market is diverted into attached juicing, pickling
or other processing units;
d) the poor quality or rejects is utilised in non-food processing such as cattle feed, dye making,
compost, etc.
Doubling Farmers’ Income – Volume III
Post-production Agri-logistics: maximising gains for farmers
75
Figure 4.3 Concept of Modern Pack-house (assembly and village level nerve centre)
Source: Kohli, 2015: Report to Task Force for Cold-chain Projects
The organised flow of harvested produce from a pack-house ensures that economic value can be
recovered from every phase of post-production handling of farm harvest. Produce can be
managed into revenue streams from non-food and food processing, from local market, hotels,
restaurants, caterers (HORECA), from distant markets including exports. Modernising the
farm-gate aggregation will have a direct and positive impact on farmers’ income.
Successful deployments of modern pack-houses have more than doubled farmer’s income, and
provided impetus to productivity (higher yields). Created at village level, they also bring near
farm jobs. In India, common examples are seen with grapes, banana, apple and floriculture.
Initially, pack-houses were used in case of exports, but increasingly domestic market is also
showing preference for good quality fresh whole produce. The main enabler for growth in
imported fruits and vegetables is that source farms abroad, have recourse to modern pack-houses,
to prepare and initiate the produce for the long travel to the importing countries.
Unlike foodgrains, which have a simpler curing procedure at farm level, the perishable food items
require more comprehensive pre-conditioning. Countering perishability has to be matched with
equal logistics, to connect produce with markets well before it eventually perishes and slips into
loss. Use of technology to extend holding life is not sufficient, as without a market, the goods
will still perish and turn into loss. Market linked transport remains important.
Retail, HORECA, Vending
Ripening Unit Export
Gateway
Village catchment - farms
Food Processing
Preserves
Juices, Jellies,
Mixes, Jams
IQF
5 ton / day
Non-Food
Compost
Farm Feed
Bio-gas
Dyes
<1 ton / day
25 ton / day Existing Multi-layered local
Market
Local Consumers / Mandi
15 ton / day Ready to retail package - cold-chain
Reefer
Urban Consumer
Post-harvest Farm supply
50 ton / day harvest
Pack House
Preconditioning Market Gateway
Pawanexh Kohli
Each destination brings gainful end-use, adds income to farmer
Cold Storage - Market access
Pawanexh Kohli
Doubling Farmers’ Income – Volume III
Post-production Agri-logistics: maximising gains for farmers
76
Transport and storage for Agri-logistics
Aggregation is the first stage requirement in agri-logistics. This is needed to build viable handling
loads for forward transport connectivity, to link with the consumers. For the farmer, the consumer
of the raw produce can be a processing unit, or the end-consumer. The end-consumer is accessed
through the distribution & retailer channel. Retailers need localised access to the produce, usually
through local mandis or wholesale terminal markets at urban centres. Transport and storage
systems are used to reach the prepared produce to the consumers.
Long holding produce
In case of long holding produce (eg. cereals, foodgrains, etc.), the aggregation point itself can be
co-located with the godown or warehouse. These dry produce types can catch onwards
movement on ordinary trucks with or without any elaborate packaging. Any form of packaging
or bagging is for the purpose of segregation and handling of inventory. The destination after the
storage phase is normally another handler or processor where the produce is treated, extracted or
milled into a final product before it undergoes retail level packaging. Modern movement of grain
can also happen in conveyors or pipelines when loose bulk is handled.
Figure 4.4 Foodgrain procurement & distribution
In most such cases, the farmers would have completed their participation in the market chain by
having off loaded their produce for revenue at the first stage, in the hands of a primary user. The
linkage to the end consumer is managed by the processor, or marketing agency. Commodity
traders also partake as the produce is easier to handle and hold in comparison to perishable crops.
Doubling Farmers’ Income – Volume III
Post-production Agri-logistics: maximising gains for farmers
77
Storage is intended to buffer an ongoing supply chain. Inventory as buffer is supposed to provide
leeway to bridge supply side variations with constant consumer demand. Storage alone, bereft of
agenda to link with market can result in idle value. Where and for how long the raw produce
resides in the logistics chain, is defined by the vested supply chain. When the linkage with
demand is well established through distribution channels, the produce can be forwarded in
quantities that suit the processing capabilities and capacities, as well to suit dynamics of markets.
For long holding produce, the physical connectivity is accessible on existing transportation
modes, unlike perishables. The railways already play a big role as can the container train
operators or waterways where larger distance is to be covered. Ordinary trucks are commonly
used for shorter distance and where otherwise suitable. In effect, the storage and transport
technologies for long holding produce exist. Modernisation and scaling up is required. However,
multi-modal transportation is an important missing link, presently.
Short holding produce
For short lived produce (milk, meats, horticulture, etc.) the dynamics in its trade is much
hastened, compared to long holding produce. The effect of perishability reflects in the time
remaining after harvest, to market the produce. If not for its perishable nature, the farmer could
have had a broader spread in time and greater choice in marketing the produce. Perishable
harvests also need to be assembled at first mile at specialised aggregation centres. Given the
prevalent fragmentation and size of farms, the buyers need to ensure that viable transportable
loads are available. The buyer could be a first user if a food processor, a wholesale buyer, or even
the organised retailer or end-consumer.
i) Milk
Milk does not reside as inventory for long and is almost always on the move. The raw liquid milk
produced by the farmers is first pooled at village level. This common aggregation is possible due
to the homogenous nature of the harvested liquid. From the pooling centre, the milk is transported
in cans to the local bulk milk chiller or milk chilling plant. The milk chiller can range from 200
to 1000 litres onwards, to very large capacities at processing plants.
The first mile pooling point can also incorporate a milk chiller unit, in which case the collection
tankers can directly lift the milk from the first point collection/milk-chilling unit.
For farmers, the most significant step is the collection or pooling points. Milk starts to deteriorate
within hours, and without these points to aggregate the produce for the organised supply chain,
the farmers can either consume themselves, or sell the milk only within a limited radius. In this
case, when the local production is beyond local consumption demand, the scope for monetisation
gets curtailed and further production would lead to waste.
The collection points link to processing units and other marketing channels, and hence are the
first and critical stage of linking the larger market with the local milk farmer.
Doubling Farmers’ Income – Volume III
Post-production Agri-logistics: maximising gains for farmers
78
Figure 4.5 Typical Milk Supply chain
In such a supply chain system, the farmers do not directly access the end-consumer and the
market demand is communicated from the distribution channel, backwards to village level. The
milk pooling points become a medium to access this demand from the end-consumers. Being a
homogenous produce, any minor variation detected in the quality of milk collected, is easily
rectified to meet the minimum standardised quality norms.
Another revenue channel for farmers is the informal market, where the farmer directly sells the
raw milk to small processers (halwais), nearby vendors, consumers and milk traders. Though this
market channel is also an important source of demand, the modern networks with systemic
procurement is proving to be a more transparent and assured mode of income for farmers.
As per estimates, milk procured is largely sold in its liquid fresh format (about 45 to 50 per cent).
Another 25 to 30 per cent is sold as ghee (clarified fat), and less than 15 per cent of the quantity
is sold as butter and curd. Remaining 5 to 10 per cent surplus serves the demand for milk powders,
milk whitener, ice creams, cheese, sweets, etc.
The milk pooling points are logistics enablers; the milk chillers and transport connect to the
distribution channel via the milk processors. Due to liquid characteristics of milk, once chilled to
the right temperature, it retains the cooling longer and insulated (non-refrigerated) tanks can
suffice for transporting. When milk is converted into other formats, the technology needed will
vary depending on the manufactured product. Milk is easily unitised for safe handling.
Fresh dairy products such as pouch milk, paneer (cottage cheese), curd, butter are normally
maintained in temperature range of 2 to 4°C, in the distribution chain and at consumer. This can
also be done using insulated vans to cover short distribution ranges. In most cases, the selling
and consumption cycle is faster and daily stock replenishment is carried out. Butter is also kept
for longer duration between 0 to -10°C. In case of ice cream and frozen products, the distribution
channel keeps them at temperatures below -18°C (frozen) using active refrigeration; in reefer
transport, cold stores as distribution hubs and in merchandising cabinets.
Milk
Processing
Facility
Cans on tempo, 3 wheeler, etc.
Milk Collection or Pooling point
Milk
Tankers Milk
Tankers
Graphic by
Pawanexh
Kohli
Milk Bulk Chiller
unit
Distribution channel
Milk Booths
Retailers Tanker
Reefer Px Kohli
PxK
Doubling Farmers’ Income – Volume III
Post-production Agri-logistics: maximising gains for farmers
79
A large quantity is sold as ghee, powder or as aseptically
packed (tetra packed) milk does not require refrigeration
and can be moved to market in the ambient.
The organised milk business is quite efficient with minimal
losses in the system. The value optimisation targets of the
milk business is more focused on logistics costs, expanding
the network of first mile collection centres, enhancing the
quality of milk procured and avoiding adulteration. For
farmers’ benefit, the strengthening and expansion of the
village level collection or procurement network is preferred,
as demand for good quality milk and dairy products is
growing in the country, and organised marketing channels
help expand into new regions.
The trade in perishable horticultural produce requires a different format of Agri-logistics.
ii) Horticulture
Though less sensitive than milk, and with a comparatively longer holding life that extends to a
few days or weeks, horticultural produce has its own differing and specific requirements for its
post-production handling. Horticulture is a broad sector that covers high perishable crops like
most flowers, fruits & vegetables; low perishable crops like cardamom & nuts; and partially
sensitive crops like potato and onion. However, the common thread across horticulture is that the
produce continues to live and breathe, and thereby, itself generate heat through continued
metabolic activity, throughout its saleable life cycle. The produce can also be sensitive to rough
handling, and suffer damage and become more susceptible to disease. Once the produce is
damaged or naturally perishes, its tissue structure degenerates and it is no longer marketable.
This non marketable quantity adds to food losses.
For the farmer, the produce fetches its highest economic value in its fresh form. The freshness of
the produce is directly linked to post-harvest ageing, a physiological timeline that limits the time
remaining for the farmer to monetise the produce. This aspect, if not attended to, causes farmers
to push their sales or resort to distress selling. Once the produce perishes, the produce succumbs
to natural forces of decomposition and physically rots away, but can used for composting, etc.
The metabolism or physiological activities of the living produce can be slowed down by cooling
it rapidly to its optimal holding temperature. The procedure does not involve freezing the crop as
that would kill it and make it non-saleable in fresh format. The cooling is, therefore, in the
positive temperature range (chilled), with each crop type having its own predetermined
temperature set point (ranging from about 0°C upto 15°C).
The ageing process is also dependent on moisture content of the produce; temperature control
alone does not fully extend the holding life. Therefore, horticultural produce also needs to be
Figure 4.6 Estimated share of milk in
organised & unorganised marketing
Doubling Farmers’ Income – Volume III
Post-production Agri-logistics: maximising gains for farmers
80
maintained at high humidity levels to remain fresh. With the right combination of temperature
and humidity, the saleable life cycle of horticultural produce can be suitably extended, and this
allows the producer a longer time to plan their sales and to reach far-away markets.
The use of a modern pack-house, integrated with pre-cooling, is necessary to retard the ageing
process, and to keep the produce fresh for a longer time. Once so pre-conditioned, the readied
quantity is staged and dispatched to market using temperature controlled transport units (reefer
trucks or reefer containers). In long run, a shift to palletisation and containerisation is needed.
The time at hand before taking the transport depends on the crop holding life, the time to market
and the desired time to keep on shelf pending sales. Fresh horticultural produce normally has a
fast selling cycle, and a couple days of shelf life (shelf presence) can suffice. Working backwards
from this shelf life, the supply chain assesses the total holding life and the time expended in
travel, to plan the dispatch to end consumer.
Figure 4.7 Desired supply chain for table variety produce
After leaving the pack-house, the produce is optimally kept in temperature and humidity
controlled environs, in reefer units and cold storage hubs, during the delivery cycle to the last
mile seller. In Indian market, the consumer habit of daily purchase or frequent fresh stock, allows
for less last mile storage and eases the front end merchandising requirements. Even produce
maintained and transiting in the cold-chain can be safely sold off the street vending carts to
consumers with daily consumption cycles.
The flow of produce in all supply chains is always directed towards the end consumer with
necessary stakeholders playing an intermediary role in the chain. But without the appropriate
infrastructure tools, the logistics chain fails to aggregate viable volumes at the various stages.
This brings in a larger number of intermediaries, who add an incremental yet small value-add to
market connectivity; however, the profit mark-ups remain comparable. Large number of
stakeholders can result in multiple handling of the produce, leading to inefficiencies and larger
losses in the market logistics.
Tractor-tempo-carts
Graphic
by
Pawane
xh Kohli
Pack, Precool, Dispatch
Farm gate Aggregation unit
Pack-House
Wholesalers’
Cold Storage
Distribution
Hub
Last mile Transport
Distribution channel F&V retail
Street Vendors Restaurants, Hotels
Reefer
Transport
Px Kohli
Px
From Farms
Doubling Farmers’ Income – Volume III
Post-production Agri-logistics: maximising gains for farmers
81
For the majority of horticultural food items and floriculture, the modern distribution and
marketing platform requires village level pack-houses with only a small buffer cold store, reefer
transport units and cold stores as distribution hubs at the front end. Globally, chilled horticulture
movement occupies 50 to 70 per cent of the cold-chain, whereas in India more than 90 per cent
of the integrated cold-chain is for frozen goods. For enabling greater market access and connect
for famers, the cold-chain for fresh farm produce needs to be developed as a priority. In contrast,
the milk chain has 1.7 lakh cooperatives linked through large number of pooling centres.
Though pack-houses could be another node for farmers to monetise their produce, more
importantly they strengthen the supply chain systems and facilitate in market demand being
communicated down till village level. The organisation that ensues, will also allow for more of
the farm produce to be evacuated to consumers and reduce the food loss at farm level. Cold-chain
logistics will also allow for faster selling cycles and quicker cash flow cycles to farmers, as
majority of the produce will be able to reach markets within days or weeks of their harvest.
Certain fresh produce have longer holding life, such as potatoes, apples, dried chillies (about 8
months) and in such cases long term holding in cold storages is developed, basis market
opportunity. A very large network of cold stores dedicated for potatoes and dried chillies exists.
These bulk cold stores help to streamline episodic supply with market demand in these crop
types. There is also need to develop cold-chains that facilitate more than storage alone, so as to
fast-track the access to markets for the wider basket of produce with a low holding life.
iii) Meats
Meat production, unlike horticulture, is not episodic as its harvest can be more easily adjusted to
suit demand. Yet, meat cannot remain fit for consumption, as after demise, decomposition from
enzymatic and bacterial activity sets in quickly. Therefore, unless the animal is harvested shortly
before consumption, the meat needs to be kept in refrigerated condition until consumed. Fish
harvest cycles are a little more varied than those applicable for poultry or livestock meat.
Modern day supply chain for meats includes collection of the live animal at abattoir units,
processing the meat and blast freezing the carcass before maintaining it at less than -18°C
(frozen) temperatures. Meat processed in this method can last for many months. However, where
domestic demand manifests in a more frequent buying cycle, the meat can also be kept fresh for
a short duration at zero °C. Abattoirs and poultry processing units are primary consumers of the
produce from the farmers.
The growth in this sector is linked to changing food preferences of Indian consumers, which can
be faster than the organic growth in demand from increase in population. The modern
temperature controlled supply chain for meats has already aided in opening foreign markets, and
the export of buffalo meat (carabeef) from India has already touched record levels. In case of fish
meat, the country is considered among the top 10 exporters in the world. The combined
production of meats (including fish and poultry) was less than 18 million tons in 2015-16.
Doubling Farmers’ Income – Volume III
Post-production Agri-logistics: maximising gains for farmers
82
The agri-logistics for market connectivity in this sector is a shared infrastructure resource among
other perishable food items. The reefer transport units are able to handle frozen to chill
temperature ranges (-25°C to +25°C) and cold storages at last mile are compartmentalised to
handle frozen goods. The merchandising units at retail side are also readily available technology,
though the modernising of retail shops is important keep the product safe. The back-end
infrastructure in form of slicing, cutting, blast freezing, etc. is covered under ambit of the
processing industry.
Besides the edible meat, the organised meat business also services the demand from the leather
industry, and provides raw material as inputs for other processes for commercial products.
Role of Agro-processing
The agro-processer is an intermediary in the farm-to-consumer supply system and communicates
demand from end consumers to farms, and constitutes another mode of revenue for the farmer.
In case of non-food crops, processors are the oldest example of agriculture allied business
enterprises, which converted farm produce into usable consumer goods. Agro-industries like
textile, leather and medicine are apt examples and have been a driving force for agriculture
worldwide. Modern technology allows even the traditionally unwanted by-product from food
produce, to be brought into commercial use as raw material for use in building materials,
polymers, cosmetics, adhesives, dyes, fuels, detergents, bio-energy, etc.
Agro-processing activity is an important source of income for farmers as it converts the primary
agricultural produce into usable items for food, feed, leather, fibre, fuel or industrial raw material.
Regular developments in agro-processing technologies have led to the progress of agro-allied
industrialists and they have become a primary market for the farmer. Of these, food processing
specifically deals with manufacture of food products and given industry status in the country.
Globally, there are varying interpretations of food processing and some countries include
the activities that only prepare and package the fresh produce for marketing purpose.
However, these activities do not convert the farm produce into another product, but only
precondition the fresh produce for travel to market.
In India, the overriding definition of “Agriculture Produce” means any produce of agriculture on
which either no further processing is done or such processing is done as is usually done by a
cultivator or producer which does not alter its essential characteristics but makes it marketable
for primary market15. Correspondingly, the activities by way of pre-conditioning, pre-cooling,
ripening, waxing, retail packing, labelling of fruits and vegetables which do not change or alter
the essential characteristics of the said fruits or vegetables, are not considered to output processed
foods. Various fiscal and financial implications are associated with this understanding, to favour
the marketing of agricultural produce, including under the Goods and Service Tax rules.
15 Agricultural produce as defined in the Finance Act, Section 65B(5)
Doubling Farmers’ Income – Volume III
Post-production Agri-logistics: maximising gains for farmers
83
Food processing is undertaken when the raw farm produce undergoes a transformative
treatment that changes or alters its essential characteristics. The transformative processes
may involve liquefaction, emulsification, cooking (such as boiling, broiling, frying, baking or
grilling), mincing or macerating, dicing or slicing, pickling or preservation, canning or jarring,
freezing or drying, refining, grinding, additives, etc. – that is, the natural attributes are altered, or
ingredients added where the produce is transformed from its natural physical or chemical form
into a new product - e.g. confection, beverages, sauce, canned vegetables, juices, jam, pickles,
deep frozen goods, flakes, powder, etc. The output is no longer construed as agricultural produce,
but a finished product. For the consumer, the food product manufacturer is the producer and not
the farmer. For the farmer, the processor is a consumer and another point of demand.
Food processing plays an important role in the post-harvest food supply chain as the industry is
a market, for all intents, for the farmers. The industry is in a favourable position as it is intrinsic
for making produce like oil seeds, foodgrains and cereals fit for consumption. In the past, the
industry developed as a localised service for the end-consumers, who would normally procure
whole grain and convert it to flour (atta) at a nearby flour mill (chakki) service. Milk was usually
procured raw and boiled at homes, and meats were harvested locally as per demand. Urbanisation
has brought about concentrated demand and scale to such services which have developed into
product manufacturers as food processors.
Agro and food processors source raw agri-produce and the processing line capacities are fulfilled
by staggering the inventory held by aggregators, traders and contracted farmers. This system
helps develop a steady state demand of certain crops, and is an effective mechanism to translate
consumer demand for certain products into demand for farmers’ whole produce.
However, there is a growing preference among discerning consumers for fruits and vegetables in
its fresh format. It is expected that as the country becomes more affluent, the demand for fresh
fruits and vegetable will increase, and even lead to increase in demand for fresh organic produce.
Fruits, vegetables and even flowers, fetch highest value in their fresh form, if of suitable quality.
Nonetheless, perishable crop types are prone to damage in handling and frequently such material
is culled from the logistics chain. This culled material, if captured at first mile, at the pack-house
level, can be safely diverted into small food processing units to recover value. In case of certain
crops, non-table variety cultivars are specially grown for food processing purpose. Potato, grapes
and tomato are examples; the table variety and processing variety have segregated uses.
Agro-processing has three roles in the overall supply chain: a) primary processing without value
addition where primary agricultural commodity is converted into a consumer ready format; b)
value added processing where the primary produce is converted into new products (food or non-
food); and c) value recovery where culled non-saleable produce is converted into other usable
items, akin to b). The first two are primary avenues of monetisation for farmers, and the last
allows the supply chain to recover value from produce that would otherwise have been discarded
as non-marketable.
Doubling Farmers’ Income – Volume III
Post-production Agri-logistics: maximising gains for farmers
84
In case of value added processing, industrial level processing is the mainstream business activity.
Primary processing can also happen in the hand of farmers or at cottage industry scale as part of
secondary agriculture (discussed further in Volume IX of this Report). Where culled produce is
retrieved for processing, the business is a sub-set of the agricultural supply chain and value
addition is done on the non-saleable produce, which is a by-product of handling inefficiencies.
This latter also helps to optimise on total value recovery to the farmers, while their mainstream
business is the marketing of fresh produce.
In the horticultural supply chain, barring a few processing variety cultivars, this third intervention
helps to mitigates possible food loss. Such processing units could be small or medium in scale
and appended to aggregation centres at the back-end, where the primary segregation takes place.
Though the prime motivation remains to market the fresh produce for highest market value, the
remaining quantity can be utilised for processing into other consumable products and uses.
Integrating processing with the agri-supply chain allows the system to add value to the farmer,
by ensuring all of his/her production finds gainful end-use.
Modernising Infrastructure for Agri-logistics
With rapid technological developments, there is need to modernise our basic post-production
infrastructure, especially those infrastructure components that help safeguard value (warehouses
and cold-chain) and provide an opportunity to spread the supply to suit the demand. The same
would also apply to infrastructure that helps to recover value from the non-saleable produce or
that makes the produce fit for consumption (processing units). Unit load handling (palletisation
and containerisation) is well established for exports, yet this modern handling methodology is
not appropriately developed in the domestic agri-logistics sector and needs to be encouraged.
Storage is intended as a buffer in an ongoing supply chain. Inventory as buffer is supposed to
provide leeway to bridge supply variations with constant consumer demand. This opportunity is
easily applied in the case of long holding produce. There is need to modernise storage and
movement of grains, by moving towards modern silos and containerisation16. Modernising the
storage and handling can double the usable life of the inventory, though the eventual liquidation
to market and PDS/OWS, etc. will still be needed.
There is also frequent debate on use of alternate and renewable energy as captive sources to offset
the energy needs of warehouses and cold storage systems. This has normally been interpreted as
the use of solar photo-voltaic based electricity generation systems. Since dry warehouses and
godowns have limited energy requirements in terms of lighting and low power utilities, the
installation of solar power is seen to be practical.
Conversely, refrigerated warehouses are energy intensive and have very high load, in use 24 x 7
for their operations. The use of captive solar power in such cases, from installations on available
rooftop area, does not generate sufficient power for the requirements. Further, the need to use
16 Report of High Level Committee on Reorienting the Role and Restructuring of FCI.
Doubling Farmers’ Income – Volume III
Post-production Agri-logistics: maximising gains for farmers
85
larger number of batteries to cover the night-time operations, adds to the costs and makes such
applications somewhat impracticable. The need for hybrid systems that share the load with the
grid, as well with other renewable energy sources are required. For large cold stores, the optimal
option is to design for use with clean grid energy, to maintain improved viability in operations.
In the milk chiller installations, a large number of units have also innovated with gobar-gas (bio
gas) based electricity generators. Other possible technologies to generate cooling are solar
thermal solutions, vapour absorption based systems and hybrids of electricity source inputs.
Successful developments include creating refrigeration using cow dung as fuel, where the heat
generated is seamlessly converted into cold without use of compressors or other machines.
Thermal storage (PCM- Phase Change Materials) also help reduce the energy risk in bulk milk
chillers. Thermal banks also help store solar heat and are useful where crops need to be dried.
The use of phase change material or eutectics for portable cooling is common, including in
transport and vending platforms.
The use of program logic control (PLC) based systems has an immediate impact on energy used
and is easily implementable. Similarly, upgrading the insulation of temperature controlled spaces
has high energy saving impact. The ensuing automation of energy intensive applications can
reduce operating costs upto 20-25 per cent in old cold storage units.
It is important to note, that a large part of the energy load for marketing food is from the transport
segment. This is further intensified when using refrigerated transport since the cooling system
adds to the fuel required. Food mile is a measure of assessing the energy that goes into the
delivery of a unit load of food. In the overall product life cycle, a short holding food item will
typically spend the maximum time on transport modes, on the way to market and this accounts
for the highest energy usage per ton.
Except for rail mode of transport, all other modes cannot be connected to the electricity grid; and
the transport on road, ship and air are reliant on availability of fossil fuel. Therefore,
technologies that can reduce the energy load in transport are equally, if not more important
to the overall food chain.
Modernising of the food handling infrastructure will also aid compliance with the country’s food
safety regulations and will help ensure competiveness at a global level. In addition it promotes
efficiency, integrity and safety of the individual operations at enterprise level. In relation to
farmers’ income, the availability of appropriate infrastructure, as the medium to connect with
markets is important and a matter of precedence.
Role of Railways in Agri-logistics
Once agricultural produce has been aggregated and prepared for onwards transit, the next step is
to evacuate the pre-conditioned produce to distant markets, thereby bridging the supply side with
demand, through the provision of transport over multi-modes, i.e. roadways, railways, waterways
and/or airways. The aspect of sub-continental distances to consumption centres, indicate that
Railways can play an important role in triggering an agricultural marketing revolution, wherein
Doubling Farmers’ Income – Volume III
Post-production Agri-logistics: maximising gains for farmers
86
railheads can co-locate or be linked to the modern produce collection centres, encourage a
number of floating stock of containers (refrigerated) dedicated for food cargo, and be the
transport backbone to the National Agricultural Market.
Railways not only speed up the logistics connectivity, which is important in case of perishables,
but also can cover longer distances, which is key to achieving improved value realisation for
farmers. As such, railways will play an important role in the marketing and delivery mechanism.
Rail-based Intervention
The movement of foodgrains has regularly used railways wagons and is an ongoing intervention
on freight trains. Since majority of the shipments are undertaken by FCI, bulk handling is
possible. To compete with roadways and to bring more idle rolling stock into use, railways have
also been offering discounts and incentives for carriage of foodgrains. Railways also have an
Automatic Freight Rebate Scheme to elicit freight in the traditional empty-flow direction. Yet,
for perishables there is no evidence of similar positive focus. Now this requires due attention.
The agricultural trade, especially in case of perishable commodities, faces a perpetual shortage
of time, once the produce is harvested. The agri-logistics of such produce has to resort to
technologies such as pre-cooling and cold-chain to enhance the marketable or holding life of the
perishable goods, because of inability to access markets within the normal lifespan of the
produce. On the other hand, assured connectivity to market centres is not possible until a certain
economy of scale is generated from a single commercial entity.
However, on the demand side, the volumetric consumption is well ascertained from various
surveys, including through multiple NSSO rounds. For example, on a monthly basis Delhi
consumes 11,600 tonnes of banana, 18,600 tonnes of tomato, 23,500 tonnes of onion and 54,000
tonnes of potato. None of these is produced in Delhi and they are transported from neighbouring
and/or distant regions. The example is similar for all major metropolis and their fresh food intake
is routed from multiple sources and states.
All major city centres also have modern rail terminals and freight handling yards. These cities
are easily identified as the destination points of agri-produce freight. The points of origin are also
fixed for certain crop types that are produced perennially, or have a short harvest window with
longer holding life – e.g. banana, apple, potato, carrot, kiwi, peas, etc. In such cases, the supply
side or origin can be said to have a comparatively steady throughput outflow.
In some other cases, the supply volumes will shift depending on seasonal variations or because
of shorter production cycles and a shorter holding life (more perishable) – eg. tomato, lettuce,
mango, brinjal, okra, papaya, strawberry, pineapple, etc.
In both examples above, recent reports showcase that the surplus crops had to be discarded on
the wayside, while unsated demand in faraway cities resulted in price inflation. This clearly
indicates that effective logistic-bridges were the critical missing links between the points of
surplus and demand.
Doubling Farmers’ Income – Volume III
Post-production Agri-logistics: maximising gains for farmers
87
A scheduled fixed route service will inspire and spearhead the development of large volumes
along identified freight lanes. Railways can provide the opportunity to service consumption
centres at long distance from farms, especially where time and product care are critical to the
saleability of the product.
Operational Requirements
This vision of affecting the food supply chain has following key aspects to consider:
i. Aggregation facilities with efficient transport linkage. The link provides a network as
to bring the market within reach of the producer.
ii. The logistics has to cater to the requirement of a rapid and trustworthy transport mode,
and where required to provide ambient conditioning.
iii. With most fresh perishables, the primary need is provision of transport, with storage at
receiving front-end. Fresh perishables must not be stored at production centre, but
moved to demand side while still young and firm to withstand rigours of transport.
Indian Railways with its pan-India network is the optimal and preferred choice for horti-produce
movement. Yet, this burgeoning demand is not fully tapped and deserves to be planned for in full
and on priority.
Most of the proposed agri-hubs are remote from onwards railways linkage. Currently, the
railways itself has very few options for servicing the thermally managed movement of fresh and
frozen produce. Lack of rail side facilities to safely handle perishable cargoes leaves that growing
service need to be met mainly by the road transport segment.
For Railways to tap into this growing transport demand from agri-logistics -
i. Upgrade logistics to facilitate the supply chain of fresh produce - agri-hubs or handling
facility adjoining railway sidings for loading unloading.
ii. Provide the use of railways communication network to aid price transparency to farmers
& markets.
iii. Create Receiving hubs from where local secondary or tertiary distribution can be handed
over to road transport.
iv. Provide Links to export hubs, including to alleviate export delays. This can be done in
liaison with APEDA and MPEDA and other export promoting bodies.
Primary Advantages to Indian Railways-
i. Assured income from logistics service from agri-hubs. Any producer with efficient and
easy access to rail transport will rarely opt for long haul road transportation.
ii. Income from railway land on which agri-hubs can be established. Land with railway
sidings can be leased to proposed users under PPP mode or through outright sale.
Doubling Farmers’ Income – Volume III
Post-production Agri-logistics: maximising gains for farmers
88
iii. Service to the nation- with temperature controlled transport, railways will have
developed an enhanced ability to provide emergency services at times of disaster by
having capacity to supply fresh food including perishable medical supplies.
iv. Upgradation of railways equipment and work-force. This will add value and fresh skills
to both people and the railways service.
Following table provides a broad view of Rail linked infrastructure, with Indian Railways:
SN Description Nos Remarks
1 Integrated Pack-houses Zero Used for aggregation or collecting of produce
from farms. Produce is pre-conditioned for
travel by sort and packaging before precooling.
These can be outsourced to off-site locations or
established at railways land adjoining railheads.
2 Reefer transport Zero Used to link pack-houses with next chain of
distribution. Can be outsourced to transporters.
For certain produce like potato, ordinary
trucking will suffice.
3 Distribution Hub (Cold
warehousing)
1 Used for transient warehousing for produce
while waiting rail connectivity. Can be used for
stuffing containers in advance for container
trains and destuffing service created in Bengal
near Singur railway stn.
4 Containers 98 Insulated (but non-refrigerated) containers with
CONCOR and earlier in use for onion and
banana. Procured with funds provided from
National Horticulture Board (NHB). Currently
not used for any movement.
5 Reefer Containers Zero No refrigerated containers are available for
domestic users – hence multi-modal
refrigerated transport is not possible.
6 Refrig. Parcel Vans
(VPN)
10 These are reported in partial use (2016).
The Private Container Train Operators (PCTO) also do not operate reefer container movement
to service the domestic cold-chain. CONCOR (Container Corporation of India) formed a
subsidiary company with business of trading in fresh produce and may need to review employee
norms in relation to bring professional management with specialised expertise suited to the
business, as well provide logistics support to that business.
All aspects of technology aided agri-logistics are supported under schemes of the Ministry of
Agriculture & Farmers’ Welfare as well as Ministry of Food Processing Industries. These include
Post-production Agri-logistics: maximising gains for farmers
92
SN COMMODITY MODEWISE AVG. LEAD (KMs) AVG - ALL
MODES (KMs)
RAIL ROAD COASTAL SHIPPING
AIRWAYS
42 POL Products (Liquid) 658 272 1163 467 43 Scrap (All Metals) 1188 455 465 44 Cement and Structures 557 358 552 461 45 Wood, Timber, Plywood, etc. 737 450 460 46 Ores other than Iron 478 350 398 47 Empty Tins, Bottes, Drums, etc. 311 374 374 48 Building materials 327 153 160 49 Gas Cylinder - All Types 151 151 50 Three Wheelers 739 739 51 Cycle & Cycle Parts 729 729 52 Two Wheelers 728 728
AVERAGE OF ALL MODES 661 453 1450 1027 545 Planning Commission Total Transport System Study
Among the top 52 commodities, the average lead (or distance travelled) is about 500 kms,
mostly (97 per cent) on road. It is reiterated that long haul movement can be facilitated by
scaling up rail based movement of fruits and vegetables, to help farmers capture more markets,
and therefore become more productive in gainful terms. Though the above data is of 2007-08,
its status is probably similar in 2017. It is, therefore, inferred that perishable crops, which can
benefit greatly from reduced transit time to market and better travel conditions on rail modes,
are not able to take advantage of current rail system. The reason can be a lack of suitable
handling facilities, but mostly from lack of special focus to capture such freight.
Currently majority of foodgrains and certain quantum of tea, potato and onion moves
on railways wagons. Wagons are not designed for sensitive or temperature controlled transport.
Very small quantum of fruits & vegetables avails rail transport, as the past approach
has been to evaluate full train loads, instead of breaking down into smaller unit loads.
Container trains allow the opportunity to consider a smaller unit load of container,
instead of full train loads only – a container train can load multiple commodity types and
stuffing can happen in advance to train arrival.
A floating stock of containers, for on demand use can be located across terminals and
carried on empty slots of existing routes. Individual containers can be used for multiple loads,
interchangeable along a series of freight lanes, promoting multi-modal format for agri-logistics.
Two types of freight systems are expected – i) for hardy produce such as potato, tea,
ginger, spices, etc. where long distance connectivity is more of essence. In such cases the
offloading end is not expected to be specialised; and ii) for more perishable produce such as
mangos, bananas, pineapple, brinjal, tomato, etc. where time is of essence and needs
temperature controlled handling facilities to stuff and destuff the containers.
In the first, railways system would only be used to freight the aggregated crops for an
offsite wholesale yard or receiving facility. Railways wagons (covered type) could also be used.
Doubling Farmers’ Income – Volume III
Post-production Agri-logistics: maximising gains for farmers
93
In the second case, refrigerated containers would be the unit load for transport and the
receiving facility may require refrigerated cross-dock or storage options – offsite or at railhead.
To spearhead use of railways for movement of horticultural produce, partial or
piecemeal movement will have to be started. This may manifest, preferably, in form of reserved
parcel van freight or single container freight on existing lanes. The pre-reserved option can be
opened on select routes for a fixed time window of two years.
As a full unit load is achieved, with reverse logistics, the opportunity can be passed on
to other service providers such as PCTOs (Private Container Train Operators).
Fixed lanes between North to/fro South and West to/fro East are possible. It is
envisaged that a fixed freight service will promote the use of rail mode for perishables’
transport and develop the appropriate eco-system of freight forwards/ aggregators.
Annotation
Farm produce needs more efficient and effective post-production logistics to establish physical
connectivity with market. The market for the farmer is normally a first stage buyer – the
aggregator, processor, trader – depending on type of produce being handled. In some cases,
with hardy crop types such as foodgrains, farmers can also store inventory for a delayed sale.
Effective post-production logistics chains, result in organising the management of the
production, leads to less food loss, expands market reach, and motivates efforts to generate
higher yields. While it is important that a ‘farm-to-fork’ flow of food produce is established,
the approach taken should be FORK-to-FARM. Such an inverse approach in integrating
the supply chain will ensure linking of demand from consumers with farmers.
Post-harvest supply chain systems allow for streamlining and balancing of supply and demand,
and provides farmers the opportunity to integrate horizontally with many markets. Post-harvest
logistics and connectivity are a critical enabler for farmers, as it allows evacuation of produce
to markets. Long-term stability can best be achieved through developing dynamic logistics
chains, designed to link the rural farmscape with high density population centres.
There is a general increase in the ratio between the output-marketed to output-produced, over
the years. However, the marketed surplus may not be finding optimal value because it is
monetised at the first available instance, at nearby markets. These markets may not necessarily
have sufficient demand from its consumer catchment, to absorb the entire supply. Therefore,
the value gets pushed down in the local market’s price discovery process. It is important that
besides marketed surplus, the market surplus is also monitored. Farmers should have ability to
direct their supply to markets that are optimal – i.e. have sufficient demand in their catchment,
or have ready links to other consumption centres. When optimal value is not realised,
motivation to grow production fades.
Measure of productivity should not be merely in terms of yield per acreage but be correlated
with quantity of production monetised. Farm productivity measures must relate to sales or
Doubling Farmers’ Income – Volume III
Post-production Agri-logistics: maximising gains for farmers
94
farmers’ income and assess net productivity gains. Yield gap assessments must be
benchmarked against the associated delivery & distribution mechanism and not merely against
foreign yardsticks to avoid producing surplus as loss.
The majority of farm produce undergoes value added processing (food and non-food) except
in the case of horticulture, where food processing has a different role to play. Food processing
units are natural when handling oilseeds, foodgrains, milk and meats. In case of horticulture,
barring a few special cultivars, the majority is sold fresh. India is the largest population density
of vegetarians and consumer demand for fresh fruits and vegetables is growing. Organised
logistics chain for horticulture segment is lacking and development will also add impetus to
build small and medium processing units to recover value from non-saleable or culled produce.
Farmers are typically delinked from activities where the value is added to raw produce through
additives, preservatives and other processing. Development must stem from agenda to
empower and add value to farmers; this includes integrating horizontally with multiple
markets, i.e. food processors, non-food processors, as well as the fresh market.
There is a deficient status in transport agri-logistics, especially in cold-chain. This results in
business models that focus on tradeable commodities with long term storage, leaving the more
difficult business in fresh perishables under-serviced. This causes the growing demand to lead
to inflation, with surplus being discarded roadside. A case of double jeopardy to the country.
Agri-logistics infrastructure is a necessary tool-of-trade for agricultural produce and
greater development impetus is indicated. The post-harvest supply chain commences at
farm gate in the form of aggregation centres and transport, which enables the farmers to
access more distant markets and partake in transactions higher up the value system.
Key Extracts
Post-production activities have to suit the type of produce being handled. Development
needs to factor the marketable life span of agri-produce.
To take agriculture from only cultivation targets to agri-business mode, adopting a
Fork-to-Farm or demand linked strategy is needed.
Produce specific aggregation at farm-gate has to be linked to evacuation modes, and
not merely for storage. High value agriculture requires faster evacuation.
Modernise logistics into multi-modal handling - palletisation and containerisation.
Inverse relation between production and income can be broken by logistics networks.
Create a national policy to streamline logiscs with priority on agri-logistics for farmers.
Doubling Farmers’ Income – Volume III
Post-production Agri-logistics: maximising gains for farmers
95
Potential and Challenges Ongoing urbanisation, changing consumer preferences and government support mechanisms provide
definitive potential to the agri-business sector. The challenges are largely in managing the implementation
and addressing the need to maximise the delivery of produce to multiple market channels.
Farmers’ see agricultural markets as an important avenue to monetise their produce. Essentially,
for the farmers, the possible ways to monetise their produce are the local mandi, the wholesaler,
agro-industry and local consumers. Any inability to do so, leaves the farmers to sell off their
produce to agents or intermediaries between these points of sales, which comes at a cost. The
future growth of farmers, is therefore, limited to the growth of such intermediaries, rather than
their own capability to connect with larger markets. From the farmers’ perspective, the ability to
easily connect with buyers and safely execute an exchange with market players, is a priority.
Without expanding the market range of farmers, their income growth is directly linked to growth
of local buyers (growth in population plus shift in consumption patterns). To capture a larger
share of consumption, the frontiers of their market need to expand into the national market and
further into exports. For this, agri-logistics capabilities of both farmers, as well as aggregators
and facilitators, have to be suitably developed. Agri-logistics plays an enabling role, by aiding
direct connectivity with the larger market, backwards to the farmers.
There has been much focus on creating farmer markets, as an opportunity for farmers to directly
sell to local consumers. Farmers' markets are operating in different States in the name of
Apnamandis in Punjab & Haryana; Rythu Bazaars in Andhra Pradesh and Telangana; Uzhavar
Sandhai in Tamil Nadu, Shetkari Bazaars in Maharashtra; and Raitha Santhe in Karnataka. These
are typically located at the rural-urban fringe and benefit both farmers and local consumers.
These farmer bazaars can be compared with the local dairy shed, where consumers could visit
the milking shed and buy their daily needs directly from the milk producer. Being limited in their
geography, these bazaars do not change the selling radius of a farmer. As a result, the customer
footfall remains limited to local consumers, and the capacity of local population to absorb higher
production is constrained. Like the local doodh-wala, farmers’ bazaars are essentially a stop gap
measure, to provide individual enterprising farmers an independent and nearby avenue to
monetise their produce. They do get a higher share of the consumers’ spend, but any agenda to
tap into other markets is not fulfilled.
Such markets have limited scope to effect a transforming impact on the overall future growth in
production. Near-farm direct markets will only be able to tap into the existing local demand and
do not expand the overall selling reach of the farmer, and are more suited as city proximate
locations. The real potential lies in capturing larger volumes, by bridging the distance between
urban consumers across States, and leveraging the country as a unified market. This will
transform the situation to have a larger impact, will drive high growth targets in farmer’s revenue,
and allow for further and viable increase in farm productivity.
Doubling Farmers’ Income – Volume III
Post-production Agri-logistics: maximising gains for farmers
96
Direct marketing can be in various formats such as roadside vending stands, clustered stalls
within designated farmers’ market, direct sales to local HoReCa (Hotels, Restaurants & Caterers)
and even direct procurement by large retailers, supermarkets and processing units. The latter
examples are more relevant to farmers’ growth and policy initiatives need to strategically target
direct purchase from organised demand. Easing of marketing regulations to allow direct purchase
from farmers from large users is a preferred approach to adopt. Similarly, the village level
aggregator and/or the farmer group or FPO, needs to be empowered with the tools to access
markets beyond their immediate range.
To access markets beyond the immediate range of farmers, transport connectivity is the primary
market tool. The transport needs to have a loading point, which in effect raises concerns on
availability of the near-farm aggregation points. Each such aggregation and dispatch point, needs
to have ability to prepare the produce for safe transportation to markets.
The bulk of the private sector has mainly organised itself to participate in easily handled cereals
and other long holding commodities. Besides wholesalers and traders of raw produce, they also
partake in industry based activities whence produce is converted into other products. These
industries are an end-destination of the farmers’ produce, and further development in agro-
processing will create demand for produce. The industry is comparatively better organised and
any constraint is already linked to market demand. Nevertheless, domestic demand shows steady
growth in the dairy, meats, fresh fruit & vegetable sectors with growing business potential. The
lack of suitable logistics is the only bottleneck to growth.
These important aggregation units are seen in form of assembly markets, milk collection centres,
modern pack-houses, rural godowns and warehouses. These components of the logistics chain
work to consolidate the fragmented production into larger and more viable handling loads.
Inventory so collated, is managed for the purpose of meeting demand, current and future,
depending on the longevity of the inventory stored.
The subsequent consolidation into inventories is thereafter deconsolidated and distributed to
multiple consumers at the front end – the hub-spoke system is reversed at the front end of the
supply chain. Therefore, a hub and spoke system works at both the back-end and the front-end.
Doubling Farmers’ Income – Volume III
Post-production Agri-logistics: maximising gains for farmers
97
The supply chain for non-perishable agricultural produce has the opportunity of a large storage
capacity and associated transport linkages, coupled with longer holding life of the produce. Given
the surpluses in stock and trends in consumption, gross level growth in this segment is
intrinsically linked to population growth and with efficiency and optimisation of the existing
supply chain. Another option is to foster links with international demand, for which support from
industry and exporters must be garnered. However, developing exports requires long term
changes to cultivation and handling practices to meet the quality norms of export markets. These
interventions are ongoing and will continue to over the longer term.
To bring about the targeted doubling of the farmers’ income, the identification and connectivity
with domestic consumers needs to be prioritised. The consumer’s preference for fresh fruits and
vegetables is a decisive factor for further prioritising efforts to develop infrastructure for such
connectivity. Consumption trends will indicate the sectors that show potential for immediate
growth (Fruits, Vegetables, Floriculture, Dairy, Fish and Meats).
Reinforcing, to commence any logistics chain, at first instance there is need to build a viable load
for the carrier or transport. Therefore, aggregation centres are imperative to serve as loading and
dispatch facilities at village or block level. It is visible in case of foodgrains and other cash crops,
where the handling yards or warehouses have become logistics hubs for onwards delivery to
users. The dry goods storage system for long term holding crops, can benefit most from
modernisation of existing infrastructure and improved inventory management.
However, for perishables, the modern pack-house units that concentrate the harvest into market
linked loads are in shortage and warrant new creation of such infrastructure. Lack of such units,
allows fragmented players and traders to step in, causing multiple handling and aggravates the
risks. The post-production supply chain for milk commences, at first instance, with aggregation
at village level and this model can be suitably emulated and adapted for other produce types.
It is important that besides the ongoing efforts in developing of warehousing and food processing
facilities, a high priority initiative be undertaken to develop the modern pack-houses and other
associated components in cold-chain. Horticultural production alone, is estimated at >295 million
tons in 2016-17, and only about 300-350 modern pack-houses are developed as of now to handle
such produce. This is far short of the estimated numbers required to handle the current consumer
demand in a scientific manner. This is a potential area for future investments.
Near-farm jobs
Pack-houses provide a permanent near-farm facility to initiate an organised flow of produce to
markets, for the post-production supply chain. Pack-houses require transport connectivity to feed
the terminal markets which in turn distribute the food to consumers. Pack-houses, in effect
function as small scale logistics centres at village level, connecting agriculture with urban centres.
They are opportunities for growth and job creation.
Doubling Farmers’ Income – Volume III
Post-production Agri-logistics: maximising gains for farmers
98
Table 5.1 Estimation of the near-farm employment
and others possible through new infrastructure for cold-chain logistics -
Infrastruc-ture Item
All India Required
Manpower per unit (est)
Total Manpower
Remarks
Modern Pack-houses
70,000
40
28,00,000
In operation, functioning of pack-houses requires workers for sorting, grading, washing, packaging and material handling. Additionally, will have a technical hand to operate and maintain machines. Depending on produce handled, the total team size can range from 25 to 60 persons.
Reefer Trucks
62,000
3
1,86,000
Each reefer vehicle on long-haul mode operates with 2 drivers and 1 helper. There will also be need to maintain the vehicle prime mover and the reefer unit, which is expected to be covered by the technician at the integrated pack-house and at service stations.
Cold Store (Bulk)
650
6
3,900
Cold store (Bulk) typically operates with a warehouse manager, records keeper, technicians and security. During loading period, temporary handlers are used on contractual basis, also provided by farmers. Over the long holding period, less workers are needed.
Cold Store (Hub)
360
50
18,000
Cold store (Hub) has daily material handling and needs staff to manage inventory and equipment, maintain records, handlers, fork lift operators, etc. For heavy handling periods, logistics operators use outsourced handlers.
Ripening Units
8,000
5
40,000
A ripening unit has daily material handling and bulk of workers is for loading and offloading from transport and chambers. A technical operator and records keeper is also employed.
Last-mile distribut-ion
- - - Small vehicles for last-mile delivery, retail shops and street carts form this segment. An estimation of numbers not made. However, approx. 2 million food and retail outlets exist and an average of 2 persons per outlet may be estimated.
30,47,900
Source: NCCD
Note: This table does not cover secondary jobs and the need for informal daily workers.
Pack-houses fill the job creation gap in an under-penetrated sector. New income options are
generated at pack-houses, providing near-farm jobs, across genders. Again, similarity can be
drawn with the 4 million women who are part of the large number of dairy cooperatives. Women
empowerment is accordingly serviced by providing jobs, close to farm households.
Analogous to the example shown in the milk chain, the village level aggregation units help to
foster organised supply chain systems. Estimates by National Centre for Cold-chain
Development (NCCD) show, that about 70,000 pack-house units (assessed at a standard size) is
Doubling Farmers’ Income – Volume III
Post-production Agri-logistics: maximising gains for farmers
99
required in the country to better handle the existing production of perishable crops. The actual
size and throughput will depend on individual project and the overall numbers would adjust
accordingly. Similarities can be drawn with the 171,000 dairy cooperatives that currently
function through the milk pooling or collecting facilities across the country.
The activities at a pack-house are complementary to farming and dedicated to organising the
marketing of the farmers’ produce. The jobs at the modern pack-houses will provide a new
earning mode for the farmers’ communities, while the involved in functions will continue to
promote and empower their core activity of cultivation. A modern pack-house is a small sized
unit occupying half an acre to 1 acre of land depending on size of pack-house. These become a
collecting centre for locally produced fruits and vegetables from small farms. As explained in
chapter 3, a pack-house will route the produce to consumers of the raw produce being handled.
Each pack-house should be attached a minimum number of trucks, to suitably transport the pre-
conditioned produce to their end destination.
Currently, this sector is more in need of substantive entrepreneur and capacity development, as
the shortfall of infrastructure is acute. As the infrastructure gets created, there will be associated
demand for skilled workers when suitable skill development can also be undertaken.
The jobs created at grain storage facilities would be similar to those estimated for bulk cold stores.
Average job creation within the agro-processing units can be considered similar to those at a cold
distribution hub or a factory facility. The recent Krishi SAMPADA Yojna by the Ministry of
Food Processing Industries (MoFPI) is expected to create avenues for about 5,30,500 direct and
indirect employment.
Future development of the food processing units will bring an associated demand for skills and
the industry is currently more focused on building competitiveness and compliance with food
safety norms. Consumers have shown increasing preference for food items, which have lesser
additives / preservatives / sugar, cold pressed, and similar. These variations in consumer mind
set, is also seen in textiles, with biodegradable and natural fibres rebounding. However,
consumers may not always make decisions on basis of comprehensive information but are
fickle and sway depending on generic media reports. Private sector inputs indicate that this
industry may be getting saturated and undergoing a plateau stage in some areas, and is in greater
need of support for upgrading of processing technology and to build global level
competiveness. From the farmers’ angle, the linkage with processors allows them yet another
option to directly sell their produce to primary users. In accordance, promoting food processors
to grow their backwards linkage for direct sourcing from farmers and to partner for quality
assurance is preferred.
Increase in selling volumes
Higher selling volumes mean higher income and impetus for greater productivity on farm.
Logistics connectivity allows more produce to securely reach more markets. The idea behind
scientific post-harvest management is to enhance post-production monetisation of the produce.
Doubling Farmers’ Income – Volume III
Post-production Agri-logistics: maximising gains for farmers
100
The obvious corollary is that after primary post-harvest care, the value must be transported to
end-destination. Increase in production quantity has to be met with expansion of the market
frontiers, so that all that is produced has a chance to get monetised.
Agri-logistics when limited to warehousing or storage alone, only builds buffers to buy time
for a delayed transaction. This may be suitable for foodgrains and allied goods, as the
commodity has long holding life and can be actively traded in futures linked to demand from
the processing industry or end consumers. However, the organised users who take final
delivery, stay limited and volumetric throughputs can remain more or less flat.
In case of perishables, the time gained in holding life by using cold chain, is better used for
covering distances and capture a larger market footprint. Expanding the geographical reach of
producer from growing area across the unified market, will help to bridge the demand supply
gap and increase the selling volume. Improved post-production logistics will also transform
the dynamics of the unified National Agricultural Market network.
In all cases, post-production activities that lend towards expanding the market reach of the
farmers, will increase the selling footprint of the produce and bring greater organisation to the
flow of produce from farms to markets. Keeping in mind food loss reports and other inputs,
effective market linkage provides opportunity to reduce produce loss and convert that share
into revenue. Besides converting food loss into earnings, an increase in selling volume is also
expected to build confidence in the farmer to accordingly produce more and adopt more
productive practices for cultivation.
Financial assistance provided by Government
The Government has various subsidy based schemes for strengthening marketing, cold-chain,
warehousing and processing infrastructure facilities in the country. The broad outline of some
of the major schemes that subsidise the creation of post-production infrastructure are:
i. Schemes of Ministry of Food Processing Industries (MoFPI)
ii. Schemes of Department of Animal Husbandry, Dairying & Fisheries (DAHDF)
iii. Mission for Integrated Development of Horticulture (MIDH – DAC&FW)
iv. Rashtriya Krishi Vikas Yojna (RKVY – DAC&FW)
v. Integrated Scheme for Agriculture Marketing (ISAM – DAC&FW)
vi. Programmes supported by Food Corporation of India (FCI – DFPD)
vii. Agricultural and Processed Food Products Export Development Authority
(APEDA - MoCI)
viii. National Cooperative Development Corporation (NCDC – DAC&FW)
(i) Ministry of Food Processing Industries (MoFPI): had been implementing a Central
Sector Scheme to support Mega Food Parks, Modernisation of Abattoirs, etc. as well as
a scheme on Cold-chain, Value Addition and Preservation Infrastructure since 2008-09.
Doubling Farmers’ Income – Volume III
Post-production Agri-logistics: maximising gains for farmers
101
The Ministry has re-structured its schemes under a new Central Sector Scheme called
“Kisan SAMPADA Yojna” (KSY) as of May 2017. KSY is designed as a comprehensive
package to give renewed thrust to agro-marine processing and the development of agro-
processing clusters in the country. As an umbrella scheme for processing industries, KSY
incorporates some ongoing schemes of MoFPI with three (3) new ones. The following
component schemes are implemented under KSY:
a. Mega Food Parks (on going) – grant-in-aid of 50 per cent of eligible project cost
in general areas and 75 per cent in NE region and difficult areas, maximum Rs.
50 crore.
b. Integrated Cold Chain and Value Addition Infrastructure (on going) – grant-in-
aid for projects integrated with processing, maximum Rs 10 crore. For project’s
storage infrastructure including pack-house, precooling, transport, etc., the
assistance is capped at 35 per cent of eligible project cost in general areas and
50 per cent in NE & Himalayan States, ITDP & Island areas. For value-addition
and processing infrastructure (including frozen storage/deep freezers and
irradiation facilities) the assistance is similarly patterned by region at 50 per
cent and 75 per cent.
c. Creation / Expansion of Food Processing & Preservation Capacities (new) –
grant-in-aid of 35 per cent of eligible project cost in general areas and 50 per
cent in NE States and difficult areas, maximum Rs. 5 crore.
d. Infrastructure for Agro-processing Clusters (new) – grant-in-aid of 35 per cent
of eligible project cost in general areas and 50 per cent in NE States and difficult
areas, maximum Rs. 10 crore.
e. Creation of Backward and Forward Linkages (new) – grant-in-aid of 35 per cent
of eligible project cost in general areas and 50 per cent in NE States and difficult
areas, maximum Rs. 5 crore.
f. Food Safety and Quality Assurance Infrastructure (on going) – for quality
control and food testing laboratories under Central/State Government
organisations and universities (including deemed universities), grant-in-aid at
100 per cent of cost of equipment and for others agencies, including private
sector organisations/universities at 50 per cent in general areas and 70 per cent
in NE States and difficult areas. To promote adoption of food safety and quality
assurance mechanisms, grant-in-aid to reimburse expenditure at 50 per cent in
general areas and 75 per cent in NE States and difficult areas of eligible project
cost subject to maximum Rs.17 lakh and 22 lakh respectively.
g. Human Resources and Institutions (on going) – grant-in-aid for R&D in
processing and allied technologies at 100 per cent of all eligible costs to
Government organisation/universities/institutions and for private
organisation/universities /institutions at 50 per cent of equipment cost only in
Doubling Farmers’ Income – Volume III
Post-production Agri-logistics: maximising gains for farmers
102
general areas and 70 per cent in NE States and difficult areas. In addition, this
also has sub-schemes to support promotional activities (including publicity,
studies and surveys), skill development and strengthening of institutions.
The grant-in-aid is credit linked but not back-ended and serves as a bridge fund to
approved projects. The pattern of assistance varies for each component scheme as listed
above. The beneficiaries can include individuals, group of entrepreneurs, cooperative
societies, Self Help Groups (SHGs), Farmer Producer’s Organizations (FPOs), NGOs,
Central/State PSUs, etc., subject to fulfilment of scheme guidelines.
(ii) Department of Animal Husbandry, Dairying & Fisheries (DAHDF): Central Sector
Schemes and Centrally Sponsored Schemes are operated by the department to provide
support to the sectors. The support to post-production activities is as follows-
a. Establishment/ modernization of Rural Slaughter Houses by Panchayats/ Local
Bodies/State Governments is supported with 75 per cent subsidy.
b. Under the component of ‘Entrepreneurship Development and Employment
Generation’ the sub-component - Poultry Venture Capital Fund provides 25 per
cent subsidy for Transport vehicles (open cage or refrigerated), mobile marketing
units and cold storage units for poultry products. The subsidy ceiling for these
items ranges from Rs 2.5 lakhs to Rs 5 lakhs. Subsidy at 25 per cent is also
provided to poultry processing units (subsidy ceiling of Rs 250 lakhs) and for emu
processing and feather processing units (ceiling of Rs 125 lakhs).
c. The sub component for Pig Development includes subsidy at 25 per cent for
Retail Outlets with chilling facility with a subsidy ceiling of Rs 2 lakhs.
d. Centrally sponsored capital assistance for development of fish processing,
preservation and storage infrastructure, with 100 per cent grant to Govt
undertakings; 75 per cent grant-in-aid to Cooperatives/NGOs/SHGs in NE region,
Hilly/Tribal areas, Women SHGs, Fisher SHG/Cooperative, SHGs of SC/ST in
all areas; and 50 per cent to NGO/Cooperatives other than above and Private
organisations owned by SC/STs and fishermen in all areas. Same pattern of
assistance is also provided for refrigerated truck and non-refrigerated insulated
truck ranging in capacity form 3 tonne to 6 tonne and for auto-rickshaw, motor
cycle or cycles fitted with ice box. Each component has a ceiling on admissible
unit cost.
e. Establishment of Fishing Harbours and Fish Landing Centres is also supported
under centrally sponsored schemes, i.e.,
i. 75 per cent assistance to Coastal States, Port Trusts, Fishermen Cooperative
Societies/Organisations/Associations, and 100 per cent to UTs for new
construction and upgradation/expansion/repair/renovation of minor fishing
harbours & fish landing centres.
Doubling Farmers’ Income – Volume III
Post-production Agri-logistics: maximising gains for farmers
103
ii. 100 per cent assistance to States, UTs & Port Trusts and Fishermen
Cooperative Societies/Organisations/Associations for construction and
expansion/ modernisation of existing major fishing harbours.
iii. For private entrepreneurs, 50 per cent assistance for construction of major/
minor fishing harbours & fish landing centres on BOT basis.
f. Capital assistance is provided for development of central fish markets in Metros
& big cities as 50 per cent grant-in-aid (unit cost capped at Rs 2.0 crore) to
Municipal Corporations/State Marketing Board/Local bodies.
g. The National Fisheries Development Board (NFDB) provides central financial
assistance for establishment of fishing harbours and fish landing centres,
including upgradation/expansion and repairs. The assistance provided is at 50 per
cent of approved project cost to State Governments/State agencies and 100 per
cent to UTs & Central Government agencies.
h. Central Sector Scheme under NFDB also supports Ice Plants, Cold storages (or
combination thereof), Retail fish markets, Fish Kiosks, Refrigerated
Truck/Container (>10 tonne), Insulated truck (> 6 tonne), and auto-rickshaw,
motor cycle or cycle with ice boxes. The pattern of assistance is applied on
admissible project cost at 50 per cent in General areas, 80 per cent in
NE/Himalayan States, 100 per cent for projects owned by Central Government
organisations and UTs under individual ceiling for each item.
i. Scheme under National Program for Dairy Development supports post-
production activities by assisting the creation and strengthening of related cold-
chain infrastructure linking farmer to consumer and infrastructure for
procurement, processing and marketing of milk and milk products. A
differentiated pattern of assistance is practiced ranging from 50 to 90 per cent
based on location and profitability of existing enterprise. The post-production
component items are milk coolers and milk chilling centres, milk processing/
powder/processing plants, transport tankers (insulated and/or refrigerated), cold
storage, marketing infrastructure, (visi coolers, refrigerators, etc.), and transport
subsidy for milk transport.
j. The Department also implemented the Dairy Entrepreneurship Development
Scheme under which financial support for post-production activities is provided.
The items supported are milk cooling units, processing units, dairy transport and
cold-chain, cold storage for milk & milk products, and dairy marketing
outlet/parlour. The assistance can be availed by farmers, entrepreneurs and groups
including milk federations and Panchayati Raj Institutions. The capital subsidy is
purely credit linked and at 25 per cent of project cost for general category and at
33.33 per cent for SC/ST farmers, with individual ceiling to each component item.
Doubling Farmers’ Income – Volume III
Post-production Agri-logistics: maximising gains for farmers
104
k. Dairy Infrastructure Development Fund (DIDF) of. more than Rs. 11,000 crore
over next 3 years is set up following the 2017 budget announcement for
modernisation of obsolete infrastructure with the cooperatives, as a corpus fund
under by NABARD with support from the Department.
(iii) Mission for Integrated Development of Horticulture (MIDH): Department of
Agriculture Cooperation & Farmers Welfare is implementing MIDH which has come
to subsume the schemes of NHM, HMNEH, NHB, CDB, NBM, CIH, under which
financial assistance is provided for various activities for horticultural development
encompassing post-harvest management including establishment of cold storage
infrastructure. The assistance is available primarily for handling of horticultural crops
in the form of subsidy @ 35 per cent (for general areas) and 50 per cent (for hilly and
scheduled areas) of the capital cost of admissible project components for both public
and private sector enterprises. The assistance is demand/entrepreneur driven and the
financial assistance is typically credit linked and back-ended, such that the subsidy
serves to partially offset the interest burden of a fully financed commercial project.
Table 5.2 Snapshot of MIDH scheme
Post-Harvest Management (Normal Storage and Cold-chain Components)
SN Description Cost Norms for MIDH (admissible cost)
1 Functional on-Farm handling unit Rs.4.0 lakhs/unit with size of 9m x 6m.
2 Integrated (modern) Pack houses Rs.50.0 lakhs/unit with throughput capacity of 16 MT/day, with facilities for conveyor belt sorting, grading, washing, drying & weighing.
3 Precooling Unit Rs.25.0 lakhs/unit with batch capacity of 6 MT.
6 Cold Storage Type 1 : basic mezzanine structure with large chamber(> 250MT) type with Single temperature Zone
Rs.8000/MT upto 5000 MT capacity, Rs.7600/MT for capacity between 5001 to 6500 MT, Rs.7200/MT for capacity between 6501 to 8000 MT, Rs.6800/MT for capacity between 8001 to 10000 MT
7 Cold Storage Type 2: PEB structure for Multi-temperature and product use, more than 6 chambers (<250MT) and basic material handling equipment.
Rs.10000/MT upto 5000 MT capacity, Rs.9500/MT for capacity between 5001 to 6500 MT, Rs.9000/MT for capacity between 6501 to 8000 MT, Rs.8500/MT for capacity between 8001 to 10000 MT
8 Refrigerated Transport Vehicles Rs.26 lakhs for 9 MT, pro-rata but not below 4 MT, Rs.30.00 lakh for 15 MT, pro-rata between 9 to 15 MT.
9 Ripening Chamber Rs.1.0 lakh/MT, ceiling of 300MT
10 Evaporative / Low Energy cool chamber Rs.5.00 lakhs/unit for 8 MT capacity
11 Low cost onion storage Rs.1.75 lakhs/unit of 25MT
12 Pusa Zero energy cool chamber Rs.4000 / unit of 100 kg
13 Integrated Cold-chain supply system Rs.600 lakhs/project integrating two or more of above components
14 Integrated Post-harvest Management Projects eg. Packhouses, Ripening unit,
Rs.145 lakhs per project. Components of postharvest management can be taken up as
Doubling Farmers’ Income – Volume III
Post-production Agri-logistics: maximising gains for farmers
105
Post-Harvest Management (Normal Storage and Cold-chain Components)
SN Description Cost Norms for MIDH (admissible cost)
Reefer vans, Retail Outlets, Precooling, Primary processing, etc.
individual stand-alone projects as guided by norms listed above
Add-on Components for cold-chain including modernisation
15 Nitrogen Generator Rs.125 lakhs Per Unit, maximum of 2 units
16 Specialised CA doors Rs.2.50 lakhs per door, maximum 20 doors.
17 CA Tents As per original invoice, maximum 5 enclosures
18 Programmable Logic Controller 50% of cost of original invoice, Max Rs.10 lakhs
19 Dock Leveller System Maximum Rs.7 lakhs per Unit, max 5 units
20 WRDA System 100 % cost of original invoice, max Rs.2 lakhs
21 Specialised Packaging lines 100 % cost as per invoice, max Rs.15 lakhs per project
22 High Reach handling equipment Rs.17 lakhs per unit, for max 2 units
23 Modernisation of refrigeration 50% of cost, max Rs.100 lakhs @ Rs.2500/MT capacity
24 Modernisation of insulation 50% of cost, max Rs.100 lakhs @ Rs.1500/MT capacity
25 Reefer Container Maximum Rs.6 lakhs per 9 MT (20 ft. reefer container)
26 Advanced Grader 100% of invoice cost, max Rs.75 lakhs per line
27 Stacking System 100% of invoice cost, maximum Rs.2000/MT
28 Retail Shelf/Equipment Maximum Rs.10 lakhs per establishment
100% of invoice cost, maximum Rs.35 lakhs per project
Items 1, 10, 11, 12: subsidy at 50% of total admissible cost.
Others: credit linked back-ended subsidy at 35% in General areas / 50% in Hilly & Scheduled areas.
Applicants can select multiple components with purpose to develop activity integration with any existing facilities.
Credit linked projects must be fully financed by project promoter & bank, and subsidy amount is capped to the total credit availed and is back-ended. Guidelines and minimum system standards need to be followed.
(iv) Integrated Scheme for Agriculture Marketing (ISAM): is implemented through the
Directorate of Marketing & Inspection (DMI) under DAC&AFW, and is an umbrella
scheme having following five sub-schemes-
a. Agricultural Marketing Infrastructure (AMI);
b. Marketing Research and Information Network (MRIN);
c. Strengthening of Agmark Grading Facilities (SAGF);
d. Agri-Business Development (ABD) through Venture Capital Assistance (VCA)
and Project Development Facility (PDF); and
e. Choudhary Charan Singh National Institute of Agriculture Marketing (NIAM).
Through its sub-schemes, ISAM promotes the creation of agricultural marketing
infrastructure, scientific storage capacity, pledge financing and integrated value chains
Doubling Farmers’ Income – Volume III
Post-production Agri-logistics: maximising gains for farmers
106
(vertical integration of farmers with primary processor). ISAM also supports the use of
ICT for extension work, framing of grade standards and quality certification and
establishing of nation-wide information network system of market information. To
further catalyse private sector investment in agri-business projects, training, research,
education, extension and consultancy in the agri marketing sector is also an objective
under ISAM. Each sub-scheme has its implementing parameter detailed in the ISAM
operational guidelines.
The financial assistance under ISAM is credit-linked subsidy @ 25 per cent of the
capital cost for general category beneficiaries and @ 33.33 per cent for special category
beneficiaries for construction/creation of scientific godowns, their renovation and other
infrastructure in the field of agricultural marketing. The assistance for renovation is
however restricted to storage infrastructure projects by cooperatives only. Cold storage
as a part of a permissible integrated value chain project is eligible for subsidy provided
the cold storage component is not more than 75 per cent of total financial outlay. If it is
more than 75 per cent, subsidy is restricted and calculated on the basis of capacity
calculation and cost norms of MIDH. The cap on subsidy varies for each component as
enumerated in the operational guidelines of ISAM.
(v) Rashtriya Krishi Vikas Yojna (RKVY): is a scheme to incentivise states to draw up
plans for their agriculture sector more comprehensively, taking agro-climatic
conditions, natural resource issues and technology into account, and integrating
livestock, poultry and fisheries. RKVY is administered by the MoAFW over and above
its existing Centrally Sponsored schemes, to supplement the State-specific strategies.
The scheme was recently modified to allocate 50 per cent of the annual outlay for
infrastructure and assets, split in a ratio of 60:40 for post-production and production
related infrastructure. The subsidy for infrastructure projects is capped at 50 per cent
for private individuals/NGOs, etc. As a number of infrastructure items are covered
under Rural Infrastructure Development Fund (RIDF) and Viability Gap Funding
(VGF), etc., RKVY is intended to supplement these other sources and not replace them.
(vi) Food Corporation of India (FCI): provides guaranteed hiring for covered storage
capacity created by private parties, CWC, SWCs and other State Agencies, under the
Private Entrepreneurs Guarantee (PEG) Scheme of the Department of Food & Public
Distribution. FCI hires the storage capacity for a guaranteed period of 10 years from
private parties and for 9 years in case of Public Sector agencies. In addition creation of
modern silos under VGF and non-VGF mode is also promoted. The Department also
implements a plan scheme for augmenting storage capacity, with special focus on NE
region.
(vii) Agricultural & Processed Food Products Export Development Authority
(APEDA): the Ministry of Commerce & Industry, through APEDA provides 90 per
cent grant-in-aid to State Government agencies for setting up of common infrastructure
including cold storage facilities for export oriented units. Assistance to private
exporters is also available upto 40 per cent as subsidy with a ceiling of Rs.7.50 lakh to
Doubling Farmers’ Income – Volume III
Post-production Agri-logistics: maximising gains for farmers
107
Rs.75.00 lakh for different post-harvest components including cold storages. APEDA
is in process of revising the scheme.
Table 5.3 Snapshot of APEDA scheme
PART I
A) Establishment of common infrastructure facilities by APEDA or any other Government or Public Sector agency.
90% grant-in-aid by APEDA and 10% from other government or public sector agency other than land.
B) For establishment of common infrastructure facility in PPP mode
Operating Guidelines under preparation.
PART II A) Assistance for purchase of specialised transport units for animal products, horticulture and floriculture sector.
40% of the cost subject to a ceiling of Rs. 7.5 lakh per beneficiary.
B) Assistance for all APEDA scheduled products (max Rs 75 lakhs per beneficiary unit): 1. Setting up of sheds for intermediate storage and grading / storage / cleaning operation of produce.
40% of the cost of equipment subject to a ceiling of Rs. 10.00 lakh per beneficiary
2.(a) Setting up of mechanized handling facilities such as sorting, grading, washing, waxing, ripening, packaging & palletisation, etc.
40% of the cost of equipment subject to a ceiling of Rs. 25.00 lakh per beneficiary
2.(b) Setting up of both pre cooling facilities with proper handling system as well as cold storage for storing
40% of the cost of equipment subject to a ceiling of Rs. 25.00 lakh per beneficiary
2.(c) Providing facilities for treatment such as fumigation, X-ray screening and other screening/detection equipments, hot water dip treatment, Water softening Plant
40% of the cost of equipment subject to a ceiling of Rs. 25.00 lakh per beneficiary
2.(d) Setting up of integrated post-harvest handling system (pack houses with any two or more of the above facilities (see 2(a) to 2(c)
40% of the cost subject to a ceiling of Rs. 75.00 lakh per beneficiary
3. Setting up of cable cars (covering minimum of 50 ha of plantation) for banana and other crops (as decided by APEDA)
40% of the cost subject to a ceiling of Rs. 75.00 lakh per beneficiary
4. Setting up of vapour heat treatment, electronic beam processing or irradiation facilities
40% of the cost subject to a ceiling of Rs. 50 lakh per beneficiary
5. Assistance for setting up of environment control e.g. pollution control, effluent treatment etc.
40% of the cost subject to a ceiling of Rs. 35 lakh per beneficiary
PART III Assistance for fresh & processed horticultural produce for Setting up of specialized storage facilities such as high humidity (Relative humidity more than 95%) cold storage deep freezers or cold storage etc.
40% of the cost subject to a ceiling of Rs. 25 lakh per beneficiary
(viii) National Cooperative Development Corporation (NCDC): provides loan as
financial assistance for setting up of cold storages to the cooperative sector. NCDC
has dovetailed its lending program with the Capital Investment Subsidy Scheme of
MIDH.
The operational guidelines of each of the schemes enumerates the objectives and may be
referred to for more specific details regarding the respective scheme. There are various sub-
schemes and Boards to promote post-harvest market linkages. In addition, the government has
Doubling Farmers’ Income – Volume III
Post-production Agri-logistics: maximising gains for farmers
108
also designed Viability Gap Funding (VGF) models as a method of financing projects under
Public Private Partnership. Viability gap finance means a grant to support projects that are
economically justified but, their financially viability is not attractive.
There may be operational bottlenecks to development of extended value chains, which will not
always be alleviated by applying additional funds to individual projects. A number of
stakeholders link the supply chain, from first mile to last mile, and each individually have
impact upon the service results – few would have capacity to take up the full chain - the value
system requires an extended chain of custody, collaboration, best practices at farm end, assured
or contractual demand for the service and has a cross regional /cross border footprint.
Schemes need to address projects with a cross regional spread of multiple aggregation centres
such as modern pack-houses at farm-gate with transport connectivity. To fulfil VGF norms,
these facilities could be required to operate as a service for local farmers, with viability of
predetermined service fees and from seasonal utilisation assessed for gap funding. At the end
of the concession period, the assets of the facility may be transferred to the relevant farm-gate
ownership. In the duration, the concessionaire would have spearheaded supply chain practises
and market linkage, with associated capacity building at near-farm establishments.
There may be an option to assess the viability gap in freight to initially expand market frontiers,
and the same can be supported to promote and spearhead rail/road/multi-modal transport
connections. Currently, uncertainty of market access, with the associated risk to producers,
disallows the initial small volume movement to first breach a market. Moderating this gap in
transport through a VGF model for long haul rail/road/water movement may be considered.
Fiscal and Other support by Government
The union government also provides fiscal incentives to post-production activities, including
exemptions under GST.
i. As per the revised RBI Guidelines issued on 23/04/2015, post-harvest activities and
cold-chain have been classified under Agriculture for Priority Sector Lending (PSL)
and the distinction between direct and indirect agriculture is dispensed with. Farm credit
can include loans to farmers/cooperatives of farmers/FPOs for post-harvest activities,
viz., sorting, grading and transporting of their own produce. Under Agriculture
Infrastructure, PSL includes loans for construction of storage facilities (warehouses,
market yards, godowns, silos), including cold storage/cold-chain designed to store
agriculture produce/products irrespective of location.
ii. In regards to agricultural production and post-production linked activities, the
following services continue to be exempted under GST:
a. Services relating to cultivation of plants and rearing of all life forms of animals,
except the rearing of horses, for food, fibre, fuel, raw material or other similar
products or agricultural produce by way of –
Doubling Farmers’ Income – Volume III
Post-production Agri-logistics: maximising gains for farmers
109
(i) Agricultural operations directly related to production of any agricultural
produce including cultivation, harvesting, threshing, plant protection or
testing;
(ii) Supply of farm labour;
(iii) processes carried out at an agricultural farm including tending, pruning,
cutting, harvesting, drying, cleaning, trimming, sun drying, fumigating,
curing, sorting, grading, cooling or bulk packaging and such like
operations which do not alter the essential characteristics of agricultural
produce but make it only marketable for the primary market;
(iv) Renting or leasing of agro machinery or vacant land with or without a
structure incidental to its use;
(v) Loading, unloading, packing, storage or warehousing of agricultural
produce;
(vi) Agricultural extension services;
(vii) Services by any Agricultural Produce Marketing Committee or Board or
services provided by a commission agent for sale or purchase of
agricultural produce.
b. Services by way of slaughtering of animals
c. Services by way of pre-conditioning, pre-cooling, ripening, waxing, retail
packing, labelling of fruits and vegetables which do not change or alter the
essential characteristics of the said fruits and vegetables
d. Services provided by National Centre for Cold-chain Development (NCCD) by
way of cold chain knowledge dissemination
e. Services by way of transportation by rail or vessel from one place in India to
another of the following goods - agricultural produce; milk, salt and foodgrain
including flours, pulses and rice; organic manure
f. Services provided by a goods transport agency by way of transport in a goods
carriage of - agricultural produce; milk, salt and foodgrain including flours,
pulses and rice; organic manure
g. Services by way of loading, unloading, packing, storage or warehousing of rice.
iii. Certain erstwhile exemptions have been done away with and are subject to GST –
a. Services by way of construction, erection, commissioning or installation of
original works pertaining to postharvest storage infrastructure for agricultural
produce including cold storages for such purposes; mechanised foodgrain
handling system, machinery or equipment for units processing agricultural
produce as food stuff, excluding alcoholic beverages.
b. Services by way of loading, unloading, packing, storage or warehousing of
cotton ginned or baled.
Doubling Farmers’ Income – Volume III
Post-production Agri-logistics: maximising gains for farmers
110
c. Certain goods intended to be used for the installation of a cold storage, cold
room or refrigerated vehicle, for the preservation, storage, transport or
processing of agricultural, apiary, horticultural, dairy, poultry, aquatic and
marine produce and meat (earlier notified exempt of excise by CEBC). The list
includes- (1) Gas compressor, all types (2) Flywheel and pulley (3) Truck
refrigeration unit (4) Walk-in-coolers/walk-in-freezer (5) Condensing unit (6)
Globally, per capita annual meat consumption is expected to increase by 1.3 kg by 2025.
Disease outbreaks and trade policies are main factors influencing this sector. In 2015, the
International Agency for Research on Cancer announced that processed meat is carcinogenic.
Such concerns can also effect projected consumption in high per capita meat eating regions.
According to FAO Meat Price Index, meat prices in 2015 fell to 2010 levels, and indicated
weaker demand for meats from emerging economies and Middle East. However, the ten year
outlook is reported as strong with some stability expected from feed grain prices staying low.
In the coming decade, at international level, the market price of meat is expected to grow in
nominal terms but the real price could decline.
1987-88 1993-94 1990-00 2004-05 2009-10 2011-12
Urban 1.58 1.34 1.22 0.85 1.11 0.96
Rural 0.73 0.73 0.85 0.57 0.57 0.60
1.58
0.96
0.730.60
0.0
0.4
0.8
1.2
1.6
2.0
Kgs
./Y
ear
Mutton
1987-88 1993-94 1990-00 2004-05 2009-10 2011-12
Urban 0.24 0.37 0.73 1.03 2.19 2.91
Rural 0.24 0.24 0.49 0.61 1.50 2.17
0.24
2.91
2.17
0.0
0.5
1.0
1.5
2.0
2.5
3.0
3.5
Kgs
,/Y
ear
Chicken
Doubling Farmers’ Income – Volume III
Post-production Agri-logistics: maximising gains for farmers
122
Figure 5.10 Global trend in Meat prices
Source: OECD/FAO (2016)
The meats sector relies on specialised post-production activities, include harvesting units or
abattoirs, processing units to cut and blast freeze, storage and transport to retail units. Meats
can be harvested on demand to suit the supply chain, and short term holding in storage suffices.
Figure 5.11 Trends in Egg Consumption (per capita annual)
Source: Various NSS Rounds
Consumption of eggs shows constant growth, having doubled in the past decade. This coincides
with consumption growth in chicken meat. Poultry produce as a source of income can be
expected to be a favoured sector.
1 000
2 000
3 000
4 000
5 000
6 000
500
1 000
1 500
2 000
2 500
1995
2000
2005
2010
2015
2020
2025
1995
2000
2005
2010
2015
2020
2025
1995
2000
2005
2010
2015
2020
2025
1995
2000
2005
2010
2015
2020
2025
Pork Poultry Beef (right axis) Sheep (right axis)
USD/tUSD/t Nominal price Real price
World Meat prices (projection)Note: US Choice steers, 1 100-1 300 lb dressed weight, Nebraska. New Zealand lamb schedule price dressed weight, all grade average. US Barrows and gilts, No. 1-3, 230-250 lb dressed weight, Iowa/South Minnesota. Brazil: Export unit value for chicken (f.o.b.) product weight.
1987-88 1993-94 1990-00 2004-05 2009-10 2011-12
Urban (nos) 17.40 18.01 25.06 20.93 32.49 38.69
Rural (nos) 6.33 7.79 13.26 12.29 21.05 23.60
17.40
38.69
6.33
23.60
0.0
5.0
10.0
15.0
20.0
25.0
30.0
35.0
40.0
45.0
Nm
br/
Ye
ar
Doubling Farmers’ Income – Volume III
Post-production Agri-logistics: maximising gains for farmers
123
Figure 5.12 Trends in Fish Consumption (per capita annual)
Source: Various NSS Rounds
With increasingly health conscious consumers, demand for white meat is expected to grow. In
this meat segment, fish market in the northern parts of the country has remained untapped.
Appropriate fish handling and cold-chain connectivity will be required to deliver fish to the
northern markets of the country. Private sector entrepreneurs are recognising opportunity from
this unserved demand and realise, that regular and efficient supply to these untapped markets
will make fish more affordable and in turn further drive consumption volumes upwards.
Internationally, the fish market underwent a slowdown, due to multiple factors including
market contractions and exchange rate fluctuations. Fish is highly perishable and its export
have to rely on the intervening food processing industries. The overall projection for the fish
sector is largely positive and world fish production is expected to grow 1.5 per cent per annum
over next ten years21.
Worldwide, the overall outlook is that global fish production will increase by 39 million tonnes
by 2025. World production of fishmeal is also expected to increase by 15 per cent in 2025
relative to the average 2013-15 level to reach 5.1 mill tonnes. The capture fishery sector
depends on the ecosystem’s natural productivity and subject to weather uncertainties.
Pulses and Oilseeds
NSSO round of surveys indicate, that the per capita pulse consumption has generally shown a
declining trend after an upward trend evident from 1987-88 through to 1999-2000.
Since then, the per capita consumption fell in urban households from 12 kgs to 9.6 kgs in 2009-
10 and from 10 kgs to 8 kgs in rural households. Conversely, the consumption of edible oils
has shown a steady rise in consumption.
21 OECD/FAO 2016, OECD-FAO Agricultural Outlook 2016-2025
1987-88 1993-94 1990-00 2004-05 2009-10 2011-12
Urban 2.07 2.43 2.68 2.51 2.90 3.07
Rural 1.95 2.19 2.56 2.45 3.27 3.24
2.07
3.07
1.95
3.24
1.5
1.7
1.9
2.1
2.3
2.5
2.7
2.9
3.1
3.3
3.5K
gs./
Ye
ar
Doubling Farmers’ Income – Volume III
Post-production Agri-logistics: maximising gains for farmers
124
Figure 5.13 Trends in Pulses Consumption (per capita annual)
Source: Various NSS Rounds
Over the last decade, consumption of pulses seems to have reverted back to those from about
three decades ago. These could be a reflection of consumer perception of their affordability,
though expected is indication is a plateauing out into a steady state of demand.
Edible oil consumption has shown a steady upward trend both in rural and urban households
with per capita consumption increasing from 4 kgs to 7.7 kgs per annum in rural areas and from
6.6 kgs to 10 kgs in urban households during 1987-88 to 2009-10.
Figure 5.14 Trends in Edible Oil Consumption (per capita annual)
Source: Various NSS Rounds
The composition of oils in the consumption basket has changed over the past two decades with
groundnut oil consumption halving and palm oil and soybean oil emerging as the major oils
consumed due to larger imports influenced by lower international prices. Nevertheless, mustard
oil continued to retain the highest share among vegetable oils consumed in India. In 1993-94,
mustard and groundnut oil had more than 70 per cent share in oil consumed. By 2011-12
mustard oil and refined oil forms the bulk of consumption, with vanaspati and ground nut oil
below 10 per cent.
1987-88 1993-94 1990-00 2004-05 2009-10 2011-12
Urban 9.37 10.46 12.17 9.98 9.61 10.96
Rural 7.91 9.25 10.22 8.64 7.91 9.53
9.37
10.96
7.91
9.53
5
6
7
8
9
10
11
12
13K
gs./
Ye
ar
1987-88 1993-94 1990-00 2004-05 2009-10 2011-12
Urban 6.57 6.81 8.76 8.03 9.95 10.38
Rural 4.02 4.50 6.08 5.84 7.74 8.20
6.57
10.38
4.02
8.20
0
2
4
6
8
10
12
Kgs
/ Y
ear
Doubling Farmers’ Income – Volume III
Post-production Agri-logistics: maximising gains for farmers
125
Figure 5.15 Consumption share among Edible Oils
Source: Various NSS Rounds
Wherever consumers demand is sustaining, the selected produce and product types will find a
ready market. Normally, pulses and all oilseeds are dependent on processing units for the
necessary intermediary activity in the farm to market value system. These processing unit
capacities are closely linked to their marketing capabilities and they are a primary user of these
crop types.
Sugar and Biofuels
Sugar price is sensitive to global dynamics, and in 2014 the international prices fell by more
than 30 per cent. Being a long term storable commodity, large stocks have been built and until
the inventory-to-use ratio declines, the global price of sugar is unlikely to regain substantially
in the short term. Any future increase in demand for sugar can be readily met with increased
production, and price fluctuations are expected to be temporal. Is India, sugarcane production
is expected to increase in 2017-18 after the dip in previous year.
The use of sugarcane for producing ethanol is also expected to rise and the share of sugarcane
devoted for this purpose is expected to increase from 20.7 to 22.3 per cent until 202522. It is
expected that maize based ethanol production will also show an increase.
The use of ethanol and biodiesel, if promoted, will provide yet another opportunity, from the
agro-processors, to farmers of crops that can alternate or supplement fossil fuel. The global
price projections from OECD/FAO indicate steady though slow growth in demand for of
ethanol and biodiesel, in the coming years.
22 OECD/FAO 2016
Vanaspati10%
Mustard Oil34%
Groundnut oil
39%
Other edible oils
17%
1993-94
Vanaspati2%
Mustard Oil32%
Groundnut oil7%
Refined oil37%
Coconut oil2%
Other edible oils20%
Other22%
2011-12
Doubling Farmers’ Income – Volume III
Post-production Agri-logistics: maximising gains for farmers
126
Figure 5.16 Global Biofuel price, trend and projections
Source: OECD/FAO (2016)
Cotton and others
Worldwide, cotton production faced an acute decline in 2015, and led to release of stocks.
However, global stocks remained high from accumulations in the 2010-14 period, but the
balance against growing demand is expected in coming years. Cotton faces heavy competition
from synthetic fibres, and world production is expected to grow at a slower pace, closely linked