z 00 ’ 6 Z C.P. No. 861 ti cj LIBRARY C AIRCRAFT KTABLIS~WW~ EDFORD. MINISTRY OF AVIATION AEl?ONAUTICAL RESEARCHCOUNCIL CURRENTPAPERS Further Tests on a Three-Stage Turbine of Low Reaction to Examine the Effects of Reduced Rotor Pitch and Improved Sealing BY 1. l-l. Johnsfo~ and D. C. Dfunsfield LONDON: HER MAJESTY’S STATIONERY OFFICE 1966 SIX SHILLINGS NET
Transcript
z 00
’ 6 Z
C.P. No. 861
ti cj LIBRARY
C AIRCRAFT KTABLIS~WW~ EDFORD.
MINISTRY OF AVIATION
AEl?ONAUTICAL RESEARCH COUNCIL
CURRENT PAPERS
Further Tests on a Three-Stage Turbine of Low Reaction to
Examine the Effects of Reduced Rotor Pitch and Improved Sealing
BY
1. l-l. Johnsfo~ and D. C. Dfunsfield
LONDON: HER MAJESTY’S STATIONERY OFFICE
1966
SIX SHILLINGS NET
U.D.C. NO. 62~+38.018:621.t38-253.5~62~762
c.P. No.861 kugun-t , 1964
Further tests on a three-stage turbine of low reaction to examine the effects of reduced
rotor pitch and improved sealing
- by -
I. H. Johnston and D. C- Dransfield
SUMMARY
Reductions have been made to the rotor blade spacing, stator tip
clearance, and internal leakage flows in a previously tested three-stage
experimental turbine of high stage loading, The separate effects of
these modifications on overall performance have been determined by further
tests; the combined effect being to increase the overall design point
efficiency from 82 per cent to 86s per cent, approximately. The results I
are discussed in the light of other data and partial agreement between the
test performance and generalised estimates is established.
2.1 Turbine 2.2 Blades 2.3 Test arrangements 2.4 Instrumentation 2.5 Power measurement
Test sequence
Test results and discussion 8
;:: Phase Phase 2 1
4.3 Phase 3
Discussion
0 9 9
10
General test information 11
6.1 Blade fouling 6.2 Outlet instrumentation
Conclusions
11 12
12
Notation
References
Page
14
15
Detachable abstract cards
Fig. No.
6
7
a
9
10
11
12
13
-3-
ILLUSTRATIOl!JS
Title -.
Section of turbine
Stator blade profiles
Rotor blade profiles
Three-stage turbine dimensions
Details of sealing on turbine outer annulus walls
Turbine performance - phase 1
Turbine performance - phase 2
Turbine performance - phase 3
Axial velocity at turbine exit
Comparison of test results
Rotor blade suction surfafe velocities
The effect of blade fouling
Pressure instrumentation at turbine exit
-4-
1.0 Introduction
The test performance of an experimental three-stage turbine fitted with low reaction blading of unconventional form was reported some years ago in Reference 1. The latter report showed that the efficiency at the
design point (N/D = 350, P,/P, 2 3.0) was disappointingly low, 82 per
cent compared with an estimate of 85 per cent based on the methods of Reference 2, and it was suggested that the cause of the poor efficiency might be the unconventional blade section which was used for the root pro- file of the rotor blades.
Since this early test work, the evidence from other experiments has emphasised the importance of
(1) the careful optimisation of blade spacing and associated blade surface pressure distribution,
and (2) the avoidance of spurious leakage flows within stator casings.
Furthermore, although there is a substantial amount of experimental data relating to the effect of rotor blade tip clearance on turbine stage efficiency, there is little information available concerning the effect of stator blade tip clearance.
Although the blade pitching of the turbine in Reference 1 followed the correlation presented in Reference 2 it was observed that the tangen- tial loading coefficient approached the value of unity in comparison to the value of 0.8 advocated by Zweifel. It was therefore considered that a reduction in blade pitch might reduce the flow separation which had been deduced to exist in the vicinity of the unconventional blade roots, and that this might more than offset the additional skin friction losses.
It seemed possible that the segmented construction of the turbine annulus outer wall might be permitting internal flow leakage and this could be ascertained easily by coating the suspect joints with a sealing compound.
Finally, there was a possibility of reducing the original stator blade tip clearance by a significant amount to provide data on the effect of this parameter on efficiency.
It was decided, therefore, to institute these changes progressively $n an attempt to separate the various effects.
This test work, and a discussion of the results, forms the subject of the present paper.
2.0 Apparatus
The experimental three-stage turbine and the test facility are fully described in Reference 1, therefore only a brief description is presented in the following paragraphs.
-5-
2.1 Turbine
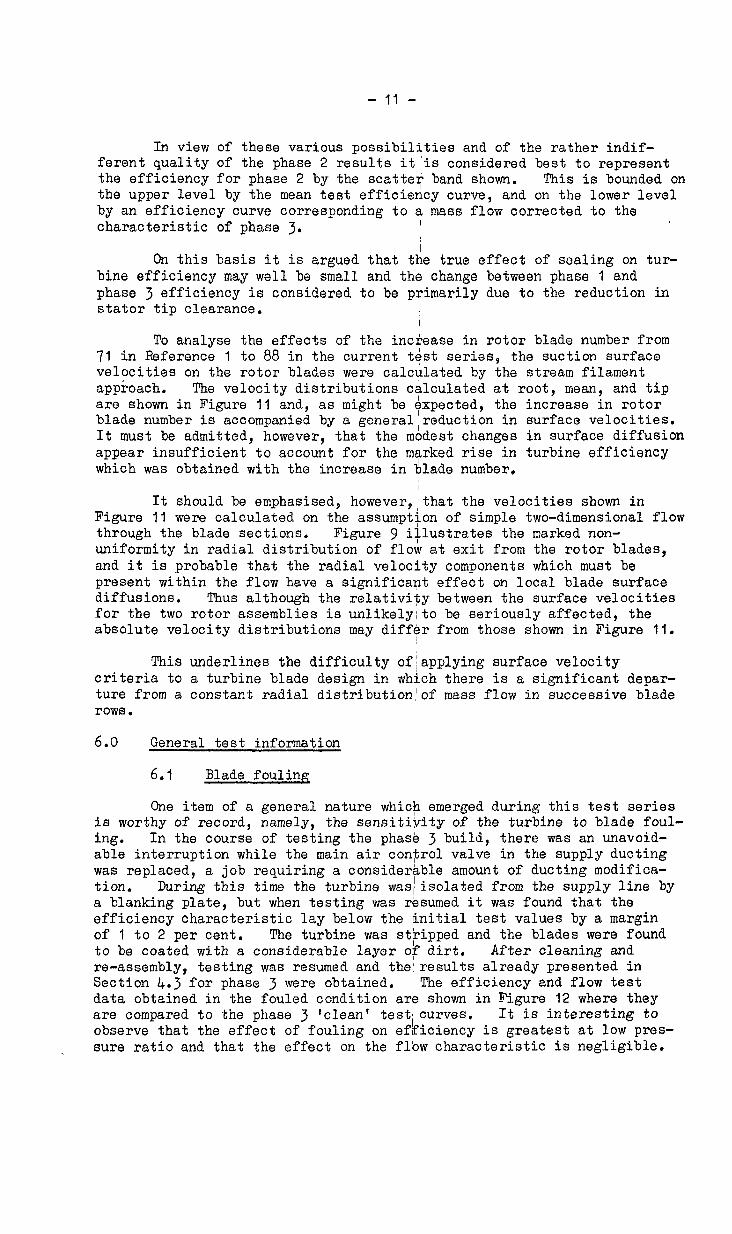
The turbine, illustrated in Figur:e I, is an experimental unit capable of being assembled with one-, two-, or three-stages, with either wide or narrow axial spacing between the blade rows. For the present test series the wide spacing (0.6 in. from trailing edge plane to leading edge plane) was used as in the tests of Reference I. The rotor comprises a number of discs which carry the rotor blades in circumferential fir tree grooves. The rotor disc rims combine to form a plane cylindrical sur- face, so that radial tip clearance is present on all stator blades. The outer wall of the turbine annulus is made up of segmented shroud rings which are joined by spring plates and sealing strips. These shroud rings are located by the stator blades which in turn are supported, via extended roots, by the main casing of the turbine!.
The rotor assembly i s carried in @ain journal bearings, the end thrust being taken by a Michell thrust bearing. The power absorbed by the latter is not negligible as it amour&s to approximately 2 per cent of turbine output at 7000 rev/min when assessed from measurements of oil flow and temperature rise.
2.2 Blades
The original turbine design was based on the following three simple concepts.
(1) Impulse conditions at rotor root.
(2) Constant axial velocity in; each stage, I
(3) Free vortex flow (nominal):
The blading at any radius is indentical for each stage and all the turbine flare is at the outer diameter. 1 Therefore there is a progressive increase in mean blade speed through thelmachine, and a consequent reduc- tion in mean stage loading. Taking theimean diameter conditions of the
second-stage as representative, the average design stage loading !
is equal to 3.7. I ,
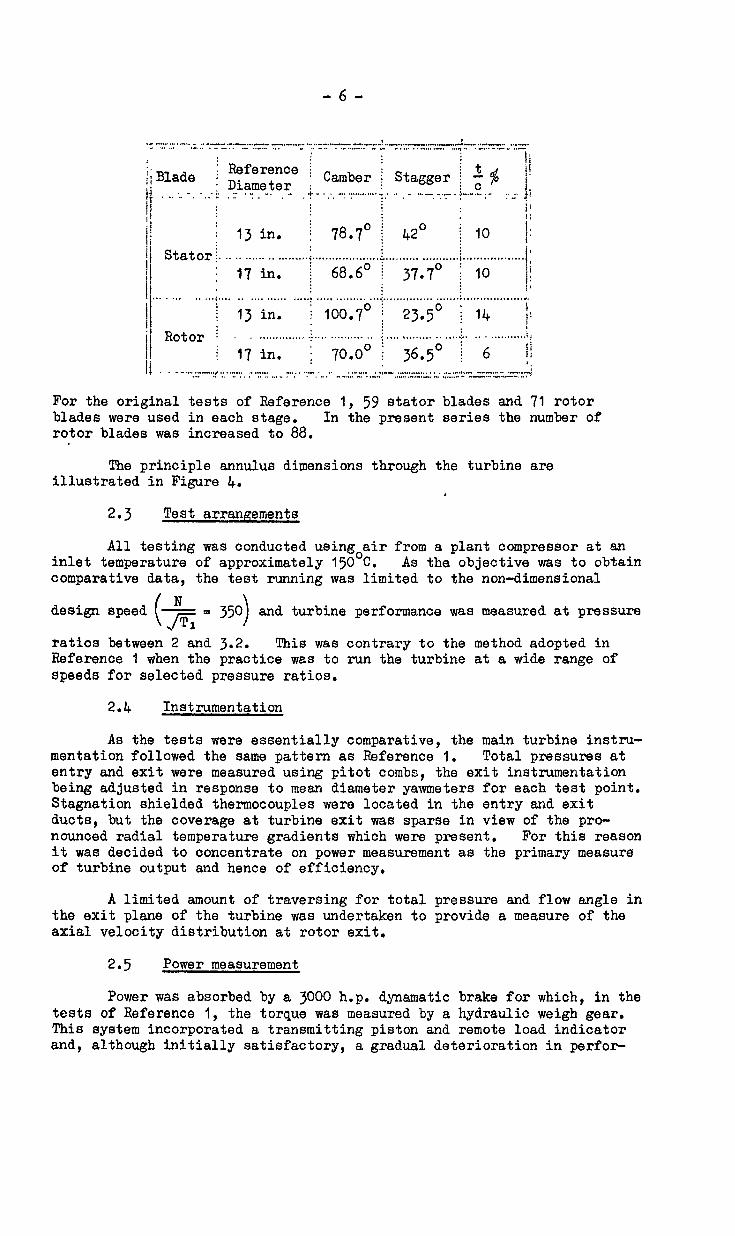
The blade profiles were constructed using a C4 section and para- bolic camber line at two reference diameters, and the sections at other radii were obtained by straight line interpolation, blade chord being made constant and equal to 1 in. at all radii.
The design blade sections are shown in Figures 2 and 3 and relevant details are tabulated below.
For the original tests of Reference 1, 59 stator blades and 71 rotor blades were used in each stage. In the present series the number of rotor blades was increased to 88.
The principle annulus dimensions through the turbine are illustrated in Figure 4.
c
2.3 Test arrangements
All testing was conducted using air from a plant compressor at an inlet temperature of approximately 150°C. As the objective was to obtain comparative data, the test running was limited to the non-dimensional
design speed ( -g=
350 1
and turbine performance was measured at pressure
ratios between 2 and 3.2. This was contrary to the method adopted in Reference 1 when the practice was to run the turbine at a wide range of speeds for selected pressure ratios.
2.4 Instrumentation
As the tests were essentially comparative, the main turbine instru- mentation followed the same pattern as Reference 1. Total pressures at entry and exit were measured using pitot combs, the exit instrumentation being adjusted in response to mean diameter yawmeters for each test point. Stagnation shielded thermocouples were located in the entry and exit ducts, but the coverage at turbine exit was sparse in view of the pro- nounced radial temperature gradients which were present. For this reason it was decided to concentrate on power measurement as the primary measure of turbine output and hence of efficiency.
A limited amount of traversing for total pressure and flow angle in the exit plane of the turbine was undertaken to provide a measure of the axial velocity distribution at rotor exit.
2.5 Power measurement
Power was absorbed by a 3000 h.p. dynamatic brake for which, in the tests of Reference 1, the torque was measured by a hydraulic weigh gear. This system incorporated a transmitting piston and remote load indicator and, although initially satisfactory, a gradual deterioration in perfor-
-7-
mance took place until variations equivalent to 21 per cent of measured torque were observed in static calibrations.
As an alternative to the hydraulic system, an existing weighing head from another brake was used to provide a direct measurement of torque for the first tests of the present series. Although this weighing system produced an improved stability in staticl calibration the scale deflection was difficult to read to the requisite accuracy during test running. For this reason an alternative system of levers was designed by which the effective sensitivity of the weighing he'ad was increased by a factor of about 10, the major counterbalance to the torque being provided by a series of accurately calibrated tare weights.
This system was incorporated for phase 3 of the test series under review and the accuracy of torque measurpment is assessed as b.25 per cent.
Although the system of torque measurement has not therefore been constant throughout the series, the method of static calibration of the two systems has remained unchanged, so it is reasonable to regard the average torque measurements throughout the test series as being strictly comparable. I I
An attempt to locate the source of the hysteresis which remains in the system confirmed the brake trunnion bearings as the prime cause. It is believed that for any further improvement in accuracy of torque measurement in the power range of the present tests (1000 h.p. at 7000 rev/min) it will be necessary to convert the trunnion mountings from the existing roller bearings to either oil or air floating bearings.
As in the earlier tests, transmission power loss in the turbine bearings was assessed from measurements of oil flow and temperature rise.
3.0 Test sequence I
The test series can be divided into three phases.
Phase 1 The turbine was assembled exactly as in Reference 1 with the exception that the number of rotor blades was increased from 71 to 88. /
Phase 2 In view of the segmented nature of the turbine annu- lus outer wall it was feared that internal flow leakage might permit some of the turbine flow to escape around rather than through the rotor blades. For phase 2 the turbine was re-assembledlwith a sealing compound suitable for the temperatures involved,applied to/all the annulus wall joints as ohown in Figure 5. I
3 Phase A very probable source of loss in turbine performance mentioned in Reference 1 was the radial tip clearance over the stator blades which is, to some extent, unavoidable with the form of construction of the turbine, The inspection tip clefrances are shown in Figure 4 and
the average clearance ratio f 0
for the three stator rows was 2.4 per I
cent. To assess the significance of this to turbine performance the clearance was reduced by building up theitips of the blades with high
-8-
melting point solder and trimming the ends to provide a clearance of between 0.007 and 0.009 inches. This corresponds to an average clearance ratio of 0.43 per cent.
4.0 Test results and discussion
4.1 Phase 1
The performance measured in phase 1 is presented in Figure 6 in the form of characteristics of efficiency and flow function against total head pressure ratio, the performance estimate and test results of Reference 1 being included for comparison.
It is clear that the increase in the number of rotor blades has caused a marked improvement in turbine efficiency, particularly at the higher pressure ratios where the improvement amounts to approximately. 3 per cent. There is also a reduction in flow of between 1 and 1$ per cent.
The latter change in performance may be regarded as the net result of two opposing influences. Due to the closer rotor pitching of phase le the rotor opening/pitch is reduced from 0.57 to 0.55 at mean diameter of the last stage. This corresponds to an increase of approximately 1 05° in gas exit angle relative to the rotor, which, for incompressible flow, would be equivalent to a reduction of about 2-$ per cent in mass flow at constant pressure ratio. However the increase in gas outlet angle is accompanied by a rise in efficiency of up to 3 per cent which, at constant relative gas angles, would tend to cause an increase in turbine swallowing capacity. It is therefore logical that the minimum reduction in flow should occur at the higher pressure ratios where the improvement in efficiency is greatest,
In regard to the marked change in turbine efficiency following the increase in blade number it is of interest to recall conclusion number 5 of Reference 1. This reads 'The low level of efficiency is due mainly to the high average rotor loss coefficient which exceeds the estimate by approximately 30 per cent. The cause of this high loss is thought to be the unconventional blade section used near the root of the rotor. While it is true that the performance of the root sections of the rotor blades may be prejudiced by the stator blade tip clearance flows, nevertheless it seems probable that a more conventional impulse profile with the curvature more evenly distributed over the blade chord would give an improved effiqiency'.
Although an alternative blade shape was not available it was con- sidered that the reduction in pitch/chord ratio obtained by increasing the blade number from 71 to 88 would suppress any serious flow breakdown in the region of the rotor root at the expense, perhaps, of some slight penalty in increased skin friction loss.
The estimated efficiency characteristic deduced in Reference 1 for the wider rotor pitch assembly is included in Figure 6 and the discrepancy between this estimate and the test efficiency of phase 1 is less than 1 per cent at a turbine pressure ratio of 2.8 to 3.0. Although this estimate was based on the wider pitch it is still valid for the present tests as the method of assessment is, in fact, very insensitive to pitch/ chord ratio, a revised rotor loss coefficient being only 2 per cent higher than the original value. It would appear that the turbine performance
- 9 -1
with closely spaced rotor blades is therefore approaching the level which might be expected for the stage loading;and blade clearances which are relevant to the tests of phase 1. It may therefore be concluded that the unconventional blade sections of this turbine require a lower blade load- ing than the more traditional circular arc sections which formed the basis of the s/c correlation of Reference 2. It is of interest to note that with the increase in blade number from ('1 to 88, the loading coefficient for the mean section of the rotor blades is virtually identical with that advocated by Zweifel, namely 0.8.
In view of the marked improvement in turbine efficiency obtained at the approximate design pressure ratio (3/l) the flow at turbine exit was traversed and the resultant axial veloci!ty distribution is compared with that of Reference 1 in Figure 8. This Iresult is surprising in so far as the reduction in rotor pitch/chord appears to yield only a relatively slight improvement in flow distribution !in contrast to the significant change observed in turbine efficiency.
4.2 Phase 2
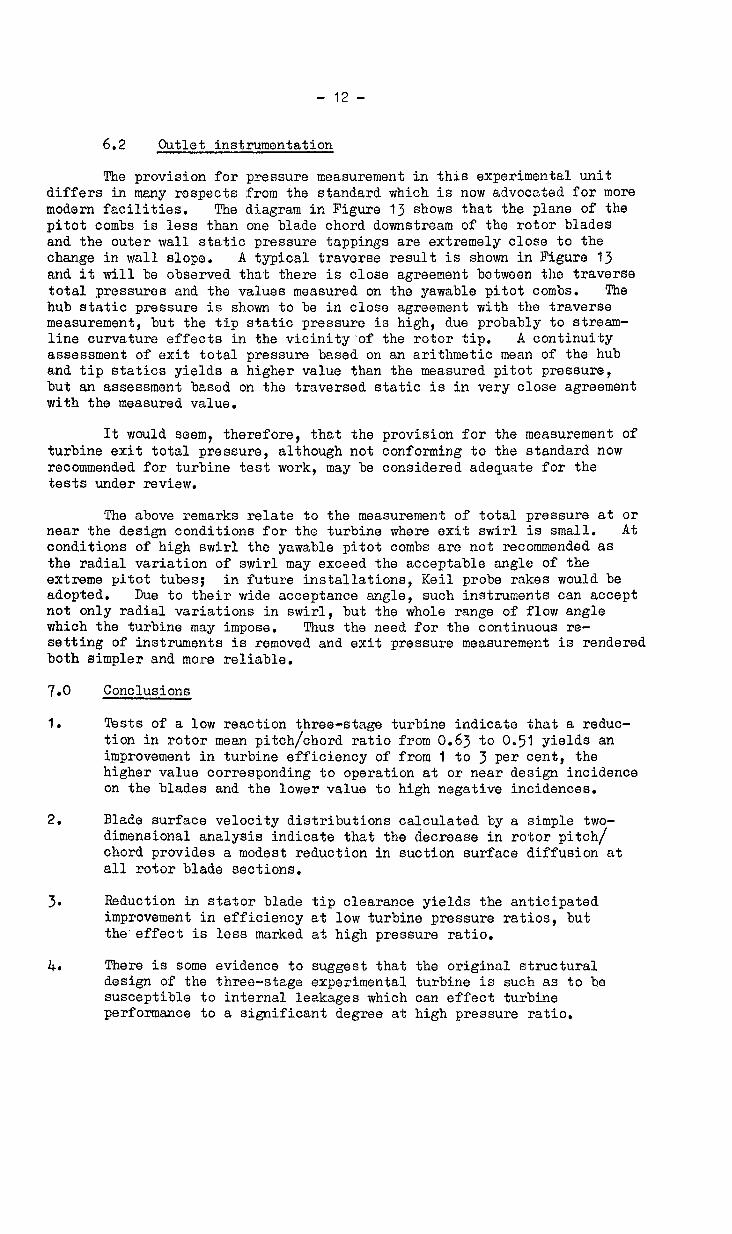
The performance measured in phase 2 is shown in Figure 79 with the results of phase 1 included for comparative purposes, It is evident that turbine efficiency is virtually unchanged below a pressure ratio of 2.8/l but at higher pressure ratio there is a iprogressive improvement in effi- ciency of up to I$ per cent, The flow characteristics are also very similar at the lower pressure ratios but; at the highest pressure ratio there is a reduction in flow for phase 2,0f approximately 1 per cent. It must be observed that the test data for phase 2 may be slightly misleading due to the scatter in flow characteristic at the higher pressure ratio. A correction of the end flow points to the best mean line would tend to reduce efficiency at the highest pressure ratio and hence reduce the apparent change in performance due to sealing.
An exit traverse was carried out for a turbine pressure ratio of approximately 3/j but there was negligible change in the axial velocity distribution from that which had been previously observed with the unsealed build in phase 1.
4.3 Phase 2
As mentioned in Section 3.0, the phase 3 build of the turbine featured reduced stator blade tip clearances which were combined with a sealing standard nominally identical with that of phase 2. Test charac- teristics are shown in Figure 8 and the scatter in both efficiency and flow is reasonably small. In comparison with phase 2 there is an indi- cation of a slight increase in flow function which suggests a possible reduction in the effectiveness of casing:sealing. The improvement in efficiency at design pressure ratio is only about 1 per cent but at lower pressure ratios this increases to 2% per cent. These changes may be compared with an effect of 3 per cent lwhich would be estimated on the basis of rotor clearance effects measured on single-stage turbines. It is possible, however, that this type of estimate will tend to exaggerate the effect of stator tip clearance , particularly for the turbine under consideration. Tip clearance will lead ito some increase in stator blade loss near the inner diameter, but also to a reduction in rotor blade incidence in this region. Now the turbijno in question has low reaction rotor root sections and it is probable that the increase in reaction due
- 10 -
to the local reduction in relative inlet gas angle is sufficient to cause a reduction in the local rotor blades loss coefficient. In this way it can be seen that the gain in turbine efficiency due to reduced stator tip leakage may well be less than for a comparable change in rotor blade clearance. This form of argument provides an explanation for the increased sensitivity of efficiency to change in stator tip clearance at low turbine pressure ratios. At such conditions the rotor incidence is negative and root reaction is higher than at design so that stator tip leakage flows can no longer confer the same degree of reduction in local rotor blade loss.
Turbine exit flow was traversed and the measured axial velocity profile shoq?? in Figure 9 is somewhat smoother than the distributions for the previous phases. It is clear however that the axial velocity distri- bution is still far removed from the constant value normally associated with free vortex blading.
This prompted a more critical review of the blade angle distribu- tions within the turbine. In the original design, free vortex angles were translated into blade design via early deviation rules and an uncon- ventional camber line shape. When the resultant blades were assessed for gas outlet angle using current methods, it was apparent that the angle distributions did not correspond to free vortex conditions (see Figure 9).
Fortunately a full radial equilibrium solution for the existing angle distribution can now readily be evaluated using a computer programme devised by Dr. J, Ringrose at the National Gas Turbine Establishment. The axial velocity distribution assessed by this method is shown in Figure 9 and it will be observed that the calculated distribution is very close to that obtained from the phase 3 traverse.
The method of calculation requires that some provision be made for losses within the machine, and for the turbine in question it was assumed that the blade losses would not vary with radius. The close agreement with this theoretical solution suggests that the flow within the turbine in phase 3 is reasonably free from those loss concentrations at inner diameter which are the probable cause of the less uniform distribution obtained in the tests of Reference 1.
5.0 Discussion
The results obtained from the various test phases have been pre- sented and discussed separately in the preceding sections, but it may be helpful to consider the overall picture which emerges. For this reason the mean characteristics for each assembly are shown together in Figure 10. The flow curves of the present series are all lower than the result of Reference 1, as would be expected in view of the reduction in rotor throat area. It is however noticeable that the flow measured in phase 3 is greater than that in phase 2 and at first slight it must be concluded that either the sealing standard must have deteriorated for the final phase, or the flow measurement of phase 2 was inaccurate. It may be, however, that the result is valid because for this turbine the highest relative S&h numbers occur in the final rotor blade row. The improve- ment in flow distribution in this blade row following the reduction in stator clearances will tend to increase the limiting flow for the rotor blade row and hence for the turbine as a whole.
- 11 -
In view of these various possibilities and of the rather indif- ferent quality of the phase 2 results it’is considered best to represent the efficiency for phase 2 by the scatter band shown. This is bounded on the upper level by the mean test efficiency curve, and on the lower level by an efficiency curve corresponding to a mass flow corrected to the characteristic of phase 3. I
On this basis it is argued that the true effect of sealing on tur- bine efficiency may well be small and the change between phase 1 and phase 3 efficiency is considered to be primarily due to the reduction in stator tip clearance. I
To analyse the effects of the increase in rotor blade number from 71 in Reference 1 to 88 in the current test series, the suction surface velocities on the rotor blades were calculated by the stream filament approach. The velocity distributions calculated at root, mean, and tip are shown in Figure 11 and, as might be expected, the increase in rotor blade number is accompanied by a generalireduction in surface velocities. It must be admitted, however, that the modest changes in surface diffusion appear insufficient to account for the marked rise in turbine efficiency which was obtained with the increase in blade number.
It should be emphasised, however, 1 that the velocities shown in Figure 11 were calculated on the assumption of simple two-dimensional flow through the blade sections. Figure 9 illustrates the marked non- uniformity in radial distribution of flo& at exit from the rotor blades, and it is probable that the radial velocity components which must be present within the flow have a significant effect on local blade surface diffusions. Thus although the relativity between the surface velocities for the two rotor assemblies is unlikelylto be seriously affected, the absolute velocity distributions may differ from those shown in Figure 11.
This underlines the difficulty of/applying surface velocity criteria to a turbine blade design in which there is a significant depar- ture from a constant radial distribution/of mass flow in successive blade rows.
6.0 General test information
6.1 Blade foul in4
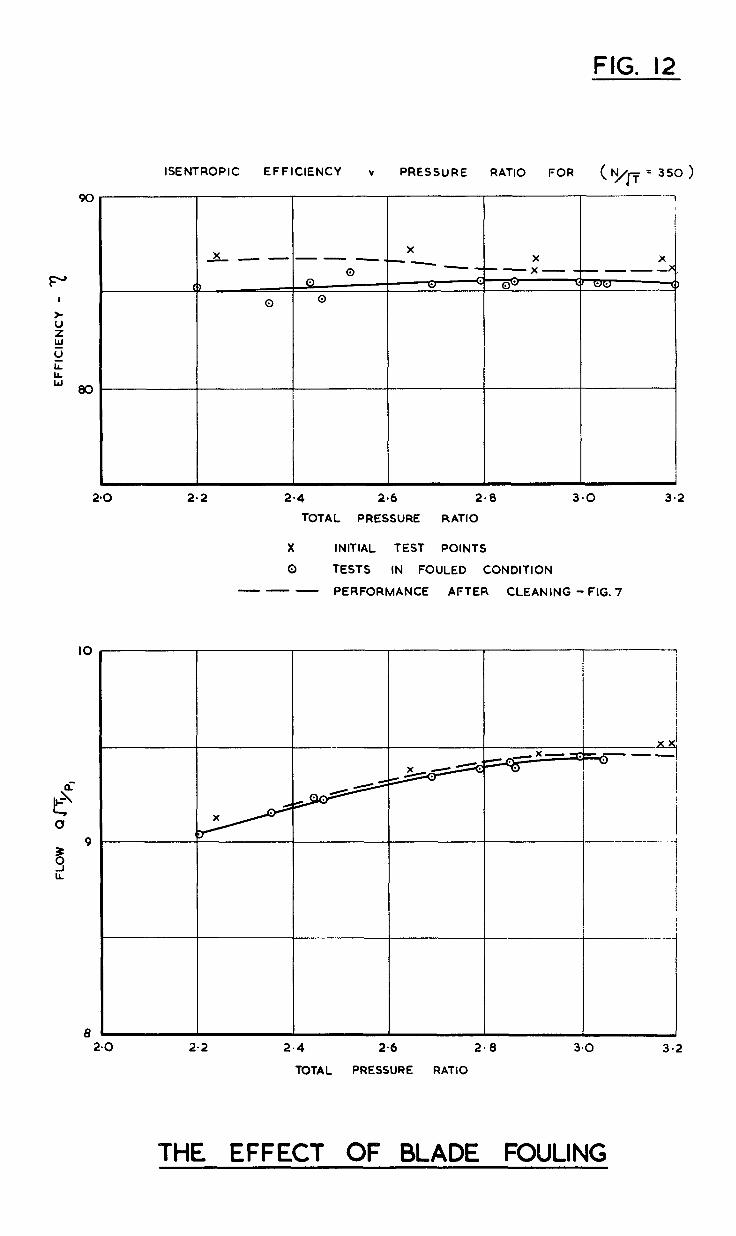
One item of a general nature which emerged during this test series is worthy of record, namely, the sensitivity of the turbine to blade foul- ing. In the course of testing the phase 3 build, there was an unavoid- able interruption while the main air control valve in the supply ducting was replaced, a job requiring a considerable amount of ducting modifica- tion. During this time the turbine was; isolated from the supply line by a blanking plate, but when testing was resumed it was found that the efficiency characteristic lay below the initial test values by a margin of 1 to 2 per cent. The turbine was stripped and the blades were found to be coated with a considerable layer of dirt. After cleaning and re-assembly, testing was resumed and the/ results already presented in Section 4.3 for phase 3 were obtained. I The efficiency and flow test data obtained in the fouled condition are shown in Figure 12 where they are compared to the phase 3 ‘clean’ test! curves. It is interesting to observe that the effect of fouling on ef!!?iciency is greatest at low pres- sure ratio and that the effect on the flow characteristic is negligible.
- 12 -
6.2 Cutlet instrumentation
The provision for pressure measurement in this experimental unit differs in many respects from the standard which is now advocated for more modern facilities. The diagram in Figure 13 shows that the plane of the pitot combs is less than one blade chord downstream of the rotor blades and the outer wall static pressure tnppings are extremely close to the change in wall slope. A typical traverse result is shown in Figure 13 and it will be observed that there is close agreement between the traverse total pressures and the values measured on the yawable pitot combs. The hub static pressure is shown to be in close agreement with the traverse measurement, but the tip static pressure is high, due probably to stream- line curvature effects in the vicinity'of the rotor tip. A continuity assessment of exit total pressure based on an arithmetic mean of the hub and tip statics yields a higher value than the measured pitot pressure, but an assessment based on the traversed static is in very close agreement with the measured value.
It would seem, therefore, that the provision for the measurement of turbine exit total pressure, although not conforming to the standard now recommended for turbine test work, may be considered adequate for the tests under review.
The above remarks relate to the measurement of total pressure at or near the design conditions for the turbine where exit swirl is small. At conditions of high swirl the yawable pitot combs are not recommended as the radial variation of swirl may exceed the acceptable angle of the extreme pitot tubes; in future installations, Keil probe rakes would be adopted. Due to their wide acceptance angle, such instruments can accept not only radial variations in swirl, but the whole range of flow angle which the turbine may impose. Thus the need for the continuous re- setting of instruments is removed and exit pressure measurement is rendered both simpler and more reliable.
7.0 Conclusions
1. Tests of a low reaction three-stage turbine indicate that a reduc- tion in rotor mean pitch/chord ratio from 0.63 to 0,51 yields an improvement in turbine efficiency of from 1 to 3 per cent, the higher value corresponding to operation at or near design incidence on the blades and the lower value to high negative incidences.
2. Blade surface velocity distributions calculated by a simple two- dimensional analysis indicate that the decrease in rotor pitch/ chord provides a modest reduction in suction surface diffusion at all rotor blade sections.
3. Reduction in stator blade tip clearance yields the anticipated improvement in efficiency at low turbine pressure ratios, but the'effect is less marked at high pressure ratio.
4. There is some evidence to suggest that the original structural design of the three-stage experimental turbine is such as to be susceptible to internal leakages which can effect turbine performance to a significant degree at high pressure ratio,
- 13 -
5. The blading tested does not conform to free vortex requirements and exit traverses indicate considerab+e non-uniformity in axial velocity, A radial equilibrium assessment of the flow development through the turbine yields an exit/velocity profile which is in very close agreement with the distribution of velocity measured for the most efficient build of the turbine.
C
h
k
kp
N
P
&
t
U
AT
- 14 -
NOTATION
blade chord
blade height
blade tip clearance
specific heat at constant pressure
rotational speed
inlet total pressure
mass flow
inlet total temperature
maximum blade thickness
rotor blade rotational velocity
gas total temperature drop across turbine
(in.)
(in.)
(in.)
(ft pdl/lb'C)
(rev/min)
(p.s.i.a.)
(lb/s >
(OK)
(in.)
et/s >
(“c>
- 15 -
2
Author(s)
I. H, Johnston G. 5. Sansome
D. G. Ainley G. C. R. Ma.thieson
REFEREN&
Title, etc.
Testsion an experimental three-stage turbirie fitted with low reaction bladidg of unconventional form. R. & kk 3220
A method of performance estimation for a&al flow turbines. R. & &. 2974
D 74059/l/ba125875 K.4. 7/66 R/CL
FIG. I
z 0 i= Y tn
FIG. 2
REFERENCE DIA.= 13. 00”
PROFILE IOC4/ 78*7P CHORD = I- 0’
REFERENCE DIA = 17.00~
PROFILE IOC4/68*6 P CHORD - 1.0”
STATOR BLADE PROFILES
FIG. 3
REFERENCE DIA. = I A .= I
PROF PROFILE 14C4/100*7P
3100”
CHORD = I. 0”
BLADE PITCH: FOR PRESENT SERIES ----BLADE PITCH’ OF REF.1.
PROFILE 6C4/7OP CHORD = I* 0”
REFERENCE DIA.1 17.00’
ROTOR BLADE’ PROFILES.
FIG. 4
I FROM MANUFACTURING DRAWINGS
LL IS*34 12-s 62. I ANi
MM 15.34 12.5 62* I ANo ANl (I)
NN 15.54 12.5 66994 AN2 AN3 (2)
00 15 -96 l2* 5 77- 34 AN0 ANI (2) (2)
PP I6 -41 12-5 Be- 0 AN2 (2)AN3 (3)
QC? 17*00 I2 l 5 1040 2 ANo (J)ANl (3)
RR 17.62 l2* 5 121-o AN2 (3)
INSPECTION VALUES FOR TIP CLEARANCE (IN>
STATION E D H C I 0
REF. I O-036 0.036 0.035 O-051 0’042 O-062
PHASES I8 2 O-03 2 0*031 O-04 I O-052 0*050 O-060
PHASE 3 0*007 o* 031 O-007 09 OS2 O-009 O-060
THREE STAGE TURBINE DIMENSIONS.
FIG. 5
lST STAGE
STATOR
L
zND STAGE STATOR
SEALlNG COMPOUND APPLIED WkiERE MARKED THUS XX
INTER SEGMENT SEALING STRIPS
0 l I 6”
SECTION A-A :
DETAILS OF SEALING ON’ TURBINE OUTER ANNULUS WALLS.
FIG. 6
ISENTROPIC EFFICIENCY v PRESSURE RATIO (N/j-y = 350)
90
5 Z w v ii Y
80
-I- ---- ---_
cl UI 00 P -
----- --- - --.
-w
2.0 2.2 2.4 2.6 2.8 3.0 3.2
TOTAL PRESSURE RATIO
- B - B ESTIMATE OF EFFICIENCY REF. I ---- TEST RESULTS
FLOW FUNCTION v PRESSURE RATI 0 (N,T= 350)
2.2 2.4 2.6
TOTAL PRESSURE
2.8 3.0 3.2
RATIO
TURBINE PERFORMANCE - PHASE I
FIG. 7
IO
8
ISENTROPIC EFFICIENCY v PiESSURE RATIO FOR (“J//y = 350)
2.0 2.2 2.4 2.6 2.8 3.0 3.2
TOTAL PRESSURE RATIO
-m- RESULTS k?OM PHASE I
FLOW FUNCTION v PRESSURE RATIO FOR ( NQ = 350 )
T
t
c
2.0 2.2 2.4 2.6 i 2.8 3-o 3.2
TOTAL PRESSUTE RATIO
TURBINE PERFORMANCE- PHASE 2
FIG. 8
ISENTROPIC EFFICIENCY V PRESSURE RATIO FOR ( N/E = 350)
0
-
oca t
--- ---
---
0 - ----
2.0 2-2 2.4 2.6 2. 8 3.0 3.2
TOTAL PRESSURE RATIO
--- PHASE 2 RESULTS
FLOW FUNCTION v PRESSURE RATIO FOR ( N/r= 350 )
8 2.0 2.2 2.4 2.6 2.8 3.0
TOTAL PRESSURE RATIO
3*2
TURBINE PERFORMANCE- PHASE 3
FIG. 9
VELOCITY PROFILES AT TURBINE EXIT
\ /I PHASES I62
/
TIP
RELATIVE GAS
ANGLES AT EXIT FROM 3’O* ROTOR ROW (PHASE 3)
HUB
TIP
COMPARISON BETWEEN RADIAL EQUILI BRIUM VELOCITY DISTRIBUTION 8 PHASE 3 TRAVERSE
(PRG2.8 Nh=350)
. 2
2 ti d
HUB
8-O
7-s
7.0
1 I I
028 0*9 I*07
52O -54” -56’ -5 8’ -60’
RELATIVE OUTLET ANGLE d2
e CALCULATED FROM TRAVERSE
- -- ESTIMATE USING ACTUAL BLADE GEOMETRY
e--e - REQUIREMENT FOR FREE VORTEX
-- CALCULATED FROM TRAVERSE
w-e - ESTIMATE USING RADIAL EQUlLl8RlUM
AXIAL VELOCITIES Ai- TURBINE EXIT.
FIG. IO
ISENTROPIC EFFICIENCY v PRESSURE RATIO FOR ( N/5 = 350 )
90
Y
5 3 i3 k 8C
--
3 2.2 2.4 2.6 2.8 3.0 3.2
TOTAL PRESSURE RATIO
FLOW FUNCTION v PRESSURE RATIO FOR (N.F=3W
2.4
TOTAL
2.6 2.8 3.0 3.2
PRESSURE RATIO
COMPARISON OF TEST RESULTS
1’4m I I I I I
ROTOR ROOT SECTION -
“‘V 2
I*2 .
I*01 -t
0 20 40 .60 80 Ii SUCTION SURFACE LENGTH %
l-4 I I
“/ “2 -
ROTOR MEAl$ SECTtON
I-2 ---__
I -- / \
/ , - /
I.0 / j 0 20
I.4
“‘V 2
I I ROTOR TIP SECTION
I*2 / ---- / w\ /
/ / Y\
/ / /
I.OL m
\
0 20 40 160 80 100
---_ WIDE PlTd s/c s o-575 NARROW Pi+CH s/c 50.465
A.&C. C.P. Noo 861 August 1964 JOhnstOn, I. R. and Dxansfleld, D. C.
621&8.018:621 k38-253.5: 621-762
A.R.Co C.P. No.861 August 1964 Johnston, I. Ho and Dransfleld, D. Co
621.&8.018:621.438-253.5: 621-762
FURTHER TESTS ON A THREiMTAGE TURBINE CF IL34 RTRTRER l.ESlS CN A TRRJZEdTAGE ‘IWRBINE OF LU4 REACTION TO EXAMINE THE EFFECTS OF REDUCED REACTION M EXAMINE THE EFFEC’IS OF RRDUCED
ROTOR PITCH AND ItiPRCVED SEALING ROTCR PITCH AND IMPRCVED SEALING
Reductions have been made to the rotor blade spacing, stator tip clearance, and Internal leakage flcws In a previously tested three- stage experimental turbine of high stage loading. The separate efrects or these modlflcations on overaIl performance have been determined by further tests; the combined effect being to Increase the overall design point efficiency from 82 per cent to 864 per cent, approxlmatelyo The results are discussed In the light of other data arrl partial agreement between the test performance aM generalised estimates Is established0
Reductions have been made to the rotor blade spacing, stator tip clearance, and Internal leekage flows In a prevlously tested three- stage experimental turbine of high stage loading0 The separate effects of these modifications on overall performance have been determined by further tests; the combined effect being to increase the overall design point efrlclency from 82 per cent to 864 per cent, approximately. The results are discussed in the light of other data and partial agreement between the test performance and generalised estimates Is established.
I A.R.C. C.P. No. 861 621.438.018:621.43&25305: ~---__-_~ --Augusti%
-- -- -62,~7~-
Johnston, 1. H. and DraIWleld, D. C.
FURTHER TESTS ON A THREiMTAGE TUREiINE OF IL.34 R!UCi’ION TO EXAHINE THE EFFECTS OF REDUCED
ROTOR PITCH AND IMPROVED SEALING
Reductions have been made to the rotor blade spacing, stator tip clearance, ard Internal leakage flaws In a previousiy tested three- stage experlmentel turbine of high stage loading. The separate effects of these modifications on overall perfonuance have been determined by further tests; the ccmblned effect being to increase the overall design point efficiency from 82 per cent to 864 per cent, approximately. The results are discussed ln the light of other data ani partial agreement betaveen the test performance and generalised estimates Is established.
I
!
!
I I
I
I
I I I I I
I i
I
I
I I
i
I I
I
I
I
‘. I
I
I
I
I
I
C.P. No. 861
0 Crown copyright 1966
Printed and published by HER MAJESTY’S STATIONERY OFFICE
To be purchased from 49 High Holborn, London w.c.1 423 Oxford Street, London w.1 13~ Castle Street, Edinburgh 2
109 St. Mary Street, Cardiff Brazennose Street, Manchester 2