53
MINNESOTA WALKS Current & Future Steps Towards a Walkable Minnesota May 2015

MINNESOTA WALKS Current & Future Steps Towards a Walkable Minnesota
May 2015

This page intentionally left blank
April, 2015
Dear Citizens of Minnesota,
Every day we face choices of how to get around in our neighborhoods and cities across the state. There is one thing we all have in common regardless of how we choose to travel – at some point we are all pedestrians. With this in mind, I am happy to share the Minnesota Walks: Current and Future Steps towards a Walkable Minnesota background document, a precursor to the statewide pedestrian system plan.
This document is the first product and initiative between the Minnesota Department of Transportation (MnDOT) and the Minnesota Department of Health (MDH), where we aim to improve our ability to address the needs of people who walk in all of our communities. We recognize that this is only the first step, and in order to create an effective plan we understand the need to gather input from a variety of stakeholders with interest in walkability issues. Over the last year we reached out to over 50 stakeholder organizations and all of the MnDOT district offices to learn more about the current policies, plans, and practices that impact planning for people who walk. This initial outreach has already provided us with invaluable feedback, and maintaining relationships with our stakeholders will continue to be a top priority.
Of equal importance to gathering input from our stakeholder organizations is the process of gathering input from you, the public! An extensive community engagement process in the summer of 2015 will further help us to establish our vision with concrete goals and recommendations. In the interim, if you have comments or would like more information about the plan and how to provide input in the summer of 2015, go to www.mndot.gov/peds.
MnDOT and MDH will work with the information collected to identify recommendations and priorities to draft a statewide Pedestrian Plan in the winter of 2016. It is intended that the draft plan will help identify recommendations for policies, projects, and programs at the local, regional and state levels.
The Minnesota Department of Transportation and the Minnesota Department of Health invite you to read, share and discuss this document. We look forward to working with all people in Minnesota to realize a vision for a safer and healthier state.
Sincerely,
Tim HenkelAssistant CommissionerModal Planning and Program Management Division
StatewidePedestrian System Plan

This page intentionally left blank
TABLE OF CONTENTS PAGE 1
TABLE OF CONTENTS
Executive Summary 2
Acknowledgements 5
Introduction 7
Walking is Important 9WALKING PROVIDES NUMEROUS AND DIVERSE BENEFITS FOR PEOPLE IN MINNESOTA
Walking Should Be Easier 13ENVIRONMENTAL FACTORS – BUILT, SOCIAL, AND CULTURAL – AFFECT WALKING IN MINNESOTA
It’s Harder for Some People to Walk 19SOME POPULATIONS HAVE LESS ACCESS AND FEWER OPPORTUNITIES TO SAFELY WALK
Minnesota is on Track to Improve Walking 27MINNESOTA IS WORKING ON WALKING IN MANY DIFFERENT WAYS
Appendices 39

MINNESOTA GO MINNESOTA WALKS: CURRENT & FUTURE STEPS TOWARDS A WALKABLE MINNESOTAPAGE 2
EXECUTIVE SUMMARY WALKING IS IMPORTANT: What walking does
Walking is essential for transportation• Everyone is a pedestrian at some point in
their day. Even if you drive to a destination you are a pedestrian the moment you step out of your car.
Walking is good for health (see page 9)
• Regular physical activity reduces the risk of many chronic diseases and has been linked to improved mental well-being and improved quality of life.
• Improving pedestrian infrastructure supports an increase in walking.
Walking is good for business (see page 10)
• Commercial businesses with mixed-use, medium-high density benefit from pedestrian infrastructure.
• Walkable communities attract investment from both commercial and residential developers.
Walking connects the social, economic and physical environment (see page 11)
• Pedestrian infrastructure connects people to major destinations – schools, jobs, recreation and parks, goods and services.
WALKING SHOULD BE EASIER: How environmental factors – built, social, and cultural affect walking
Federal Highway Act (see page 13)
• Federal support to expand the highway network in the 1950s encouraged families to move into auto-oriented suburbs, contributing to a major increase in vehicle miles traveled.
• Cars are still dominant as the main mode of transportation in the U.S.
Pedestrian safety (see page 14)
• Nationally, pedestrian crashes accounted for 13 percent of fatal crashes between 2008 and 2012.
Community livability and urbanization (see
page 15)
• Some evidence suggests that millennials prefer more compact, walkable, mixed-use and mixed-income communities.
• Many baby boomers also want the option to live in walkable places during retirement.
• Current market demands indicate that people with the luxury of choice may be seeking places to live that are walkable and have easy access to destinations.
IT’S HARDER FOR SOME PEOPLE: Some populations have less access and fewer opportunities to safely walk
Not everyone has equal access to safe places to walk (see page 19)
• Walking is more challenging for certain populations.
• Inactivity is highest in rural areas, as well as among people of color, older adults, those with less education, women and lower-income groups
Social and economic factors (see page 19)
• Households without a vehicle tend to be located in the Twin Cities metro area, in communities with a high college/university student population and in low-income communities.
• A small, yet growing number of households are choosing not to own a car.
Demographic shifts and trends (see page 20)
• Demographic trends will help identify priority areas for pedestrian needs.
• The state’s 65 and older population will double between 2010 and 2035.
• Minnesota’s populations of color are projected to grow from 14 percent in 2005 to 25 percent in 2035.
• Populations will increase in urban areas around the Twin Cities but decline in some Greater Minnesota counties.
High impact populations (see page 20)
• These include small rural core communities, American Indian populations, low-income urban populations, older adults, persons with disabilities, and children and youth.
• All of these categories require unique consideration when dealing with pedestrian issues.
EXECUTIVE SUMMARY PAGE 3
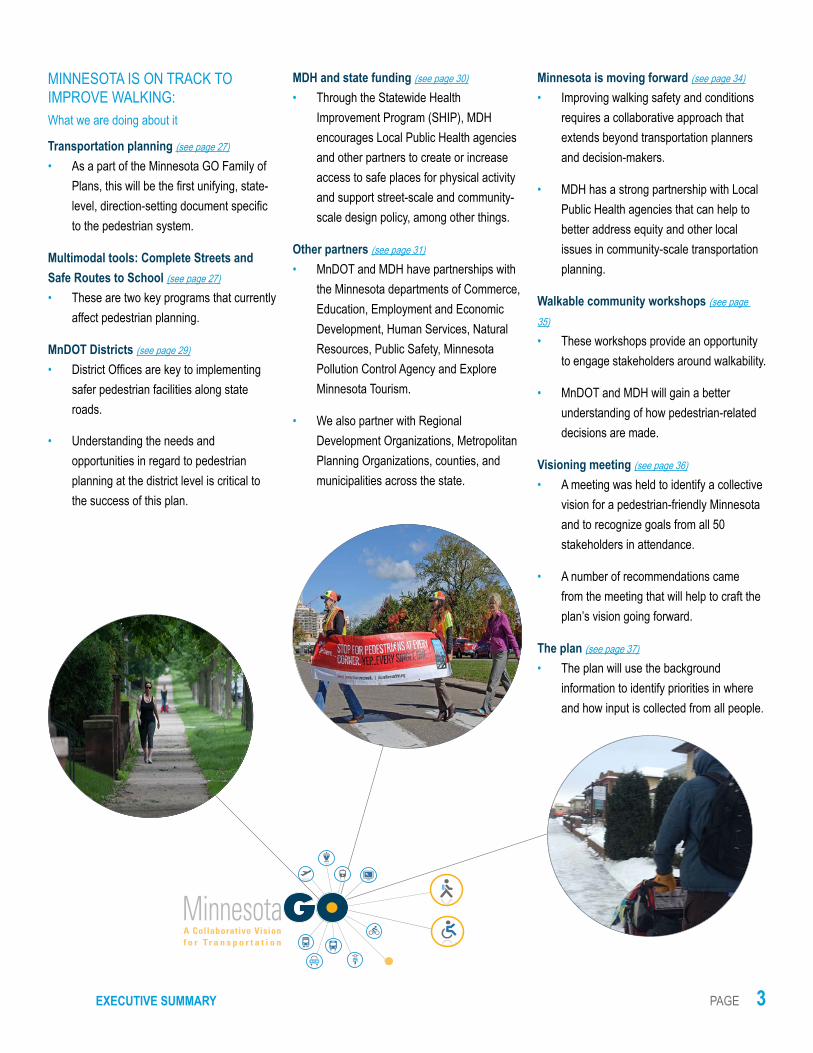
MINNESOTA IS ON TRACK TO IMPROVE WALKING: What we are doing about it
Transportation planning (see page 27)
• As a part of the Minnesota GO Family of Plans, this will be the first unifying, state-level, direction-setting document specific to the pedestrian system.
Multimodal tools: Complete Streets and Safe Routes to School (see page 27)
• These are two key programs that currently affect pedestrian planning.
MnDOT Districts (see page 29)
• District Offices are key to implementing safer pedestrian facilities along state roads.
• Understanding the needs and opportunities in regard to pedestrian planning at the district level is critical to the success of this plan.
MDH and state funding (see page 30)
• Through the Statewide Health Improvement Program (SHIP), MDH encourages Local Public Health agencies and other partners to create or increase access to safe places for physical activity and support street-scale and community-scale design policy, among other things.
Other partners (see page 31)
• MnDOT and MDH have partnerships with the Minnesota departments of Commerce, Education, Employment and Economic Development, Human Services, Natural Resources, Public Safety, Minnesota Pollution Control Agency and Explore Minnesota Tourism.
• We also partner with Regional Development Organizations, Metropolitan Planning Organizations, counties, and municipalities across the state.
Minnesota is moving forward (see page 34)
• Improving walking safety and conditions requires a collaborative approach that extends beyond transportation planners and decision-makers.
• MDH has a strong partnership with Local Public Health agencies that can help to better address equity and other local issues in community-scale transportation planning.
Walkable community workshops (see page
35)
• These workshops provide an opportunity to engage stakeholders around walkability.
• MnDOT and MDH will gain a better understanding of how pedestrian-related decisions are made.
Visioning meeting (see page 36)
• A meeting was held to identify a collective vision for a pedestrian-friendly Minnesota and to recognize goals from all 50 stakeholders in attendance.
• A number of recommendations came from the meeting that will help to craft the plan’s vision going forward.
The plan (see page 37)
• The plan will use the background information to identify priorities in where and how input is collected from all people.
StatewidePedestrian System Plan

MINNESOTA GO MINNESOTA WALKS: CURRENT & FUTURE STEPS TOWARDS A WALKABLE MINNESOTAPAGE 4
This page intentionally left blank
ACKNOWLEDGEMENTS PAGE 5
ACKNOWLEDGEMENTS Minnesota Walks: Current & Future Steps toward a Walkable Minnesota was made possible and prepared by the Minnesota Departments of Health and Transportation.
The team would especially like to thank the individuals who participated on the Phase I Project Advisory Committee Group for their assistance in the development of this document. Additional thanks goes to the participants in the visioning session and staff from all eight of MnDOT’s Districts for their time and input.
PEDESTRIAN PLAN TEAM MEMBERS (IN ALPHABETICAL ORDER)
Andrew Andrusko, Metro District, Assistant Planner, Office of Planning, Program Management and Transit, MnDOTGreta Alquist, Principal Planner of Bicycle and Pedestrian Section, Office of Transit, MnDOTCorentin Auguin, Student Worker Para Professional Senior, Office of Transportation System Management, MnDOTKatie Caskey, Principal Planner, Office of Transportation System Management, MnDOTNicole Campbell, Safe Routes to School Coordinator of Bicycle and Pedestrian Section, Office of Transit, MnDOTAmber Dallman, Physical Activity Coordinator, Office of Statewide Health Improvement Initiatives, MDHSara Dunlap, Principal Planner, Office of Transit, MnDOTShannon Foss, Principal Planner, Office of Transportation System Management, MnDOTJasna Hadzic, Senior Planner of Bicycle and Pedestrian Section, Office of Transit, MnDOTChris Kartheiser, Green Corps Member, Office of Statewide Health Improvement Initiatives, MDHJake Rueter, Planner, Office ofTransportation System Management, MnDOTAnthony Wotzka, Landscape Design Specialist of Environmental Planning and Design Unit, Office of Environmental Stewardship, MnDOT
PHASE I PROJECT ADVISORY COMMITTEE MEMBERS
Bryan Anderson, District 1 Planning Director, MnDOTMelissa Barnes, Office to Traffic Safety and Technology, MnDOTKristie Billiar, ADA Implementation Coordinator, MnDOTApril Crockett, Engineer, MnDOTJohn Griffith, Transportation Planning Director, MnDOTSue Lodahl, Maintenance, MnDOTKathleen Mayell, Investment Planning Director, Office of Transportation System Management, MnDOTTimothy Mitchell, Bicycle and Pedestrian Section Director, Office of Transit, MnDOTGina Mitteco, Metro District Bicycle and Pedestrian Coordinator, MnDOTPhilip Schaffner, Policy Planning Director, Office of Transportation System Management, MnDOT
DOCUMENT EDITORSNick Busse, Marketing and Communications Manager, Research Services & LIbrary, MnDOTShannon Fiecke, Research Information Officer, Office of Transportation System Management, Research Services & Library, MnDOT
For more information about the plan and how you can provide input in the summer of 2015, go to www.mndot.gov/peds.

MINNESOTA GO MINNESOTA WALKS: CURRENT & FUTURE STEPS TOWARDS A WALKABLE MINNESOTAPAGE 6
This page intentionally left blank

CHAPTER 1 INTRODUCTION PAGE 7
INTRODUCTIONWalking is the most common and accessible form of transportation and physical activity. In Minnesota, people of all ages and abilities walk and roll to access goods and services, participate in social activities, and enjoy a good quality of life. For the purposes of this document, walking is defined as a person moving on foot or rolling with the use of an assistive device as a substitute for walking. Even when people drive or take public transportation, walking to a vehicle is part of that trip. This is a good thing: study after study shows that walking, whether for leisure, recreation or transportation, improves health and our social, economic and built environment.
Many people depend on modes of travel other than driving, whether due to age, disability, economic circumstances or personal preference. Providing adequate pedestrian facilities is essential to ensure people can walk safely and conveniently to their destinations. Currently, most pedestrian-level facilities and infrastructure are funded through transportation projects. There are some pedestrian-related infrastructure projects funded through the Minnesota Department of Natural Resources and other sources. However, most facilities and infrastructure are implemented with local, regional, state or federal transportation funds. Various jurisdictions have oversight of roads and pedestrian facilities. This can make conversations about who is responsible for pedestrian infrastructure challenging and confusing.
GOALThe Minnesota GO 50-Year Vision for Transportation is to maximize the health of people, the environment and our economy. The creation of a statewide pedestrian plan will help advance the Minnesota GO and support the Minnesota Department of Transportation’s commitment to providing safe, multimodal transportation options. The plan will also make recommendations for policies, projects and programs that would improve the pedestrian environment at the state, regional and local levels. Examples of possible recommendations include identifying street-scale design policies, supportive zoning regulations and funding opportunities. Recommendations identified through the plan will further recognize other partners and stakeholders who can elevate walking through design, zoning guidelines, education and/or incentives for developers to incorporate pedestrian-friendly improvements through small-scale redevelopment. Together these steps require dedication and long-term planning, but they can have a lasting impact on the health and walkability of the entire state.
While countless efforts have been made to improve pedestrian conditions over the past years in Minnesota, this document represents the first comprehensive statewide effort to address pedestrian needs and challenges. It will provide a foundation for future actions to address pedestrian needs throughout all parts of the state.

MINNESOTA GO MINNESOTA WALKS: CURRENT & FUTURE STEPS TOWARDS A WALKABLE MINNESOTAPAGE 8
This page intentionally left blank
CHAPTER 2 WALKING IS IMPORTANT PAGE 9
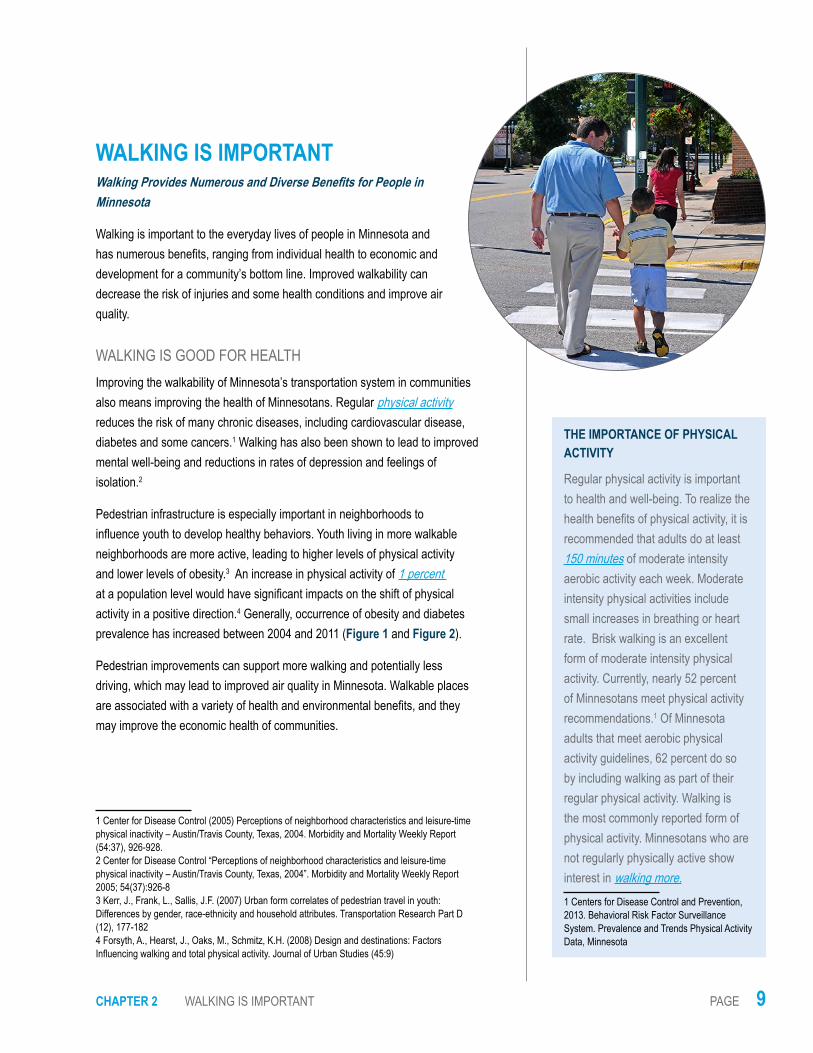
WALKING IS IMPORTANTWalking Provides Numerous and Diverse Benefits for People in Minnesota
Walking is important to the everyday lives of people in Minnesota and has numerous benefits, ranging from individual health to economic and development for a community’s bottom line. Improved walkability can decrease the risk of injuries and some health conditions and improve air quality.
WALKING IS GOOD FOR HEALTHImproving the walkability of Minnesota’s transportation system in communities also means improving the health of Minnesotans. Regular physical activity reduces the risk of many chronic diseases, including cardiovascular disease, diabetes and some cancers.1 Walking has also been shown to lead to improved mental well-being and reductions in rates of depression and feelings of isolation.2
Pedestrian infrastructure is especially important in neighborhoods to influence youth to develop healthy behaviors. Youth living in more walkable neighborhoods are more active, leading to higher levels of physical activity and lower levels of obesity.3 An increase in physical activity of 1 percent at a population level would have significant impacts on the shift of physical activity in a positive direction.4 Generally, occurrence of obesity and diabetes prevalence has increased between 2004 and 2011 (Figure 1 and Figure 2).
Pedestrian improvements can support more walking and potentially less driving, which may lead to improved air quality in Minnesota. Walkable places are associated with a variety of health and environmental benefits, and they may improve the economic health of communities.
1 Center for Disease Control (2005) Perceptions of neighborhood characteristics and leisure-time physical inactivity – Austin/Travis County, Texas, 2004. Morbidity and Mortality Weekly Report (54:37), 926-928.2 Center for Disease Control “Perceptions of neighborhood characteristics and leisure-time physical inactivity – Austin/Travis County, Texas, 2004”. Morbidity and Mortality Weekly Report 2005; 54(37):926-8 3 Kerr, J., Frank, L., Sallis, J.F. (2007) Urban form correlates of pedestrian travel in youth: Differences by gender, race-ethnicity and household attributes. Transportation Research Part D (12), 177-182 4 Forsyth, A., Hearst, J., Oaks, M., Schmitz, K.H. (2008) Design and destinations: Factors Influencing walking and total physical activity. Journal of Urban Studies (45:9)
THE IMPORTANCE OF PHYSICAL ACTIVITY
Regular physical activity is important to health and well-being. To realize the health benefits of physical activity, it is recommended that adults do at least 150 minutes of moderate intensity aerobic activity each week. Moderate intensity physical activities include small increases in breathing or heart rate. Brisk walking is an excellent form of moderate intensity physical activity. Currently, nearly 52 percent of Minnesotans meet physical activity recommendations.1 Of Minnesota adults that meet aerobic physical activity guidelines, 62 percent do so by including walking as part of their regular physical activity. Walking is the most commonly reported form of physical activity. Minnesotans who are not regularly physically active show interest in walking more.1 Centers for Disease Control and Prevention, 2013. Behavioral Risk Factor Surveillance System. Prevalence and Trends Physical Activity Data, Minnesota

MINNESOTA GO MINNESOTA WALKS: CURRENT & FUTURE STEPS TOWARDS A WALKABLE MINNESOTAPAGE 10
WALKING IS GOOD FOR BUSINESS People who live in more walkable neighborhoods tend to be more familiar with their surroundings, engaged in their community and walk more for day-to-day activities such as walking to the local store and to complete errands. This also has economic benefits. Commercial businesses in mixed-use and high density locations benefit from pedestrian infrastructure, as shops with street-facing doors and windows attract pedestrians. Grid street networks with pedestrian infrastructure and marked crossings encourage pedestrians to move through the commercial district by walking because of the ease.
The walkability of an area also has an impact on housing choices. Neighborhoods with grid street patterns, pedestrian amenities and street-oriented design have higher housing sales.5 To attract home buyers, real estate ads now include Walk Scores, calculated using population density, block length, intersection density and distance to amenities such as shopping, schools, recreation and health care .
As current market demands suggest, people with the ability to choose where they live are seeking places that are more walkable with easy access to destinations. But not everyone has that same opportunity. It is also beneficial to a city to attract these people because they are often valued members of the workforce that can help a region’s economy. 5 Sohn, D.W., Moudon, A.V., Lee, J. (2012) The Economic Value of Walkable Neighborhoods. Urban Design International. vol. 17 115-128.
Figure 1: Percent change in obesity, 2004-2011 Figure 2: Percent change in diabetes prevalence, 2004-2011
CHAPTER 2 WALKING IS IMPORTANT PAGE 11
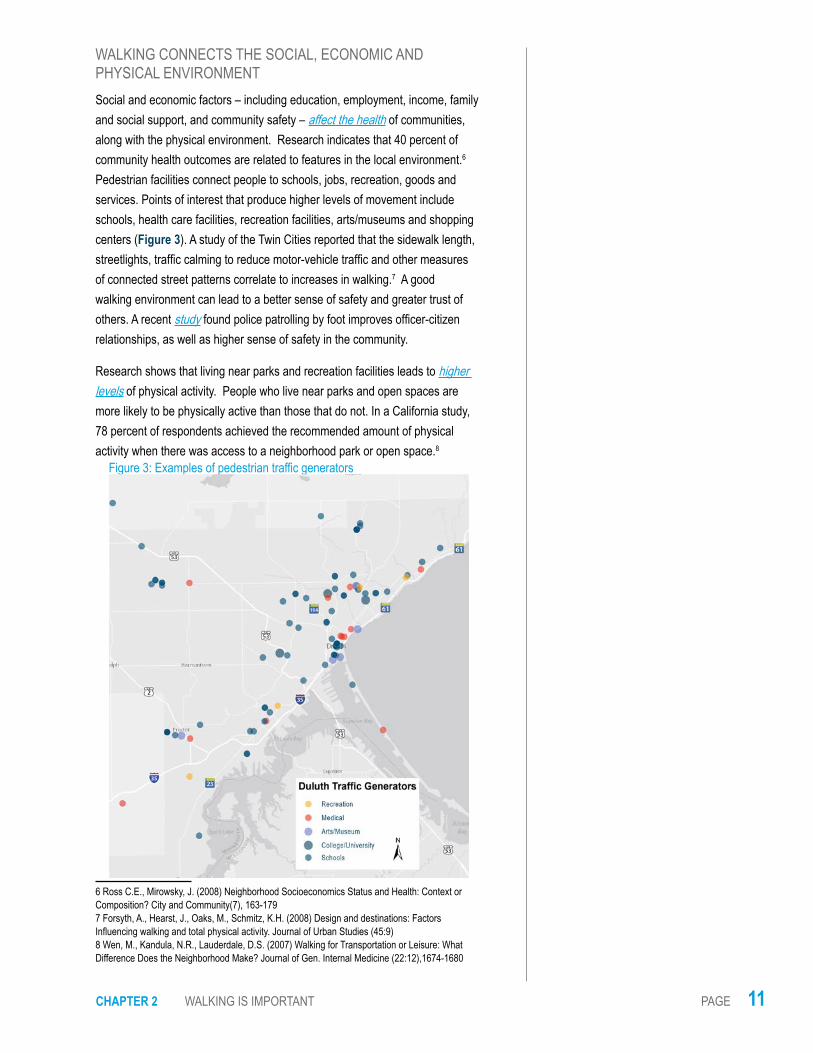
WALKING CONNECTS THE SOCIAL, ECONOMIC AND PHYSICAL ENVIRONMENT Social and economic factors – including education, employment, income, family and social support, and community safety – affect the health of communities, along with the physical environment. Research indicates that 40 percent of community health outcomes are related to features in the local environment.6 Pedestrian facilities connect people to schools, jobs, recreation, goods and services. Points of interest that produce higher levels of movement include schools, health care facilities, recreation facilities, arts/museums and shopping centers (Figure 3). A study of the Twin Cities reported that the sidewalk length, streetlights, traffic calming to reduce motor-vehicle traffic and other measures of connected street patterns correlate to increases in walking.7 A good walking environment can lead to a better sense of safety and greater trust of others. A recent study found police patrolling by foot improves officer-citizen relationships, as well as higher sense of safety in the community.
Research shows that living near parks and recreation facilities leads to higher levels of physical activity. People who live near parks and open spaces are more likely to be physically active than those that do not. In a California study, 78 percent of respondents achieved the recommended amount of physical activity when there was access to a neighborhood park or open space.8
6 Ross C.E., Mirowsky, J. (2008) Neighborhood Socioeconomics Status and Health: Context or Composition? City and Community(7), 163-179 7 Forsyth, A., Hearst, J., Oaks, M., Schmitz, K.H. (2008) Design and destinations: Factors Influencing walking and total physical activity. Journal of Urban Studies (45:9) 8 Wen, M., Kandula, N.R., Lauderdale, D.S. (2007) Walking for Transportation or Leisure: What Difference Does the Neighborhood Make? Journal of Gen. Internal Medicine (22:12),1674-1680
Figure 3: Examples of pedestrian traffic generators

MINNESOTA GO MINNESOTA WALKS: CURRENT & FUTURE STEPS TOWARDS A WALKABLE MINNESOTAPAGE 12
This page intentionally left blank
CHAPTER 3 WALKING SHOULD BE EASIER PAGE 13
WALKING SHOULD BE EASIEREnvironmental Factors – Built, Social, and Cultural – Affect Walking in Minnesota
Several factors affect how easy it is for people to walk in Minnesota, including what is socially or culturally normal, as well as how the environment is built. For example, many employers provide or pay for parking, which incentivizes driving. Social norms also support certain behaviors, like the fact that dog owners are more likely to walk and may encourage their neighbors to join them. People’s environments also influence how accessible and safe it is to walk. Communities that build roads without sidewalks may be communicating that people should not walk there. Across Minnesota, the environments we have created make it harder for some people to walk than others. It is important to recognize how the actions from our nation’s past have influenced how existing pedestrian environments were and continue to be altered, used and built.
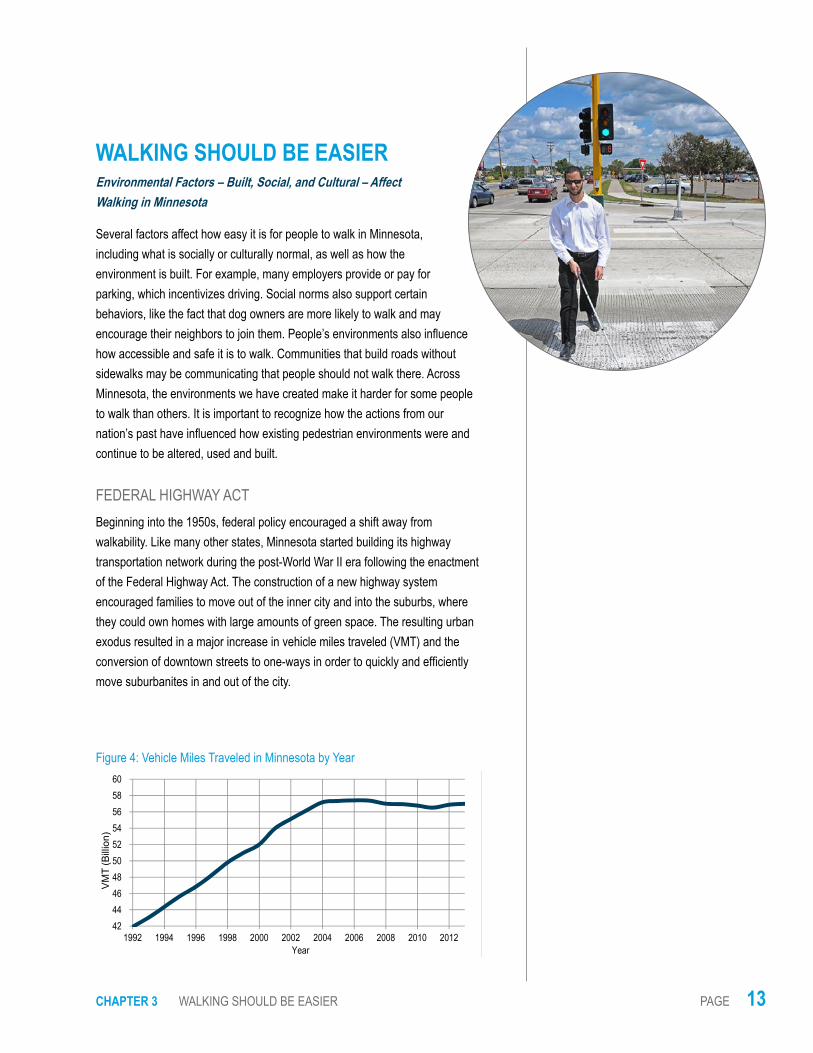
FEDERAL HIGHWAY ACTBeginning into the 1950s, federal policy encouraged a shift away from walkability. Like many other states, Minnesota started building its highway transportation network during the post-World War II era following the enactment of the Federal Highway Act. The construction of a new highway system encouraged families to move out of the inner city and into the suburbs, where they could own homes with large amounts of green space. The resulting urban exodus resulted in a major increase in vehicle miles traveled (VMT) and the conversion of downtown streets to one-ways in order to quickly and efficiently move suburbanites in and out of the city.
Figure 4: Vehicle Miles Traveled in Minnesota by Year
42444648505254565860
VM
T (B
illio
n)
Year1992 1994 1996 1998 2000 2002 2004 2006 2008 2010 2012

MINNESOTA GO MINNESOTA WALKS: CURRENT & FUTURE STEPS TOWARDS A WALKABLE MINNESOTAPAGE 14
Cars are still the most common mode of transportation, as 78.4 percent of Minnesota workers primarily commuted to work by car in 2013.1 Recently, however, things have started to change. Vehicle miles traveled in Minnesota has been virtually flat or declining since 2004 (see Figure 4), while public transit rides have increased from 82 million in 2003 to 106 million in 2013 for all of Minnesota.2
PEDESTRIAN SAFETYAnalyses of vehicle-pedestrian crashes have identified high-risk groups and conclusions about factors that lead to injuries and fatalities between vehicles and pedestrians. Nationally, pedestrian crashes accounted for 13 percent of fatal crashes between 2008 and 2012.3 During the same period in Minnesota, pedestrians accounted for approximately 9 percent of fatal crashes.
In 2013, there were 868 crashes in which at least one pedestrian was injured or killed by a motor vehicle in Minnesota. 35 pedestrians were killed in total. In addition, 867 pedestrians were injured.
Crash reporting may under-report pedestrian injuries. For example, an injury involving only a pedestrian or an injury involving a pedestrian and a bicycle would not be included in these figures. Any crash between a motor vehicle and a pedestrian that is not reported, even if it results in a trip to the hospital, is not reflected in the crash statistics.
Many factors impact pedestrian crashes, including vehicle speed. A pedestrian struck by a vehicle traveling 40 mph has an 85 percent chance of being killed while a pedestrian struck by a vehicle traveling at 20 mph has only a 5 percent chance of being killed. This information is shown in Figure 5. In Minnesota during 2013, more than half of the tested pedestrians involved in crashes with motor vehicles had alcohol in their system. Approximately half of severe or fatal pedestrian crashes in Minnesota are caused by the motorist and the other half is caused by the pedestrian.
1 ACS 1 year commute to work numbers in MN, 20132 Office of Transit, MnDOT3 National Highway Traffic Safety Administration (2014). Traffic Safety Facts 2012 Data. U.S. Department of Transportation HS 811 888. (April 2014)
Pedestrian Safety Statistics• 78 percent of severe crashes
occurred in urban areas• 74 percent of severe pedestrian
crashes occur on the local roadway system
• 51 percent of crashes occurred at intersections
• Of the intersection-related crashes, 53 percent occurred at a traffic signal and 28 percent at a stop sign
• 65 percent of severe crashes occurred on low-speed urban roads (40 mph or less)
• 61 percent of severe pedestrian crashes involved male pedestrians
• Pedestrians between the ages of 15 and 20, along with those older than 65 represented 30 percent of severe crashes
• Males in their early 20s are the highest represented demographic
• Severe crashes involving pedestrians took place year-round and at all times of day
• 52 percent of severe pedestrian crashes occurred under dark conditions, compared to 33 percent of all types of severe crashes
• 8 percent of severe pedestrian crashes occurred under rainy weather conditions compared to 5 percent for all types of severe crashes.
Figure 5: Percentage chance of pedestrian fatality in pedestrian-vehicle crashes
0
20
40
60
80
100
40 MPH20 MPH

CHAPTER 3 WALKING SHOULD BE EASIER PAGE 15
COMMUNITY LIVABILITY AND URBANIZATIONMarket demands from millennials and baby boomers are helping usher in active-living urban development. When destinations are within one mile, 40 percent of people walk to work, school, shopping and other destinations. Forty-four percent of U.S. adults say they walk to a destination daily or weekly.4 Millennials strongly prefer more compact, walkable, mixed-use and mixed-income communities. They want easy access to parks and open space.
Overwhelmingly, baby boomers and older people want to age in place with housing and communities that can meet their needs as they grow older. And across the generations, demand is strong for communities with transit and other elements that support active living. Successful communities require both physical and social connections. This includes multiple transportation options, safe and affordable healthy food, access to health care, jobs, education, and training. Walking is one way to provide access to these services, which provides opportunities for people to proposer socially and culturally.
More people are moving to urban areas as population growth rates have come together over the last decade (Figure 6). For example, 19 percent of the Minnesota population live in rural settings; 15 percent in small towns and cities; and more than 65 percent in urban areas (>20,000 population) as shown in Figure 7 compared to 62 percent in 1990.
The number of Minnesotans who are 65 and older are expected to double from 12 percent to 24 percent between 2000 and 2030. From 1970 to 2030, the 65- and- older- group is projected to increase by 220 percent, which is a general increase in population of 63 percent (Figures 8 & 9).
4 Earth Policy Institute; University Transportation Research Center; Urban Land Institute

MINNESOTA GO MINNESOTA WALKS: CURRENT & FUTURE STEPS TOWARDS A WALKABLE MINNESOTAPAGE 16
Figure 7: Population growth rates have converged over the last decade
Figure 6: Population growth by county, 1992-2013
Percent Population Growth1992 - 2013
Declining Population Growth
0 - 10% Increase
10 - 20% Increase
20 - 30% Increase
30 - 40% Increase
Over 40% Increase

CHAPTER 3 WALKING SHOULD BE EASIER PAGE 17
Figure 8: 2009-2013 5-year ACS total population by county
0 - 30,00030,001 - 100,000
100,001 - 250,000250,001 - 500,000
500,000 and Above
2009-2013 5-Year ACSTotal Population by County
Figure 9: 2009-2013 5-year ACS total population percent age 65 and over by county
< 10
10 - 15
15 -2020 - 25
25 <
2009-2013 5-Year ACSTotal Population %
65 and OverBy County

MINNESOTA GO MINNESOTA WALKS: CURRENT & FUTURE STEPS TOWARDS A WALKABLE MINNESOTAPAGE 18
This page intentionally left blank

CHAPTER 4 IT’S HARDER FOR SOME PEOPLE TO WALK PAGE 19
IT’S HARDER FOR SOME PEOPLE TO WALKSome Populations Have Less Access and Fewer Opportunities to Safely Walk
NOT EVERYONE HAS EQUAL ACCESS TO SAFE PLACES TO WALKWalking can be an accessible and affordable option for those who do not or cannot drive. Yet not everyone has the opportunity or suitable environment for walking. Nearly half of Minnesota adults do not meet physical activity recommendations.1 The prevalence of inactivity is highest in rural areas, among people of color, older adults, persons with disabilities, those with less education, women and lower-income groups. Populations less likely to meet physical activity recommendations are at greater risk for other health conditions and experience greater health disparities. Therefore, it is important to prioritize strategies that lead to improved walkability in areas with a high concentration of these populations, in both urban and rural areas.
SOCIAL AND ECONOMIC FACTORSPeople may walk to stay active and healthy and others because it is a primary mode of transportation. Households with limited income may not have access to a vehicle, which can affect school attendance, educational fulfillment and employment opportunities.2 Conversely, a growing number of households are choosing not to own a car. Households without a vehicle tend to be located in the Twin Cities metropolitan area, in communities with a high college/university student population and/or in low-income communities. In Minnesota, about 8 percent of the people who commute to work reported using, transit, walking and other means, according to the 2013 American Community Survey compared to 5 percent nationally.
1 2013 Physical Activity Prevalence and Trends Data. Center for Disease Control Behavioral Risk Factor Surveillance System2 Besser, L.M., Dannenberg, A.L. (2005) Walking to public transit: steps to help meet physical activity recommendations. American Journal of Preventive Medicine 29 (4), 273-280

MINNESOTA GO MINNESOTA WALKS: CURRENT & FUTURE STEPS TOWARDS A WALKABLE MINNESOTAPAGE 20
DEMOGRAPHIC SHIFTSMinnesota has, and will continue to experience significant demographic shifts. According to projections, Minnesota’s population will exceed 6 million by 2035. Populations will increase most in urban areas around the Twin Cities, but decline in northeastern Minnesota. The state’s age 65 and older population will double between 2010 and 2035, at which time Minnesota will have about 1.37 million older adults. The under 18 population will grow more modestly, from 1.28 million in 2010 to 1.35 million by 2035. The percentage of Minnesota’s population that is nonwhite or Latino is projected to rise from 14 percent in 2005 to 25 percent in 2035.
Demographic trends are relevant to a statewide pedestrian system plan because they identify potential priority areas. For example, older adults often find it more difficult to be physically active. Populations of color are also less likely to be regularly physically active and more likely to have lower household incomes, which may limit transportation options. The changing population of Minnesota is an important factor to consider when developing goals and strategies for a more walkable Minnesota.
HIGH IMPACT POPULATIONS Certain sectors of the population are more likely to rely on pedestrian infrastructure: children, older adults, individuals with disabilities and households with limited incomes or no access to a vehicle. The following populations are identified as possible priorities for pedestrian-level improvements throughout Minnesota:
• Small Rural Core Communities
• American Indian Populations
• Low-Income Urban Populations
• Older Adults
• Persons with Disabilities
• Children and Youth

CHAPTER 4 IT’S HARDER FOR SOME PEOPLE TO WALK PAGE 21
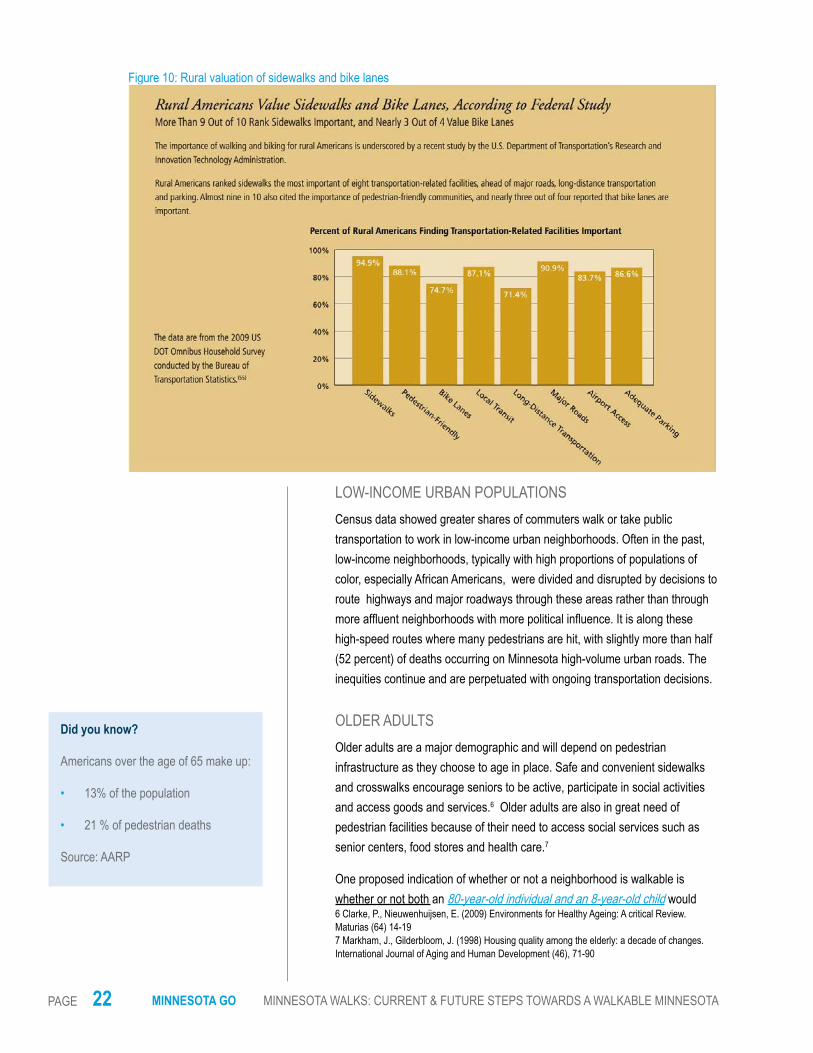
SMALL RURAL CORE COMMUNITIESIn Greater Minnesota, housing costs and incomes are generally lower than in the Twin Cities Metropolitan Area. Many rural communities were developed and built on a street grid system, but current land use policies may locate major destinations, such as grocery stores, on the edge of town without consideration of how people might walk there. Yet lower-income populations and some older adults living in rural areas may depend on walking to get around. There is often a misconception that walking primarily occurs in urban areas, but, as many studies show, rural Americans value sidewalks more than any other transportation-related facility3 (see Figure 10). Rural Americans walk at a 58-80 percent higher rate than urban Americans do.4 People in rural communities need walking facilities just as much, if not more than those in cities, because small towns lack bicycling and walking facilities, have worse health, fitness, and obesity outcomes, fewer transportation options than urban areas (buses, taxis, etc.) and state roads with higher speeds and fewer pedestrian accommodations are often the main street. Federal standards and guidelines provide funding for highways through towns, but do not require proper pedestrian accommodations.
AMERICAN INDIAN POPULATIONSAmerican Indians are at a greater risk of being injured or killed in a motor vehicle crash5 in Minnesota and it is likely that there are several reasons for this. Disparities exist on numerous social measures. Diabetes and resulting health problems disproportionately affect Native Americans. Unemployment rates among the American Indian populations are also higher than other areas statewide. According to the National Indian Child Welfare Association (NICWA), the American Indian and Alaska Native population is young, with 33.6 percent under the age of 18, compared with 24 percent of the total population. Two of the biggest risk areas for American Indian youth are mental health and physical health (diabetes, obesity, etc.) Although walkability may not be the sole solution, physical inactivity is a major concern. The lack of pedestrian accommodations, such as the availability of sidewalks and crossings, is a significant issue for walkability and safety, especially since a large proportion of tribal lands are located on or near a state trunk highway.
3 U.S. DOT Research and Innovation Technology Administration 4 Puncher, J., Renne, J. Urban-Rural Difference in Mobility and Mode Choice: Evidence From the 2001 NHTS.. 2005, Transportation, (32)165-1865 Minnesota Department of Health, Center for Health Statistic
Tribal Nations in Minnesota
Minnesota is home to 11 Tribal Nations.
Seven Anishinaabe (Chippewa, Ojibwe) Reservations:• Grand Portage• Bois Forte• Red Lake• White Earth• Leech Lake• Fond du Lac• Mille Lacs
Four Dakota (Sioux) Reservations:
• Shakopee Mdewakanton• Prairie Island• Lower Sioux• Upper Sioux
The Ho-Chunk nation also owns lands in Minnesota.
MINNESOTA GO MINNESOTA WALKS: CURRENT & FUTURE STEPS TOWARDS A WALKABLE MINNESOTAPAGE 22
LOW-INCOME URBAN POPULATIONSCensus data showed greater shares of commuters walk or take public transportation to work in low-income urban neighborhoods. Often in the past, low-income neighborhoods, typically with high proportions of populations of color, especially African Americans, were divided and disrupted by decisions to route highways and major roadways through these areas rather than through more affluent neighborhoods with more political influence. It is along these high-speed routes where many pedestrians are hit, with slightly more than half (52 percent) of deaths occurring on Minnesota high-volume urban roads. The inequities continue and are perpetuated with ongoing transportation decisions.
OLDER ADULTSOlder adults are a major demographic and will depend on pedestrian infrastructure as they choose to age in place. Safe and convenient sidewalks and crosswalks encourage seniors to be active, participate in social activities and access goods and services.6 Older adults are also in great need of pedestrian facilities because of their need to access social services such as senior centers, food stores and health care.7
One proposed indication of whether or not a neighborhood is walkable is whether or not both an 80-year-old individual and an 8-year-old child would 6 Clarke, P., Nieuwenhuijsen, E. (2009) Environments for Healthy Ageing: A critical Review. Maturias (64) 14-197 Markham, J., Gilderbloom, J. (1998) Housing quality among the elderly: a decade of changes. International Journal of Aging and Human Development (46), 71-90
Did you know?
Americans over the age of 65 make up:
• 13% of the population
• 21 % of pedestrian deaths
Source: AARP
Figure 10: Rural valuation of sidewalks and bike lanes
CHAPTER 4 IT’S HARDER FOR SOME PEOPLE TO WALK PAGE 23
feel comfortable walking on their own. Many young and old people today do not live independent lives, due to their inability to drive. This has become a major theme for AARP , which partnered with the Walkable and Livable Communities Institute (WALC) to create a series of 11 Livability Fact Sheets showing how to make communities safer and more comfortable for people of all ages. Older adults suffer disproportionately from pedestrian deaths nationally. People 65 and older make up 13 percent of the population but account for a disproportionate number of pedestrian deaths (20 percent in 2012), and sustain more severe injuries in nonfatal accidents.8 While comprising 12.4 percent of Minnesota’s population, adults aged 65 and older account for 25.7 percent of pedestrian fatalities across the state from 2003 – 2010. People 75 years and older account for 6.2 percent of Minnesota’s population, and 17.5 percent of pedestrian fatalities.
PERSONS WITH DISABILITIESSidewalks and American with Disabilities Act-compliant infrastructure help ensure that all people can navigate the system safely and maintain a healthy and active lifestyle. According to Healthy People 2010, about 20 percent of the Minnesota population has a disability and only 42 percent of adults with disabilities engage in leisure-time physical activity.9 Pedestrian facilities significantly affect the way that individuals with disabilities navigate the system. In a sample of disabled adults, 60 percent reported that lack of sidewalks influenced their daily activity.10
Criteria set forth for the construction and maintenance of pedestrian infrastructure follows the American with Disabilities Act. MnDOT maintains a database of MnDOT-owned pedestrian infrastructure and uses this data to identify locations that need maintenance or areas for new investments. The pedestrian plan will look beyond ADA compliance to identify critical connections and pedestrian elements.
8 Brody, J. “Keeping Older Pedestrians Safe”. New York Times: Well January 5, 2015 9 Christensen, K. M., Holt, J. M., Wilson, J. F. (2010) Facilities on Physical Activity of Adults With and Without Disabilities. Preventing Chronic Disease 7(5) 10 Christensen, K.M.,et al (2010) Facilities on Physical Activity of Adults With and Without Disabilities. Preventing Chronic Disease. 7(5)

MINNESOTA GO MINNESOTA WALKS: CURRENT & FUTURE STEPS TOWARDS A WALKABLE MINNESOTAPAGE 24
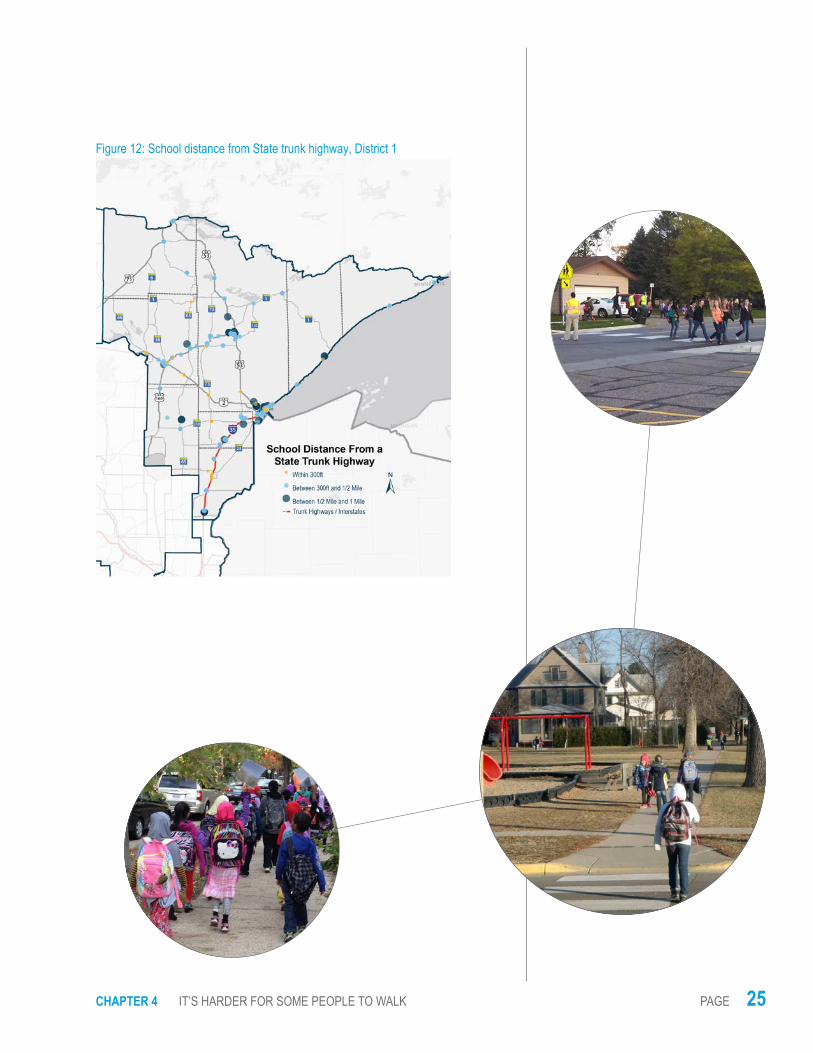
CHILDREN AND YOUTHThe trip to school has been identified as a significant source of physical activity for children and youth and contributes to the recommended daily amount of physical activity. According to multiple studies, there is an association between activity level and improved academic performance, specifically math and English.11 12 13 The Safe Routes to School (SRTS) program highlights the need for pedestrian facilities and programs to support children’s travel to schools and community destinations see Figure 11 and Figure 12 for maps of SRTS in Minnesota). SRTS focuses on the 5E’s of bicycle and pedestrian planning - education, encouragement, enforcement, engineering, and evaluation. Infrastructure and safe walking routes around schools, in addition to programs that encourage and support walking and biking to school, increase the number of students in the U.S. that are walking and biking to school. A recent study looking at more than 800 SRTS schools found a 31 percent increase in the number of students walking and bicycling to school.14
11 Taras, H. (2005). Physical Active and Student Performance at School. Journal of School Health (75:6)12 Dexter, T. (1999). Relationship between sport knowledge, sport performance and academic ability; empirical evidence for GCSE Physical Education. Journal of Sport Science (17), 283-295.13 Chromitz, V.R., Slining, M.M. (2009) Is There a Relationship Between Physical Fitness and Academic Achievement? Positive Results From Public School Children in the Northeastern United States. Journal of School Health 79(1)14 McDonald, N., et al., (2014) Impact of the Safe Routes to School Program on Walking and Bicycling. Journal of the American Planning Association 80(2)
Figure 11: School distance from State trunk highway, statewide
CHAPTER 4 IT’S HARDER FOR SOME PEOPLE TO WALK PAGE 25
Figure 12: School distance from State trunk highway, District 1

MINNESOTA GO MINNESOTA WALKS: CURRENT & FUTURE STEPS TOWARDS A WALKABLE MINNESOTAPAGE 26
This page intentionally left blank
CHAPTER 5 MINNESOTA IS ON TRACK TO IMPROVE WALKING PAGE 27
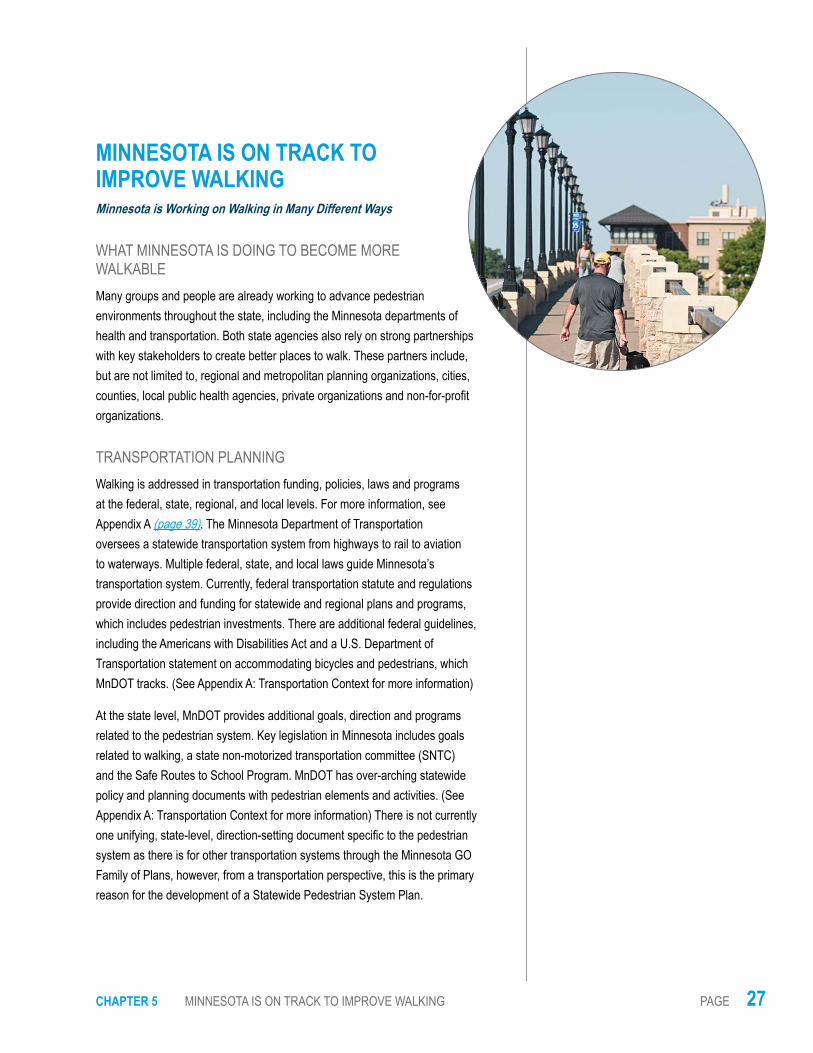
MINNESOTA IS ON TRACK TO IMPROVE WALKINGMinnesota is Working on Walking in Many Different Ways
WHAT MINNESOTA IS DOING TO BECOME MORE WALKABLEMany groups and people are already working to advance pedestrian environments throughout the state, including the Minnesota departments of health and transportation. Both state agencies also rely on strong partnerships with key stakeholders to create better places to walk. These partners include, but are not limited to, regional and metropolitan planning organizations, cities, counties, local public health agencies, private organizations and non-for-profit organizations.
TRANSPORTATION PLANNINGWalking is addressed in transportation funding, policies, laws and programs at the federal, state, regional, and local levels. For more information, see Appendix A (page 39). The Minnesota Department of Transportation oversees a statewide transportation system from highways to rail to aviation to waterways. Multiple federal, state, and local laws guide Minnesota’s transportation system. Currently, federal transportation statute and regulations provide direction and funding for statewide and regional plans and programs, which includes pedestrian investments. There are additional federal guidelines, including the Americans with Disabilities Act and a U.S. Department of Transportation statement on accommodating bicycles and pedestrians, which MnDOT tracks. (See Appendix A: Transportation Context for more information)
At the state level, MnDOT provides additional goals, direction and programs related to the pedestrian system. Key legislation in Minnesota includes goals related to walking, a state non-motorized transportation committee (SNTC) and the Safe Routes to School Program. MnDOT has over-arching statewide policy and planning documents with pedestrian elements and activities. (See Appendix A: Transportation Context for more information) There is not currently one unifying, state-level, direction-setting document specific to the pedestrian system as there is for other transportation systems through the Minnesota GO Family of Plans, however, from a transportation perspective, this is the primary reason for the development of a Statewide Pedestrian System Plan.

MINNESOTA GO MINNESOTA WALKS: CURRENT & FUTURE STEPS TOWARDS A WALKABLE MINNESOTAPAGE 28
MULTI-MODAL TOOLSExamples of policies and programs that enhance pedestrian planning include complete streets and Safe Routes to School.
Complete Streets
“Complete streets” is an approach to transportation planning and design that considers the needs of all transportation users. Planning facilities with a complete streets approach balances the needs of different user groups and ensures all users are served by the completed project. Considering pedestrian needs as part of the planning process presents an opportunity to embed pedestrian improvements in the project from the beginning (preventing costly adaptations in the future), establishing equitable access for all users and encouraging transportation options within communities.
Main Streets
In many urban areas, a highway serves as the “main street” within the community. Projects on these roadways present both challenges and opportunities in terms of pedestrian investment. Main Street construction projects typically have high costs due to utility work and potential business disruption. These challenges often discourage timely reconstruction. However, these projects also present the opportunity to deliver significant pedestrian benefits because of their proximity to business and population centers. Strong pedestrian planning in Main Street projects improves access, mode choice, and can breathe new life into corridors. Additionally, the opportunity to work with businesses and other local stakeholders is an important benefit, and the good that can come from this type of cooperation should not be underestimated.
Safe Routes to School
In 2005, the federal transportation bill SAFETEA-LU created a Safe Routes to School (SRTS) program with dedicated funding in every state. The funding was to be used to support walking and biking in K-8 schools through infrastructure grants, as well as education and encouragement programs. National program goals included increasing safety and access to schools, increasing physical activity in youth and reducing congestion around schools. In 2012, MAP-21 rolled Safe Routes to School into the Transportation Alternatives Program along with other non-motorized funding programs.
SRTS plans are comprehensive school travel plans created for schools with community input and context to evaluate existing conditions and make an action plan for future work. Some plans focus on one school site, while others focus on a school district or multiple schools. Safe Routes to School plans cover all 5E’s- education, encouragement, evaluation, enforcement and engineering.
CHAPTER 5 MINNESOTA IS ON TRACK TO IMPROVE WALKING PAGE 29
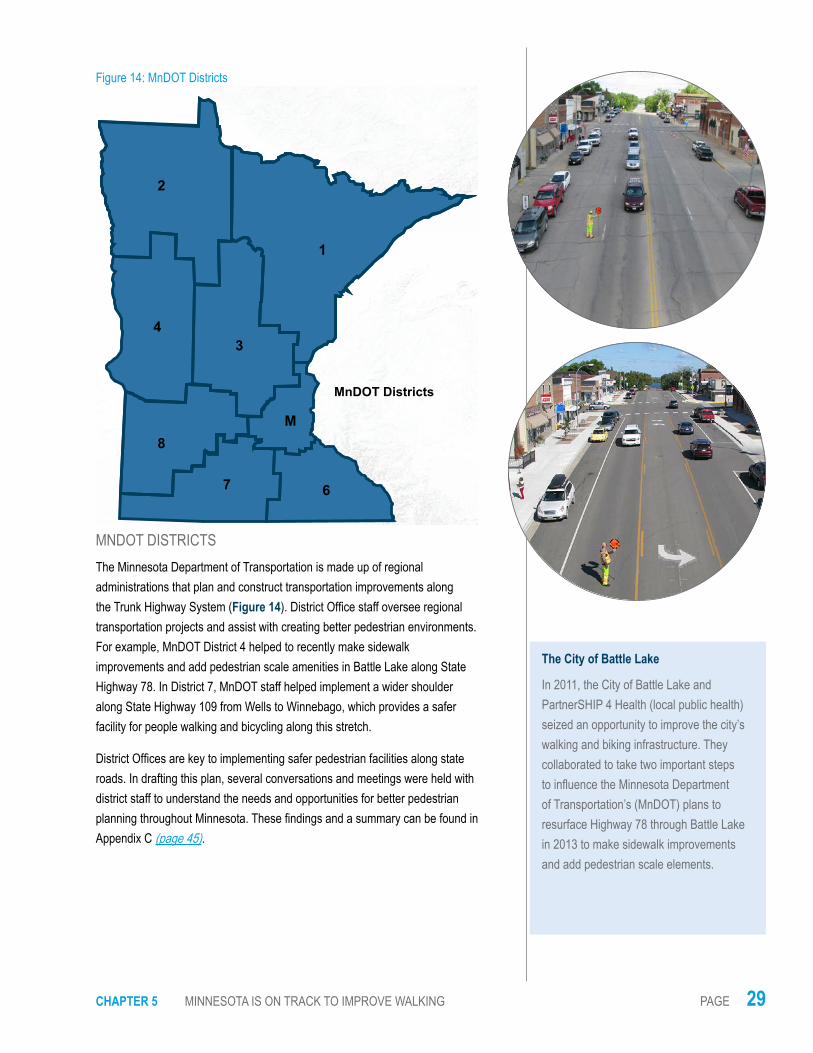
MNDOT DISTRICTS The Minnesota Department of Transportation is made up of regional administrations that plan and construct transportation improvements along the Trunk Highway System (Figure 14). District Office staff oversee regional transportation projects and assist with creating better pedestrian environments. For example, MnDOT District 4 helped to recently make sidewalk improvements and add pedestrian scale amenities in Battle Lake along State Highway 78. In District 7, MnDOT staff helped implement a wider shoulder along State Highway 109 from Wells to Winnebago, which provides a safer facility for people walking and bicycling along this stretch.
District Offices are key to implementing safer pedestrian facilities along state roads. In drafting this plan, several conversations and meetings were held with district staff to understand the needs and opportunities for better pedestrian planning throughout Minnesota. These findings and a summary can be found in Appendix C (page 45).
Figure 14: MnDOT Districts
1
2
43
M
67
8
MnDOT Districts
The City of Battle Lake
In 2011, the City of Battle Lake and PartnerSHIP 4 Health (local public health) seized an opportunity to improve the city’s walking and biking infrastructure. They collaborated to take two important steps to influence the Minnesota Department of Transportation’s (MnDOT) plans to resurface Highway 78 through Battle Lake in 2013 to make sidewalk improvements and add pedestrian scale elements.
MINNESOTA GO MINNESOTA WALKS: CURRENT & FUTURE STEPS TOWARDS A WALKABLE MINNESOTAPAGE 30
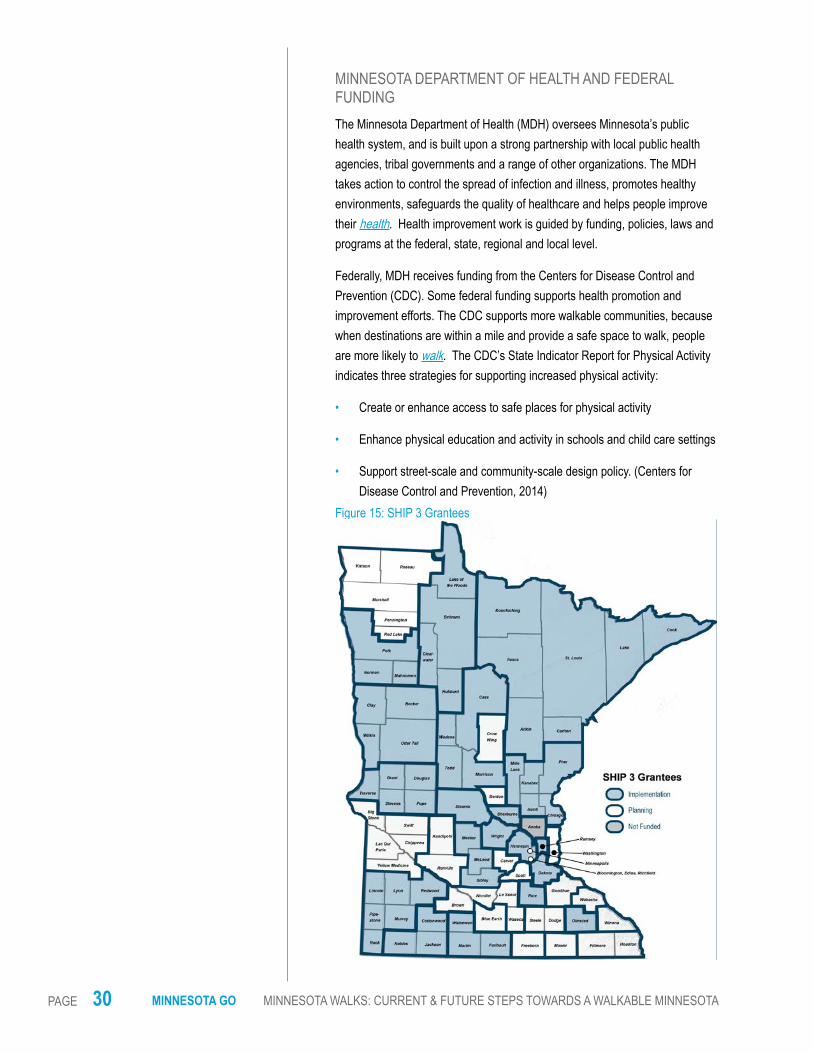
MINNESOTA DEPARTMENT OF HEALTH AND FEDERAL FUNDINGThe Minnesota Department of Health (MDH) oversees Minnesota’s public health system, and is built upon a strong partnership with local public health agencies, tribal governments and a range of other organizations. The MDH takes action to control the spread of infection and illness, promotes healthy environments, safeguards the quality of healthcare and helps people improve their health. Health improvement work is guided by funding, policies, laws and programs at the federal, state, regional and local level.
Federally, MDH receives funding from the Centers for Disease Control and Prevention (CDC). Some federal funding supports health promotion and improvement efforts. The CDC supports more walkable communities, because when destinations are within a mile and provide a safe space to walk, people are more likely to walk. The CDC’s State Indicator Report for Physical Activity indicates three strategies for supporting increased physical activity:
• Create or enhance access to safe places for physical activity
• Enhance physical education and activity in schools and child care settings
• Support street-scale and community-scale design policy. (Centers for Disease Control and Prevention, 2014)
Figure 15: SHIP 3 Grantees

CHAPTER 5 MINNESOTA IS ON TRACK TO IMPROVE WALKING PAGE 31
The Minnesota Department of Health encourages Local Public Health agencies and partners to advance similar health improvement strategies through the Statewide Health Improvement Program (SHIP) (see Figure 15). Local public health officials are working on the following strategies to increase opportunities for physical activity:
• Active Living. Increase opportunities for walking and bicycling through Active Living policies and practices in community design, land use, site planning and facility access.
• Active Schools. Increase opportunities for physical activity throughout the school day, including active transportation to and from school (Safe Routes to School), quality physical education, active classrooms, active recess and active before/after school day options.
• Worksite Wellness. Engage business partners to build wellness infrastructure for healthy eating, physical activity, tobacco use and exposure and breast-feeding support. Specifically, for physical activity, increase access to facilities, active transportation and opportunities for physical activity.
Health Improvement strategies supported by the Minnesota Department of Health are evidence-based and scientifically-supported.
OTHER STATE PARTNERSOther state agencies also have goals for pedestrian environments in communities throughout Minnesota. Currently, MnDOT and MDH have partnerships with the Minnesota departments of Commerce, Education, Employment and Economic Development, Human Services, Natural Resources, and Public Safety, Minnesota Pollution Control Agency and Explore Minnesota Tourism. Beyond state agencies, there are regional and local partners critical to creating better places for walking.

MINNESOTA GO MINNESOTA WALKS: CURRENT & FUTURE STEPS TOWARDS A WALKABLE MINNESOTAPAGE 32
LOCAL PARTNERS
Regional Development Organizations
Minnesota’s nine Regional Development Organizations (RDOs) are key partners in statewide transportation planning and programming (Figure 16). Each RDO works on a variety of planning and programming activities with their local MnDOT District and Area Transportation Partnership (ATP). These activities consist of providing technical assistance to local communities for transportation planning and program development, ATP coordination, implementation of the Transportation Alternatives Program (TAP) solicitation and providing a regional voice in statewide planning activities. Individual RDOs also contract with MnDOT for specific services such as Safe Routes to School and Scenic Byway planning. MnDOT contracts with RDOs for trunk highway planning and coordination planning.
Figure 16: Regional Development Organizations
CHAPTER 5 MINNESOTA IS ON TRACK TO IMPROVE WALKING PAGE 33
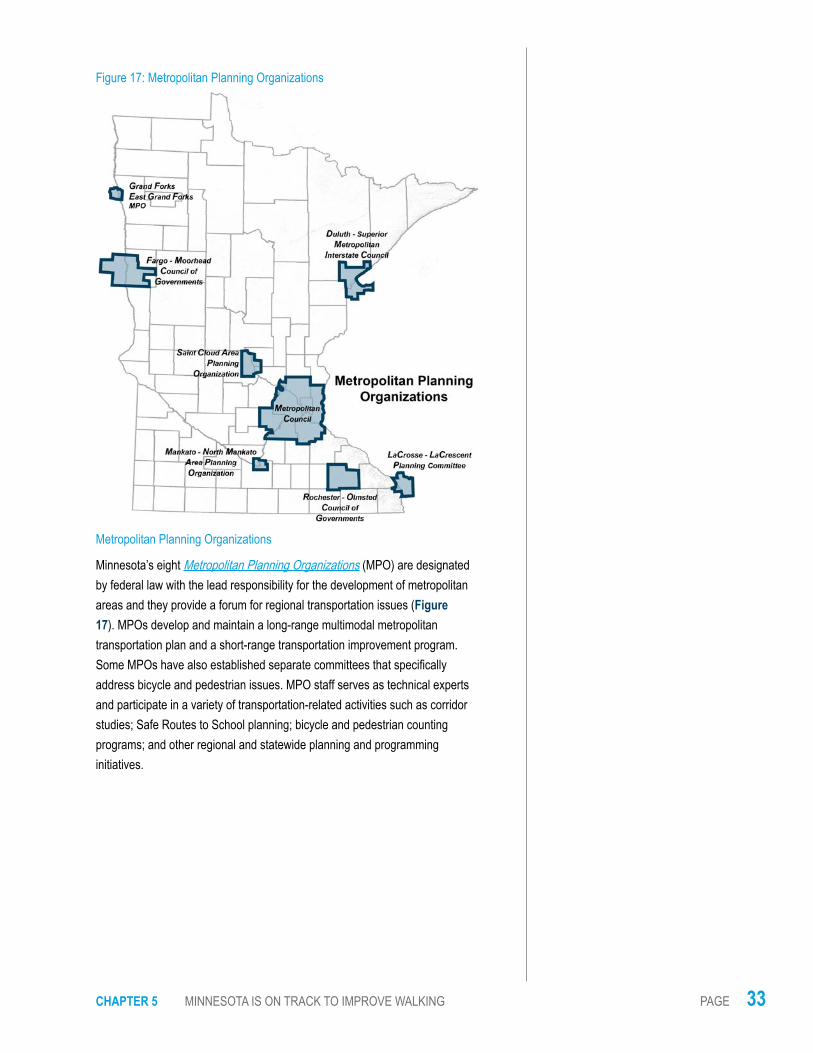
Metropolitan Planning Organizations
Minnesota’s eight Metropolitan Planning Organizations (MPO) are designated by federal law with the lead responsibility for the development of metropolitan areas and they provide a forum for regional transportation issues (Figure 17). MPOs develop and maintain a long-range multimodal metropolitan transportation plan and a short-range transportation improvement program. Some MPOs have also established separate committees that specifically address bicycle and pedestrian issues. MPO staff serves as technical experts and participate in a variety of transportation-related activities such as corridor studies; Safe Routes to School planning; bicycle and pedestrian counting programs; and other regional and statewide planning and programming initiatives.
Figure 17: Metropolitan Planning Organizations
MINNESOTA GO MINNESOTA WALKS: CURRENT & FUTURE STEPS TOWARDS A WALKABLE MINNESOTAPAGE 34
Counties and Municipalities
Minnesota has 87 counties and 854 municipalities that provide governance and oversight to various aspects of transportation planning and implementation. Pedestrian environments are often quite local in nature, and, therefore, county boards and city councils can provide strong leadership in supporting pedestrian environments. Counties and cities throughout Minnesota have recognized the importance of creating more walkable places. For example, Hennepin County has a plan to increase walking and pedestrian safety throughout the county roadway system. The City of Big Lake passed a complete streets policy in 2010 to create transportation corridors that are safe, functional and aesthetically attractive. The City of Northfield established a complete streets policy that recognizes that walkable neighborhoods lead more interactions, increased community pride and improved quality of life. Cities and counties play a critical role in creating more walkable environments throughout Minnesota, and will continue to play a part with a Pedestrian Plan.
The previously mentioned provide a brief overview of some of the needed partners to create a better walking environment in Minnesota. There are additional partners and stakeholders, who will be invited to participate in and help guide recommendations and strategies identified in the Statewide Pedestrian Plan.
MINNESOTA IS MOVING FORWARD TO CREATE A BETTER WALKING ENVIRONMENTImproving walking safety and conditions is no longer a large role of transportation planners and decision-makers. Public health professionals, public officials, urban planners, architects, landscape architects, builders, real estate developers, residents and others all have a role to play. Therefore, it is important to have a collaborative approach to creating a pedestrian system plan that partners and stakeholders see themselves in and are willing to help implement. With the Minnesota departments of Health and Transportation jointly leading this planning effort, it will ensure a diversity of disciplines and voices. Increasing the number of stakeholders involved in the creation of the plan will help address needs of all pedestrian users – young, old, able-bodied, people with limited abilities, people with limited transportation options, etc.
Each agency brings strengths to advancing the pedestrian planning process.
CHAPTER 5 MINNESOTA IS ON TRACK TO IMPROVE WALKING PAGE 35
The Minnesota Department of Health is able to advance its mission: Protecting, maintaining and improving the health of all Minnesotans. The MDH’s overarching goals include:
• Attain high quality, longer lives free of preventable disease, disability, injury, and premature death
• Achieve health equity, eliminate disparities, and improve the health of all groups
• Create social and physical environments that promote health for all
• Promote quality of life, healthy development and healthy behaviors across all life stages
Addressing health through transportation can help address the above goals. Many of MDH’s local partners are working on health improvement efforts for a built environment that supports safe and healthy living for all. These local public health partners know where inequities exist in their local transportation systems and have ideas for making them safer. Further, MDH can provide data and relevant information to assist in prioritizing transportation and pedestrian decisions. Local communities have some capacity to collect information. MDH has been a strong partner in engaging local communities to participate in bicycle and pedestrian counts throughout the state. The agency has the ability to help facilitate and convene input around what people in Minnesota would like to see in an improved pedestrian environment, and help process the information.
The Minnesota Department of Transportation is able to support the Minnesota GO Vision for a multimodal transportation system that maximizes the health of people, the environment, and economy. MnDOT recognizes challenges and opportunities in realizing this vision, which identifies health impacts as something to consider in planning efforts. Through Minnesota GO, MnDOT identified and pursued modal-specific system plans; developing a Statewide Pedestrian Plan is part of this process. MnDOT recognizes that pedestrian planning and activities are often local in nature and have direct health benefits. As such, MnDOT recognizes the importance of partnering with others in creating the plan.
WALKABLE COMMUNITY WORKSHOPSWalkable Community Workshops are a strategy used by MDH throughout Minnesota for more than a decade. Workshops are typically formatted to first provide an overview of numerous benefits of walkable communities to community officials, health experts, developers, business owners and stakeholders, followed by a walk audit and a workgroup session where attendees can develop immediate and long-range action plans and form multi-
MINNESOTA GO MINNESOTA WALKS: CURRENT & FUTURE STEPS TOWARDS A WALKABLE MINNESOTAPAGE 36
disciplinary partnerships within their community.
In the summer of 2014 MnDOT and MDH partnered to kick off the pedestrian planning process with two Walkable Community Workshops held in Greater Minnesota and a stakeholder visioning meeting. These activities helped shape input and identify opportunities for engagement and provided additional context for information and partners that should be included.
The workshops served two purposes:
• Provide an opportunity to engage a community around walkability.
• Help MnDOT and MDH to better understand the various levels and partners where pedestrian-related decisions are made.
One of the workshops was held in a small, rural municipality, Little Falls, Minn. and the other in a mid-sized municipality that is a regional center Mankato, Minn. Both workshops identified state policies and practices that affect how regional and local cities implement pedestrian infrastructure.
The workshops also demonstrated a need for engaging communities, and that the pedestrian system plan development has a role in that process.
VISIONING MEETING On August 13, 2014 a Statewide Pedestrian System Plan Vision meeting was held in St. Paul. The meeting’s purpose was to identify a collective vision for a pedestrian-friendly Minnesota and to identify related stakeholder goals. The 50 stakeholders present represented various agencies and organizations including MnDOT, MDH, American Association of Retired Persons, Blue Cross and Blue Shield of Minnesota, Explore Minnesota Tourism, Greater MN Metropolitan Planning Organization, Development, Federal Highway Administration, Law Enforcement, Local Public Health Association, Metropolitan Council, Minnesota Chapter of the American Planning Association, Minnesota Department of Education, Minnesota Department of Natural Resources, Minnesota Department of Public Safety – Office of Traffic Safety, MnDOT Americans with Disability Act staff, Minnesota Pollution Control Agency, Minnesota’s Aging Population, American Society of Landscape Architects MN, Ramsey County, Regional Development Commission, St. Paul Riverfront Corporation, St. Paul Walks with St. Paul Smart Trips, University of Minnesota, citizen representation from the State Non-motorized Transportation Committee, and local government. The following themes emerged when discussing the future vision of pedestrians in Minnesota and how the pedestrian plan can help in achieving that vision (Figure 18).
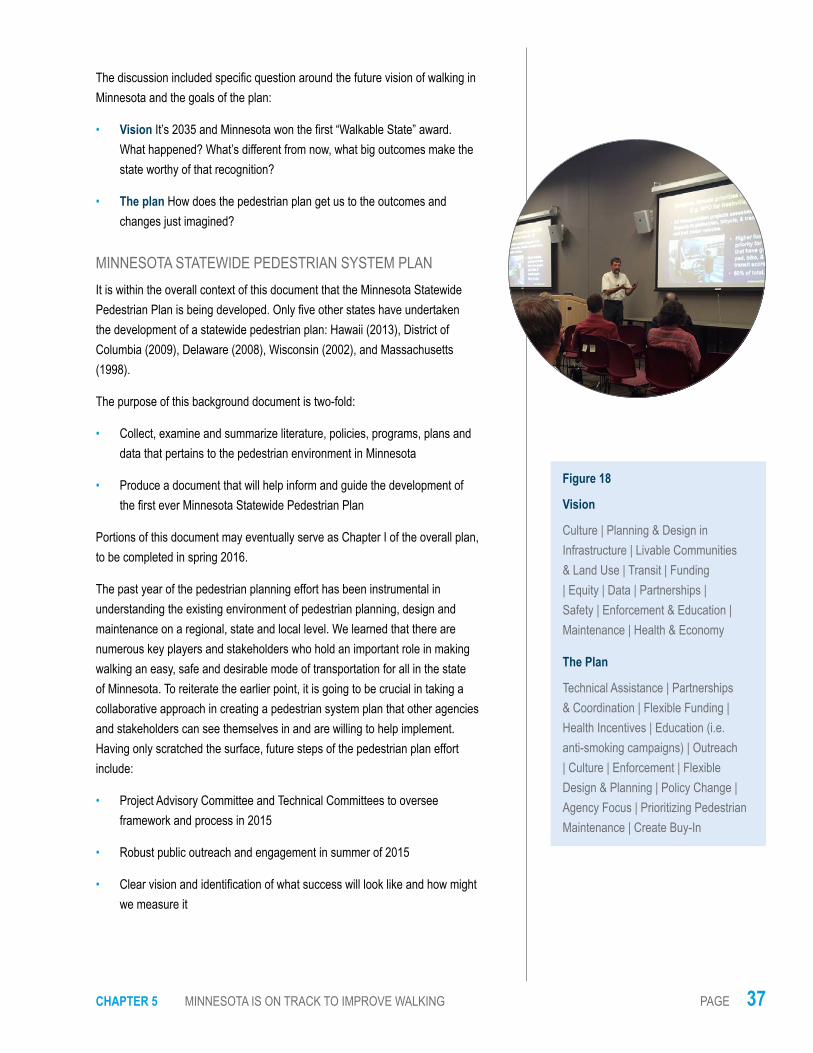
CHAPTER 5 MINNESOTA IS ON TRACK TO IMPROVE WALKING PAGE 37
The discussion included specific question around the future vision of walking in Minnesota and the goals of the plan:
• Vision It’s 2035 and Minnesota won the first “Walkable State” award. What happened? What’s different from now, what big outcomes make the state worthy of that recognition?
• The plan How does the pedestrian plan get us to the outcomes and changes just imagined?
MINNESOTA STATEWIDE PEDESTRIAN SYSTEM PLAN It is within the overall context of this document that the Minnesota Statewide Pedestrian Plan is being developed. Only five other states have undertaken the development of a statewide pedestrian plan: Hawaii (2013), District of Columbia (2009), Delaware (2008), Wisconsin (2002), and Massachusetts (1998).
The purpose of this background document is two-fold:
• Collect, examine and summarize literature, policies, programs, plans and data that pertains to the pedestrian environment in Minnesota
• Produce a document that will help inform and guide the development of the first ever Minnesota Statewide Pedestrian Plan
Portions of this document may eventually serve as Chapter I of the overall plan, to be completed in spring 2016.
The past year of the pedestrian planning effort has been instrumental in understanding the existing environment of pedestrian planning, design and maintenance on a regional, state and local level. We learned that there are numerous key players and stakeholders who hold an important role in making walking an easy, safe and desirable mode of transportation for all in the state of Minnesota. To reiterate the earlier point, it is going to be crucial in taking a collaborative approach in creating a pedestrian system plan that other agencies and stakeholders can see themselves in and are willing to help implement. Having only scratched the surface, future steps of the pedestrian plan effort include:
• Project Advisory Committee and Technical Committees to oversee framework and process in 2015
• Robust public outreach and engagement in summer of 2015
• Clear vision and identification of what success will look like and how might we measure it
Figure 18
Vision
Culture | Planning & Design in Infrastructure | Livable Communities & Land Use | Transit | Funding | Equity | Data | Partnerships | Safety | Enforcement & Education | Maintenance | Health & Economy
The Plan
Technical Assistance | Partnerships & Coordination | Flexible Funding | Health Incentives | Education (i.e. anti-smoking campaigns) | Outreach | Culture | Enforcement | Flexible Design & Planning | Policy Change | Agency Focus | Prioritizing Pedestrian Maintenance | Create Buy-In
MINNESOTA GO MINNESOTA WALKS: CURRENT & FUTURE STEPS TOWARDS A WALKABLE MINNESOTAPAGE 38
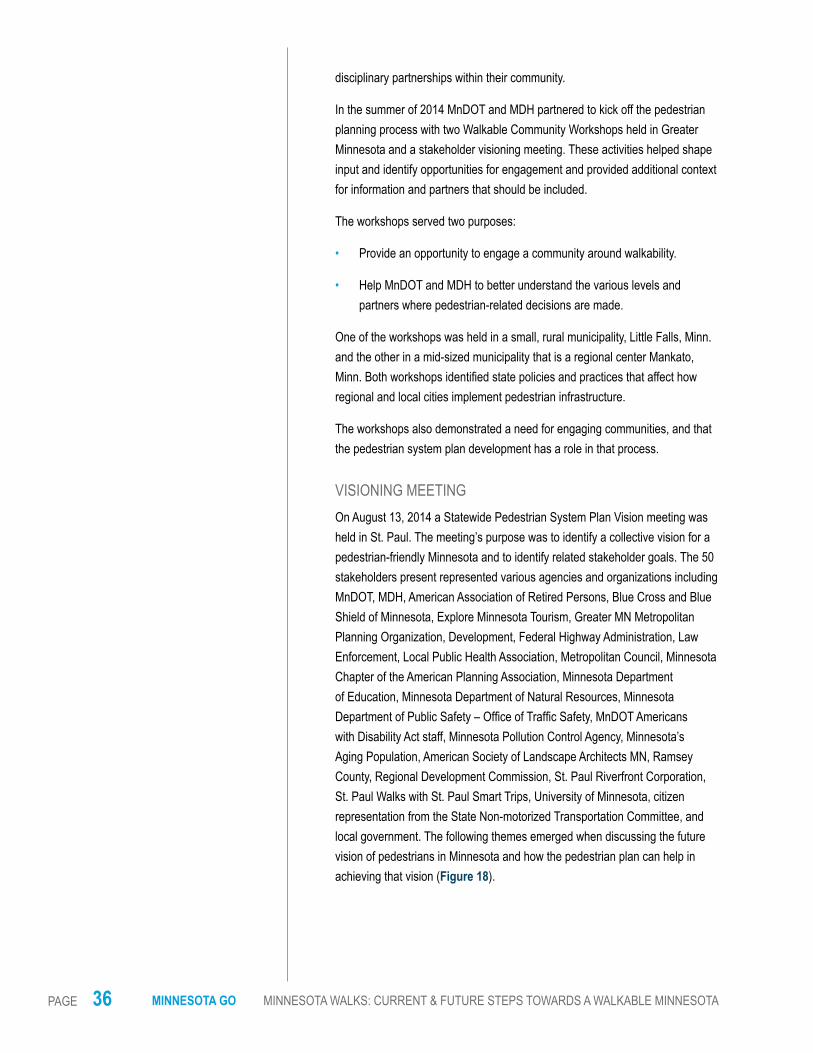
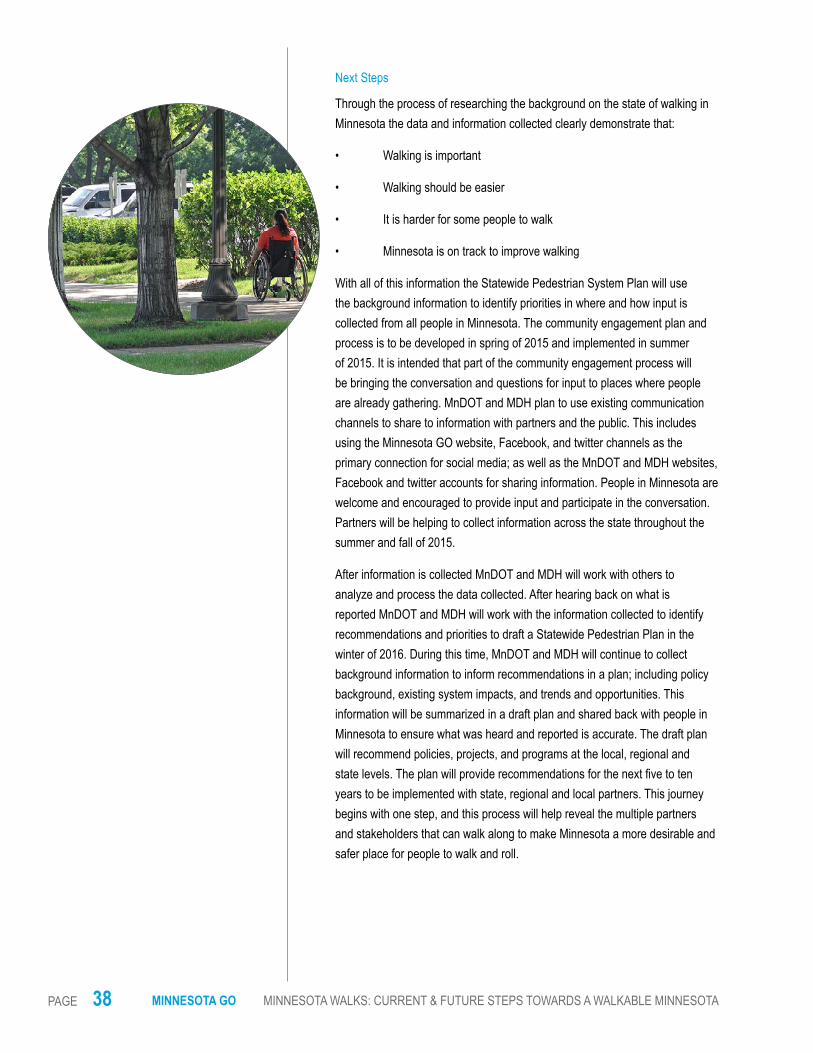
Next Steps
Through the process of researching the background on the state of walking in Minnesota the data and information collected clearly demonstrate that:
• Walking is important
• Walking should be easier
• It is harder for some people to walk
• Minnesota is on track to improve walking
With all of this information the Statewide Pedestrian System Plan will use the background information to identify priorities in where and how input is collected from all people in Minnesota. The community engagement plan and process is to be developed in spring of 2015 and implemented in summer of 2015. It is intended that part of the community engagement process will be bringing the conversation and questions for input to places where people are already gathering. MnDOT and MDH plan to use existing communication channels to share to information with partners and the public. This includes using the Minnesota GO website, Facebook, and twitter channels as the primary connection for social media; as well as the MnDOT and MDH websites, Facebook and twitter accounts for sharing information. People in Minnesota are welcome and encouraged to provide input and participate in the conversation. Partners will be helping to collect information across the state throughout the summer and fall of 2015.
After information is collected MnDOT and MDH will work with others to analyze and process the data collected. After hearing back on what is reported MnDOT and MDH will work with the information collected to identify recommendations and priorities to draft a Statewide Pedestrian Plan in the winter of 2016. During this time, MnDOT and MDH will continue to collect background information to inform recommendations in a plan; including policy background, existing system impacts, and trends and opportunities. This information will be summarized in a draft plan and shared back with people in Minnesota to ensure what was heard and reported is accurate. The draft plan will recommend policies, projects, and programs at the local, regional and state levels. The plan will provide recommendations for the next five to ten years to be implemented with state, regional and local partners. This journey begins with one step, and this process will help reveal the multiple partners and stakeholders that can walk along to make Minnesota a more desirable and safer place for people to walk and roll.
APPENDICES PAGE 39
APPENDICESAppendix A: Transportation Policy and Planning
POLICY AND PLANNING CONTEXTHow do we get sidewalks? How are pedestrian boulevards or trails built? The first step in this process is the planning phase.
Pedestrian planning in Minnesota occurs within a broader policy context which happens at multiple levels and encompasses a variety of disciplines. Federal and state laws related to pedestrians provide guidance for state policy and plan development. State policy and planning efforts then guide additional work at the state level as well as local planning efforts. Understanding this context is important to ensure that future pedestrian planning activities, such as the development of a Statewide Pedestrian System Plan, align, support and further existing efforts.
While pedestrian work encompasses many different disciplines, the Statewide Pedestrian System Plan will focus primarily on the pedestrian system as it relates to transportation and health. The Minnesota Department of Transportation and the Minnesota Department of Health are collaborating in developing this plan. Key context-setting information for each area is summarized in the following sections.
TRANSPORTATION CONTEXTFederal Laws
Federal transportation statute and regulations provide direction and funding for statewide and regional plans and programs. Key legislation, and how it relates to the pedestrian system, is identified and discussed in the following sections.
MOVING AHEAD FOR PROGRESS IN THE 21ST CENTURY ACT OF 2012 (MAP - 21)
MAP-21 is the funding and authorization bill which governs surface transportation spending in the country. Within the bill, funding for the pedestrian system is primarily address through the Transportation Alternatives Program. The goal of this program is to provide funding for programs and projects defined as “transportation alternatives”. This includes on- and off-road facilities for pedestrians and bicyclists, infrastructure project to increase mobility for nondrivers, community improvement activities, as well as the recreational trails and safe routes to school programs.
MAP-21 also provides funding for pedestrian safety activities through the Highway Safety Improvement Program. The goal of this program is to reduce injuries and fatalities on all public roadways, pathways and trails for all users, including nonmotorized users.
It is important to note that while the federal legislation authorizes spending in these areas, the specific processes through which projects are selected and programs supported are determined by the State.
AMERICANS WITH DISABILITIES ACT OF 1990
The Americans with Disabilities Act prohibits discrimination and ensures equal opportunity and access for persons with disabilities. Related to transportation, this includes requiring transportation facilities meet certain ADA standards, many of which impact infrastructure that is a part of the pedestrian system.

MINNESOTA GO MINNESOTA WALKS: CURRENT & FUTURE STEPS TOWARDS A WALKABLE MINNESOTAPAGE 40
2010 USDOT POLICY STATEMENT ON ACCOMMODATING BICYCLES AND PEDESTRIANS
This federal policy statement encourages state DOTs to consider the inclusion of pedestrian facilities on state routes and transportation facilities, and integrate pedestrian facilities into transportation system as an incentive to meet federal funding eligibilities.
WHAT THIS MEANS FOR THE STATEWIDE PEDESTRIAN SYSTEM PLAN
At the federal level, through laws, policies and programs, there is funding and support for investing in the pedestrian system. Decisions regarding these investments are left to the states. The Statewide Pedestrian System Plan can be a resource for guiding Minnesota in these areas.
State Laws
In addition to federal guidance, state legislation provides additional goals, direction and programs related to the pedestrian system. Key state-level legislation in Minnesota is identified and summarized in the following sections.
STATE DEFINITION OF PEDESTRIAN (169.011)
Pedestrian. “Pedestrian” means any person afoot or in a wheelchair. (Subd. 53)
Wheelchair. For the purposes of this chapter, “wheelchair” is defined to include any manual or motorized wheelchair, scooter, tricycle, or similar device used by a disabled person as a substitute for walking (Subd. 93)
MNDOT GOALS RELATED TO WALKING (174.01 SUBD. 2)
As a part of the legislation creating the Minnesota Department of Transportation, a number of goal are identified for the transportation system in the state. Specific to pedestrians is the goal:
(14) to promote and increase bicycling and walking as a percentage of all trips as energy-efficient, nonpolluting, and healthy forms of transportation;
Additionally, many of the other goals are indirectly related to supporting the pedestrian system and walking as a form of transportation, and include:
STATE NON-MOTORIZED ADVISORY COMMITTEE
The Minnesota legislature created a State Non-Motorized Advisory Committee in 2008 and reaffirmed the committee in 2014, which is composed of regional citizen and state agency representatives. The Committee serves to develop non-motorized transportation goals, policies, and standards in Minnesota. The group advises and makes recommendations to the Commissioner on items related to non-motorized transportation, including safety, education, and development programs. The Committee is legislatively authorized, Minnesota Statute 174.37.
SAFE ROUTES TO SCHOOL PROGRAM (174.40)
In 2012, the Minnesota State legislature created a state SRTS program. Minnesota is one of the few states in the country to develop a state program in legislation. In 2013, the Minnesota state legislature began to invest general fund in the program.
WHAT THIS MEANS FOR THE STATEWIDE PEDESTRIAN SYSTEM PLAN
At the state level, there is legal and policy support for increased focus and efforts related to the pedestrian system and increasing walking as a form of transportation.
STATE POLICY AND PLANNING DOCUMENTSAt the state level, pedestrian-related work occurs through a number of initiatives at the Minnesota Department of Transportation. These
APPENDICES PAGE 41
efforts include overarching statewide policy and planning documents as well as more targeted, project-specific activities. While these efforts represent a substantial amount of work related to the pedestrian system, under these existing conditions the policy and planning guidance is integrated and woven into many documents. There is not currently one unifying, state-level, direction-setting document specific to the pedestrian system as there is for other transportation systems through the Minnesota GO Family of Plans. From a transportation perspective, this is the primary reason for the development of a Statewide Pedestrian System Plan.
As a part of the Minnesota GO Family of Plans, the Statewide Pedestrian System Plan will integrate with and support the overall policy and planning context at MnDOT. This means integrating existing policy and planning documents that relate to and reference the pedestrian system. When complete, the plan will also provide direction to documents and practices throughout the agency. In order to understand the current pedestrian-related policy and planning context at MnDOT, a number of planning documents and agency policies were reviewed.
POLICY DOCUMENTS REVIEWED
• Design Policy - Designing Excellence through Context Sensitive Design and Solutions (2006; expired 2011)• Cost Participation for Cooperative Construction Projects and Maintenance Responsibilities between MnDOT and Local Units of
Government (2014)• Complete Streets (2014)
PLANNING DOCUMENTS REVIEWED
• Minnesota GO 50-year Vision (2011)• Statewide Multimodal Transportation Plan (2012)• Greater Minnesota Transit Plan (2009)• Greater Minnesota Transit Investment Plan (2011)• MnSHIP: Minnesota State Highway Investment Plan 2014-2033 (2013)• American with Disabilities Act Transition Plan (2011)• Highway System Operations Plan (2012)• Minnesota Intercity Bus Network Study (2014)• Strategic Highway Safety Plan (2014)• Transportation Asset Management Plan (2014)OTHER TRANSPORTATION DOCUMENTS REVIEWED
• 2012 Annual Transportation Performance Report (2014)• MnDOT Road Design Manual (2006-2013)• Minnesota Manual on Uniform Traffic Control Devices (2014)
WHAT THIS MEANS FOR THE STATEWIDE PEDESTRIAN SYSTEM PLAN
The review of existing MnDOT policy and planning documents, which relate to and reference the pedestrian system, identified a number of ways in which the Statewide Pedestrian System Plan can support, advance or address gaps in existing pedestrian-related efforts. At a high-level, these potential focus areas include to:
• Provide context-sensitive guidance for identifying “pedestrian need” and determining what constitutes an adequate facility and adequate facility maintenance and operations; providing guidance for scoping and design (Cost Participation Policy, Complete Streets, Context Sensitive Design Policy, HSOP, MnDOT Road Design Manual, TAMP)
• Set expectations and provide guidance for coordination between MnDOT and local units of government related to funding, construction, maintenance and operations of pedestrian facilities (Cost Participation Policy, HSOP, Greater Minnesota Transit Plan)
• Determine how to measure “success” when it comes to pedestrian investments and the pedestrian system; identify key pedestrian performance measures (Annual Transportation Performance Report, Statewide Multimodal Transportation Plan, TAMP)

MINNESOTA GO MINNESOTA WALKS: CURRENT & FUTURE STEPS TOWARDS A WALKABLE MINNESOTAPAGE 42
• Prioritize pedestrian capital investments on the trunk highway system; guide spending for the MnSHIP Accessible Pedestrian funding category (ADA Transition Plan, MnSHIP, TAMP)
• Define key connections for pedestrians; define a pedestrian “priority network” (50-year Vision, Statewide Multimodal Transportation Plan)
• Address pedestrian connections to transit and intercity bus stops, including availability, safety, maintenance and operations (Intercity Bus Study, Greater Minnesota Transit Plan, Greater Minnesota Transit Investment Plan)
• Move MnDOT away from only “pedestrian accessibility” to a broader view of walking as transportation (50-year Vision, Annual Transportation Performance Report)
• Ensure accessibility of Minnesota’s transportation system; ensure accessibility of MnDOT’s pedestrian infrastructure (50-year Vision, ADA Transition Plan)
• Select key strategies and developing supporting materials to guide and support MnDOT’s efforts to increase safety for pedestrians (Strategic Highway Safety Plan)
• Identify a funding mechanism to address maintenance and operations on pedestrian facilities (HSOP)• Collect existing condition and use data related to pedestrian infrastructure and travel; develop processes for ongoing data collection
(TAMP)• Discuss and analyze key risks associated with pedestrian infrastructure (TAMP)
Appendix B: State Transportation Programs
The State of Minnesota has created several pedestrian related programs that are efforts to improve walking, safe routes to schools, bicycling, reduce pedestrian crashes, improve citizen health.
SAFE ROUTES TO SCHOOL
In 2005, the federal transportation bill SAFETEA-LU created a Safe Routes to School (SRTS) program with dedicated funding in every state. The funding was to be used to support walking and biking in K-8 schools through infrastructure grants, as well as education and encouragement programs. National program goals included increasing safety and access to schools, increasing physical activity in youth and reducing congestion around schools. In 2012, MAP-21 rolled Safe Routes to School into the Transportation Alternatives Program along with other non-motorized funding programs.
Minnesota
MnDOT’s SRTS program began in 2006 by offering grants to local communities for infrastructure improvements; along with some planning, education and encouragement activities. In 2009, Minnesota Department of Health (MDH) began supporting SRTS efforts through the Statewide Health Improvement Program (SHIP). In 2012, with the guidance of the SRTS steering committee MnDOT began to offer non-infrastructure grants and statewide programs to support local schools. In 2012, the Minnesota State Legislature developed a state program and in 2013 began to invest in funding the program with state general funds for non-infrastructure and infrastructure projects. MnDOT currently offers funding and resources through the following programs:
WALK! BIKE! FUN! PEDESTRIAN AND BICYCLE SAFETY CURRICULUM
The Walk! Bike! Fun! curriculum was developed for use in Minnesota classrooms by the Bicycle Alliance of Minnesota and Blue Cross Blue shield through a MnDOT grant. Physical Education teachers, after school programs, and school staff can teach the American Alliance for Health, Physical Education, Recreation, and Dance (AAPHERD) certified curriculum alone or work into other classroom activities. The walking lessons are designed for youth in grades K-3, while (bicycle education is for grades 4-6).
SAFE ROUTES TO SCHOOL PLANNING
APPENDICES PAGE 43
SRTS plans are comprehensive school travel plans created for schools with community input and context to evaluate existing conditions and make an action plan for future work. Some plans focus on one school site, while others focus on a school district or multiple schools. Safe Routes to School plans cover all 5e’s- education, encouragement, evaluation, enforcement and engineering.
MNDOT IMPLEMENTATION GRANTS
MnDOT has awarded nearly $20 million in funding to local grants using federal funds, since 2006. This includes infrastructure grants for sidewalks, crossing improvements, off-street trails and traffic calming. Non-infrastructure grants have gone to schools or region al organizations (cities, RDC’s, non-profits) to provide local SRTS coordination and support development of programs including walking school buses, school safety campaigns, Walk to School Day events and adult crossing guards. In 2014, MnDOT is also offering mini-grants for similar activities through a pilot solicitation.
EVALUATION AND COORDINATION WITH MDH
MnDOT and MDH are working to coordinate efforts around evaluation. Using the National Center for Safe Routes to School Data Center resources and database, data is collected in schools to track changes in walking and biking to school behaviors. The data collected through this effort tracks parent perceptions about walking and biking through surveys and travel behavior of students through classroom hand tallies.
SAFE ROUTES TO SCHOOL STRATEGIC IMPLEMENTATION PLAN AND RESOURCE CENTER
MnDOT began work on a statewide strategic implementation plan and resource center for SRTS in 2014. The strategic plan include program goals and performance measures for the next five years. It will also guide the development of a statewide resource for SRTS that will begin offering additional statewide resources to support SRTS work at the local level.
Broader Implications of SRTS
While SRTS is targeted towards youth in grades K-8, many communities that begin to develop a local SRTS program find broader benefits. Anecdotally, communities have articulated that SRTS is a good starting place for communities to begin work on active living in communities. SRTS teams bring together diverse stakeholders (engineers, elected officials and city staff, police, parents, advocates, senior citizens, school staff are common examples) to work on improving connections to schools. SRTS, especially through the support of SHIP, is starting the conversation around walking and biking in communities and many begin to think about safe routes to parks and recreation, libraries, healthy good, employment and other community destinations.
Communities may begin to make infrastructure changes and begin communitywide programs that support walking for all ages. A Minnesota example includes Live Health Red Wing which focuses on SRTS and physical activity in Red Wing. They have walking maps that they have developed for both SRTS and for other community destinations. Another combined effort is the City of Minneapolis focus on providing safe routes for youth and seniors.
Toward Zero Death (TZD)
Minnesota Toward Zero Deaths (TZD) is a collaborative approach to traffic safety created in 2003. It’s the state’s cornerstone traffic safety program and is based on the belief that even one traffic-related death on roadways in Minnesota is unacceptable. TZD uses a data-driven, interdisciplinary approach that targets areas for improvement and employs proven countermeasures in the areas of education, enforcement, engineering and emergency medical and trauma services (the 4Es). TZD involves many partners throughout the state including federal, state and local agencies as well as private and non-profit sector organizations.
Share the Road
Minnesota’s Share the Road pedestrian safety campaign provides materials, information and resources for anyone looking to improve pedestrian safety in a community, school, county or other areas. Increasing awareness of pedestrian safety will help reduce pedestrian-vehicle crashes, as well as reduce the fatalities and serious injuries that result from these crashes. Pedestrians and motorists are equally

MINNESOTA GO MINNESOTA WALKS: CURRENT & FUTURE STEPS TOWARDS A WALKABLE MINNESOTAPAGE 44
responsible for pedestrian safety. We all must take responsibility to follow the law, pay attention and share the road.
MINNESOTA DEPARTMENT OF HEALTH STATE PROGRAMSStatewide Health Improvement Program (SHIP)
The Statewide Health Improvement Program (SHIP) was implemented by MDH and a part of the 2008 Minnesota’s Vision for a Better State of Health, a bipartisan reform package to improve health by encouraging healthier eating, more physical activity and avoiding tobacco. SHIP communities across the state work to improve health by making it easier for Minnesotans to choose healthy behaviors. Their strategies represent the best evidence from across the nation, and are proven to be both effective and long-term. Because of SHIP communities throughout Minnesota have safer places to walk and bike, helping people get the physical activity they need to stay healthy.
In 2010, SHIP awarded its first round of grants. Covering the entire state of Minnesota, the 41 grantees included 87 counties, 53 community health boards, and 9 tribal governments. For the following fiscal years, 2012 and 2013, SHIP received reduced funding of $15 million and was only able to award 18 grants, covering just over half the state. In 2013 the Legislature supported SHIP with $35 million for fiscal years 2014 and 2015, and SHIP funding was once again available statewide.
The Statewide Health Improvement Program creates good health for parents, kids, and the whole community by decreasing obesity and reducing the number of people who use tobacco and are exposed to tobacco smoke. Two out of every three Minnesotans are overweight or obese—caused by insufficient physical activity and unhealthy eating—increasing risk for heart disease and diabetes, among other chronic illnesses. Obesity and tobacco use and exposure are the two leading causes of death.
Preventing disease saves money. Obesity and tobacco coast Minnesota nearly $6 billion a year. In Minnesota, medical expenses dues to obesity were approximately $2.8 billion. SHIP uses science-based strategies that are both effective and long-term to improve the health of people in Minnesota. Community-lead improvements in healthy eating, physical activity, and reducing commercial tobacco use happens in schools, communities, workplaces, and healthcare.
Environmental Health
The objectives of MDH’s Minnesota Climate and Health Program are to identify climate impacts and populations vulnerable to impacts; project the magnitude and distribution of potential health impacts of climate change; determine effective interventions for the health impacts of greatest concern; develop climate and health adaptation plans at the state and local levels; and continually evaluate and improve the effectiveness of the previous objectives. Another focus area of the program is increasing education and awareness through the publication of reports and resources for local public health professionals, planners, emergency managers and the public on the health impacts of climate change. For more information and copies of resources, see the Minnesota Climate and Health Program website: health.mn.gov/climatechange/.
Climate change relates to the pedestrian environment. Regarding adaptation it is important to have 1) tree canopy cover to provide shelter for more extreme heat events; 2) infrastructure that is built to sustain increased flooding and drought conditions as well as more frequent freeze-thaw cycles; etc. Regarding mitigation, walking is a great carbon-free mode of transportation.
Health Impact Assessments (HIAs) also have a connection with a statewide pedestrian plan. They are a possible strategy for local agencies when considering a roadway reconstruction or implementation of a transportation policy. The HIA could address how the proposed redesign or policy impacts accessibility, physical activity, equity, etc. that would all support a more consideration for pedestrian needs.
Injury Prevention
In 2012, 4,743 pedestrians were killed in traffic crashes in the United States, and another 76,000 pedestrians were injured. This averages to one crash-related pedestrian death every 2 hours, and a pedestrian injury every 7 minutes. Pedestrians are 1.5 times more likely than

APPENDICES PAGE 45
passenger vehicle occupants to be killed in a car crash on each trip.
There are populations at greater risk; these include:
• Older adults: Pedestrians ages 65 and older accounted for 20 percent of all pedestrian deaths and an estimated 9 percent of all pedestrians injured in 2012.
• Children: In 2012, more than one in every five children between the ages of 5 and 15 who were killed in traffic crashes were pedestrians.
• Drivers and pedestrians who are alcohol-impaired: Alcohol involvement for the driver or the pedestrian was reported in 48 percent of the traffic crashes that resulted in pedestrian death. Where alcohol involvement was reported, 34 percent of pedestrians killed had a blood alcohol concentration (BAC) of greater than or equal to .08 grams per deciliter (g/dL) and 14 percent of drivers had a BAC of greater than or equal to .08 g/dL.
Additionally, higher vehicle speeds increase both the likelihood of a pedestrian being struck by a car and the severity of injury. Most pedestrian deaths occur in urban areas, non-intersection locations, and at night.
Currently, there are strategies from CDC for how pedestrians can help prevent injuries and deaths from motor vehicle crashes. These include:
• Pedestrians should increase their visibility at night by carrying a flashlight when walking and by wearing retro-reflective clothing.
• Whenever possible, pedestrians should cross the street at a designated crosswalk or intersection.
• It is much safer to walk on a sidewalk, but if a sidewalk is not available, pedestrians should walk on the shoulder and facing traffic.
Identifying strategies and recommendations in a statewide pedestrian plan can identify how to prevent pedestrian injuries, and create safer places for people to walk in Minnesota.
Appendix C: Work to Date
PHASE I PROJECT ADVISORY COMMITTEEWork to date focused not only on the assessment of walking conditions, but also included detailed analysis of policies, programs and plans that affect walkability in Minnesota, which can be found in Appendix A and B. The planning process was overseen by an internal Project Advisory Committee. A general assessment was conducted of the following data: sidewalk conditions, land use, health, school and nursing home locations, main streets and many others.
In addition to having an internal PAC, the planning process involved a detailed inquiry into the MnDOT District staff level approach to pedestrian planning, as well as external overview of stakeholder goals and needs, which can both be found in Chapter 4 of this document.
Following this MnDOT internal background gathering process, it was recognized that walkability and the pedestrian mode of transportation would entail a much broader spectrum and involvement of other agencies.
FINDINGS FROM MNDOT DISTRICT STAFF OUTREACH MEETINGS, SUMMER/FALL 2014The planning process for Phase I of the Pedestrian Strategic Plan included extensive input and coordination with each of the Districts in order to identify challenges to pedestrian planning, projects, implementation and maintenance. Individual strategies and elements of pedestrian project delivery that are working were also analyzed.
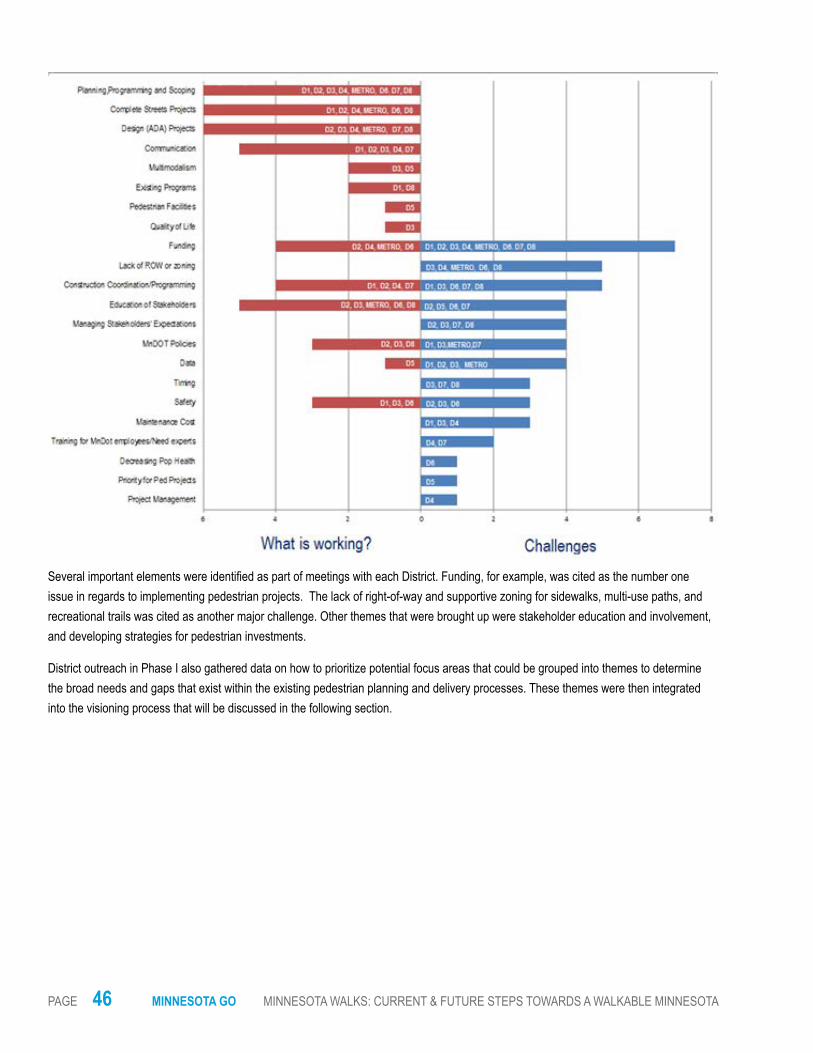
MINNESOTA GO MINNESOTA WALKS: CURRENT & FUTURE STEPS TOWARDS A WALKABLE MINNESOTAPAGE 46
Several important elements were identified as part of meetings with each District. Funding, for example, was cited as the number one issue in regards to implementing pedestrian projects. The lack of right-of-way and supportive zoning for sidewalks, multi-use paths, and recreational trails was cited as another major challenge. Other themes that were brought up were stakeholder education and involvement, and developing strategies for pedestrian investments.
District outreach in Phase I also gathered data on how to prioritize potential focus areas that could be grouped into themes to determine the broad needs and gaps that exist within the existing pedestrian planning and delivery processes. These themes were then integrated into the visioning process that will be discussed in the following section.

APPENDICES PAGE 47
Appendix D: Findings from Related State Plans, Trends, and Performance Measures
OTHER RELATED PLANSVISIONS
Method and Results
The Minnesota GO vision highlights the following themes for its 50-years pedestrian and bike vision:
• Maximize health of people, environment and economy• Increase accessibility regardless of socio-economic status or individual ability (Equity)• Minimize resource use and pollution• Safety• Reliability of the system• Multimodal, using pedestrian and bicycle travel as ways to connect modes in addition to serving as transportation options.• Zero deathA literature review was conducted to get a better understanding of where The Minnesota Peds/Bike plan stands compared to other state. The vision statements of the following states were looked at:
Idaho, Kansas, New York, New Hampshire, Maryland, Wisconsin, Delaware, Alaska, Pennsylvania, D.C., Alabama, Colorado, North Carolina and Hawaii. Chicago and Denver plans were also looked at.
The Minnesota GO plan has one of the most extensive lists of themes regarding peds/bike planning. Each states’ vision themes were compared against the Minnesota Go vision. Figure 1 below shows the number of occurrences for each theme. For example, safety comes ahead and is mentioned in 12 of the plans reviewed while pollution is only mentioned in the Minnesota GO plan. The top 4 vision themes are safety, accessibility, multimodality and health.
Some plans included themes that are not mentioned in the Mn GO vision. These recurring themes are ‘desirability of the facility’, ‘convenience of use’ and ‘mobility’. Several states underlined the importance of having well designed and well maintained ped/bike

MINNESOTA GO MINNESOTA WALKS: CURRENT & FUTURE STEPS TOWARDS A WALKABLE MINNESOTAPAGE 48
facilities that are convenient and appealing to the public. A few states also mentioned in their vision that the plan should help increase the quality of life. Some states made a distinction between Quality of life and Health themes.
TRENDS
The Plans reviewed were produced at different point in time by the states. Therefore some trends are noticeable over the past 20 years. Since the beginning of the decade the triple bottom line aspect (social, economic and environmental benefits) seems to be included in most plans while absent in the past. Vision statements are more comprehensive than they used to be. Equity does not seem to be mentioned as it was previously in the ped/bike plans vision statements. It might be included in the goals but not explicitly in the vision.
The difference in vision statements could also be explained by the type of state that formulated it. Some states may have bigger incentives to promote some themes over others. States with a lot of tourism for example might have visions that are tailored to sustain this advantage.
PERFORMANCE MEASURES
Method and Results
MnDOT is currently using three main performance measures concerning bike and peds:
• Percent of signalized intersections with APS installed
• Percent of sidewalk miles in poor condition
• Number of curb ramps in GM that comply with ADA
A literature review was conducted to get a better understanding of where The Minnesota Peds/Bike plan stands compared to other state in terms of performance measures. The ped/bike plans of the following states were looked at:
Idaho, New York, Maryland, Delaware, Alaska, Pennsylvania, Colorado, North Carolina. City of Denver plans were also looked at.
It appears that each state has its own indicators. Only three performance indicators are almost consistently used across the plans reviewed, the Pedestrian crash data, the mode share , and the sidewalk inventory. 17 other indicators were found in the literature review. Delaware uses health based measures such as diabetes cases, daily activity measures and obesity rate. North Carolina uses ‘increased investment in ped and bike’ as well as ‘increase mileage of greenway’ that matches their triple bottom line vision. Penn DOT looks at a measure that resembles what North Carolina DOT does by looking at the number of projects that include ped/bike features. They also look at the number of intermodal/system connections made.
CONCLUSION
MnDOT uses performance indicators that are not used by other states except for the sidewalk condition data that is a commonly used one. Crash data and mode share data seem to be dominant among several states when assessing ped/bike performance. That might be explained by the ease of access of these data.
A few state have innovative measures involving environmental or health data. Overall, it does not seem that any of the state reviewed have a solid consistent way to look performance.

This page intentionally left blank


