66
1
1

2
Contents page
3
Chairman’s Letter 5 Review of Operations and Activities 7 Directors’ Report 14 Directors’ Declaration 26 Consolidated Statement of Profit or Loss & Other Comprehensive Income 28 Consolidated Statement of Financial Position 29 Consolidated Statement of Changes in Equity 30 Consolidated Statement of Cash Flows 31 Notes to the Consolidated Financial Statements 32 Auditor’s Independence Declaration 58 Independent Audit Report 60 Additional Information 64

Chairman’s Letter 30 June 2021
4

Chairman’s Letter 30 June 2021
5
Dear Shareholders, The last year has been particularly challenging for many businesses and individuals, with EVE not immune from the significant disruption that COVID-19 has imposed. The impact to global logistics networks and to the sales network of our Chinese distribution partner have been setbacks to our expansion plans. We also experienced extreme weather conditions which adversely impacted farming operations. Despite this, we have seen growth in Group1 revenues to $6.6m (2020: $4.6m) up 43% on the prior year and growth in every revenue segment. Year-on-year revenue highlights include:
• 50% growth in contract manufacturing division. • 13% growth in brand products division. • 10% growth in bulk sales division. • 65% growth in associate Naturally Australia Products (49% owned by EVE).1
We are very pleased with the growth the Company is seeing in its branded product division, affirming our decision to continue to invest in marketing initiatives and promotional support to build the Meluka® brand in Australia and overseas. Our expansion into new territories such as Japan, Taiwan, Canada and Singapore will benefit from the work that has already been done in developing and refining our consumer messaging. The COVID-19 induced setbacks with our Chinese distribution partners resulted in efforts being redirected to the US and other markets. An important milestone was achieved in the year when the Company announced that two of its products would be ranged in US retailing giant Whole Foods in the North Western California market. Whole Foods focusses on delivering consumers quality organic products, making it an outstanding fit for our Meluka® products. Sales by Whole Foods commenced late in the financial year and to date three purchase orders have been delivered to Whole Foods. We are encouraged by the progress and look forward to expanding our products in this important market. The entry into Whole Foods is a testament to our strategy of building brand recognition and consumer interest through online platforms such as Amazon and leveraging that performance into traditional distribution networks. Our management team and all our operation staff have worked incredibly well to continue our research and development programs, meet production deadlines, develop new products and build the Meluka® consumer brand. We are also proud to have embarked on initiatives in the communities we operate in, with an investment made into an EVE Investments Regenerative Agriculture part scholarship with Southern Cross University as well as fostering STEM activities at a local primary school in Ballina, NSW. The entire team at EVE believe it is an important part of our role to give back to our community. I would like to thank all our employees for their hard work and commitment throughout this very difficult and disruptive year. They have shown great resilience and innovation navigating the ever-changing unpredictable COVID-19 environment. Lastly, I’d like to foreshadow an upcoming change, EVE Investments has evolved over the last few years and our name no longer reflects who we are and what we aspire to be. At this year’s Annual General Meeting, we propose to change our name to EVE Health Group Limited. This will, we believe better reflect our position as a company focused on being a noteworthy leader in the Australia health and wellness sector. On behalf of the entire EVE team, we thank shareholders for their continued support, and we look forward to a strong 2021/2022. Yours sincerely George Cameron-Dow Non-Executive Chairman
1 Non-IFRS measures. Group revenue includes 100% of the revenue from all 100% owned subsidiaries as well as associates Naturally Australian Products (49%) and Omni Innovation (38%). Associates are not consolidated into the accounts of EVE and are presented separately in the notes to the consolidated financial statements. Consolidated revenue for the period is $2.8m.

Review of Operations 30 June 2021
6
Review of Operations 30 June 2021
7
A Platform for Growth EVE focused its attention on growth during the last 12 months. The Company built out its brand awareness in the Australian and United States (US) markets with targeted marketing via online channels and launching its brands into the new Canadian, Singapore and Japanese markets. These efforts have seen reliable growth in revenue and positioned the Company well for a breakout year in 2022, particularly in Australia and the US. The impact of COVID-19 adversely affected the distribution models of EVE’s China and Taiwanese partners, which has slowed sales in these markets. Our Chinese partners launched a new online-focused sales model late in the year, which is anticipated to improve sales. EVE’s diversified geographic approach to distribution means healthy revenue growth was achieved despite the setbacks in China.
Distribution Strategy Expanding The last year saw the successful implementation and expansion of the company’s distribution strategy. Entering new markets via the global e-commerce platform Amazon allows EVE’s brands to establish a direct-to-consumer relationship and prove market acceptance in a cost-effective and efficient way. This provides leverage with established distributors in these markets for negotiating favourable distribution arrangements and helps gather valuable direct consumer feedback for product changes and new product development. This strategy was launched two years ago in the US and in December 2020, Whole Foods Market, the largest organic focused supermarket chain in the world, agreed to stock two honey products from Meluka Australia in its Northern California stores. This strategy was also initiated in Canada, Singapore and Japan during the year. The focus for the coming year will be to significantly increase the number of products being exposed to these new markets to broaden the customer base and expand the brand footprint.
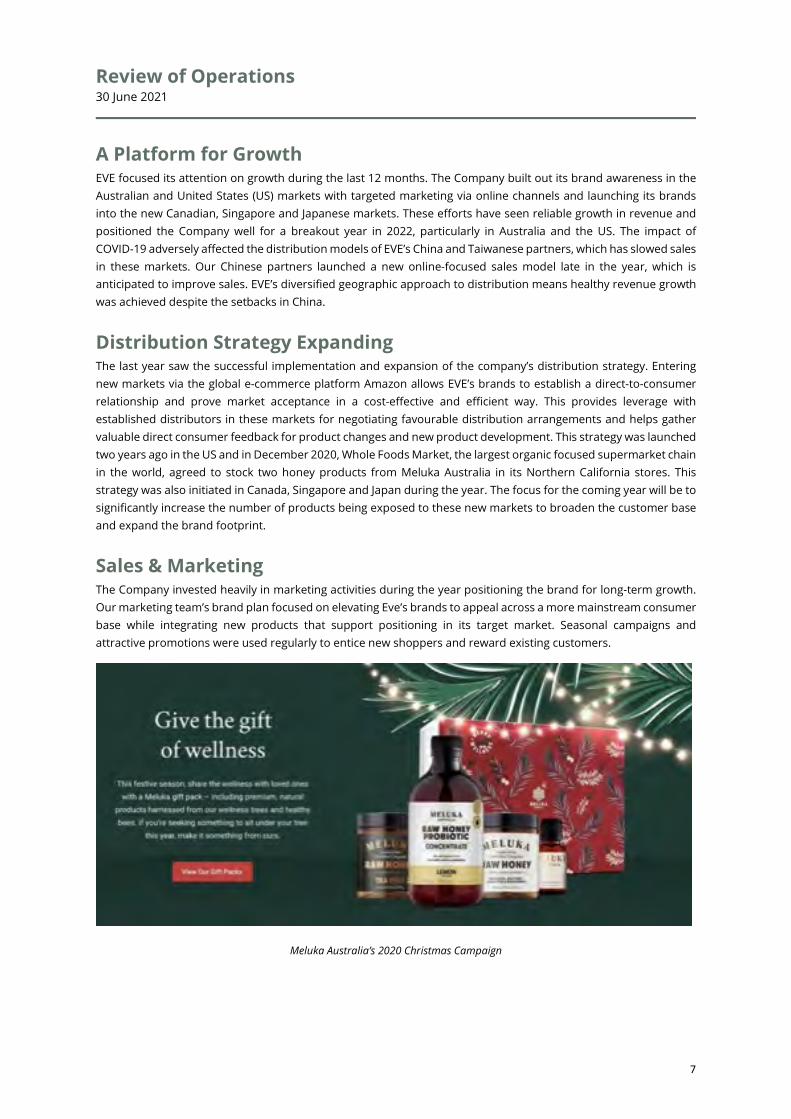
Sales & Marketing The Company invested heavily in marketing activities during the year positioning the brand for long-term growth. Our marketing team’s brand plan focused on elevating Eve’s brands to appeal across a more mainstream consumer base while integrating new products that support positioning in its target market. Seasonal campaigns and attractive promotions were used regularly to entice new shoppers and reward existing customers.
Meluka Australia’s 2020 Christmas Campaign

Review of Operations 30 June 2021
8
During the year Meluka Australia redesigned and launched a new website that streamlined the shopping process to make it easier for online consumers to browse, learn and purchase products, with the website improving performance on all key metrics. This change had a significant positive impact on Australian sales and the US site went through a similar refresh and launched in July 2021. In addition to this, region-specific Instagram presence has been set-up for Meluka Australia in US and Japan to support brand awareness in these markets. A key part of the strategy for new product launches is support through strong advertising, promotional activity and digital media to build awareness and highlight key features and benefits to consumers through compelling marketing collateral. During the year, the Meluka Australia core honey and probiotic concentrate drinks range expanded with innovative new flavours, and the company released its first essential oil diffuser and range of organic tea tree oil and essential oil blends.
An even more expansive marketing plan is in place for the coming year with a much greater number of new products planned and entry into new markets. Image above: Homepage of the redesigned Meluka Australia site.

Review of Operations 30 June 2021
9
Meluka Australia’s promotional campaigns
R&D/New Product Development Utilising the Company’s manufacturing and production facility at Eco Botanicals in Northern NSW, an ambitious R&D and new product development program was implemented during the year. New products added were two new Probiotic Concentrate drinks - Original and Tea Tree, an Apple Cider Vinegar infused Raw Honey, Organic Tea Tree oil and a Meluka Australia branded diffuser. Planning and development work was also completed for three new blended essential oil products to complement the tea tree oil which launched in July 2021.
New product launches for the year
In addition to this a new luxurious Australian botanical range of three honeys and three new probiotic concentrate drinks, incorporating Australian botanicals (Lemon Myrtle, Davidson Plum and Finger Lime) have been developed and are planned to be launched in September 2021.
Review of Operations 30 June 2021
10
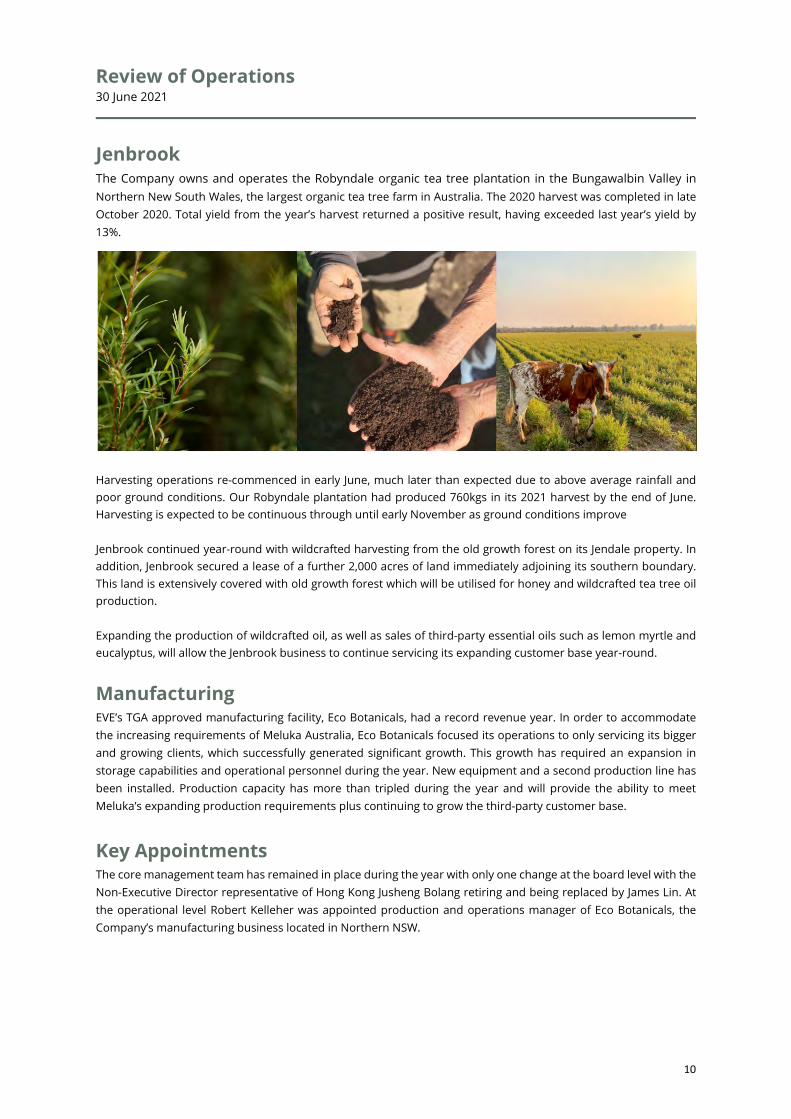
Jenbrook The Company owns and operates the Robyndale organic tea tree plantation in the Bungawalbin Valley in Northern New South Wales, the largest organic tea tree farm in Australia. The 2020 harvest was completed in late October 2020. Total yield from the year’s harvest returned a positive result, having exceeded last year’s yield by 13%.
Harvesting operations re-commenced in early June, much later than expected due to above average rainfall and poor ground conditions. Our Robyndale plantation had produced 760kgs in its 2021 harvest by the end of June. Harvesting is expected to be continuous through until early November as ground conditions improve Jenbrook continued year-round with wildcrafted harvesting from the old growth forest on its Jendale property. In addition, Jenbrook secured a lease of a further 2,000 acres of land immediately adjoining its southern boundary. This land is extensively covered with old growth forest which will be utilised for honey and wildcrafted tea tree oil production. Expanding the production of wildcrafted oil, as well as sales of third-party essential oils such as lemon myrtle and eucalyptus, will allow the Jenbrook business to continue servicing its expanding customer base year-round.
Manufacturing EVE’s TGA approved manufacturing facility, Eco Botanicals, had a record revenue year. In order to accommodate the increasing requirements of Meluka Australia, Eco Botanicals focused its operations to only servicing its bigger and growing clients, which successfully generated significant growth. This growth has required an expansion in storage capabilities and operational personnel during the year. New equipment and a second production line has been installed. Production capacity has more than tripled during the year and will provide the ability to meet Meluka’s expanding production requirements plus continuing to grow the third-party customer base.
Key Appointments The core management team has remained in place during the year with only one change at the board level with the Non-Executive Director representative of Hong Kong Jusheng Bolang retiring and being replaced by James Lin. At the operational level Robert Kelleher was appointed production and operations manager of Eco Botanicals, the Company’s manufacturing business located in Northern NSW.

Review of Operations 30 June 2021
11
Corporate Social Responsibility At the core of the Company’s values is supporting its people, its environment, and its community. Sustainability at the forefront of our operations The Company’s operations are centred around upholding certified organic practices, promoting ecological balance and ensuring our environment remains just as nature intended. At our Jenbrook farm, we work with nature to ensure soil and plant health, striving to continuously improve our processes. This includes adopting regenerative farming techniques to increase soil diversity while always focusing on minimising our environmental footprint to ensure a sustainable operation. Caring for and connecting with our community We are a large part of the community we operate in, and we are proud to be investing in community centric initiatives that deliver a positive impact. During the year the Company sponsored its first EVE Investments Regenerative Agriculture part scholarship, a program that aligns with our values and beliefs in the benefits that natural regenerative farming practices provide for sustainable future operations. Developed in conjunction with Southern Cross University, a leading educational institution in the field of regenerative agriculture, the part scholarship was aimed at supporting aspiring students with a passion in this emerging field to achieve their study aspirations. In further support of our strong belief in the value of education, EVE partnered with Ballina Public School to support the implementation of its various STEM programs within the school, including donating the purchase of an interactive whiteboard to upgrade outdated classroom technology, as well as providing funding support for class projects focused on sustainability. During the year, Meluka Australia undertook a ‘Mother Nurture’ campaign in conjunction with the launch of its Apple Cider Vinegar Infused Honey to donate $5 from each jar purchased to ReForest Now, an Australian not-for-profit who focuses on projects that restore and reforest cleared land where rainforest once stood at several Northern New South Wales. The campaign culminated in a donation to the organisation to fund over 200 rainforest trees to be planted in the Byron Shire region in New South Wales.
We intend to continue to forge strong partnerships within our community across of all our businesses as we strive deliver programs that create shared and meaningful value.
Review of Operations 30 June 2021
12
Naturally Australian Products Inc (49% EVE) Naturally Australian Products (“NAP”), a US based distribution business, focused on bulk sales of essential oils, hydrosols and natural extracts, recorded revenue of $3.8 million in the year, a 65% increase on the prior year. The performance was particularly good given that the tea tree and other essential oil harvests were delayed in the June quarter due to weather conditions and oil was in short supply, impacting revenue in the final quarter of the year. The continued strong performance from NAP is attributable to a growing demand for essential oils products in the US. NAP has developed strong relationships with several large skincare businesses and has become a trusted supplier of high-quality bulk essential oils. These oils are sourced globally, with Australia being a significant supply source, predominantly for tea tree, eucalyptus and lemon myrtle oils.
Omni Innovation (38% EVE) Omni Innovation (“Omni”) is an Australian medical nutrition company focused on development of clinically validated innovative nutritional solutions to chronic and lifestyle medical conditions. During the year, Omni entered into a binding Term Sheet agreement with Myopharm Limited (“Myopharm”), an unlisted Australian biotechnology company that has intellectual property assets for the novel development of improving muscle growth and human therapeutic purposes, with a final agreement expected to be finalized in Q1 2022. Under the agreement, Myopharm will be granted a 15-year licence for the manufacture, marketing and distribution of Omni’s foundation product, the clinically proven pre‐meal glycaemic control product for Type 2 diabetes and Pre‐Type 2 diabetes, throughout Australia, mainland China and the UK/Europe. This agreement includes a mixture of upfront and deferred licencing fees as well as an on-going royalty on product sales. Initial upfront consideration of $260,000 has already been received as well as $265,000 in equity. Further cash payments of the initial licence fees of $375,000 are due in various instalments up to 31 January 2024. Additionally, on-going royalties equal to 5% of wholesale sales are payable up until 31 December 2027 and thereafter at a rate of 3%. The product is expected to be launched in Australia in late 2021 with the other territories to follow, with the product positioned to be sold through a prescription channel in Australia and Europe, an approach not explored by previous licence holders in those markets. Omni is free to pursue licencing arrangements in other territories including the USA and India, both territories with large populations of those living with diabetes and pre-diabetes as well as being markets that Omni has patented its pre-meal drink technology.

Director’s Report 30 June 2021
13
Director’s Report 30 June 2021
14
The Directors of the Group present their report together with the annual report of EVE Investments Limited (“the Group” or “EVE”) for the financial year ended 30 June 2021.
1. Directors and Company Secretary The Directors and Company Secretary in office at any time during or since the end of the financial year are:
Mr George Cameron-Dow – Non-Executive Chairman Mr Gregory (Bill) Fry – Managing Director / CEO Mr Alasdair Cooke – Non-Executive Director Mr Carlos Jin – Non-Executive Director Ms Joalin Chou – Non-Executive Director (resigned 22 April 2021) Mr James Lin – Non-Executive Director (appointed 22 April 2021) Mr Steven Jackson – Company Secretary
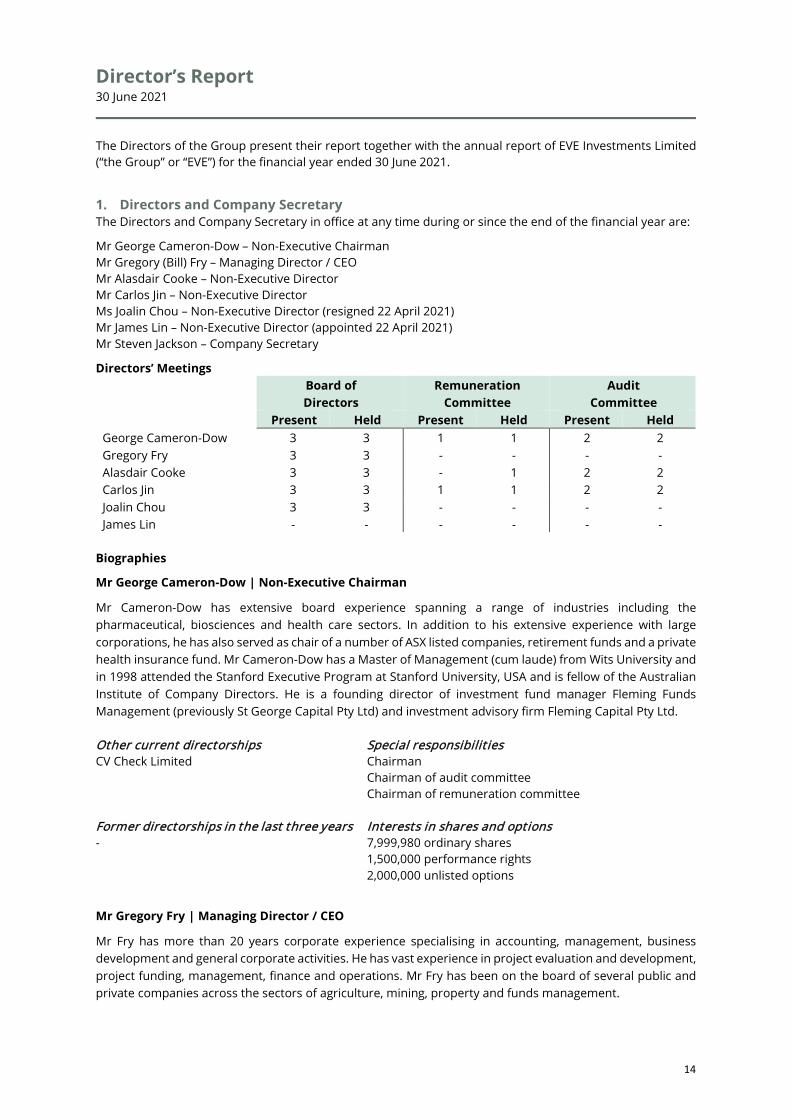
Directors’ Meetings
Biographies
Mr George Cameron-Dow | Non-Executive Chairman
Mr Cameron-Dow has extensive board experience spanning a range of industries including the pharmaceutical, biosciences and health care sectors. In addition to his extensive experience with large corporations, he has also served as chair of a number of ASX listed companies, retirement funds and a private health insurance fund. Mr Cameron-Dow has a Master of Management (cum laude) from Wits University and in 1998 attended the Stanford Executive Program at Stanford University, USA and is fellow of the Australian Institute of Company Directors. He is a founding director of investment fund manager Fleming Funds Management (previously St George Capital Pty Ltd) and investment advisory firm Fleming Capital Pty Ltd. Other current directorships Special responsibilit ies CV Check Limited Chairman
Chairman of audit committee Chairman of remuneration committee
Former directorships in the last three years Interests in shares and options - 7,999,980 ordinary shares
1,500,000 performance rights 2,000,000 unlisted options
Mr Gregory Fry | Managing Director / CEO
Mr Fry has more than 20 years corporate experience specialising in accounting, management, business development and general corporate activities. He has vast experience in project evaluation and development, project funding, management, finance and operations. Mr Fry has been on the board of several public and private companies across the sectors of agriculture, mining, property and funds management.
Board of Directors
Remuneration Committee
Audit Committee
Present Held Present Held Present Held George Cameron-Dow 3 3 1 1 2 2 Gregory Fry 3 3 - - - - Alasdair Cooke 3 3 - 1 2 2 Carlos Jin 3 3 1 1 2 2 Joalin Chou 3 3 - - - - James Lin - - - - - -

Director’s Report 30 June 2021
15
Other current directorships Special responsibilit ies - Managing Director / CEO
Former directorships in the last three years Interests in shares and options African Energy Resources Limited Anova Metals Limited
75,902,622 ordinary shares 12,000,000 performance rights 19,333,332 unlisted options
Mr Alasdair Cooke BSc (Hons) | Non-Executive Director
Mr Cooke has more than 20 years experience, in board and senior executive positions, managing multiple publicly listed and private enterprises as well as founding a private company specialising in project incubation and development.
Other current directorships Special responsibilit ies African Energy Resources Limited Caravel Minerals Limited
Member of the remuneration committee Member of the audit committee
Former directorships in the last three years Interests in shares and options Anova Metals Limited
185,874,601 ordinary shares 1,500,000 performance rights 3,500,000 unlisted options
Mr Carlos Jin | Non-Executive Director
Mr Jin has nearly 30 years of working experience in foreign companies as well as Chinese state-owned enterprises, specifically in the functions of human resources management and investment management and holds a master’s degree in business administration. Other current directorships Special responsibilit ies -
Member of the remuneration committee Member of the audit committee
Former directorships in the last three years Interests in shares and options - -
Mr James Lin | Non-Executive Director (appointed 22 April 2021)
Mr Lin has over 25 years of experience specialising in marketing, direct selling, development and management with a particular focus on the direct selling industry. Mr Lin has served as a senior executive and professional manager of direct selling companies in Mainland China, Taiwan, Malaysia and the United States. Other current directorships Special responsibilit ies -
-
Former directorships in the last three years Interests in shares and options - -
Director’s Report 30 June 2021
16
Ms Joalin Chou | Non-Executive Director (resigned 22 April 2021)
Ms Chou holds 25 years of successful experience in all facets of sales and marketing, from product development to strategic marketing and sales management. Ms Chou has considerable experience in marketing, coupled with a deep understanding of market trends has seen her hold senior positions within leading companies and successfully drive company growth in the everchanging healthcare and wellness industry.
Mr Steven Jackson BEc CPA | Company Secretary Mr Jackson has more than 10 years experience in accounting, corporate governance and business development across a number of industries.
2. Remuneration Report – Audited This Remuneration Report outlines the remuneration arrangements which were in place during the year and remain in place as at the date of this report, for the key management personnel of the Group. During the period the Company’s Directors and the Chief Operating Officer, Mr Ben Rohr, were the only key management personnel of the Group.
The information provided in this remuneration report has been audited as required by section 308(3C) of the Corporations Act 2001.
Principles of compensation
The objective of the Company’s executive reward framework is to ensure reward for performance is competitive and appropriate for the results delivered. The framework aligns executive reward with achievement of strategic objectives and the creation of value for shareholders and conforms with market practice for delivery of reward. The Board ensures that executive reward satisfies the following key criteria for good reward governance practices:
• competitiveness and reasonableness;
• acceptability to shareholders;
• performance linkage / alignment of executive compensation;
• transparency; and
• capital management.
The Company has structured an executive remuneration framework that is market competitive and complementary to the reward strategy of the organisation.
Alignment to shareholders’ interests:
• has economic profit as a core component of plan design;
• focuses on sustained growth in shareholder wealth, consisting of dividends and growth in share price, and delivering constant return on assets as well as focusing the executive on key non-financial drivers of value; and
• attracts and retains high calibre executives.
Alignment to program participants’ interests:
• rewards capability and experience;
• reflects competitive reward for contribution to growth in shareholder wealth;
Other current directorships Special responsibilit ies -
-
Former directorships in the last three years Interests in shares and options - -

Director’s Report 30 June 2021
17
• provides a clear structure for earning rewards; and
• provides recognition for contribution.
The framework provides a mix of fixed and variable pay, and a blend of short and long-term incentives. As executives gain seniority with the Company, the balance of this mix shifts to a higher proportion of ''at risk'' reward Currently no remuneration consultants are used by the Company in formulating remuneration policies.
The following table shows key performance indicators for the group over the last five years:
2021 2020 2019 2018 2017 Loss after income tax for the year (3,630,685) (2,400,443) (2,638,506) (1,879,997) (1,387,353) Basic loss per share (cents per share) (0.09) (0.08) (0.11) (0.10) (0.11) Increase/(decrease) in share price % -33% 20% -38% 33% -33% Dividends - - - - -
Role of the Remuneration Committee The Remuneration Committee is a committee of the Board. It is primarily responsible for making recommendations to the Board on:
• Non-Executive Director Fees;
• Remuneration levels of the Managing Director and other key management personnel;
• The over-arching executive remuneration framework and operation of the incentive plan; and
• Key performance indicators and performance hurdles for the executive team.
Their objective is to ensure that remuneration policies and structures are fair and competitive and aligned with the long-term interests of the Company.
Non-Executive Directors
Fees and payments to Non-Executive Directors reflect the demands which are made on, and the responsibilities of, the Directors. Non-Executive Directors’ fees and payments are reviewed annually by the Board. The Chairman’s fees are determined independently to the fees of Non-Executive Directors based on comparative roles in the external market.
On appointment to the Board, all Non-Executive Directors enter into an agreement with the Company in the form of a letter of appointment. The letter summarises the Board policies and terms, including compensation, relevant to the office of Director. The current base remuneration excluding superannuation for Non-Executive Directors is summarised below and is effective since 1 November 2017.
Board of Remuneration Committee
Audit
Directors Committee Chairman Fee 60,795 5,000 5,000 Member Fee 35,463 2,500 2,500
Executive pay
An executive’s total remuneration comprises base pay and benefits, including superannuation, and long-term incentive through participation in the EVE Employee Incentive Plan.
Base pay
Base pay is structured as a total employment cost package which may be delivered as a combination of cash and prescribed non-financial benefits at the executive’s discretion.
Executives are offered a competitive base pay that comprises the fixed component of pay and rewards. Base pay for executives is reviewed annually to ensure the executive’s pay is competitive with the market. An

Director’s Report 30 June 2021
18
executive’s pay is also reviewed on promotion. There are no guaranteed base pay increases included in any executives’ contracts.
Long-term incentives
Long-term incentives are provided to certain Non-Executive Directors and executives under the EVE Employee Incentive Plans.
Share trading policy
The trading of shares issued to participants under the Company’s employee option plan is subject to, and conditional upon, compliance with the Company’s employee share trading policy. Executives are prohibited from entering into and hedging arrangements over unvested options under the Company’s employee option plan. The Company would consider a breach of this policy as gross misconduct which may lead to disciplinary action and potential dismissal.
Service contracts
On appointment to the Board, all Non-Executive Directors enter into an agreement with the Company in the form of a letter of appointment. The letter summarises the Board policies and terms, including compensation, relevant to the office of Director.
The Company currently has the following executive agreements in place:
Gregory (Bill) Fry – Managing Director / CEO: Ben Rohr – Chief Operating Officer:
Base salary: $320,0001 Base salary: $220,0001
Term: On-going Term: On-going
Termination benefit: 3 months base salary2 Termination benefit: nil
1 Base salary quoted is exclusive of superannuation for the year ended 30 June 2021 and is reviewed annually by the Remuneration Committee.
2 Termination benefits are payable on early termination by the company, other than for gross misconduct.
Voting and comments made at the Company’s 2020 Annual General Meeting The Company received 99.39% of “yes” votes on its remuneration report for the 2020 financial year. The Company did not receive any specific feedback at the AGM or throughout the year on its remuneration practices.
Director and Key Management Personnel remuneration
Details of the remuneration of the Directors and key management personnel of the Company (as defined in AASB 124 Related Party Disclosures) are set out in the following tables.
Details of remuneration
The following tables set out remuneration paid to Directors and key management personnel of the Company during the year.
Director’s Report 30 June 2021
19
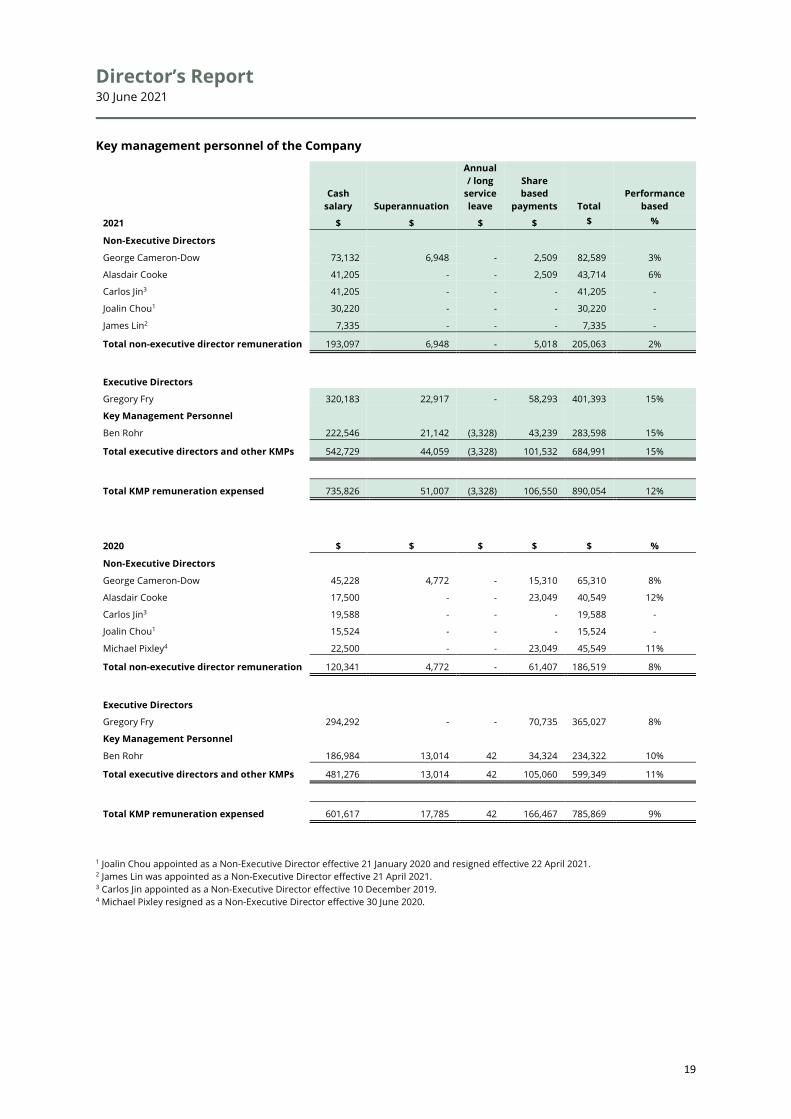
Key management personnel of the Company
Cash salary Superannuation
Annual / long
service leave
Share based
payments Total Performance
based
2021 $ $ $ $ $ %
Non-Executive Directors
George Cameron-Dow 73,132 6,948 - 2,509 82,589 3%
Alasdair Cooke 41,205 - - 2,509 43,714 6%
Carlos Jin3 41,205 - - - 41,205 -
Joalin Chou1 30,220 - - - 30,220 -
James Lin2 7,335 - - - 7,335 -
Total non-executive director remuneration 193,097 6,948 - 5,018 205,063 2%
Executive Directors Gregory Fry 320,183 22,917 - 58,293 401,393 15%
Key Management Personnel
Ben Rohr 222,546 21,142 (3,328) 43,239 283,598 15%
Total executive directors and other KMPs 542,729 44,059 (3,328) 101,532 684,991 15%
Total KMP remuneration expensed 735,826 51,007 (3,328) 106,550 890,054 12%
2020 $ $ $ $ $ %
Non-Executive Directors George Cameron-Dow 45,228 4,772 - 15,310 65,310 8%
Alasdair Cooke 17,500 - - 23,049 40,549 12%
Carlos Jin3 19,588 - - - 19,588 -
Joalin Chou1 15,524 - - - 15,524 -
Michael Pixley4 22,500 - - 23,049 45,549 11%
Total non-executive director remuneration 120,341 4,772 - 61,407 186,519 8%
Executive Directors Gregory Fry 294,292 - - 70,735 365,027 8%
Key Management Personnel Ben Rohr 186,984 13,014 42 34,324 234,322 10%
Total executive directors and other KMPs 481,276 13,014 42 105,060 599,349 11%
Total KMP remuneration expensed 601,617 17,785 42 166,467 785,869 9%
1 Joalin Chou appointed as a Non-Executive Director effective 21 January 2020 and resigned effective 22 April 2021. 2 James Lin was appointed as a Non-Executive Director effective 21 April 2021. 3 Carlos Jin appointed as a Non-Executive Director effective 10 December 2019. 4 Michael Pixley resigned as a Non-Executive Director effective 30 June 2020.

Director’s Report 30 June 2021
20
Directors may participate in the Company’s Employee Incentive Plan under which they will be offered equity incentives as performance-based remuneration.
Share-based compensation
Options
Options in EVE Investments Limited are granted under the EVE Investments Employee Incentive Plan which was approved by shareholders at the 2019 Annual General Meeting. The Employee Incentive Plan is designed to provide long-term incentives for Directors and key management personnel to deliver long-term shareholder returns. Participation in the plan is at the Board’s discretion and no individual has a contractual right to participate in the plan or to receive any guaranteed benefits.
Options are granted under the plan for no consideration. Options granted under the plan carry no dividend or voting rights. When exercisable, each option is convertible into one ordinary share.
Two tranches of options were issued during the period on the below terms, and with a service condition requiring continuous service with the Company:
A – until 13 October 2021; and
B – until 13 October 2022.
Gregory Fry Gregory Fry Ben Rohr Ben Rohr Tranche A B A B Grant date 26-Nov-20 26-Nov-20 28-Oct-20 28-Oct-20 Number of Options 8,000,000 8,000,000 6,000,000 6,000,000 Dividend yield (%) - - - - Expected volatility (%) 100% 100% 100% 100% Risk free interest rate (%) 0.10% 0.10% 0.25% 0.25% Expected life of the option (years) 3 3 3 3 Option exercise price ($) 0.016 0.016 0.016 0.016 Share price at grant date ($) 0.009 0.009 0.009 0.009 Fair value per option ($) 0.0039 0.0044 0.0040 0.0045 Total value at grant date ($) 31,534 35,464 23,945 26,865
Value vested during the year 21,219 11,167 16,762 9,205 Value to be vested 10,315 24,297 7,183 17,660
Shares and options in lieu of remuneration
In the previous year, the Company issued ordinary shares and attaching options with an exercise price of $0.006 and an expiry of 31 December 2021 in consideration for accrued director fees, in line with the terms of the capital raising announced on 12 July 2019.
The number of securities and the fair value on the grant date is detailed below:
Directors Shares received Value of shares
received Options received
Value of options received
George Cameron-Dow 2,000,000 8,000 2,000,000 2,319 Gregory Fry 3,333,332 13,333 3,333,332 3,865 Alasdair Cooke 3,500,000 14,000 3,500,000 4,058 Michael Pixley 3,500,000 14,000 3,500,000 4,058
12,333,332 49,333 12,333,332 14,300
Performance Rights The terms and conditions of each grant of performance rights affecting remuneration in the current or future period are as follows:

Director’s Report 30 June 2021
21
Director / KMP Issue date Expiry date Tranche Number of
rights issued Number of rights exercised / lapsed
Number of unvested
rights
George Cameron-Dow 31-May-16 31-May-21 A 1,500,000 1,500,000 -
Alasdair Cooke 31-May-16 31-May-21 A 1,500,000 1,500,000 -
Gregory Fry 31-May-16 31-May-21 A 6,000,000 6,000,000 -
Ben Rohr 3-May-16 3-May-21 A 2,250,000 2,250,000 -
Gregory Fry 22-Nov-18 22-Nov-23 B 4,000,000 4,000,000 -
Gregory Fry 22-Nov-18 22-Nov-23 C 4,800,000 - 4,800,000
Gregory Fry 22-Nov-18 22-Nov-23 D 3,600,000 - 3,600,000
Gregory Fry 22-Nov-18 22-Nov-23 E 3,600,000 - 3,600,000
George Cameron-Dow 22-Nov-18 22-Nov-23 E 1,500,000 - 1,500,000
Alasdair Cooke 22-Nov-18 22-Nov-23 E 1,500,000 - 1,500,000
Ben Rohr 22-Nov-18 22-Nov-23 C 3,200,000 - 3,200,000
Ben Rohr 22-Nov-18 22-Nov-23 D 2,400,000 - 2,400,000
Ben Rohr 22-Nov-18 22-Nov-23 E 2,400,000 - 2,400,000
Total 38,250,000 15,250,000 23,000,000
Tranche Hurdle Likelihood
A Omni Innovation completing an IPO or RTO on the ASX or an alternative Board approved exchange or the Trade Sale of Omni Innovation’s main business
Not Met
B Continuous service until 30 September 2020 Met
C Achievement $10 million of gross revenue per annum in combined EVE group entities > 50%
D Achievement of EBITDA of $2 Million per annum in combined EVE group entities > 50%
E Achieving a market capitalisation of $50 Million for 15 consecutive days on which EVE is traded > 50%
The following performance rights are still outstanding at the end of the financial year:
Director Number granted
Year granted Tranche
Fair value per
right
Value at grant date
Expiry date
Expected vesting
year
Maximum value yet
to vest
Gregory Fry 4,800,000 2019 C 0.007 33,600 22-Nov-23 2021 -
Ben Rohr 3,200,000 2019 C 0.007 22,400 22-Nov-23 2021 -
Gregory Fry 3,600,000 2019 D 0.007 25,200 22-Nov-23 2022 6,989
Ben Rohr 2,400,000 2019 D 0.007 16,800 22-Nov-23 2022 4,660
Gregory Fry 3,600,000 2019 E 0.007 25,200 22-Nov-23 2021 -
Ben Rohr 2,400,000 2019 E 0.007 16,800 22-Nov-23 2021 -
George Cameron-Dow 1,500,000 2019 E 0.007 10,500 22-Nov-23 2021 -
Alasdair Cooke 1,500,000 2019 E 0.007 10,500 22-Nov-23 2021 -
Equity instruments held by key management personnel Share holdings
Balance at 1/07/2020
Purchases / Sales
Issued in lieu of
remuneration
Conversion of options /
rights Balance at 30/06/2021
Directors George Cameron-Dow 7,999,980 - - - 7,999,980 Gregory Fry 71,902,622 - - 4,000,000 75,902,622 Alasdair Cooke 185,874,601 - - - 185,874,601 Carlos Jin - - - - - Joalin Chou1 - - - - - James Lin2 - - - - - Key Management Personnel Ben Rohr 30,950,000 - - - 30,950,000
296,727,203 - - 4,000,000 300,727,203

Director’s Report 30 June 2021
22
Performance rights holdings
Balance at
1/07/2020 Issued Converted Lapsed Balance at 30/06/2021 Vested Unvested
Directors George Cameron-Dow 3,000,000 - - (1,500,000) 1,500,000 - 1,500,000 Gregory Fry 22,000,000 (4,000,000) (6,000,000) 12,000,000 - 12,000,000 Alasdair Cooke 3,000,000 - (1,500,000) 1,500,000 - 1,500,000 Carlos Jin - - - - - - - Joalin Chou1 - - - - - - - James Lin2 - - - - - - - Key Management Personnel Ben Rohr 10,250,000 - (2,250,000) - 8,000,000 - 8,000,000
38,250,000 - (6,250,000) (9,000,000) 23,000,000 - 23,000,000
Options holdings
Balance at
1/07/2020 Issued Exercised Balance at 30/06/2021 Vested Unvested
Directors George Cameron-Dow 2,000,000 - - 2,000,000 2,000,000 - Gregory Fry 3,333,332 16,000,000 - 19,333,332 3,333,332 16,000,000 Alasdair Cooke 3,500,000 - - 3,500,000 3,500,000 - Carlos Jin - - - - - - Joalin Chou1 - - - - - - James Lin2 - - - - - - Key Management Personnel - - Ben Rohr 3,700,000 12,000,000 - 15,700,000 3,700,000 12,000,000
12,533,332 28,000,000 - 40,533,332 12,533,332 28,000,000
1 Joalin Chou appointed as a Non-Executive Director effective 21 January 2020 and resigned effective 22 April 2021 2 James Lin was appointed as a Non-Executive Director effective 21 April 2021
Loans to key management personnel
There were no loans made to key management personnel during the year ended 30 June 2021 (2020: nil).
Other transactions with related parties The terms and conditions of the transactions with Directors, key executives and associates and their related entities were no more favourable than those available, or which might reasonably be expected to be available, on similar transactions to non-Director related entities on an arm’s length basis.
Charges from: Charges to:
2021 2020 2021 2020
$ $ $ $ Mitchell River Group Pty Ltd 108,958 210,866 - 2,420 Provision of a serviced office and admin staff African Energy Resources Ltd - - - 315 Recharge of overheads and wages Anova Metals Ltd - - - 34 Recharge of overheads and wages Omniblend Innovation Pty Ltd - - 30,000 106 Recharge of overheads and wages Naturally Australian Products Inc. 38,597 56,920 162,305 31,377 Sale of essential oils and honey, recharge of overheads

Director’s Report 30 June 2021
23
Assets and liabilities arising from the above transactions
2021 2020
$ $ Trade debtors 480 20,424 Loans to associates receivable 352,734 354,686 Trade creditors 16,844 43,048
This is the end of the audited remuneration report.
3. Principal Activities The principal activity of the Group during the financial year was the agricultural operations located in northern NSW and the Meluka Australia business.
4. Operating Results The operating loss after income tax of the Group attributable to equity holders of the Group for the financial year ended 30 June 2021 amounted to $3,630,685 (2020: $2,400,443).
5. Loss per Share The basic loss per share for the Group for the year was 0.09 cents (2020: 0.08 cents) per share.
6. Dividends Paid or Recommended The Directors do not recommend the payment of a dividend and no amount has been paid or declared by way of a dividend to the date of this report.
7. Events Since the End of the Financial Year There are no matters or circumstances have arisen since the end of the financial year which significantly affected or may significantly affect the operations of the Group, the results of those operations, or the state of affairs of the Group in future financial years.
8. Likely Developments and Expected Results of Operations The Group will continue to pursue activities related to the current operations of the Group. Further information about likely developments in the operations of the Group is included in the Review of Operations.
9. Significant Changes in State of Affairs In the opinion of the Directors, other than stated under Review of Operations, and Events Subsequent to Reporting Date, there were no significant changes in the state of affairs of the Group that occurred during the financial year under review and subsequent to the financial year end.
10. Corporate Governance Statement The Company’s Corporate Governance Statement for the year ended 30 June 2021 can be accessed from the Company’s website at www.eveinvestments.com.au/investors-corporate-governance.
11. Environmental Regulations The Group’s operations are not subject to any significant environmental regulations under either Commonwealth or State legislation. However, the Board believes there are adequate systems in place for the management of its environmental requirements and is not aware of any breach of those environmental requirements as they apply.
The Group is not subject to the reporting requirements of both the Energy Efficiency Opportunities Act 2006 and the National Greenhouse and Energy Reporting Act 2007.

Director’s Report 30 June 2021
24
12. Share Options/Rights As at the date of this report, the following unlisted options or performance rights were on issue:
No. of instruments Type of instrument Strike price Expiry date 50,616,665 Unlisted options 0.006 31-Dec-21 39,000,000 Unlisted options 0.016 28-Oct-24 16,000,000 Unlisted options 0.016 26-Nov-24 32,000,000 Performance rights - Various
137,616,665 13. Non-Audit Services The Group may decide to employ the auditor on assignments additional to their statutory audit duties where the auditor’s expertise and experience with the company and/or the Company are important.
During the year, there were no non-audit services provided by BDO Audit (WA) Pty Ltd.
14. Lead Auditors Independence Declaration under Section 307c of the Corporations Act 2001
The lead auditor's independence declaration is set out on page 57 and forms part of the Directors’ Report for the year ended 30 June 2021.
15. Indemnifying Officers Since the end of the previous financial year, the Company has paid insurance premiums in respect of Directors’ and Officers’ liability, legal expenses’ and insurance contracts, for current Directors and Executives of the Company.
On behalf of the Board of
EVE Investments Limited
Dated at Perth this 31 August 2021.
Signed in accordance with a resolution of the Directors.
Gregory William Fry
Managing Director

Directors’ Declaration 30 June 2021
25

Directors’ Declaration 30 June 2021
26
The Directors of the Company declare that:
1) The financial statements, comprising the Consolidated Statement of Profit or Loss and Other Comprehensive Income, Consolidated Statement of Financial Position, Consolidated Statement of Cash Flows, Consolidated Statement of Changes in Equity and accompanying notes, are in accordance with the Corporations Act 2001; and
a) comply with Accounting Standards and the Corporations Regulations 2001 and other mandatory professional reporting requirements; and
b) give a true and fair view of the financial position as at 30 June 2021 and of the performance for the year ended on that date of the Company.
2) In the Directors’ opinion, there are reasonable grounds to believe that the Group will be able to pay its debts as and when they become due and payable.
3) In the Directors’ opinion, the financial statements and notes are prepared in compliance with International Financial Reporting Standards and interpretations adopted by the International Accounting Standards Board, as described in Note 2(a).
4) The Directors have been given the declarations by the Chief Executive Officer and Chief Financial Officer required by section 295A of the Corporations Act 2001.
This declaration is made in accordance with a resolution of the Board of Directors and is signed on behalf of the Directors by:
Gregory William Fry
Managing Director
Perth
31 August 2021
Consolidated Statement of Profit or Loss & Other Comprehensive Income For the year ended 30 June 2021
27

Consolidated Statement of Profit or Loss & Other Comprehensive Income For the year ended 30 June 2021
28
30-Jun-21 30-Jun-20
Note $ $ Revenue 9 2,800,990 2,311,168 Costs of goods sold (1,490,102) (1,437,435)
Gross profit / (loss) before fair value adjustments 1,310,888 873,733 Change in fair value of biological assets 327,078 126,016
Gross profit 1,637,966 999,749
Other income 369,539 274,500 Professional fees 10 (327,205) (281,445) Employee benefit expense 10 (2,243,029) (1,467,231) Share-based payments 10 (186,674) (213,775) Other expenses 10 (2,364,495) (1,657,443) Share of net loss of associates accounted for using the equity
method 3 (468,434) (658,597) Net financial expense (48,349) (217)
Loss before income tax (3,630,685) (3,004,459) Income tax benefit / (expense) 11 - 604,016
Loss after income tax for the year (3,630,685) (2,400,443)
Total comprehensive loss attributable to:
Equity holders of the Company (3,630,685) (2,400,443) Total comprehensive loss for the year (3,630,685) (2,400,443)
Loss per share for loss attributable to the ordinary equity holders of the Company:
Basic and diluted loss per share (cents per share) 12 (0.09) (0.08)
The consolidated statement of profit or loss & other comprehensive income is to be read in conjunction with the accompanying notes.
Consolidated Statement of Financial Position As at 30 June 2021
29
30-Jun-21 30-Jun-20
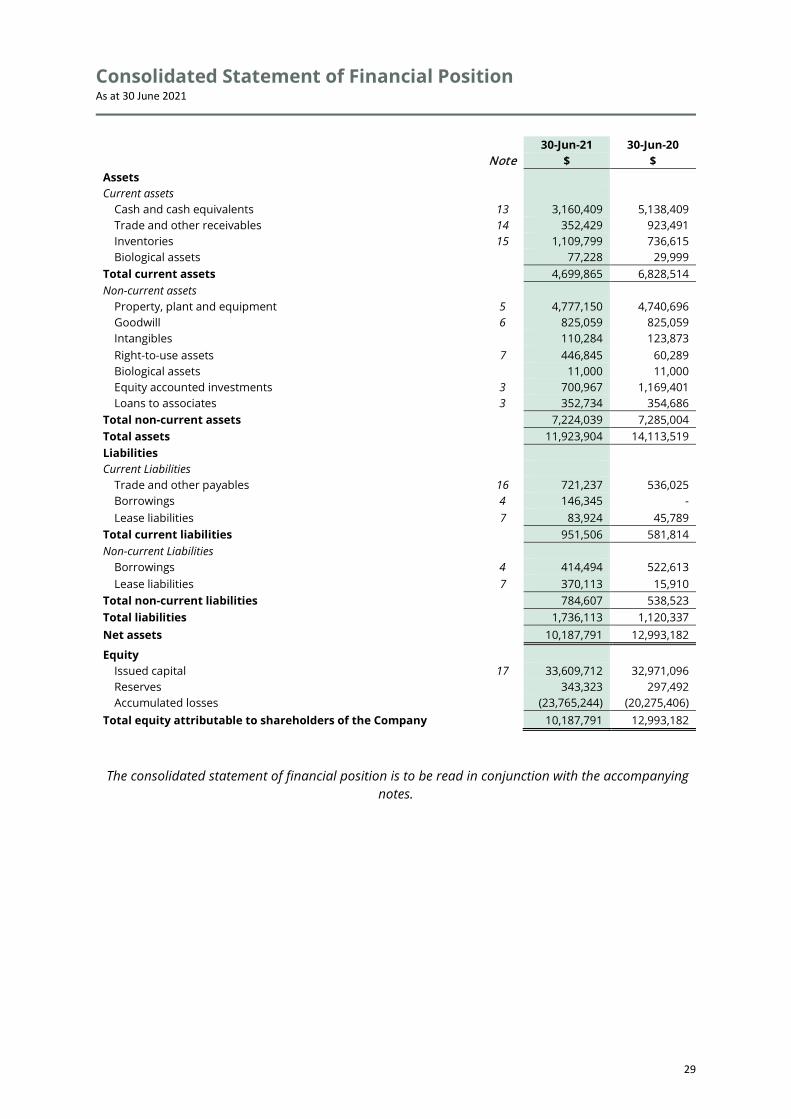
Note $ $ Assets Current assets
Cash and cash equivalents 13 3,160,409 5,138,409 Trade and other receivables 14 352,429 923,491 Inventories 15 1,109,799 736,615 Biological assets 77,228 29,999
Total current assets 4,699,865 6,828,514 Non-current assets
Property, plant and equipment 5 4,777,150 4,740,696 Goodwill 6 825,059 825,059 Intangibles 110,284 123,873 Right-to-use assets 7 446,845 60,289 Biological assets 11,000 11,000 Equity accounted investments 3 700,967 1,169,401 Loans to associates 3 352,734 354,686
Total non-current assets 7,224,039 7,285,004 Total assets 11,923,904 14,113,519 Liabilities Current Liabilities
Trade and other payables 16 721,237 536,025 Borrowings 4 146,345 - Lease liabilities 7 83,924 45,789
Total current liabilities 951,506 581,814 Non-current Liabilities
Borrowings 4 414,494 522,613 Lease liabilities 7 370,113 15,910
Total non-current liabilities 784,607 538,523 Total liabilities 1,736,113 1,120,337 Net assets 10,187,791 12,993,182
Equity Issued capital 17 33,609,712 32,971,096 Reserves 343,323 297,492 Accumulated losses (23,765,244) (20,275,406)
Total equity attributable to shareholders of the Company 10,187,791 12,993,182
The consolidated statement of financial position is to be read in conjunction with the accompanying notes.

Consolidated Statement of Changes in Equity For the year ended 30 June 2021
30
Issued capital
Accumulated losses
Share based
payment reserve
Total equity
$ $ $ $ Total equity at 1 July 2020 32,971,096 (20,275,406) 297,492 12,993,182 Loss for the year - (3,630,685) - (3,630,685) Total comprehensive loss for the year - (3,630,685) - (3,630,685)
Transactions with owners in their capacity as owners: Share issue net of issue costs 638,616 - - 638,616 Share based payments - - 186,674 186,674 Transfer of share based payments on issue - - - - Transfer of share based payments on exercise/expiry - 140,843 (140,843) - 638,616 140,843 45,832 825,290
Total equity at 30 June 2021 33,609,712 (23,765,244) 343,323 10,187,791
Total equity at 1 July 2019 23,602,354 (18,026,687) 273,182 5,848,849 Loss for the year - (2,400,443) - (2,400,443) Total comprehensive loss for the year - (2,400,443) - (2,400,443)
Transactions with owners in their capacity as owners: Share issue net of issue costs 9,331,002 - - 9,331,002 Share based payments (11,594) - 225,369 213,775 Transfer of share based payments on issue 49,333 - (49,333) - Transfer of share based payments on exercise/expiry - 151,726 (151,726) -
9,368,742 151,726 24,310 9,544,777 Total equity at 30 June 2020 32,971,096 (20,275,406) 297,492 12,993,182
The consolidated statement of changes in equity is to be read in conjunction with the accompanying notes.

Consolidated Statement of Cash Flows For the year ended 30 June 2021
31
30-Jun-21 30-Jun-20
Note $ $ Cash flows from operating activities
Receipts from customers 3,263,811 1,767,619 Cash paid to suppliers and employees (5,869,366) (5,060,532) Interest received 26,210 15,390 Interest paid (17,281) (41,303) Other income received 352,582 162,900
Net cash used in operating activities 22 (2,244,044) (3,155,926)
Cash flows from investing activities
Acquisition of property, plant and equipment 5 (263,385) (322,610) Sale of property, plant and equipment 5 - 10,500 Acquisition of businesses - (245,000)
Net cash used by investing activities (263,385) (557,110)
Cash flows from financing activities
Proceeds from the issue of share capital 17 656,500 9,988,631 Payment for share issuance costs 17 (17,884) (657,629) Lease payments (98,883) (31,200) Proceeds from borrowings - 103,193 Repayments of borrowings (10,304) (891,810)
Net cash provided by financing activities 529,429 8,511,185
Cash and cash equivalents at 1 July 5,138,409 340,260
Net increase / (decrease) in cash and cash equivalents (1,978,000) 4,798,149 Cash and cash equivalents at 30 June 13 3,160,409 5,138,409
The consolidated statement of cash flows is to be read in conjunction with the accompanying notes.
Notes to the Consolidated Financial Statements For the year ended 30 June 2021
32
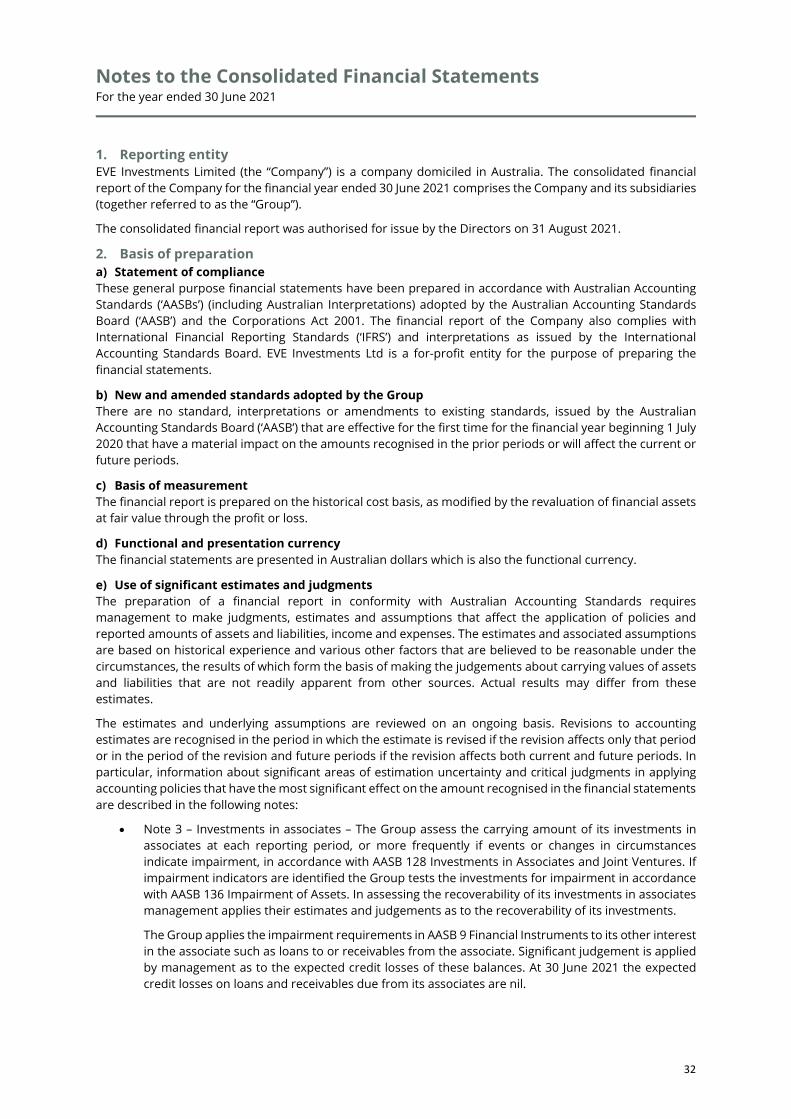
1. Reporting entity EVE Investments Limited (the “Company”) is a company domiciled in Australia. The consolidated financial report of the Company for the financial year ended 30 June 2021 comprises the Company and its subsidiaries (together referred to as the “Group”).
The consolidated financial report was authorised for issue by the Directors on 31 August 2021.
2. Basis of preparation a) Statement of compliance These general purpose financial statements have been prepared in accordance with Australian Accounting Standards (‘AASBs’) (including Australian Interpretations) adopted by the Australian Accounting Standards Board (‘AASB’) and the Corporations Act 2001. The financial report of the Company also complies with International Financial Reporting Standards (‘IFRS’) and interpretations as issued by the International Accounting Standards Board. EVE Investments Ltd is a for-profit entity for the purpose of preparing the financial statements.
b) New and amended standards adopted by the Group There are no standard, interpretations or amendments to existing standards, issued by the Australian Accounting Standards Board (‘AASB’) that are effective for the first time for the financial year beginning 1 July 2020 that have a material impact on the amounts recognised in the prior periods or will affect the current or future periods.
c) Basis of measurement The financial report is prepared on the historical cost basis, as modified by the revaluation of financial assets at fair value through the profit or loss.
d) Functional and presentation currency The financial statements are presented in Australian dollars which is also the functional currency.
e) Use of significant estimates and judgments The preparation of a financial report in conformity with Australian Accounting Standards requires management to make judgments, estimates and assumptions that affect the application of policies and reported amounts of assets and liabilities, income and expenses. The estimates and associated assumptions are based on historical experience and various other factors that are believed to be reasonable under the circumstances, the results of which form the basis of making the judgements about carrying values of assets and liabilities that are not readily apparent from other sources. Actual results may differ from these estimates.
The estimates and underlying assumptions are reviewed on an ongoing basis. Revisions to accounting estimates are recognised in the period in which the estimate is revised if the revision affects only that period or in the period of the revision and future periods if the revision affects both current and future periods. In particular, information about significant areas of estimation uncertainty and critical judgments in applying accounting policies that have the most significant effect on the amount recognised in the financial statements are described in the following notes:
• Note 3 – Investments in associates – The Group assess the carrying amount of its investments in associates at each reporting period, or more frequently if events or changes in circumstances indicate impairment, in accordance with AASB 128 Investments in Associates and Joint Ventures. If impairment indicators are identified the Group tests the investments for impairment in accordance with AASB 136 Impairment of Assets. In assessing the recoverability of its investments in associates management applies their estimates and judgements as to the recoverability of its investments.
The Group applies the impairment requirements in AASB 9 Financial Instruments to its other interest in the associate such as loans to or receivables from the associate. Significant judgement is applied by management as to the expected credit losses of these balances. At 30 June 2021 the expected credit losses on loans and receivables due from its associates are nil.
Notes to the Consolidated Financial Statements For the year ended 30 June 2021
33
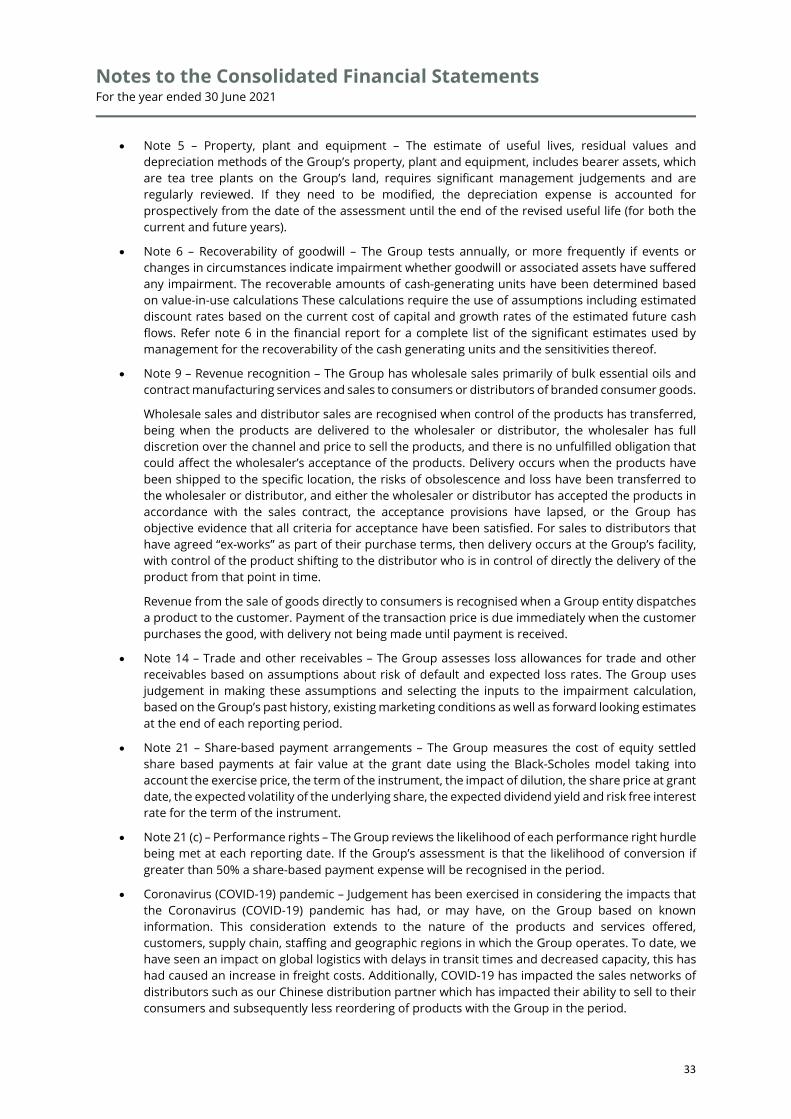
• Note 5 – Property, plant and equipment – The estimate of useful lives, residual values and depreciation methods of the Group’s property, plant and equipment, includes bearer assets, which are tea tree plants on the Group’s land, requires significant management judgements and are regularly reviewed. If they need to be modified, the depreciation expense is accounted for prospectively from the date of the assessment until the end of the revised useful life (for both the current and future years).
• Note 6 – Recoverability of goodwill – The Group tests annually, or more frequently if events or changes in circumstances indicate impairment whether goodwill or associated assets have suffered any impairment. The recoverable amounts of cash-generating units have been determined based on value-in-use calculations These calculations require the use of assumptions including estimated discount rates based on the current cost of capital and growth rates of the estimated future cash flows. Refer note 6 in the financial report for a complete list of the significant estimates used by management for the recoverability of the cash generating units and the sensitivities thereof.
• Note 9 – Revenue recognition – The Group has wholesale sales primarily of bulk essential oils and contract manufacturing services and sales to consumers or distributors of branded consumer goods.
Wholesale sales and distributor sales are recognised when control of the products has transferred, being when the products are delivered to the wholesaler or distributor, the wholesaler has full discretion over the channel and price to sell the products, and there is no unfulfilled obligation that could affect the wholesaler’s acceptance of the products. Delivery occurs when the products have been shipped to the specific location, the risks of obsolescence and loss have been transferred to the wholesaler or distributor, and either the wholesaler or distributor has accepted the products in accordance with the sales contract, the acceptance provisions have lapsed, or the Group has objective evidence that all criteria for acceptance have been satisfied. For sales to distributors that have agreed “ex-works” as part of their purchase terms, then delivery occurs at the Group’s facility, with control of the product shifting to the distributor who is in control of directly the delivery of the product from that point in time.
Revenue from the sale of goods directly to consumers is recognised when a Group entity dispatches a product to the customer. Payment of the transaction price is due immediately when the customer purchases the good, with delivery not being made until payment is received.
• Note 14 – Trade and other receivables – The Group assesses loss allowances for trade and other receivables based on assumptions about risk of default and expected loss rates. The Group uses judgement in making these assumptions and selecting the inputs to the impairment calculation, based on the Group’s past history, existing marketing conditions as well as forward looking estimates at the end of each reporting period.
• Note 21 – Share-based payment arrangements – The Group measures the cost of equity settled share based payments at fair value at the grant date using the Black-Scholes model taking into account the exercise price, the term of the instrument, the impact of dilution, the share price at grant date, the expected volatility of the underlying share, the expected dividend yield and risk free interest rate for the term of the instrument.
• Note 21 (c) – Performance rights – The Group reviews the likelihood of each performance right hurdle being met at each reporting date. If the Group’s assessment is that the likelihood of conversion if greater than 50% a share-based payment expense will be recognised in the period.
• Coronavirus (COVID-19) pandemic – Judgement has been exercised in considering the impacts that the Coronavirus (COVID-19) pandemic has had, or may have, on the Group based on known information. This consideration extends to the nature of the products and services offered, customers, supply chain, staffing and geographic regions in which the Group operates. To date, we have seen an impact on global logistics with delays in transit times and decreased capacity, this has had caused an increase in freight costs. Additionally, COVID-19 has impacted the sales networks of distributors such as our Chinese distribution partner which has impacted their ability to sell to their consumers and subsequently less reordering of products with the Group in the period.
Notes to the Consolidated Financial Statements For the year ended 30 June 2021
34
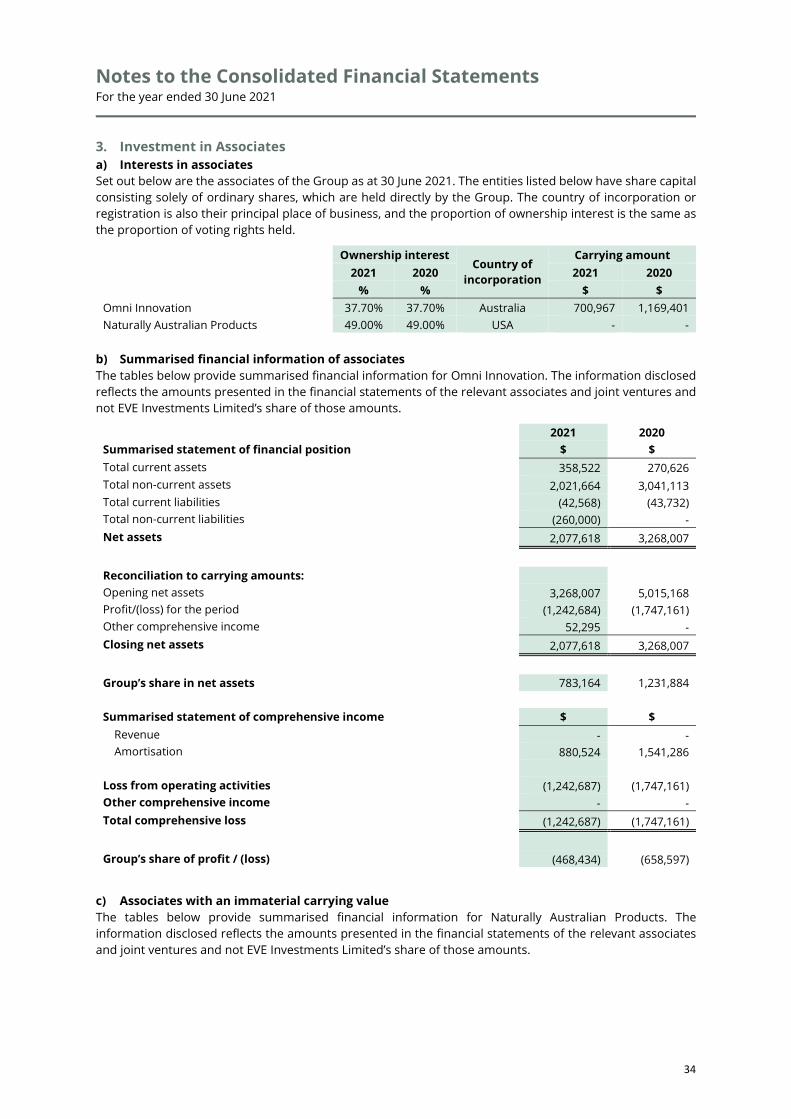
3. Investment in Associates a) Interests in associates Set out below are the associates of the Group as at 30 June 2021. The entities listed below have share capital consisting solely of ordinary shares, which are held directly by the Group. The country of incorporation or registration is also their principal place of business, and the proportion of ownership interest is the same as the proportion of voting rights held.
Ownership interest Country of
incorporation
Carrying amount
2021 2020 2021 2020
% % $ $ Omni Innovation 37.70% 37.70% Australia 700,967 1,169,401 Naturally Australian Products 49.00% 49.00% USA - -
b) Summarised financial information of associates The tables below provide summarised financial information for Omni Innovation. The information disclosed reflects the amounts presented in the financial statements of the relevant associates and joint ventures and not EVE Investments Limited’s share of those amounts.
2021 2020 Summarised statement of financial position $ $ Total current assets 358,522 270,626 Total non-current assets 2,021,664 3,041,113 Total current liabilities (42,568) (43,732) Total non-current liabilities (260,000) - Net assets 2,077,618 3,268,007
Reconciliation to carrying amounts:
Opening net assets 3,268,007 5,015,168 Profit/(loss) for the period (1,242,684) (1,747,161) Other comprehensive income 52,295 - Closing net assets 2,077,618 3,268,007
Group’s share in net assets 783,164 1,231,884
Summarised statement of comprehensive income $ $
Revenue - - Amortisation 880,524 1,541,286
Loss from operating activities (1,242,687) (1,747,161) Other comprehensive income - - Total comprehensive loss (1,242,687) (1,747,161)
Group’s share of profit / (loss) (468,434) (658,597)
c) Associates with an immaterial carrying value The tables below provide summarised financial information for Naturally Australian Products. The information disclosed reflects the amounts presented in the financial statements of the relevant associates and joint ventures and not EVE Investments Limited’s share of those amounts.

Notes to the Consolidated Financial Statements For the year ended 30 June 2021
35
2021 2020 Summarised statement of comprehensive income $ $
Revenue 3,795,631 2,320,074
Profit / (loss) from operating activities 119,577 (77,543) Other comprehensive income - - Total comprehensive profit / (loss) 119,577 (77,543)
Group’s share of unrecognised share of losses of NAP 58,593 (37,996)
d) Loans to associates
2021 2020
$ $ Balance at the beginning of the year 354,686 239,834 Loans to associates - 119,161 Unrealised foreign exchange movement (28,618) 2,806 Amortised financial expense 26,666 (7,115) Balance at the end of the year 352,734 354,686
Loans to associates have a repayment date of 30 June 2023 and have a nil interest rate.
The loans to associates have a fair value of $352,734 (2020: $354,686) and were calculated based on cash flows discounted using an 8% discount rate. The amortised finance expense has been recognised as a financing cost in the year.
4. Borrowings 2021 2020
$ $ Meluka loan (i) 100,613 - Equipment financing (ii) 20,376 - Business loan (iii) 25,356 -
Current borrowings 146,345 -
Meluka loan (i) - 100,613 Equipment financing (ii) 24,634 - Business loan (iii) 389,860 422,000
Non-current borrowings 414,494 522,613
(i) Nil interest rate with a 3-year term, ending in February 2022, no debt covenants. (ii) Equipment financing with nil interest rate and a 3-year term to March 2024. Secured by a charge against the equipment, no debt covenants. (iii) Variable interest rate with a 15-year term, ending in 2034, with principal repayments commencing in 2021. Secured by a mortgage against the Robyndale property, no debt covenants.
Notes to the Consolidated Financial Statements For the year ended 30 June 2021
36
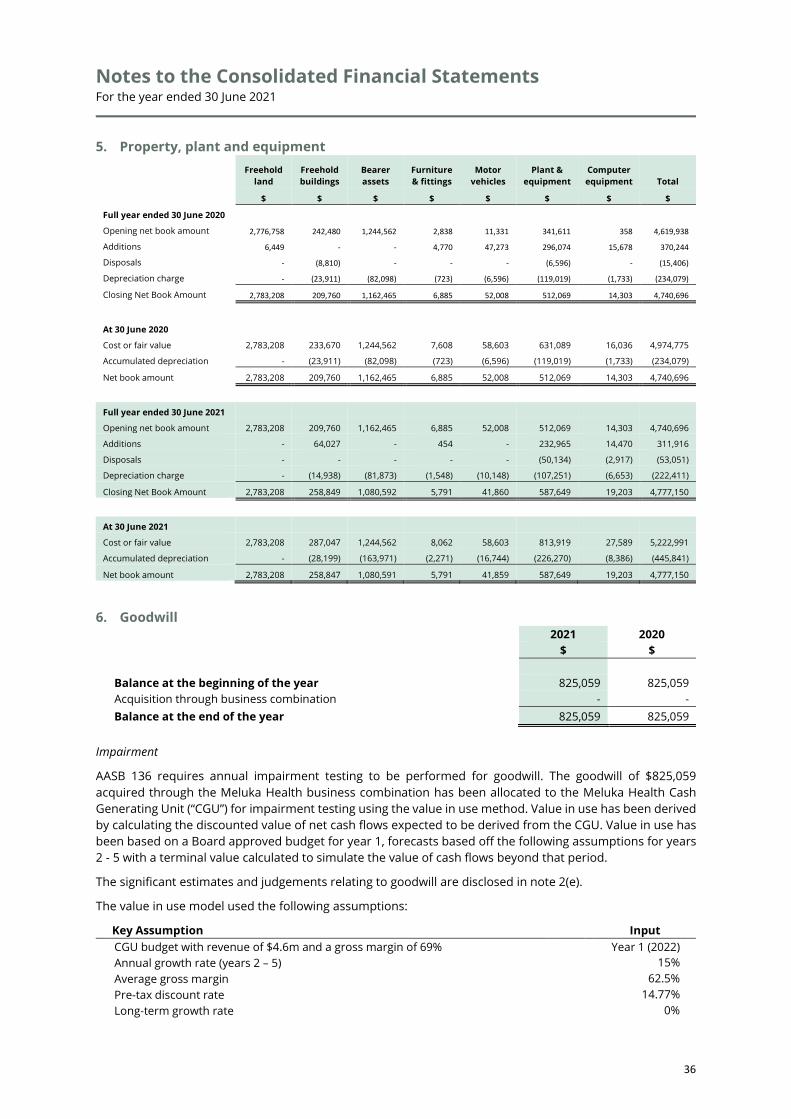
5. Property, plant and equipment
Freehold
land Freehold buildings
Bearer assets
Furniture & fittings
Motor vehicles
Plant & equipment
Computer equipment Total
$ $ $ $ $ $ $ $
Full year ended 30 June 2020 Opening net book amount 2,776,758 242,480 1,244,562 2,838 11,331 341,611 358 4,619,938
Additions 6,449 - - 4,770 47,273 296,074 15,678 370,244
Disposals - (8,810) - - - (6,596) - (15,406)
Depreciation charge - (23,911) (82,098) (723) (6,596) (119,019) (1,733) (234,079)
Closing Net Book Amount 2,783,208 209,760 1,162,465 6,885 52,008 512,069 14,303 4,740,696
At 30 June 2020 Cost or fair value 2,783,208 233,670 1,244,562 7,608 58,603 631,089 16,036 4,974,775
Accumulated depreciation - (23,911) (82,098) (723) (6,596) (119,019) (1,733) (234,079)
Net book amount 2,783,208 209,760 1,162,465 6,885 52,008 512,069 14,303 4,740,696
Full year ended 30 June 2021 Opening net book amount 2,783,208 209,760 1,162,465 6,885 52,008 512,069 14,303 4,740,696
Additions - 64,027 - 454 - 232,965 14,470 311,916
Disposals - - - - - (50,134) (2,917) (53,051)
Depreciation charge - (14,938) (81,873) (1,548) (10,148) (107,251) (6,653) (222,411)
Closing Net Book Amount 2,783,208 258,849 1,080,592 5,791 41,860 587,649 19,203 4,777,150
At 30 June 2021 Cost or fair value 2,783,208 287,047 1,244,562 8,062 58,603 813,919 27,589 5,222,991
Accumulated depreciation - (28,199) (163,971) (2,271) (16,744) (226,270) (8,386) (445,841)
Net book amount 2,783,208 258,847 1,080,591 5,791 41,859 587,649 19,203 4,777,150
6. Goodwill 2021 2020
$ $
Balance at the beginning of the year 825,059 825,059 Acquisition through business combination - - Balance at the end of the year 825,059 825,059
Impairment
AASB 136 requires annual impairment testing to be performed for goodwill. The goodwill of $825,059 acquired through the Meluka Health business combination has been allocated to the Meluka Health Cash Generating Unit (“CGU”) for impairment testing using the value in use method. Value in use has been derived by calculating the discounted value of net cash flows expected to be derived from the CGU. Value in use has been based on a Board approved budget for year 1, forecasts based off the following assumptions for years 2 - 5 with a terminal value calculated to simulate the value of cash flows beyond that period.
The significant estimates and judgements relating to goodwill are disclosed in note 2(e).
The value in use model used the following assumptions:
Key Assumption Input CGU budget with revenue of $4.6m and a gross margin of 69% Year 1 (2022) Annual growth rate (years 2 – 5) 15% Average gross margin 62.5% Pre-tax discount rate 14.77% Long-term growth rate 0%
Notes to the Consolidated Financial Statements For the year ended 30 June 2021
37
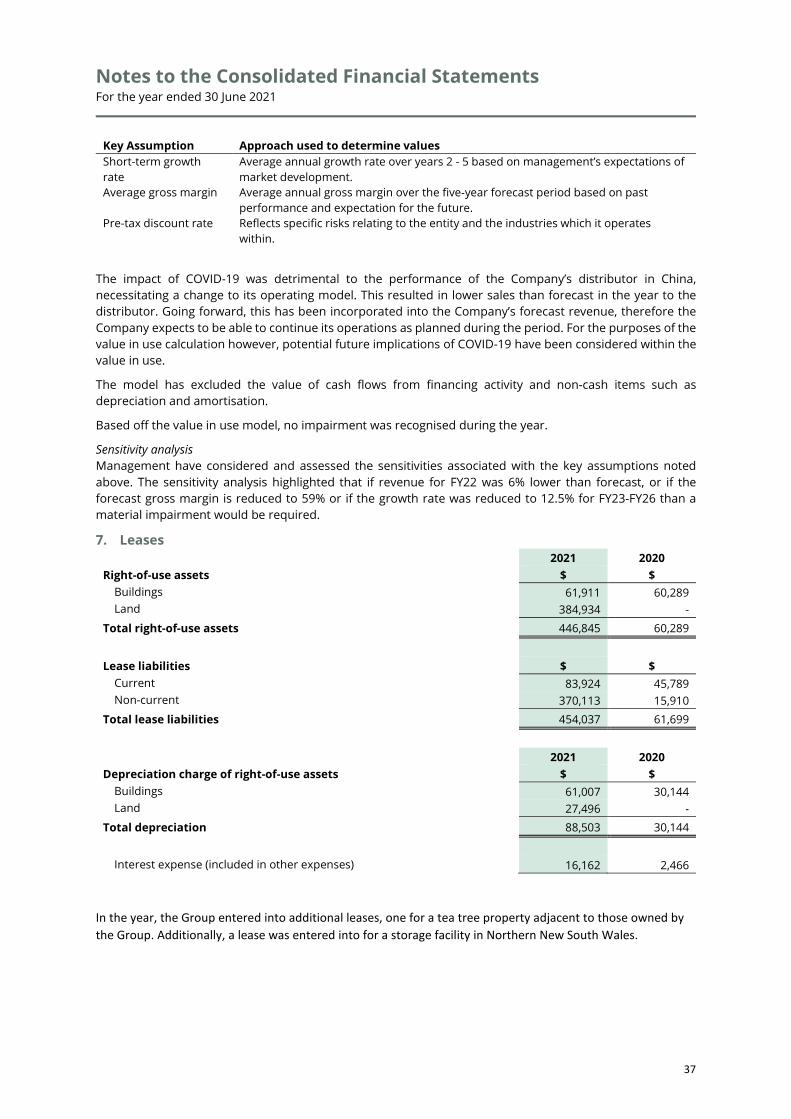
Key Assumption Approach used to determine values Short-term growth rate
Average annual growth rate over years 2 - 5 based on management’s expectations of market development.
Average gross margin Average annual gross margin over the five‐year forecast period based on past performance and expectation for the future.
Pre-tax discount rate Reflects specific risks relating to the entity and the industries which it operates within.
The impact of COVID-19 was detrimental to the performance of the Company’s distributor in China, necessitating a change to its operating model. This resulted in lower sales than forecast in the year to the distributor. Going forward, this has been incorporated into the Company’s forecast revenue, therefore the Company expects to be able to continue its operations as planned during the period. For the purposes of the value in use calculation however, potential future implications of COVID-19 have been considered within the value in use.
The model has excluded the value of cash flows from financing activity and non-cash items such as depreciation and amortisation.
Based off the value in use model, no impairment was recognised during the year.
Sensitivity analysis Management have considered and assessed the sensitivities associated with the key assumptions noted above. The sensitivity analysis highlighted that if revenue for FY22 was 6% lower than forecast, or if the forecast gross margin is reduced to 59% or if the growth rate was reduced to 12.5% for FY23-FY26 than a material impairment would be required.
7. Leases 2021 2020 Right-of-use assets $ $
Buildings 61,911 60,289 Land 384,934 -
Total right-of-use assets 446,845 60,289
Lease liabilities $ $
Current 83,924 45,789 Non-current 370,113 15,910
Total lease liabilities 454,037 61,699
2021 2020 Depreciation charge of right-of-use assets $ $
Buildings 61,007 30,144 Land 27,496 -
Total depreciation 88,503 30,144
Interest expense (included in other expenses) 16,162 2,466
In the year, the Group entered into additional leases, one for a tea tree property adjacent to those owned by the Group. Additionally, a lease was entered into for a storage facility in Northern New South Wales.
Notes to the Consolidated Financial Statements For the year ended 30 June 2021
38
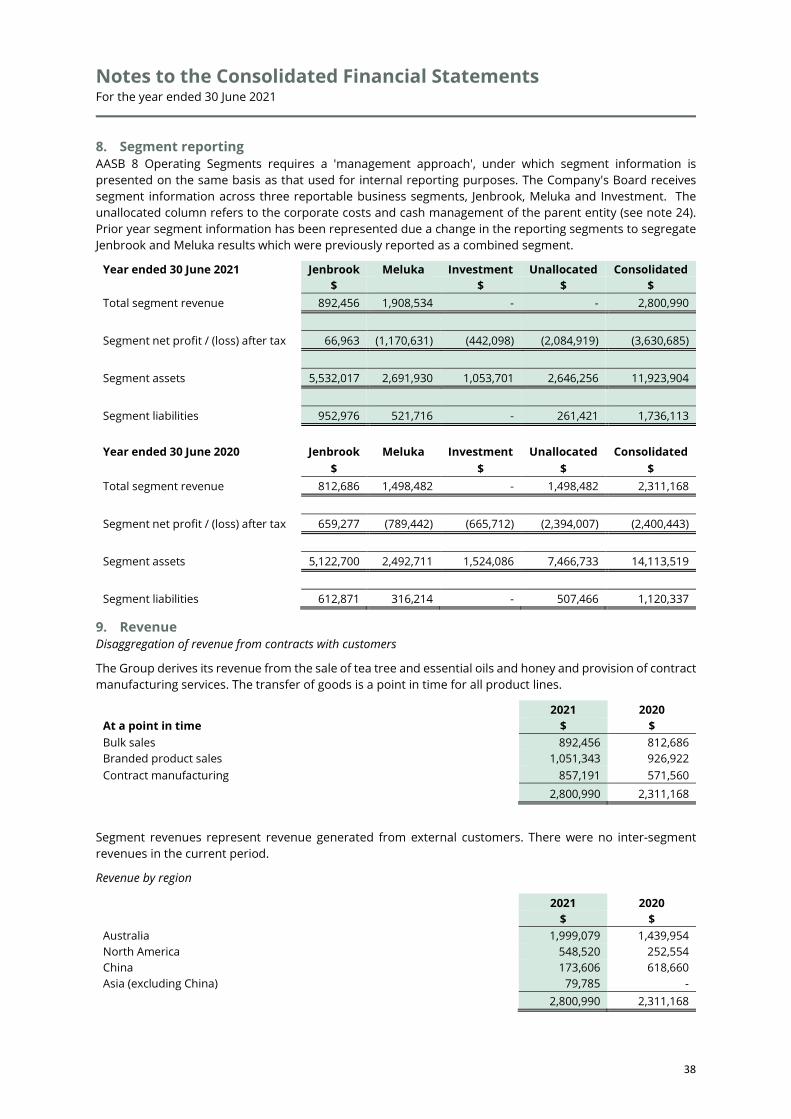
8. Segment reporting AASB 8 Operating Segments requires a 'management approach', under which segment information is presented on the same basis as that used for internal reporting purposes. The Company's Board receives segment information across three reportable business segments, Jenbrook, Meluka and Investment. The unallocated column refers to the corporate costs and cash management of the parent entity (see note 24). Prior year segment information has been represented due a change in the reporting segments to segregate Jenbrook and Meluka results which were previously reported as a combined segment.
Year ended 30 June 2021 Jenbrook Meluka Investment Unallocated Consolidated
$ $ $ $ Total segment revenue 892,456 1,908,534 - - 2,800,990
Segment net profit / (loss) after tax 66,963 (1,170,631) (442,098) (2,084,919) (3,630,685)
Segment assets 5,532,017 2,691,930 1,053,701 2,646,256 11,923,904
Segment liabilities 952,976 521,716 - 261,421 1,736,113
Year ended 30 June 2020 Jenbrook Meluka Investment Unallocated Consolidated
$ $ $ $ Total segment revenue 812,686 1,498,482 - 1,498,482 2,311,168
Segment net profit / (loss) after tax 659,277 (789,442) (665,712) (2,394,007) (2,400,443)
Segment assets 5,122,700 2,492,711 1,524,086 7,466,733 14,113,519
Segment liabilities 612,871 316,214 - 507,466 1,120,337
9. Revenue Disaggregation of revenue from contracts with customers
The Group derives its revenue from the sale of tea tree and essential oils and honey and provision of contract manufacturing services. The transfer of goods is a point in time for all product lines.
2021 2020 At a point in time $ $ Bulk sales 892,456 812,686 Branded product sales 1,051,343 926,922 Contract manufacturing 857,191 571,560
2,800,990 2,311,168
Segment revenues represent revenue generated from external customers. There were no inter-segment revenues in the current period.
Revenue by region
2021 2020
$ $ Australia 1,999,079 1,439,954 North America 548,520 252,554 China 173,606 618,660 Asia (excluding China) 79,785 -
2,800,990 2,311,168

Notes to the Consolidated Financial Statements For the year ended 30 June 2021
39
Revenue from China of $173,606 (2020: $618,660) was derived from Hunan Yandi Biological Engineering Co., Ltd and comprised honey and essential oil sales which represented 6% of total revenue (2020: 27%).
Revenue is recognised when or as the Group transfers control of goods or services to a customer at the amount to which the Group expects to be entitled. If the consideration promised includes a variable component, the Group estimates the expected consideration for the estimated impact of the variable component at the point of recognition and re-estimated at every reporting period.
The Group primarily generates revenue from the bulk sale of tea tree oil and essential oils, branded products (Meluka Australia) and contract manufacturing.
Revenue from the sale of these goods is recognised when control over the inventory has transferred to the customer. Control is generally considered to have passed when:
• physical possession and inventory risk is transferred (including via a third-party transport provider);
• payment terms for the sale of goods can be clearly identified through invoices issued to customers; and
• the customer has no practical ability to reject the product where it is within contractually specified limits.
10. Expenses from continuing operations 2021 2020
$ $ Professional fees Audit fees 69,755 73,207 Tax consulting services 31,559 25,480 Legal costs 10,242 16,044 Corporate consultants 33,900 71,524 Other professional fees 181,749 95,190
327,205 281,445
Employee benefit expense Wages 1,652,043 1,029,602 Directors fees 543,145 355,772 Directors fees - equity settled - 63,632 Share based payments expense 186,674 213,775 Payroll tax 43,526 16,438 Fringe benefits tax 4,315 1,785
2,429,705 1,681,006
Other expenses Corporate costs 72,490 61,912 Premises and insurance 441,080 278,608 Marketing expenses 1,245,076 670,144 Travelling costs 16,981 137,394 Financing costs (26,336) 7,115 Depreciation - property, plant and equipment 222,411 234,079 Depreciation - right-to-use assets 88,503 30,144 Amortisation 13,589 13,589 Gain / (loss) on sale of assets 2,917 (3,244) Other operating expenses 287,784 227,701
2,364,495 1,657,443
Notes to the Consolidated Financial Statements For the year ended 30 June 2021
40
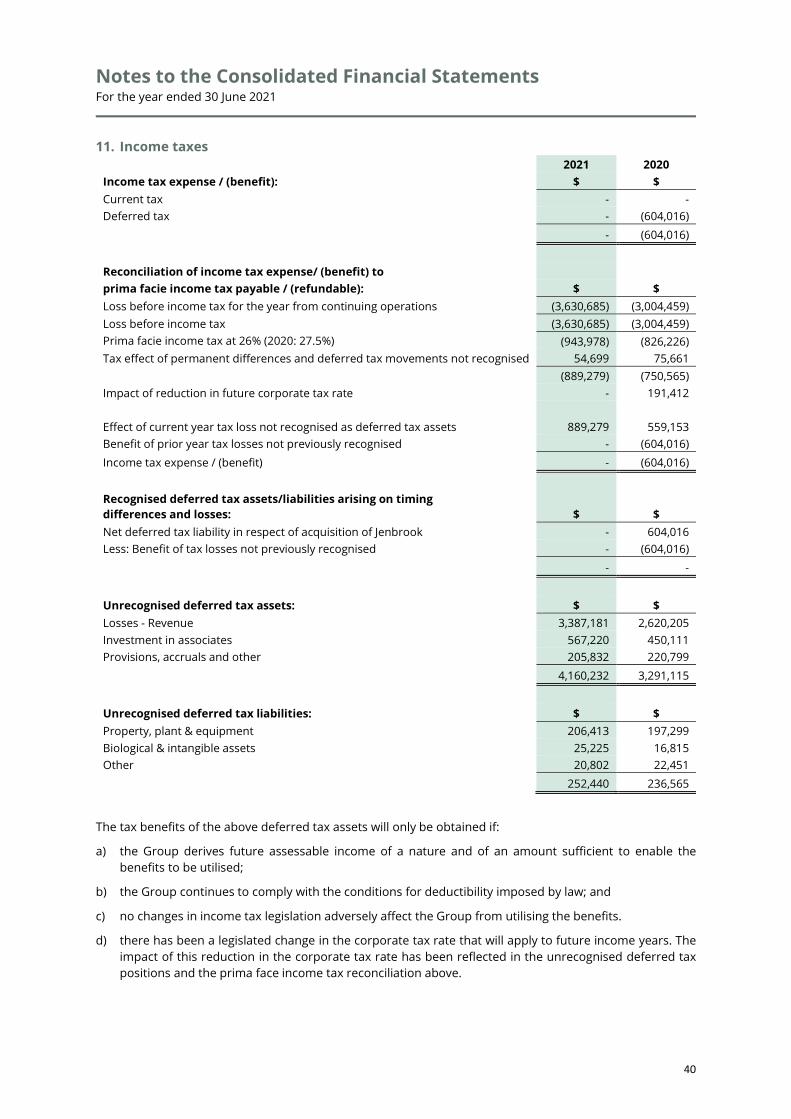
11. Income taxes 2021 2020 Income tax expense / (benefit): $ $ Current tax - - Deferred tax - (604,016)
- (604,016)
Reconciliation of income tax expense/ (benefit) to prima facie income tax payable / (refundable): $ $ Loss before income tax for the year from continuing operations (3,630,685) (3,004,459) Loss before income tax (3,630,685) (3,004,459) Prima facie income tax at 26% (2020: 27.5%) (943,978) (826,226) Tax effect of permanent differences and deferred tax movements not recognised 54,699 75,661
(889,279) (750,565) Impact of reduction in future corporate tax rate - 191,412
Effect of current year tax loss not recognised as deferred tax assets 889,279 559,153 Benefit of prior year tax losses not previously recognised - (604,016) Income tax expense / (benefit) - (604,016)
Recognised deferred tax assets/liabilities arising on timing differences and losses:
$ $
Net deferred tax liability in respect of acquisition of Jenbrook - 604,016 Less: Benefit of tax losses not previously recognised - (604,016)
- -
Unrecognised deferred tax assets: $ $ Losses - Revenue 3,387,181 2,620,205 Investment in associates 567,220 450,111 Provisions, accruals and other 205,832 220,799
4,160,232 3,291,115
Unrecognised deferred tax liabilities: $ $ Property, plant & equipment 206,413 197,299 Biological & intangible assets 25,225 16,815 Other 20,802 22,451
252,440 236,565
The tax benefits of the above deferred tax assets will only be obtained if:
a) the Group derives future assessable income of a nature and of an amount sufficient to enable the benefits to be utilised;
b) the Group continues to comply with the conditions for deductibility imposed by law; and
c) no changes in income tax legislation adversely affect the Group from utilising the benefits.
d) there has been a legislated change in the corporate tax rate that will apply to future income years. The impact of this reduction in the corporate tax rate has been reflected in the unrecognised deferred tax positions and the prima face income tax reconciliation above.
Notes to the Consolidated Financial Statements For the year ended 30 June 2021
41
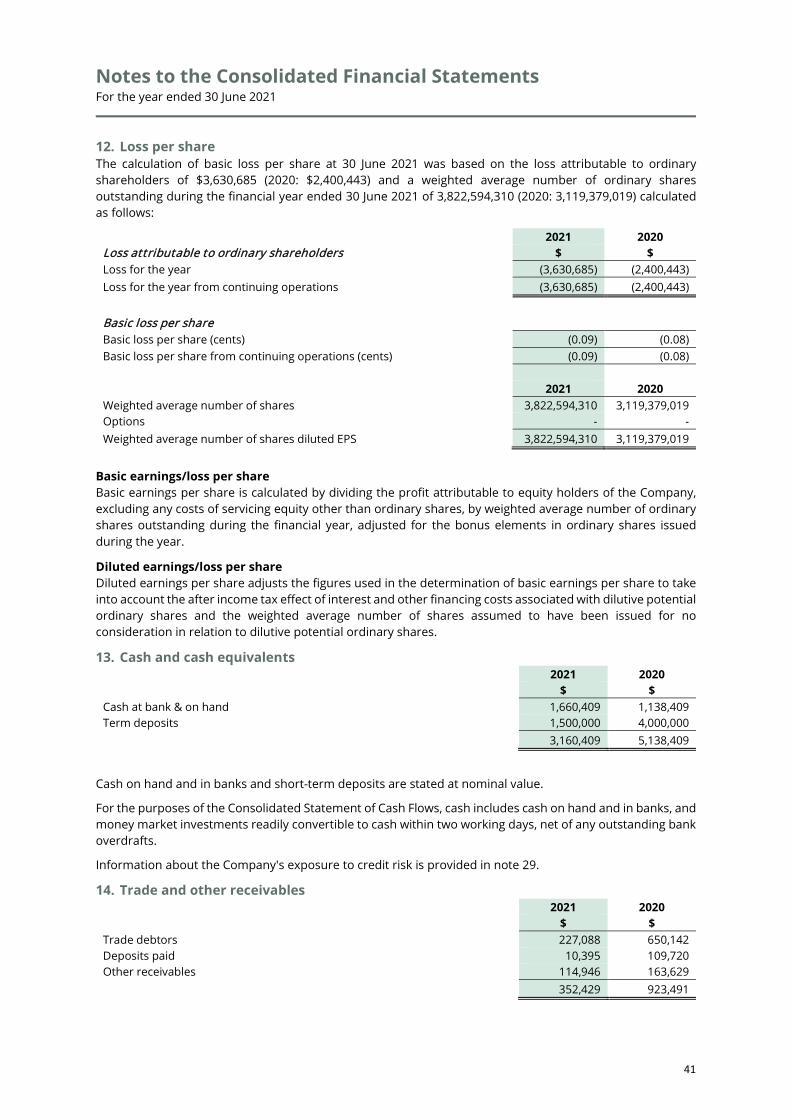
12. Loss per share The calculation of basic loss per share at 30 June 2021 was based on the loss attributable to ordinary shareholders of $3,630,685 (2020: $2,400,443) and a weighted average number of ordinary shares outstanding during the financial year ended 30 June 2021 of 3,822,594,310 (2020: 3,119,379,019) calculated as follows:
2021 2020 Loss attributable to ordinary shareholders $ $ Loss for the year (3,630,685) (2,400,443) Loss for the year from continuing operations (3,630,685) (2,400,443)
Basic loss per share Basic loss per share (cents) (0.09) (0.08) Basic loss per share from continuing operations (cents) (0.09) (0.08)
2021 2020
Weighted average number of shares 3,822,594,310 3,119,379,019 Options - - Weighted average number of shares diluted EPS 3,822,594,310 3,119,379,019
Basic earnings/loss per share Basic earnings per share is calculated by dividing the profit attributable to equity holders of the Company, excluding any costs of servicing equity other than ordinary shares, by weighted average number of ordinary shares outstanding during the financial year, adjusted for the bonus elements in ordinary shares issued during the year.
Diluted earnings/loss per share Diluted earnings per share adjusts the figures used in the determination of basic earnings per share to take into account the after income tax effect of interest and other financing costs associated with dilutive potential ordinary shares and the weighted average number of shares assumed to have been issued for no consideration in relation to dilutive potential ordinary shares.
13. Cash and cash equivalents 2021 2020
$ $ Cash at bank & on hand 1,660,409 1,138,409 Term deposits 1,500,000 4,000,000
3,160,409 5,138,409
Cash on hand and in banks and short-term deposits are stated at nominal value.
For the purposes of the Consolidated Statement of Cash Flows, cash includes cash on hand and in banks, and money market investments readily convertible to cash within two working days, net of any outstanding bank overdrafts.
Information about the Company's exposure to credit risk is provided in note 29.
14. Trade and other receivables 2021 2020
$ $ Trade debtors 227,088 650,142 Deposits paid 10,395 109,720 Other receivables 114,946 163,629
352,429 923,491
Notes to the Consolidated Financial Statements For the year ended 30 June 2021
42
Trade receivables are recognised initially at fair value and subsequently measured at amortised cost using the effective interest method, less expected credit losses. Trade receivables are generally due for settlement within 30 days.
Information about the Company’s exposure to credit risk is provided in note 29. $1,956 of receivables held by the Company are past due and not impaired, there are no receivables held by the Company that are past due and impaired.
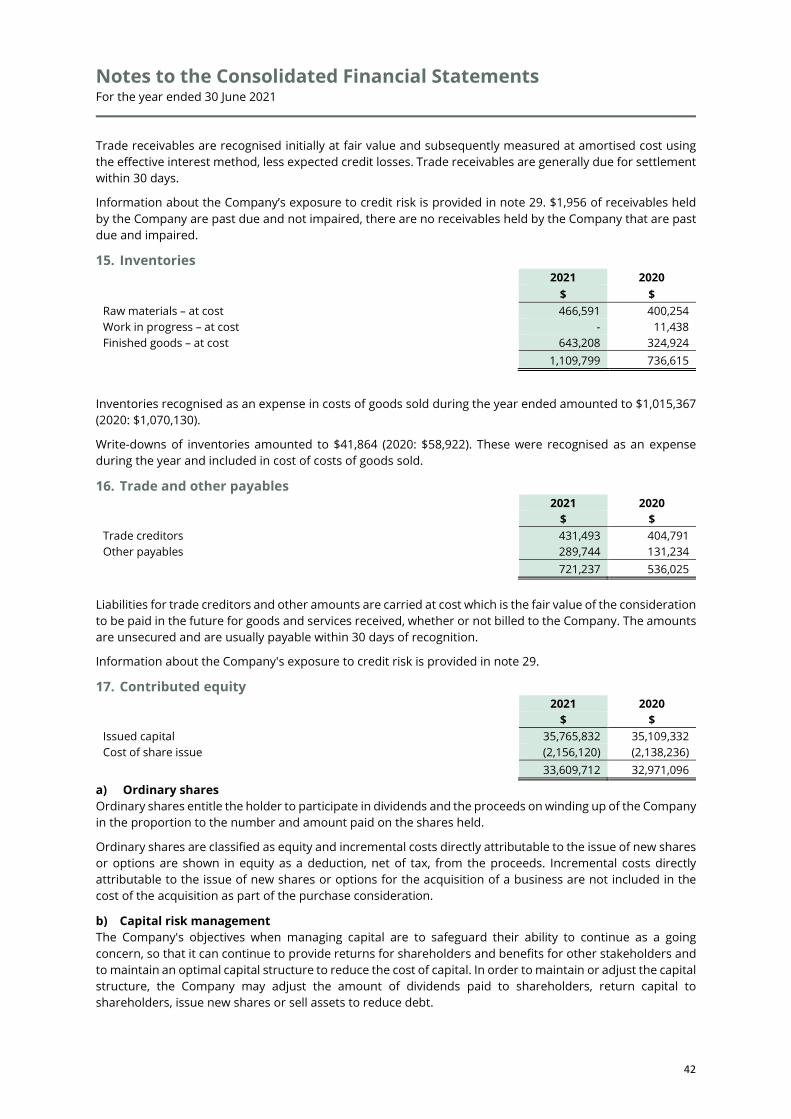
15. Inventories 2021 2020
$ $ Raw materials – at cost 466,591 400,254 Work in progress – at cost - 11,438 Finished goods – at cost 643,208 324,924
1,109,799 736,615
Inventories recognised as an expense in costs of goods sold during the year ended amounted to $1,015,367 (2020: $1,070,130).
Write-downs of inventories amounted to $41,864 (2020: $58,922). These were recognised as an expense during the year and included in cost of costs of goods sold.
16. Trade and other payables 2021 2020
$ $ Trade creditors 431,493 404,791 Other payables 289,744 131,234
721,237 536,025
Liabilities for trade creditors and other amounts are carried at cost which is the fair value of the consideration to be paid in the future for goods and services received, whether or not billed to the Company. The amounts are unsecured and are usually payable within 30 days of recognition.
Information about the Company's exposure to credit risk is provided in note 29.
17. Contributed equity 2021 2020
$ $ Issued capital 35,765,832 35,109,332 Cost of share issue (2,156,120) (2,138,236)
33,609,712 32,971,096
a) Ordinary shares Ordinary shares entitle the holder to participate in dividends and the proceeds on winding up of the Company in the proportion to the number and amount paid on the shares held.
Ordinary shares are classified as equity and incremental costs directly attributable to the issue of new shares or options are shown in equity as a deduction, net of tax, from the proceeds. Incremental costs directly attributable to the issue of new shares or options for the acquisition of a business are not included in the cost of the acquisition as part of the purchase consideration.
b) Capital risk management The Company's objectives when managing capital are to safeguard their ability to continue as a going concern, so that it can continue to provide returns for shareholders and benefits for other stakeholders and to maintain an optimal capital structure to reduce the cost of capital. In order to maintain or adjust the capital structure, the Company may adjust the amount of dividends paid to shareholders, return capital to shareholders, issue new shares or sell assets to reduce debt.

Notes to the Consolidated Financial Statements For the year ended 30 June 2021
43
Movement in share capital
2021 Number of shares
Issue price
AUD
01 Jul 2020 Opening balance 3,726,225,222 32,971,096 21 Aug 2020 Conversion of options 76,766,667 0.006 460,600 03 Sep 2020 Conversion of options 20,000,000 0.006 120,000 30 Sep 2020 Conversion of performance rights 7,500,000 0.000 - 30 Sep 2020 Placement 1 0.006 - 28 Oct 2020 Conversion of options 12,650,000 0.006 75,900 Capital raising costs (17,884) 30 June 2021 Closing balance 3,843,141,890 33,609,712
2020 Number of shares
Issue price
AUD
01 Jul 2019 Opening balance 2,393,314,323 23,602,354 19 Jul 2019 Placement 112,700,000 0.005 563,500 02 Oct 2019 Placement 25,000,000 0.005 125,000 02 Oct 2019 Shares issued under ESP 12,333,332 0.004 49,333 02 Oct 2019 Conversion of performance rights 9,250,000 0.000 - 10 Dec 2019 Placement 482,228,998 0.005 2,411,145 15 Jan 2020 Placement 688,898,569 0.010 6,888,986 03 Mar 2020 Conversion of performance rights 2,500,000 0.000 -
Capital raising costs (669,222) 30 June 2020 Closing balance 3,726,225,222 32,971,096
18. Dividends The Directors do not recommend the payment of a dividend and no amount has been paid or declared by way of a dividend to the date of this report.
19. Remuneration of auditor During the year the following fees were paid or payable for services provided by the auditor of the Company, its related practices and non-related audit firms:
2021 2020 $ $
Auditors of the Company BDO Audit (WA) Pty Ltd: Audit and review of financial reports 69,755 73,207 Total auditors’ remuneration 69,755 73,207
20. Related parties a) Loans to key management personnel There were no loans made to key management personnel during the year ended 30 June 2021 (2020: nil).
b) Key management personnel compensation 2021 2020
$ $ Short-term employee benefits 735,826 601,616 Post-employment benefits 51,007 17,786 Equity compensation benefits 106,550 166,467
893,383 785,869

Notes to the Consolidated Financial Statements For the year ended 30 June 2021
44
c) Other transactions with related parties of the Company The terms and conditions of the transactions with Directors, key executives and associates and their related entities were no more favourable than those available, or which might reasonably be expected to be available, on similar transactions to non-Director related entities on an arm’s length basis.
Charges from: Charges to:
2021 2020 2021 2020
$ $ $ $ Mitchell River Group Pty Ltd 1 108,958 210,866 - 2,420 Provision of a serviced office and admin staff African Energy Resources Ltd 2 - - - 315 Recharge of overheads and wages Anova Metals Ltd 1 - - - 34 Recharge of overheads and wages Omniblend Innovation Pty Ltd 3 - - 30,000 106 Recharge of overheads and wages Naturally Australian Products Inc. 4 38,597 56,920 162,305 31,377 Sale of essential oils and honey, recharge of overheads
1 Alasdair Cooke and Gregory (Bill) Fry are common directors between EVE and the related party. 2 Alasdair Cooke is a common director between EVE and the related party. 3 George Cameron-Dow and Gregory (Bill) Fry are common directors between EVE and the related party and EVE holds at 38% interest. 4 EVE holds at 49% interest in the Company.
d) Assets and liabilities arising from the above transactions
2021 2020
$ $ Trade debtors 480 20,424 Loans to associates receivable 352,734 354,686 Trade creditors 16,844 43,048
21. Share-based payments Equity-settled share-based payments are measured at fair value at the date of grant. Fair value is measured by use of a Black-Scholes option pricing model. The expected life used in the model has been adjusted, based on management’s best estimate, for the effects of non-transferability, exercise restrictions, and behavioural considerations.
The fair value determined at the grant date of the equity-settled share-based payments is expensed on a straight-line basis over the vesting period, based on the Company’s estimate of shares that will eventually vest.
For cash-settled share-based payments, a liability equal to the portion of the goods or services received is recognised at the current fair value determined at each reporting date.
2021 2020
$ $ Broker options (a) - 11,594 Total capitalised - 11,594 Shares in lieu (b) - 49,333 Options in lieu (b) - 14,299 Performance rights (c) 66,759 150,143 Options (d) 119,915 - Total expensed 186,674 213,775

Notes to the Consolidated Financial Statements For the year ended 30 June 2021
45
a) Broker options On 2 October 2019 the Company issued 10,000,000 broker options related to the placement completed on the same date. The value of the options was $11,594 and was derived from a Black-Scholes calculation taking into account the underlying share price on the grant date of $0.004, a volatility of 100% and a risk free rate of 0.75%.
b) Shares and options in lieu On 2 October 2019, the Company issued ordinary shares and attaching options with an exercise price of $0.006 and an expiry of 31 December 2021 in consideration for accrued director fees, in line with the terms of the capital raising announced on 12 July 2019.
The number of securities and the fair value on the grant date is detailed below:
Shares received Value of shares
received Options received
Value of options received
Directors George Cameron-Dow 2,000,000 8,000 2,000,000 2,319 Gregory Fry 3,333,332 13,333 3,333,332 3,865 Alasdair Cooke 3,500,000 14,000 3,500,000 4,058 Michael Pixley 3,500,000 14,000 3,500,000 4,058
12,333,332 49,333 12,333,332 14,300
c) Performance rights plan The EVE Performance Rights Plan is designed to provide long-term incentives for senior managers and above (including the Managing Director) to deliver long-term shareholder returns. Participation in the plan is at the Board’s discretion and no individual has a contractual right to participate in the plan or to receive any guaranteed benefits.
Performance Rights are granted under the plan for no consideration. Performance Rights granted under the plan carry no dividend or voting rights. When vested, each performance right is convertible into one ordinary share.
The terms and conditions of each grant of performance rights affecting remuneration in the current or future period are as follows:
Issue Date Expiry date Tranche
Number granted
Value at grant date
$ Vested
in year $ Vested at 30
June 2021
Unvested at 30 June
2021 3-May-16 3-May-21 A 5,250,000 65,864 - - - 22-Nov-18 22-Nov-23 B 7,500,000 52,500 7,124 7,500,000 - 22-Nov-18 22-Nov-23 C 11,600,000 81,200 31,165 - 11,600,000 22-Nov-18 22-Nov-23 D 8,700,000 60,900 16,891 - 8,700,000 22-Nov-18 22-Nov-23 E 11,700,000 92,400 11,580 - 11,700,000
44,750,000 352,864 66,760 7,500,000 32,000,000
Tranche Hurdle Likelihood
A Omni Innovation completing an IPO or RTO on the ASX or an alternative Board approved exchange or the Trade Sale of Omni Innovation’s main business
Not Met
B Continuous service until 30 September 2020 Met C Achievement $10 million of gross revenue per annum in combined EVE group entities > 50% D Achievement of EBITDA of $2 Million per annum in combined EVE group entities > 50%
E Achieving a market capitalisation of $50 Million for 15 consecutive days on which EVE is traded
> 50%
The fair value of the performance rights granted during the year is $nil (2020: $nil). The grant date fair value is based off the underlying share price on the date of issue and for performance rights with market conditions this is adjusted to include the likelihood of the performance right hurdle being met. At each reporting date

Notes to the Consolidated Financial Statements For the year ended 30 June 2021
46
for performance rights with non-market conditions the likelihood of each performance right hurdle is reviewed by management and the share-based payment adjusted accordingly. During the year $66,760 (2020 $150,143) of expense was recorded. This value was based off the underlying share price on the date of issue and likelihood of the performance right hurdle being met. The weighted average remaining contractual life of the performance rights outstanding is 2.4 years (2020: 2.8 years).
d) Options
Issue Date Expiry date Tranche
Number granted
Value at grant date
$ Vested in
year $
Vested at 30 June
2021
Unvested at 30 June
2021 28-Oct-20 28-Oct-24 A 17,000,000 67,845 47,492 - 17,000,000 28-Oct-20 28-Oct-24 B 17,000,000 76,117 26,082 - 17,000,000 26-Nov-20 26-Nov-24 A 8,000,000 31,534 21,219 - 8,000,000 26-Nov-20 26-Nov-24 B 8,000,000 35,464 11,167 - 8,000,000 28-Oct-20 28-Oct-24 C 2,500,000 9,593 9,593 - 2,500,000 28-Oct-20 28-Oct-24 D 2,500,000 10,861 4,362 - 2,500,000
55,000,000 231,415 119,915 - 55,000,000
Tranche Hurdle Likelihood
A Continuous service until 13 October 2021 > 50% B Continuous service until 13 October 2022 > 50% C Achievement of budgeted gross revenue for FY21 Not Met D Achievement of budgeted gross revenue for FY22 > 50%
The fair value of the options granted during the year is $231,415 (2020: $nil). The value is calculated based off the following inputs:
Tranche A A B B C D Issue Date 28-Oct-20 26-Nov-20 28-Oct-20 26-Nov-20 28-Oct-20 28-Oct-20 Number of Options 17,000,000 8,000,000 17,000,000 8,000,000 2,500,000 2,500,000 Dividend yield (%) - - - - - - Expected volatility (%) 100% 100% 100% 100% 100% 100% Risk free interest rate (%) 0.25% 0.10% 0.25% 0.10% 0.10% 0.10% Expected life of the option (years) 3 3 3 3 3 3 Option exercise price ($) 0.016 0.016 0.016 0.016 0.016 0.016 Share price at grant date ($) 0.009 0.009 0.009 0.009 0.009 0.009 Fair value per option ($) 0.0040 0.0039 0.0045 0.0044 0.0038 0.0043
Total value at grant date ($) 67,845 31,534 76,117 35,464 9,593 10,861
During the year $119,915 (2020: $nil) of expense was recorded. The weighted average remaining contractual life of the options outstanding is 3.35 years (2020: nil years).
Detailed remuneration disclosures are provided in the remuneration report on pages 16 - 23.

Notes to the Consolidated Financial Statements For the year ended 30 June 2021
47
22. Cash flow information a) Reconciliation of loss after income tax to net cash used in operating activities
30-Jun-21 30-Jun-20
$ $ Loss for the year from continuing operations (3,630,685) (2,400,443)
Adjustments for: Share of losses in associates 468,434 658,597 Fair value movement on biological assets (327,078) (126,016) Fair value in costs of goods sold 279,849 - Movement in deferred tax asset - (604,016) Financing costs (26,666) 7,115 Depreciation expense 310,913 264,223 Amortisation expense 13,589 13,589 Bad debts expense 995 - Gain on sale of property, plant & equipment 2,917 3,244 Net foreign exchange gains / (losses) 28,618 (2,807) Equity-settled share-based payment expenses 186,674 213,775
Change in operating assets and liabilities (2,692,439) (1,972,739) (Increase)/decrease in trade and other receivables 558,996 (519,924) (Increase)/decrease in inventories (373,183) (631,024) (Decrease)/increase in trade and other payables 262,582 (32,240)
Net cash used in operating activities (2,244,044) (3,155,927)
b) Non-cash investing and financing activities
30-Jun-21 30-Jun-20
$ $ Settlement of capital raising cost through the issue of options - 11,594
c) Net debt reconciliation This section sets out an analysis of net debt and the movements in net debt for each of the periods presented.
30-Jun-21 30-Jun-20
$ $ Cash and cash equivalents 3,160,409 5,138,409 Borrowings (560,839) (522,613) Lease liabilities (454,037) (61,699)
Net debt 2,145,533 4,554,097
Borrowings Leases Cash Total
$ $ $ $ Net debt at 30 June 2019 (1,299,861) - 340,260 (959,601)
Cash flows 788,617 28,734 4,798,149 5,615,499 New leases - (90,433) - (90,433) Other changes (11,369) - - (11,369)
Net debt at 30 June 2020 (522,613) (61,699) 5,138,409 4,554,097
Cash flows 10,304 98,883 (1,978,000) (1,868,813) New leases - (491,221) - (491,221) Other changes (48,530) - - (48,530)
Net debt at 30 June 2021 (560,839) (454,037) 3,160,409 2,145,533

Notes to the Consolidated Financial Statements For the year ended 30 June 2021
48
23. Interests in Subsidiaries The consolidated financial statements include the financial statements of EVE Investments Limited and the subsidiaries listed in the following table:
Direct subsidiaries of the parent
Country of incorporation
Equity Equity holding holding
30-Jun-21 30-Jun-20 % %
Jenbrook Pty Ltd AUS 100 100 Meluka Health Pty Ltd AUS 100 100 Indirect subsidiaries (Direct subsidiaries of Jenbrook Pty Ltd – 100%) Jenbrook Trading Pty Ltd AUS 100 100 (Direct subsidiaries of Meluka Health Pty Ltd – 100%)
Meluka Honey Pty Ltd AUS 100 100 Eco Botanicals Pty Ltd AUS 100 100
EVE Investments Limited, incorporated in Australia, is the ultimate parent entity of the Group. Balances and transactions between the Company and its subsidiaries, which are related parties of the Company, have been eliminated on consolidation and not disclosed in this note.
24. Parent company disclosures 2021 2020
$ $ Current assets 2,646,256 4,974,023 Non-current assets 7,802,952 8,210,410 Total assets 10,449,208 13,184,433
Current liabilities 261,421 191,252 Non-current liabilities - - Total liabilities 261,421 191,252
Contributed equity 33,609,712 32,971,096 Reserves 343,323 297,492 Accumulated losses (23,765,244) (20,275,406) Total equity 10,187,791 12,993,182
Gain / (loss) for the year (3,630,682) (2,400,445) Other comprehensive income / (loss) for the year - - Total comprehensive loss for the year (3,630,682) (2,400,445)
No guarantees were entered into by the parent company during the year (2020: nil).
At 30 June 2021 the parent company had no contingent liabilities (30 June 2020: nil).
25. Contingent assets and liabilities There were no contingent liabilities or contingent assets at 30 June 2021 (2020: nil).
26. Capital and other commitments There were no capital and other commitments at 30 June 2021 (2020: nil).
Notes to the Consolidated Financial Statements For the year ended 30 June 2021
49
27. Events occurring after reporting date There are no matters or circumstances have arisen since the end of the financial year which significantly affected or may significantly affect the operations of the Group, the results of those operations, or the state of affairs of the Group in future financial years.
28. Significant accounting policies a) Associates (equity accounted investees) Associates are all entities over which the Company has significant influence but not control or joint control, generally accompanying a shareholding of between 20% and 50% of the voting rights. Investments in associates are accounted for using the equity method of accounting, after initially being recognised at cost. The Company’s investment in associates includes goodwill (net of any accumulated impairments loss) identified on the acquisition.
The Company’s share of its associates post-acquisition profits or losses is recognised in profit or loss, and its share of post-acquisition movements in reserves is recognised in other comprehensive income. The cumulative post-acquisition movements are adjusted against the carrying amount of the investment, thereafter gains on transactions between the Company and its associates are eliminated to the extent of the Company’s interest in the associate.
b) Impairment of assets At each reporting date, the Company assesses whether there is any indication that an asset may be impaired. Where an indicator of impairment exists, the Company makes a formal estimate of recoverable amount. Where the carrying amount of an asset exceeds its recoverable amount the asset is considered impaired and is written down to its recoverable amount. Recoverable amount is the greater of fair value less costs to sell and value in use. It is determined for an individual asset, unless the asset's value in use cannot be estimated to be close to its fair value less costs to sell and it does not generate cash inflows that are largely independent of those from other assets or group of assets, in which case, the recoverable amount is determined for the cash-generating unit to which the asset belongs.
In assessing value in use, the estimated future cash flows are discounted to their present value using a pre-tax discount rate that reflects current market assessments of the time value of money and the risks specific to the asset.
c) Employee benefits Provision is made for the Company’s liability for employee benefits arising from services rendered by employees to reporting date. Employee benefits have been measured at the amounts expected to be paid when the liability is settled, plus related on-costs.
d) Goods and services tax Revenues, expenses and assets are recognised net of the amount of GST except:
where the GST incurred on a purchase of goods and services is not recoverable from the taxation authority, in which case the GST is recognised as part of the cost of acquisition of the asset or as part of the expense item as applicable; and receivables and payables are stated with the amount of GST included.
The net amount of GST recoverable from, or payable to, the taxation authority is included as part of receivables or payables in the Consolidated Statement of Financial Position.
Cash flows are included in the Consolidated Statement of Cash Flows on a gross basis and the GST component of cash flows arising from investing and financing activities, which is recoverable from, or payable to, the taxation authority are classified as operating cash flows.
Commitments and contingencies are disclosed net of the amount of GST recoverable from, or payable to, the taxation authority.
e) Comparative figures When required by Accounting Standards, comparative figures have been adjusted to conform to changes in presentation for the current financial year.
Notes to the Consolidated Financial Statements For the year ended 30 June 2021
50
f) Provisions Provisions are recognised when the Group has a legal or constructive obligation, as a result of past events, for which it is probable that an outflow of economic benefits will result, and that outflow can be reliably measured. Provisions are measured using the best estimate of the amounts required to settle the obligation at the end of the reporting period.
g) Cash and Cash Equivalents Cash and cash equivalents comprise cash balances and call deposits. Bank overdrafts that are repayable on demand and form an integral part of the Group’s cash management are included as a component of cash and cash equivalents for the purpose of the statement of cash flows. Cash held on reserve to meet collateral requirements, lease bonds and for regulatory purposes are not included in cash and cash equivalents, but classified as cash deposits not available for use by the Group.
h) Trade receivables Trade receivables are recognised initially at fair value and subsequently measured at amortised cost, less allowance for expected credit losses.
The group applies the AASB 9 simplified approach to measuring expected credit losses which uses a lifetime expected loss allowance for all trade receivables.
To measure the expected credit losses, trade receivables have been grouped based on shared credit risk characteristics and the days past due. The Group considers a financial asset in default when contractual payment are > 90 days past due. However, in certain cases, the Group may also consider a financial asset to be in default when internal or external information indicates that the Group is unlikely to receive the outstanding contractual amounts in full before taking into account any credit enhancements held by the Group.
Trade receivables and contract assets are written off when there is no reasonable expectation of recovery. Indicators that there is no reasonable expectation of recovery include, amongst others, the failure of a debtor to engage in a repayment plan with the group, and a failure to make contractual payments for a period of greater than 120 days past due.
Impairment losses on trade receivables and contract assets are presented as net impairment losses within operating profit. Subsequent recoveries of amounts previously written off are credited against the same line item.
On the above basis, the loss allowance was deemed insignificant for trade receivables.
i) Inventories Raw materials, work in progress and finished goods are stated at the lower of cost and net realisable value. Cost comprises direct materials for work in progress and finished goods. Costs are assigned to individual items of inventory based on the first in, first out (FIFO) method.
Costs of purchased inventory are determined after deducting rebates and discounts and adding in transport costs and duties. Costs of tea tree products transferred from assets is its fair value less costs to sell at the date of harvest.
Net realisable value is the estimated selling price in the ordinary course of business less the estimated costs of completion and the estimated costs necessary to make the sale.
j) Borrowings Loans and borrowings are initially recognised at the fair value of the consideration received, net of transaction costs. They are subsequently measured at amortised cost. Any difference between the proceeds (net of transactions costs) and the redemption amount is recognised in profit or loss over the period of the borrowings using the effective interest method. Fees paid on the establishment of loan facilities are recognised as transaction costs of the loan to the extent that it is probable that some or all of the facility will be drawn down. In this case, the fee is deferred until the draw down occurs. To the extend there is no evidence that it is probable that some or all of the facility will be drawn down, the fee is capitalised as a
Notes to the Consolidated Financial Statements For the year ended 30 June 2021
51
prepayment for liquidity services and amortised over the period of the facility to which it relates. In all other cases the fee is expensed.
Borrowings are classified as current liabilities unless the Group has an unconditional right to defer settlement of the liability for at least 12 months after the reporting date.
Borrowings are removed from the statement of financial position when the obligation specified in the contract is discharged, cancelled or expired. The difference between the carrying amount of a financial liability that has been extinguished or transferred to another party and the considerations paid, including any non-cash assets transferred or liabilities assumed, is recognised in profit or loss as other income or finance costs.
k) Principles of consolidation The consolidated financial statements incorporate the assets and liabilities of all subsidiaries of EVE Investments Limited (‘Company’ or ‘parent entity’) as at 30 June 2021 and the results of all subsidiaries for the year then ended. EVE Investments Limited and its subsidiaries together are referred to in this financial report as the Group.
Subsidiaries are all entities (including special purpose entities) over which the Group has the power to govern the financial and operating policies, generally accompanying a shareholding of more than one-half of the voting rights. The existence and effect of potential voting rights that are currently exercisable or convertible are considered when assessing whether the Group controls another entity.
Subsidiaries are fully consolidated from the date on which control is transferred to the Group. They are de-consolidated from the date that control ceases.
Intercompany transactions, balances and unrealised gains on transactions between Group companies are eliminated. Unrealised losses are also eliminated unless the transaction provides evidence of the impairment of the asset transferred. Accounting policies of subsidiaries have been changed where necessary to ensure consistency with the policies adopted by the Group.
The acquisition method of accounting is used to account for business combinations by the Group. A change in ownership interest, without the loss of control, is accounted for as an equity transaction, where the difference between the consideration transferred and the book value of the share of the non-controlling interest acquired is recognised directly in equity attributable to the parent.
Non-controlling interests in the results and equity of subsidiaries are shown separately in the consolidated statement of profit or loss and other comprehensive income, statement of changes in equity and statement of financial position respectively.
l) Current and non-current classification Assets and liabilities are presented in the statement of financial position based on current and non-current classification.
An asset is classified as current when it is either expected to be realised or intended to be sold or consumed in the Group’s normal operating cycle, it is held primarily for the purposes of trading, it is expected to be realised within 12 months after the reporting period, or the asset is cash or cash equivalent unless restricted from being exchanged or used to settle a liability for at least 12 months after the reporting period. All other assets are classified as non-current.
A liability is classified as current when it is either expected to be settled in the Group’s normal operating cycle, it is held primarily for the purposes of trading, it is due to be settled within 12 months after the reporting period, or there is no unconditional right to defer the settlement of the liability for at least 12 months after the reporting period. All other liabilities are classified as non-current.
m) Property, plant and equipment Plant and equipment are stated at historical cost less accumulated depreciation and any impairment in value. Subsequent costs are included in the asset’s carrying amount or recognised as a separate asset, as appropriate, only when it is probable that future economic benefits associated with the item will flow to the Group and the cost of the item can be measured reliably.
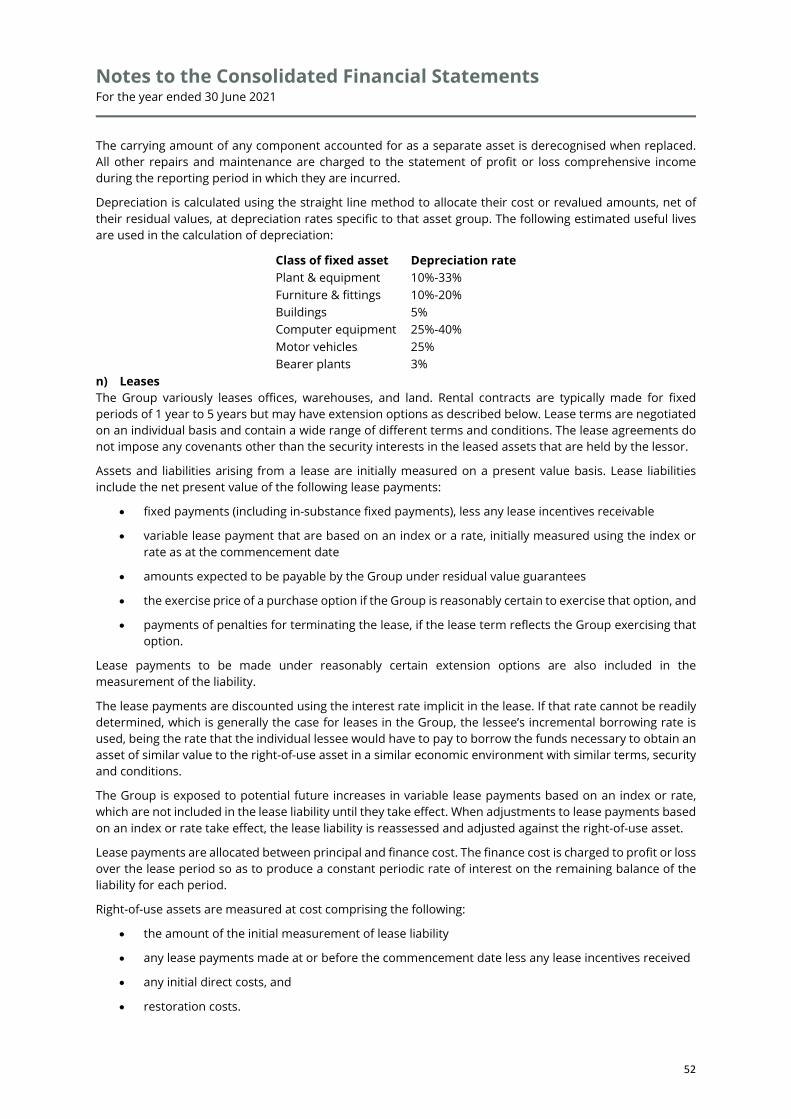
Notes to the Consolidated Financial Statements For the year ended 30 June 2021
52
The carrying amount of any component accounted for as a separate asset is derecognised when replaced. All other repairs and maintenance are charged to the statement of profit or loss comprehensive income during the reporting period in which they are incurred.
Depreciation is calculated using the straight line method to allocate their cost or revalued amounts, net of their residual values, at depreciation rates specific to that asset group. The following estimated useful lives are used in the calculation of depreciation:
Class of fixed asset Depreciation rate Plant & equipment 10%-33% Furniture & fittings 10%-20% Buildings 5% Computer equipment 25%-40% Motor vehicles 25% Bearer plants 3%
n) Leases The Group variously leases offices, warehouses, and land. Rental contracts are typically made for fixed periods of 1 year to 5 years but may have extension options as described below. Lease terms are negotiated on an individual basis and contain a wide range of different terms and conditions. The lease agreements do not impose any covenants other than the security interests in the leased assets that are held by the lessor.
Assets and liabilities arising from a lease are initially measured on a present value basis. Lease liabilities include the net present value of the following lease payments:
• fixed payments (including in-substance fixed payments), less any lease incentives receivable
• variable lease payment that are based on an index or a rate, initially measured using the index or rate as at the commencement date
• amounts expected to be payable by the Group under residual value guarantees
• the exercise price of a purchase option if the Group is reasonably certain to exercise that option, and
• payments of penalties for terminating the lease, if the lease term reflects the Group exercising that option.
Lease payments to be made under reasonably certain extension options are also included in the measurement of the liability.
The lease payments are discounted using the interest rate implicit in the lease. If that rate cannot be readily determined, which is generally the case for leases in the Group, the lessee’s incremental borrowing rate is used, being the rate that the individual lessee would have to pay to borrow the funds necessary to obtain an asset of similar value to the right-of-use asset in a similar economic environment with similar terms, security and conditions.
The Group is exposed to potential future increases in variable lease payments based on an index or rate, which are not included in the lease liability until they take effect. When adjustments to lease payments based on an index or rate take effect, the lease liability is reassessed and adjusted against the right-of-use asset.
Lease payments are allocated between principal and finance cost. The finance cost is charged to profit or loss over the lease period so as to produce a constant periodic rate of interest on the remaining balance of the liability for each period.
Right-of-use assets are measured at cost comprising the following:
• the amount of the initial measurement of lease liability
• any lease payments made at or before the commencement date less any lease incentives received
• any initial direct costs, and
• restoration costs.
Notes to the Consolidated Financial Statements For the year ended 30 June 2021
53
Right-of-use assets are generally depreciated over the shorter of the asset's useful life and the lease term on a straight-line basis. If the Group is reasonably certain to exercise a purchase option, the right-of-use asset is depreciated over the underlying asset’s useful life. While the Group revalues its land that are presented within property, plant and equipment, it has chosen not to do so for the right-of-use buildings held by the Group.
Extension and termination options are included in a number of property and equipment leases across the Group. These are used to maximise operational flexibility in terms of managing the assets used in the Group’s operations.
o) Goodwill Goodwill represents the excess of the purchase consideration over the fair value of the identifiable net assets at the time of acquisition of a combination. When the excess is negative (bargain purchase), it is recognised immediately in profit or loss.
Goodwill is not amortised. Instead, Goodwill is tested for impairment at each reporting date or more frequently if events or changes in circumstances indicate that it might be impaired, and is carried at cost less accumulated impairment losses. Gains and losses on the disposal of an entity include the carrying amount of Goodwill relating to the entity sold.
Goodwill is allocated to each of the cash-generating units for the purpose of impairment testing. Impairment is determined by assessing the recoverable amount of the cash-generating unit to which the goodwill relates (refer note 6). Impairment losses on goodwill cannot be reversed.
p) Identifiable intangible assets Intangible assets acquired separately or in a business combination are initially measured at the lower of cost or fair value cost at the time of acquisition when it is probable that the future economic benefits arising as a result of the costs incurred will flow to the Group. The Group assesses identifiable intangible assets as having either finite or indefinite useful lives.
Intangible assets with finite lives are amortised over the useful life and assessed for impairment at least twice a year or whenever there is an indication that the intangible asset may be impaired. The amortisation period and amortisation method are reviewed at least each financial year end. Changes in the expected useful life or flow of economic benefits intrinsic in the asset are an accounting estimate. The amortisation charge on intangible assets with finite lives is recognised in the statement of profit or loss and other comprehensive income.
q) Trade and Other Payables Trade and other payables represent the liability outstanding at the end of the reporting period for goods and services received by the Group during the reporting period which remains unpaid. The balance is recognised as a current liability with the amount being normally paid within 30 days of recognition of the liability.
r) Contributed Equity Ordinary shares are classified as equity. Incremental costs directly attributable to the issue of new shares or options are shown in equity as a deduction, net of tax, from the proceeds.
s) Earnings per Share Basic earnings per share is calculated as a net profit attributable to members, adjusted to exclude any costs of servicing equity (other than dividends) and preference share dividends, divided by the weighted average number of ordinary shares, adjusted for any bonus element.
Diluted earnings per share is calculated as net profit attributable to members, adjusted for:
• costs of servicing equity (other than dividends) and preference share dividends;
• the after-tax effect of dividends and interest associated with dilutive potential ordinary shares that have been recognised as expenses; and
• other non-discretionary changes in revenues or expenses during the period that would result from the dilution of potential ordinary shares; divided by the weighted average number of ordinary shares and dilutive potential ordinary shares, adjusted for any bonus element.
Notes to the Consolidated Financial Statements For the year ended 30 June 2021
54
t) Income tax Income tax on the Statement of Profit or Loss and other Comprehensive Income for the periods presented comprises current and deferred tax. Income tax is recognised in the Statement of Profit or Loss and other Comprehensive Income except to the extent that it relates to items recognised directly in equity, in which case it is recognised in equity.
The current income tax charge is calculated on the basis of the tax laws enacted or substantively enacted at the end of the reporting period in the countries where the Company’s subsidiaries and associates operate and generate taxable income. Management periodically evaluates positions taken in tax returns with respect to situations in which applicable tax regulation is subject to interpretation. It establishes provisions where appropriate on the basis of amounts expected to be paid to the tax authorities.
Deferred tax is provided using the liability method, providing for temporary differences between the carrying amounts of assets and liabilities for financial reporting purposes and the amounts used for taxation purposes.
A deferred tax asset is recognised only to the extent that it is probable that future taxable profits will be available against which the asset can be utilised. Deferred tax assets are reduced to the extent that it is no longer probable that the related tax benefit will be realised, or to the extent that the Group has deferred tax liabilities with the same taxation authority. Additional income taxes that arise from the distribution of dividends are recognised at the same time as the liability to pay the related dividend.
The Company and its wholly owned Australian subsidiaries are members of an Australian income tax consolidated group (Tax Group). EVE Investments Limited is the head company of the Tax Group.
The current tax liabilities (or assets) of each member of the Tax Group are accounting for as being assumed by the Company. Similar, the deferred tax assets arising from unused tax losses and unused relevant tax credits of each member are accounting for as being assumed by the Company.
The members of the Tax Group have entered into a tax sharing and tax funding agreement. Under the tax funding agreement, the members of the Tax Group compensate the Company for any current tax payable assumed. In addition, the members of the Tax Group are compensated by the Company for any current tax receivable and deferred tax assets relating to unused tax losses or unused tax credits that are assumed and recognised as a deferred tax asset by the Company.
The funding amounts calculated under the tax funding agreement are determined by a notional income tax allocation that is prepared for each member of the Tax Group as if it were a taxable entity in its own right. This notional income tax allocation is completed on the basis of specific assumptions set out in the tax funding agreement. Depending on the outcome, the notional income tax allocation prepared by each member of the Tax Group will recognise either a current amount receivable or payable to the head entity of the Tax Group.
u) Segment Information Operating segments are reported in a manner consistent with the internal reporting provided to the chief operating decision maker. The chief operating decision maker, who is responsible for allocating resources and assessing performance of the operating segments, has been identified as the Managing Director.
v) New standards and interpretations not yet adopted There are no issued but not yet effective accounting standards or interpretations that are expected to significantly impact the Company in future financial years.
29. Financial risk management The Company's activities expose it to both credit risk and liquidity risk. The Company's overall risk management program focuses on the unpredictability of financial markets and seeks to minimise potential adverse effects on the financial performance of the Company. The Company uses different methods to measure different types of risk to which it is exposed.
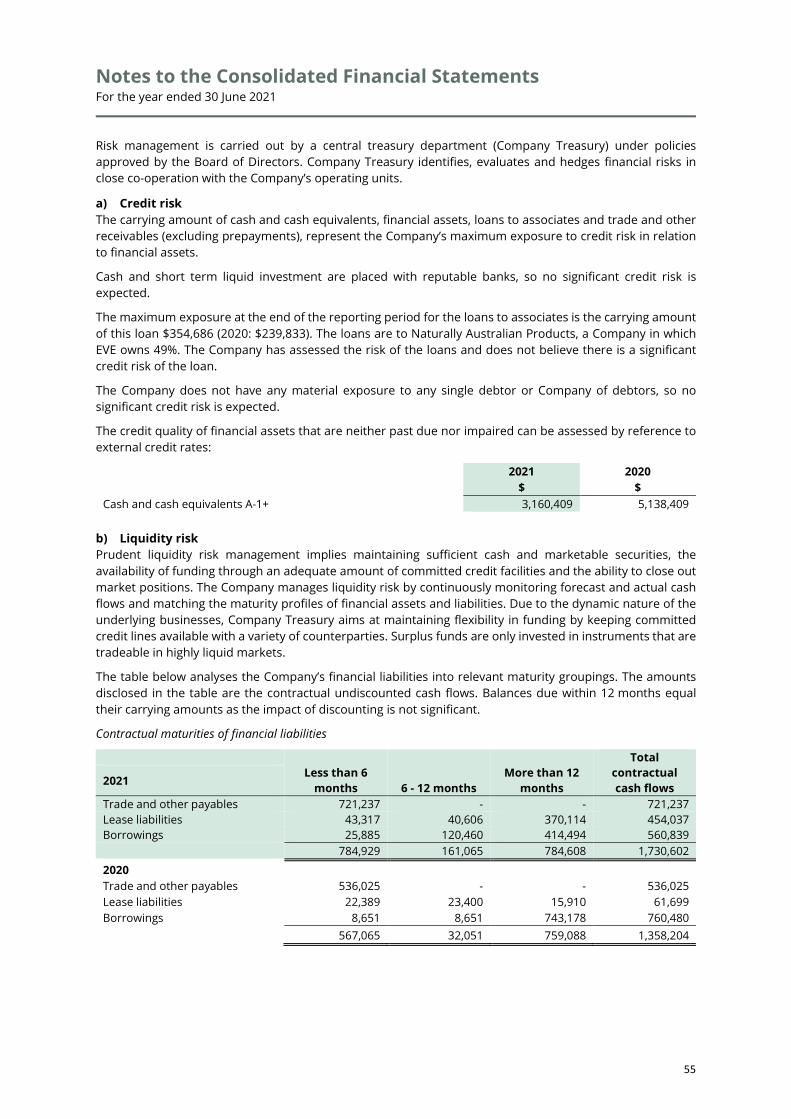
Notes to the Consolidated Financial Statements For the year ended 30 June 2021
55
Risk management is carried out by a central treasury department (Company Treasury) under policies approved by the Board of Directors. Company Treasury identifies, evaluates and hedges financial risks in close co-operation with the Company’s operating units.
a) Credit risk The carrying amount of cash and cash equivalents, financial assets, loans to associates and trade and other receivables (excluding prepayments), represent the Company’s maximum exposure to credit risk in relation to financial assets.
Cash and short term liquid investment are placed with reputable banks, so no significant credit risk is expected.
The maximum exposure at the end of the reporting period for the loans to associates is the carrying amount of this loan $354,686 (2020: $239,833). The loans are to Naturally Australian Products, a Company in which EVE owns 49%. The Company has assessed the risk of the loans and does not believe there is a significant credit risk of the loan.
The Company does not have any material exposure to any single debtor or Company of debtors, so no significant credit risk is expected.
The credit quality of financial assets that are neither past due nor impaired can be assessed by reference to external credit rates:
2021 2020
$ $ Cash and cash equivalents A-1+ 3,160,409 5,138,409
b) Liquidity risk Prudent liquidity risk management implies maintaining sufficient cash and marketable securities, the availability of funding through an adequate amount of committed credit facilities and the ability to close out market positions. The Company manages liquidity risk by continuously monitoring forecast and actual cash flows and matching the maturity profiles of financial assets and liabilities. Due to the dynamic nature of the underlying businesses, Company Treasury aims at maintaining flexibility in funding by keeping committed credit lines available with a variety of counterparties. Surplus funds are only invested in instruments that are tradeable in highly liquid markets.
The table below analyses the Company’s financial liabilities into relevant maturity groupings. The amounts disclosed in the table are the contractual undiscounted cash flows. Balances due within 12 months equal their carrying amounts as the impact of discounting is not significant.
Contractual maturities of financial liabilities
Less than 6
months 6 - 12 months More than 12
months
Total contractual cash flows 2021
Trade and other payables 721,237 - - 721,237 Lease liabilities 43,317 40,606 370,114 454,037 Borrowings 25,885 120,460 414,494 560,839 784,929 161,065 784,608 1,730,602
2020 Trade and other payables 536,025 - - 536,025 Lease liabilities 22,389 23,400 15,910 61,699 Borrowings 8,651 8,651 743,178 760,480
567,065 32,051 759,088 1,358,204

Notes to the Consolidated Financial Statements For the year ended 30 June 2021
56
30. Determination of fair values A number of the Company’s accounting policies and disclosures require the determination of fair value, for both financial and non-financial assets and liabilities. Fair values have been determined for measurement and / or disclosure purposes based on the following methods. Where applicable, further information about the assumptions made in determining fair values is disclosed in the notes specific to that asset or liability.
a) Trade and other receivables The fair value of trade and other receivables with a remaining life of less than six months, the notional amount is deemed to reflect the fair value. All other receivables are estimated as the present value of future cash flows, discounted at the market rate of interest at the reporting date.
b) Loans to associates The fair value of loans to associates is not materially different to the carrying value as the carrying value is calculated as the present value of future cash flows, discounted using an 8% discount rate at the reporting date.
c) Borrowings The fair value of borrowings is determined as the present value of future contracted cash flows and credit adjustments. The fair value of borrowings is not materially different to the carrying value since the interest payable is either close to market rates or the borrowings are of a short-term nature.

Auditor’s Independence Declaration For the year ended 30 June 2021
57
Auditor’s Independence Declaration For the year ended 30 June 2021
58

Independent Audit Report For the year ended 30 June 2021
59

Independent Audit Report For the year ended 30 June 2021
60
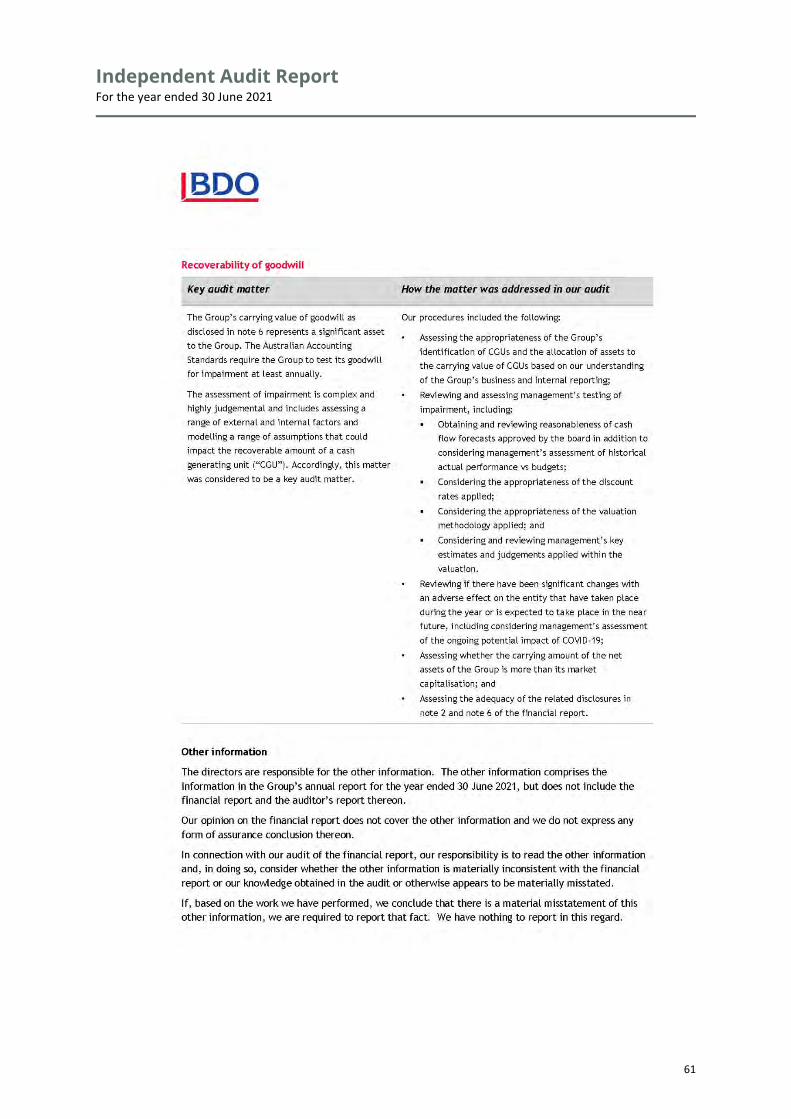
Independent Audit Report For the year ended 30 June 2021
61
Independent Audit Report For the year ended 30 June 2021
62

Additional Information For the year ended 30 June 2021
63

Additional Information For the year ended 30 June 2021
64
1. Exchange listing EVE investments Limited shares are listed on the Australian Securities Exchange. The Company’s ASX code is EVE.
2. Substantial shareholders (holding not less than 5%) The following substantial shareholders have lodged relevant disclosures with the Company.
Name of Shareholder Number of shares
held EVERHONEY BIOTECH AUSTRALIA PTY LTD 663,638,954 HONG KONG JUSHENG BOLANG TECHNOLOGY CO LIMITED 507,488,612
3. Class of shares and voting rights At 18 August 2021, there were 3,872 holders of 3,843,141,890 ordinary fully paid shares of the Company. The voting rights attaching to the ordinary shares are in accordance with the Company’s Constitution being that:
a) each shareholder entitled to vote may vote in person or by proxy, attorney or representative;
b) on a show of hands, every person present who is a shareholder or a proxy, attorney or representative of a shareholder has one vote; and
c) on a poll, every person present who is a shareholder or a proxy, attorney or representative of a shareholder shall, in respect of each fully paid Share held by them, or in respect of which they are appointed a proxy, attorney or representative, have one vote for the Share, but in respect of partly paid Shares, shall, have such number of votes as bears the proportion which the paid amount (not credited) is of the total amounts paid and payable (excluding amounts credited).
4. Distribution of shareholders
Range Securities Number of holders % IC 100,001 and Over 3,754,897,762 1,968 97.70 10,001 to 100,000 87,103,982 1,515 2.27 5,001 to 10,000 743,542 90 0.02 1,001 to 5,000 341,101 107 0.01 1 to 1,000 55,503 192 0.00
3,843,141,890 3,872 100.00
Unmarketable Parcels 59,044,128 1,612 1.54
5. Unlisted securities
Securities Number on
issue Number of
holders Holders with 20%
or more Number
held Employee incentive performance rights
53,750,000 8 nil n/a
Unlisted options exercisable at 0.6 cents on or before 31/12/2021
83,266,665 14 nil n/a
Unlisted options exercisable at 1.6 cents on or before 28/10/2024
39,000,000 5 nil n/a
Unlisted options exercisable at 1.6 cents on or before 26/11/2024
16,000,000 1 nil n/a

Additional Information For the year ended 30 June 2021
65
6. Listing of 20 largest shareholders as at 18 August 2021
Rank Name Number of shares held % IC
1 EVERHONEY BIOTECH AUSTRALIA PTY LTD 663,638,954 17.27 2 HONG KONG JUSHENG BOLANG TECHNOLOGY CO LIMITED 507,488,612 13.21 3 TRT INVESTMENT GROUP PTY LTD 68,400,000 1.78 4 MR ALASDAIR CAMPBELL COOKE 62,342,194 1.62 5 MR MARC JOHN CALOKERINOS 62,000,000 1.61 6 UBS NOMINEES PTY LTD 50,032,622 1.30 7 MRS ABIGAIL CLARE FRY 45,760,124 1.19 8 SASSEY PTY LTD <AVAGO SUPER FUND A/C> 43,935,998 1.14 9 MR JOHN HENRY TOLL <TOLL FAMILY A/C> 40,000,000 1.04
10 HARTREE PTY LTD 38,426,727 1.00 11 ROBYN MERRYL INGERSOLE 35,530,000 0.92 12 BRYAN KENT EASSON 35,530,000 0.92 13 CAVE GLEN PTY LTD <SANDRA WISE SUPER FUND A/C> 34,500,500 0.90 14 STATION CAPITAL PTY LTD 32,000,000 0.83 15 MR BENEDICT JAMES ROHR 30,950,000 0.81 16 MYALLA HOLDINGS PTY LTD <FREEMANTLE FAMILY A/C> 28,500,000 0.74 17 GLENLAREN PTY LTD <GLENLAREN SUPER A/C> 28,333,334 0.74 18 GLENLAREN PTY LTD <GLENLAREN A/C> 28,044,400 0.73 19 HSBC CUSTODY NOMINEES (AUSTRALIA) LIMITED 27,420,236 0.71 20 WELLS ESTATES PTY LTD <KK WELLS SUPER FUND A/C> 27,150,000 0.71
1,889,983,701 49.17
7. Other information There is no current on-market buyback of the Company’s securities and the Company does not have any securities on that issue that are subject to escrow restriction.

Additional Information For the year ended 30 June 2021
66


