Accelerating the Clean Energy Revolution 1 by Robert C. Marlay U.S. Department of Energy for Experts Group on R&D Priority-Setting and Evaluation International Energy Agency, Paris 17 May 2016 MISSION INNOVATION
Transcript
Accelerating the Clean Energy Revolution
1
by
Robert C. Marlay
U.S. Department of Energy
for
Experts Group on R&D Priority-Setting and Evaluation
International Energy Agency, Paris
17 May 2016
MISSION INNOVATION
Paris Climate Conference and
Agreement – Key Features *
Well Below 2°C Limit Warming to Well Below Target, and Try to Cap at 1.5°C
Achieve a Balance Balance Anthropogenic GHG Sources and
Removal by Sinks by Mid-Century
Every 5 years Countries Will Review and Submit New, More Ambitious Plans Every Five Years
Technology Development
Advance Technology Innovation through Mission
Innovation and Breakthrough Energy Coalition
Mobilize Climate Finance
Collectively Mobilize $100B per Year in Public
and Private Funding for Developing Economies through 2025
Enhanced Transparency
Enhance Transparency for Reporting GHG
Emissions, Subject to Expert Review
2 * Report on COP-21, “Inside the Paris Climate Deal”, Science, Warren Cornwall, Dec 2015: Vol. 350, Issue 6267, pp. 1451
3
A Unique Moment in Time
All on One Stage -- Leaders of 20 Countries Representing over 80% of Global Clean Energy R&D Investment Agreed to Support a Joint Statement on Innovation
Each Country Supported a Doubling of Governmental Clean Energy R&D Investment over Next Five Years (www.mission-innovation.net)
Gov’t Investment was Complemented by a Private Sector Initiative led by Bill Gates, the Breakthrough Energy Coalition (www.breakthroughenergycoalition.com)
Source: International Energy Agency for most IEA countries, and Bloomberg New Energy Finance survey data for others. IEA data include all
forms of energy R&D and demonstrations, but exclude deployment expenditures and costs for overhead and program direction. Note: the
estimate for the United States is USG-based data, but reshaped to be compliant with IEA reporting guidelines.
-
1,000
2,000
Million USD N/A N/A
*N/A = Not Available
11
One Possible Global Funding Scenario for all MI Participating Countries
Business as Usual
= $25B over 5 years
Doubling Nominal
Baseline*
Pu
blic
Inve
stm
ent
$5B
$10B
$15B
$20B
2021 2020 2016 2017 2018 2019 2015
Average Growth Rate of 15% per Year
* Nominal baseline of $10 billion is a rough estimate, based on based on IEA Energy RD&D Expenditures and Survey Data from
Bloomberg New Energy Finance for 20 MI countries. A better estimate will emerge, once MI countries report later in 2016.
Next Steps
Each Country Must Define Its Own Program Scope and Doubling Plan:
Establish a “Mission Innovation” R&D Baseline and Base-Year
Declare Amount of its Doubling Plan and by When
Provide a Country-Narrative Describing R&D Investment Priorities
Additionally, to the Extent Practicable:
Evidence Commitment by Announcing a First-Year Plan
Provide Transparency by Disclosing Composition of Baseline and Growth
Establish Information Sharing Mechanisms Among Countries
Identify R&D Needs, Conduct Analyses, and Launch Road-Mapping
Explore Joint Research & Capacity Building Opportunities
Agree on an International Platform for Sustained MI Operation
12
First Ministerial Meeting Hosted by the U.S. on June 2, 2016 in San Francisco, CA
Private Sector Actions
“We must…add the skills and resources of leading investors with experience in driving innovation from the lab to the marketplace.”
“The private sector knows how to build companies, evaluate the potential for success and take the risks that lead to taking innovative ideas and bringing them to the world.”
“Governments play an indispensable role in supporting energy research.”
“Government research, however, is not enough. ”
-Bill Gates
13
Bill Gates, “Energy Innovation: Why We Need It and How to Get It,” http://www.breakthroughenergycoalition.com/assets/resources/Energy-
Innovation-by-Bill-Gates-Nov-30-2015.pdf; Breakthrough Energy Coalition, “Introducing the Breakthrough Energy Coalition,”
Utilize Truly Patient, Flexible Risk-Tolerant Capital
Different Approach to Investment:
Identify Investable Ideas Early
Speed Up Innovation Cycle
Focus on Ideas that Go to Scale
Adopt Different Types of Deal Structures
Bill Gates, gatesnotes, “A Big Win for Cheap, Clean Energy,” https://www.gatesnotes.com/Energy/Investing-in-Energy-Innovation
<Click on video to load>
15
Fund Principles
1. Invest Early Provide Seed, Angel and Series A Investments. Once De-Risked, Traditional Investors may Follow.
2. Invest Broadly
Invest Across a Number of Sectors: Electricity Generation and Storage Transportation Industrial Use Agriculture Energy System Efficiency
3. Invest Boldly Novel Technologies and Dramatic Improvements to Existing Technologies. Credible Path to Rapid Scale-Up without Burdening Essential Systems.
4. Invest Wisely Tap Leading Experts to Guide Investment Decisions.
5. Invest Together Invest in Mission Innovation Countries’ Innovation Pipelines.
Breakthrough Energy Coalition
• 27 investors & University of California; collective net worth: $300+ billion • Commitment to invest in innovation emerging from Mission Innovation pipeline • Long-term, patient, and risk-tolerant capital
16
Mukesh
Ambani John Arnold Mark Benioff Jeff Bezos Alwaleed bin
Ttalal
Richard
Branson
Ray Delio Aliko Dangote John Doerr
Bill Gates Reid
Hoffman
Chris Hohn Vinod
Khosla
Jack Ma Patrice
Motsepe
Xavier Niel Hasso
Plattner
Julian
Robertson
Mark Zuckerberg,
Priscilla Chan
Neil Shen Simmons &
Baxter-Simmons
Masayoshi
Son
George
Soros
Tom
Steyer
Ratan
Tata
Meg
Whitman
Zhang Xin
Pan Shiyi
Implementation
17
MI Sub-Groups
Six Thematic, Ad Hoc Sub-Groups: *
1. Information Sharing
2. Innovation Analysis and Road-Mapping
3. Joint Research and Capacity Building
4. Private Sector Engagement
5. Statement of Mission
6. Secretariat and Longer-Term Organization
Sub-Groups “Staffed” by Int’l Volunteers from MI Countries
Sub-Group Products to Flow into MI Framework Document
18 * Organized around themes of Joint Statement by MI Country Leaders
19
Schedule
Mission Innovation Countries Flesh-out Key Elements of the Initiative’s Implementation, Including Pledges
May 2016
Energy Ministers of MI Countries Meet in San Francisco, in Conjunction with Clean Energy Ministerial, Publicly State MI Baselines, Doubling Plans and Other Initiatives
1-2 June 2016
MI Countries Explore Joint R&D Opportunities Fall 2016
Breakthrough Energy Coalition Launches Initial Investment Fund (Tentative)
“Mission Innovation and the Breakthrough Energy Coalition constitute powerful complementary efforts to expand research and development for cutting-edge clean energy technologies and support a new generation of scientists, engineers, and entrepreneurs.”
- White House Fact Sheet on the Proposed FY17 Budget for Mission Innovation
22
Proposed U.S. Government
Budget, FY 2017
1. Department of Energy Request
• Basic Clean Energy Research $1,853M
• Sustainable Transportation Technologies $880M
• Nuclear Energy Technologies $804M
• Carbon Capture & Storage and Other Fossil Emissions Improvements $564M
• Solar, Wind, Water, and Geothermal Energy $500M
• Advanced Research Projects Agency – Energy $350M
• Clean Energy Manufacturing, including 2 new National Network for Manufacturing Innovation Institutes
$261M
• Grid Modernization, Resiliency, and Clean Energy Integration $177M
• New Regional Clean Energy Innovation Partnerships $110M
• New Innovation Initiatives $105M
23
Proposed U.S. Government Budget,
FY 2017 (continued)
2. National Science Foundation
• Conversion, Storage, and Distribution of Power; Energy Materials $512M
3. National Aeronautics and Space Administration
• Low-Carbon Air Transportation $348M
4. Department of Agriculture
• Bio-Based Energy $106M
5. Department of Housing and Urban Development
• Enable Builders, Property Owners, and Tenants to Improve Efficiency $10M
6. U.S. Agency for International Development
• Clean Energy Innovation for Developing Countries through the Global Development Lab and the Global Climate Change Initiative
$25M
7. Other Agencies $797M
TOTAL Clean Energy R&D Budget $7.7 B
DOE Budget Strategy (1 of 5)
Augment Existing Basic and Applied DOE Energy RD&D Programs
BES (EFRCs and User Facilities) and BER (Bioenergy Research Centers)
OE and EERE (Additional NNMIs, New Hub, and Other Increases)
FE (Advanced Carbon Capture Technology) and NE (Advanced Reactor R&D)
Cross-cutting Innovation Initiatives
National Laboratory “Small Business Partnership Program”
National Laboratory “Energy Technology Innovation Accelerators”
Regional Clean Energy Innovation Partnerships
24
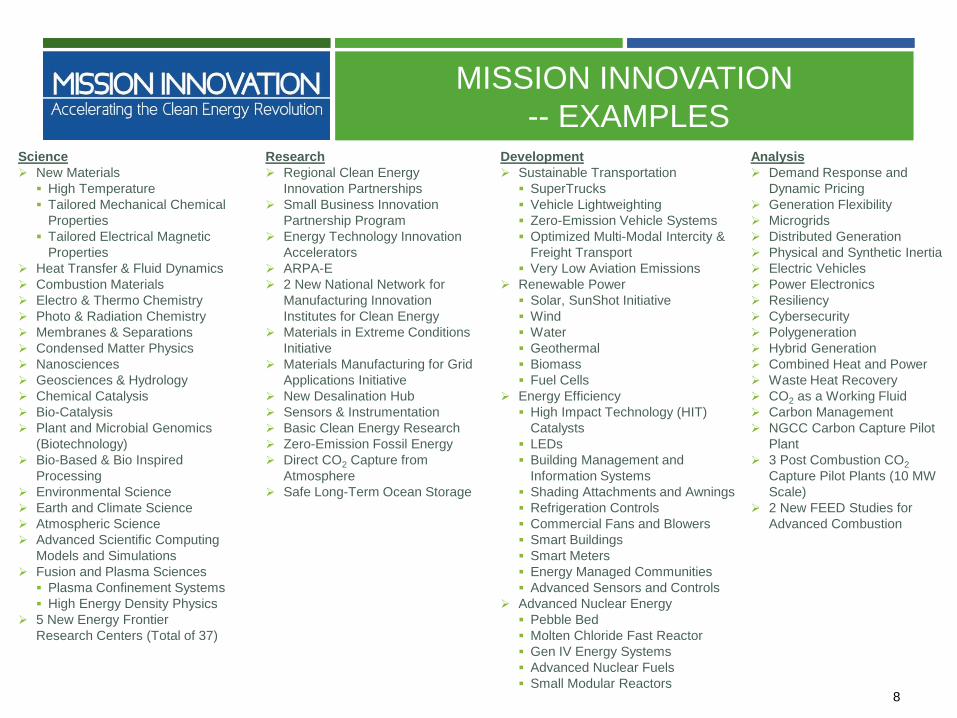
Science/BES
5 New EFRCs (Total of 37) (Possible New Focus Area on Subsurface R&D)
Increase BES User Facility Operating Rates to 100% of Optimal Hours to Accommodate Increased Mission Innovation-Related Work
Increase Focus of Nanoscale Science Research Centers on Mission Innovation Objectives
Science/BER
Increase Funding for Final Year of 10-year program at 3 Existing Bioenergy Research Centers (BRCs), Focused on Technology Demonstration and Transfer; Plan to Conduct FOA for New BRCs to be Funded in FY 2018
EERE/Crosscutting
Next Generation Innovation: Support the On-Ramping of High-Impact Technologies through RD&D Projects Across EERE’s Sustainable Transportation, Renewable Power, and Energy Efficiency Sectors
25
DOE Budget Strategy (2 of 5)
DOE Budget Strategy (3 of 5)
Energy Efficiency/Advanced Manufacturing
Support 3 Existing National Network of Manufacturing Innovation Institutes; Establish 2 Additional Institutes in FY 2016
Propose 2 New Initiatives in FY 2017 - - Materials in Extreme Conditions and Materials Manufacturing for Grid Applications (Grid Institute)
Propose New Hub (Desalination)
Fossil Energy/Carbon Management
Support 3 Pilot Plant Projects (10 Mw Scale) to Test Advanced Concepts for Post Combustion Carbon Capture
Support 4 FEED Studies of Advanced Combustion Technologies
Initiate Construction of a NGCC Carbon Capture Pilot Plant
New Research Initiative to Address Materials in Extreme Environments
26
DOE Budget Strategy (4 of 5)
Nuclear Energy/Reactors
Fulfill DOE’s Funding Commitment to Design Certificate Document for NuScale SMR
Fund 2 Advanced Reactor R&D Concepts - Pebble Bed and Molten Chloride Fast Reactor
Implement New Integrated Waste Strategy - Consent Based Siting, Consolidated Storage, Separate Defense Repository, Deep Borehole R&D, Transportation Systems
Office of Electricity
Increased Energy Storage R&D Program
Increase Annual Appropriations for ARPA-E
Discretionary Appropriations will Support Expansion of Current ARPA-E Activities
Fund 7-8 New Solicitations
Supplement Highly Successful Existing Projects to Achieve Investment Readiness Support
27
DOE Budget Strategy (5 of 5)
National Laboratory Small Business Partnerships
Provide Competitively Awarded Clean Energy R&D Funding at National Laboratories to Partner with Small Businesses to Address their Critical Clean Energy R&D Challenges and Opportunities
National Laboratory Energy Technology Innovation Accelerators
Couple the Talent and Commitment of Early-Stage Clean Energy Technology Entrepreneurs with the World-Class Tools and Expertise of the National Labs through RD&D Projects that Encourage Mentorship and Network Support Leading to New Company Creation and the Development of Successful Commercialization Strategies
Regional Clean Energy Innovation Partnerships
Competitively Awarded, Cost-Shared Support for the Creation of Up to 10 Regional Clean Energy Innovation Partnerships
Partnerships will Support Targeted Regionally-Focused Technology-Neutral Clean Energy RD&D Initiatives to Address Regionally Relevant Energy Challenges and Opportunities in Energy Innovation
28
Cooling Technologies
in MI Countries
29
30
Cooling & Heating Consumption
in MI Countries
United States
Canada
Mexico
Brazil
Chile
Norway Sweden
UK
France Germany
Italy
Saudi Arabia India
China
Japan
Indonesia
Australia
UAE
South Korea
Denmark
Cooling and Heating Consumption by region for different fuel types in 2010.