80
ANNUAL REPORT 2011 Annual Report 2011

ANNUAL REPORT
2011Annual Report
2011
MIT
SU
BIS
HI H
EA
VY
IND
US
TR
IES
, LT
D. A
nnual Report 2011
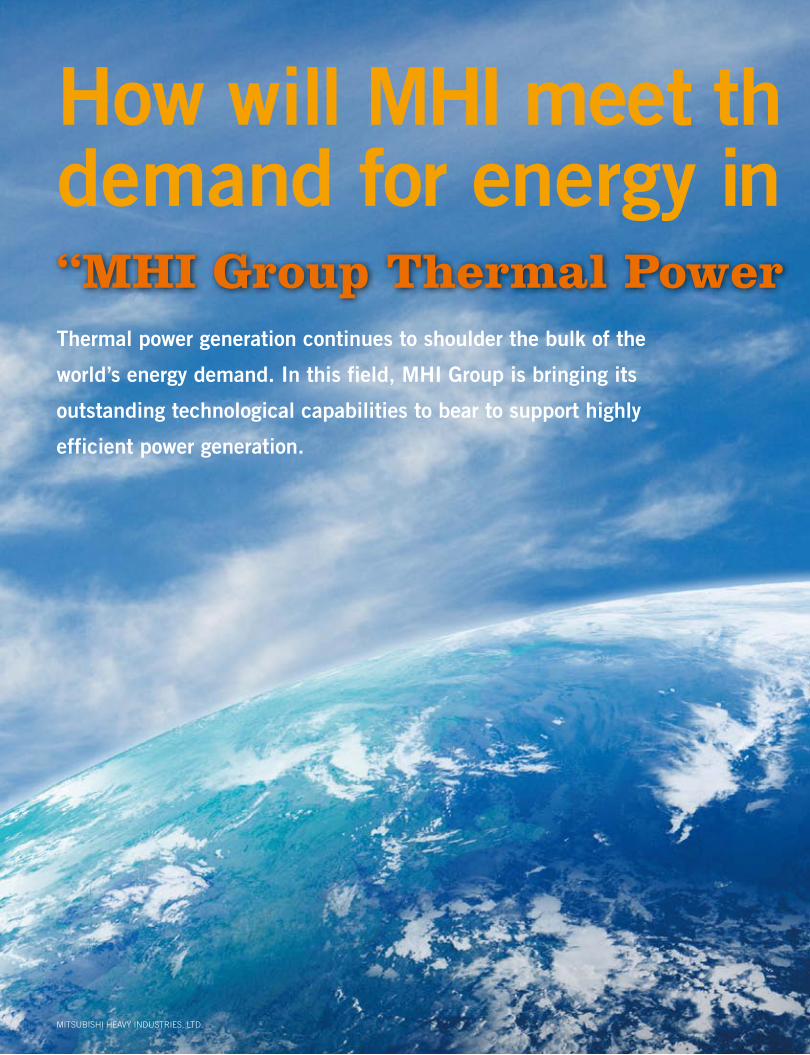
How will MHI meet th e world’s growing demand for energy in the future?“MHI Group Thermal Power Generation”Thermal power generation continues to shoulder the bulk of the
world’s energy demand. In this field, MHI Group is bringing its
outstanding technological capabilities to bear to support highly
efficient power generation.
MITSUBISHI HEAVY INDUSTRIES, LTD.

The global transition underway to a low-carbon society remains unchanged.
MHI Group has taken action in four key technological fields in the energy and environment busi-
nesses that it believes are essential to making a low-carbon society possible. Those Four key fields are
Carbon-free Energy, Transportation and Logistics Systems, High-efficiency Power Generation, and
Energy Management.
MHI Group possesses technologies in all four fields, and will contribute to developing safe,
secure and comfortable communities by showcasing its ability to integrate these assets to deliver
solutions that answer market needs.
It is an undeniable fact, though, that the world remains heavily dependent on fossil energy,
which accounts for 67% of the total volume of power generated globally today.
With thermal power retaining such a vital position, MHI Group will work vigorously to pursue
highly efficient power generation in the field.
Total Solution
Carbon-free Energy Transportation and Logistics Systems
Energy ManagementHigh-efficiency Power Generation
Wind Power
Nuclear Power Generation
Concentrated Solar Power Generation
Geothermal Power Generation
GTCC
Gas Engine
IGCC
USC
MRJ
Eco Ships
Urban Transportation System
ITS
Eco Houses / HEMS,BEMS
Lithium Ion Batteries
Electric Buses
Heat Pumps
GTCC: Gas Turbine Combined Cycle, USC: Ultra Super Critical, MRJ: Mitsubishi Regional Jet, HEMS: Home Energy Management System
IGCC: Integrated Gasification Combined Cycle, ITS: Intelligent Transport System, BEMS: Building Energy Management System
How will MHI meet th e world’s growing demand for energy in the future?“MHI Group Thermal Power Generation”
The Four Key Technological Fields for the Energy & Environment Business
ANNUAL REPORT 2011 1

In industrialized countries, the selection of power sources continues to
be based on an attempt to balance the so-called “3Es”: environment,
economic efficiency, and energy security.
MHI Group is seeing growing demand for gas turbines. This situation
reflects gas price stabilization brought about by the development of
unconventional gas (shale gas), as well as the retirement of aging coal-
fired thermal power plants in line with tougher environmental regulations.
MHI Group’s most advanced J-Series gas turbine has achieved a turbine inlet
temperature of 1,600˚C, the highest in the world. This milestone was achieved
during trial operations in early February 2011 at the combined-cycle power plant
for verification testing inside MHI’s Takasago Machinery Works (Takasago City,
Hyogo Prefecture, Japan). This accomplishment marked the final validation
needed for the J-Series turbine, with plans now on the table to deliver six units of
the turbine to the Himeji No. 2 Power Station of Kansai Electric Power Co., Inc.
CO
2 pr
ice
(env
ironm
ent)
Natural gas price
Effects of shale gas
Non-fossil fuel (nuclear, wind etc.)
Choice of power source
Natural gas
Coal
Effects of shale gasEffects of shale gas
Scope of choice of power source
1,600oCGas TurbIne DeManD In InDusTrIalIzeD CounTrIes
MITSUBISHI HEAVY INDUSTRIES, LTD.2

GrowInG Power DeManD In eMerGInG MarkeTs anD Coal-fIreD THerMal Power
Demand for power today continues to rise in emerging markets. By 2035,
this demand will account for some 3,300 GW, or roughly 80%, of the
increase in power demand worldwide.
Demand for natural gas-fired thermal power plants is also projected to
grow, as efforts to promote greater power source diversification gain ground.
Demand, though, is widely expected to center on coal-fired plants, since
coal is easier to procure due to its broad geographical distribution world-
wide, and can be readily purchased as a fuel at reasonable prices.
MHI and Larsen & Toubro Limited (L&T) of India have invested in two
joint venture companies with plants where the full-scale production of
supercritical-pressure coal-fired boilers and steam turbines/generators
is now underway. With the production and supply of highly efficient
coal-fired thermal power plants, these companies will aggressively meet
demand for power in India, which has expanded rapidly in step with
economic growth.
The joint ventures, which have respective annual produc-
tion capacities for boilers and turbines/generators of 4 GW, are
taking solid steps to win orders, having received orders for 10
supercritical-pressure boilers and 12 turbines to date.
emerging countries: Cumulative installed capacity forecastElectrical capacity (GW)
6,000
4,000
2,000
0
2020 2030 203520152008
Project won in India
* LMB: L&T-MHI Boilers Private Limited LMTG: L&T-MHI Turbine Generators Private Limited
Ordered project
(MHI’s estimate from World Energy Outlook 2010)
L&T JVLMB* (JV/boiler manufacturing)
LMTG* (JV/turbine manufacturing)
MHI-India Engineering Center(Subsidiary/GTCC Engineering)
2 × 700MW(Boiler, ST)
3 × 660MW(Boiler, ST)
2 × 700MW(Boiler, ST)
3 × 660MW(Boiler, ST)
2 × 800MW(ST)
3,300GW
Coal Gas Nuclear Wind Oil Hydro Others
ANNUAL REPORT 2011 3ANNUAL REPORT 2011 3

563units sTrenGTHenInG THe ProDuCTIon fraMework In Gas TurbInes In norTH aMerICa
MHI Group has received a cumulative 563 orders for gas turbines. A key market for
these machines is North America, where MHI Group has launched the Savannah
Machinery Works in the U.S. state of Georgia. The site is the Group’s second in the
country behind the Orlando Service Center in the state of Florida. The Savannah
Machinery Works is operated by Mitsubishi Power Systems Americas, Inc. (MPSA), a
Florida-based subsidiary in MHI’s power systems business in the United States.
View inside the Savannah Machinery Works
New York
Boston
Halifax
Washington D.C.
Nashville
Atlanta
Minneapolis
Winnipeg
New Orleans
Los Angeles
San Francisco
Salt Lake City
Seattle
Vancouver
Juneau
Anchorage
Edmonton
Regina
Detroit
Chicago
Toronto
Ottawa
Québec
Miami
CANADA
Savannah
MPSA/Orlando Service Center
Canada
Mexico
United States of America
Gas Turbine Orders Worldwide
0–10 units
11–20 units
21 or more units
Japan 172
Taiwan 22
Korea 12
Mexico 21
U.S.A. 53
Indonesia 25
U.K. 13
Spain 12
Saudi Arabia 35
Thailand 22
India 10
China 26
Iran 11Qatar 14
An opening ceremony for the Savannah Machinery Works, which
also marked the start of full-scale operations at the combustor man-
ufacturing plant, was held in May 2011. Construction of gas and
steam turbine rotor servicing and gas turbine assembly plants is still
under way at the Savannah site, with the construction of a fabrica-
tion plant for rotors, the core component of gas turbines, also under
consideration. Through this series of investments, MHI’s intent is to
incrementally enhance its structure for a host of production and
services. These will encompass everything from the manufacture of
gas and steam turbine core components and main unit assembly, to
the maintenance and upgrade of rotors and other major compo-
nents. MHI will work to realize its target of securing a 30% share of
the world gas turbine market. Plans call for reinforcing the product-
wide supply chain in the United States as the Group develops a
more robust production system anchored in Japan and the United
States that is highly resistant to exchange rate volatility.
MITSUBISHI HEAVY INDUSTRIES, LTD.4

35%
Gas TurbIne servICe neTwork
During periodic inspections of gas turbines each year, high-temperature components,
which can become easily worn during turbine operation, must be inspected and
repaired or replaced. The delivery of more turbine units worldwide is sparking a global
growth trend in repair and maintenance demand.
To systematically meet this demand, MHI Group is developing a closely-knit busi-
ness network with customers in a host of regions, one that includes cooperative ven-
tures with prominent users outside Japan.
In line with the development of this service business network (called the Diamond
Service Network), service business sales are projected to expand to account for 35%
of sales by fiscal 2014.
Recently completed EGAT Diamond Service mainte-nance center for high-temperature components in gas turbines
Promoting appealing services under the motto “CS (Customer Service) First!”
Europe: In addition to the acquisition of field service specialist Maintenance Partners NV (Belgium), MHI Group is enhancing gas turbine
component manufacturing and maintenance operations via a capital stake in ATLA (Italy)
Southeast Asia: As a joint venture with the Electricity Generating Authority of Thailand (EGAT), the Group established a new company for
gas turbine component repair (EGAT Diamond Service)
May 2011: Operations launched at the
repair factory and maintenance plant
North America: In a follow-up to the Orlando
Service Center (OSC), the Group is phasing in a
broader production and service framework at
the Savannah Machinery Works (USA), includ-
ing precision inspection of gas and steam tur-
bine rotors, gas turbine component
manufacturing, and large ST rotor
manufacturing
Middle East/North Africa: Promoting the devel-
opment of service bases primarily in the Middle
East, the delivery site for many gas turbines.
Latest trend
Business system strengthened in Middle East and North Africa Abu Dhabi, Morocco etc.
AmericasMPSA
OSC (Orlando Service Center)OSC (Orlando Service Center)OSC (Orlando Service Center)SMW (Savannah Machinery Works)SMW (Savannah Machinery Works)SMW (Savannah Machinery Works)SMW (Savannah Machinery Works)SMW (Savannah Machinery Works)SMW (Savannah Machinery Works)SMW (Savannah Machinery Works)SMW (Savannah Machinery Works)
Europe/Middle EastMPSE
Maintenance PartnersATLAATLAATLAATLA
AsiaMHI
MPS-AP, MPS-T, MPS-I
SMW
Equity participation in ATLA
CBC
MPSAOSC
MPSE
P.T. POSSI
MHI Korea Service Dept.
MHI Taiwan Service Dept.
Mitsubishi Donfang GasTurbine (Guangzhou JV)
BFG Service(Nanjing)
MPSA-LA
MHI-MEX
Maintenance Partners
MPS-AP (HQ)MPS-TMPS-I
Base Partner
MPSA: Mitsubishi Power Systems AmericasMPSE: Mitsubishi Power Systems EuropeMPS-AP: Mitsubishi Power Systems Asia Pacific
EGAT DiamondService Co, Ltd.
ANNUAL REPORT 2011 5ANNUAL REPORT 2011 5

A MessAge froM the MAnAgeMent
our technologies, Your tomorrow
Hideaki Omiya, President
Kazuo Tsukuda, Chairman
6 MITSUBISHI HEAVY INDUSTRIES, LTD.

We extend our heartfelt sympathies to the people affected by
the earthquake that struck eastern Japan. The reconstruction
of stricken areas is expected to take a long time. As an organi-
zation playing a major role in developing social infrastructure,
the entire Company will continue to help restore affected areas
as quickly as possible.
The global economy was generally more stable during
fiscal 2010. China, India and other emerging economies con-
tinued to expand, and industrialized nations began to see a
gradual recovery. In general, the Japanese economy also
began to experience a gradual recovery, underpinned by
increased personal consumption and a rebound in capital
investment that was driven by exports to emerging economies.
However, some concerns about the future economic situation
in Japan persist, particularly in the aftermath of the Great East
Japan Earthquake last March.
MHI will continue to fulfill its wider business responsibility
of supporting social and industrial infrastructure. Our other
primary focus will be to further improve management and
operating processes in order to succeed in the increasingly
difficult competitive environment, and to accelerate our global
business development.
Based on our 2010 medium-term business plan, which
began from April 2010, MHI further increased its efforts to
gain orders in our two core businesses for the future: “Energy
& Environment” and “Transportation, Social & Industrial Infra-
structure,” while promoting business alliances and optimizing
global production and service bases. At the same time,
through consolidating and, in some situations, spinning-off
production centers as a result of changes in the market envi-
ronment, MHI implemented far-reaching business structure
reforms to establish a more flexible and responsive manage-
ment system.
In connection with growing our business and working
toward the goals outlined above, meeting our Corporate
Social Responsibility (CSR) obligations continues to be a top
priority for our management, including each of our compli-
ance, environmental protection, and internal control obliga-
tions. MHI is dedicated to improving our products and
services from the perspective of our customers and society
as a whole, with a view to how we can best contribute to
social development. We would like to thank you for your
continued understanding and support.
Hideaki Omiya, President
Kazuo Tsukuda, Chairman
ANNUAL REPORT 2011 7

CreeD
We strongly believe that the customer comes first and that we are
obligated to be an innovative partner to society.
We base our activities on honesty, harmony, and a clear distinction
between public and private life.
We shall strive for innovative management and technological devel-
opment from an international perspective.
Reason for Instituting the Creed
In Japan there are many enterprises with their
own “creeds” which simply represent their man-
agement concept.
Mitsubishi Heavy Industries, Ltd. has a creed of
this type, also. This creed was instituted in 1970
on the basis of the policy advocated by Koyata
Iwasaki, president of Mitsubishi Goshi Kaisha in
Forward-Looking StatementsForecasts regarding future performance in this report are based on judgments made in accordance with information available at the time this presentation was prepared. As such, these projections involve risks and uncertainties. For this reason, investors are recommended not to depend solely on these projections for making investment decisions. It is possible that actual results may differ significantly from these projections for a number of factors. Such factors include, but are not limited to, economic trends affecting the Com-pany’s operating environment, currency movements of the yen value to the U.S. dollar and other foreign currencies, and trends of stock markets in Japan.
the 1920s, to indicate the essential attitude of the
company, the mental attitude of the employees,
and the future directions of the company. The
reason for instituting the present creed is so that
all of us can call to mind our one hundred years
of tradition, and strive for further development in
the future.
1
2
3
MITSUBISHI HEAVY INDUSTRIES, LTD.8

ConTenTs
P12Interview with the President
P20 Review of Operations
P20 P22
P24 P26
P28 P30
P32 Topic
How will MHI meet the world’s growing demand for energy in the future?
“MHI Group Thermal Power Generation”
6 A Message from the Management
8 Creed
10 Consolidated Financial Highlights
11 Consolidated Financial Performance
12 Interview with the President
Progress on the 2010 Medium-term business Plan and Impact of the March 2011 Great east Japan earthquake
19 MHI at a Glance
20 Review of Operations20 Shipbuilding & Ocean Development
22 Power Systems
24 Machinery & Steel Structures
26 Aerospace
28 General Machinery & Special Vehicles
30 Others
32 TopicInitiatives in energy and environmental Technologies
34 Intellectual Property and R&D
35 Corporate Governance
40 Board of Directors
42 Corporate Social Responsibility
44 Environmental Activities
45 Financial Section
77 Corporate Data
Initiatives in energy and environmental Technologies
ANNUAL REPORT 2011 9

Mitsubishi Heavy Industries, Ltd. and Consolidated SubsidiariesYears ended March 31 of respective years
In millions of yen except per share amounts
In thousands of U.S. dollars
except per share amounts*
2011 2010 2009 2008 2007 2006 2011
Net sales ¥2,903,770 ¥2,940,887 ¥3,375,674 ¥3,203,085 ¥3,068,504 ¥2,792,108 $34,922,068
Operating income 101,219 65,660 105,859 136,030 108,912 70,912 1,217,306
Interest expense–net of interest
income and dividend income (14,942) (15,674) (6,031) (5,729) (4,807) (1,968) (179,699)
Income before income taxes
and minority interests 39,499 28,137 64,923 101,375 83,711 52,383 475,033
Net income 30,117 14,163 24,217 61,332 48,839 29,816 362,200
Per share information of common stock:
(yen / U.S. dollars)
Net income–basic ¥ 8.97 ¥ 4.22 ¥ 7.22 ¥ 18.28 ¥ 14.56 ¥ 8.85 $ 0.108
Net income–diluted 8.96 4.22 7.21 18.27 14.55 8.83 0.108
Net assets 376.17 380.80 369.94 423.17 425.54 410.15 4.524
Cash dividends 4.00 4.00 6.00 6.00 6.00 4.00 0.048
Total assets ¥3,989,001 ¥4,262,859 ¥4,526,213 ¥4,517,148 ¥4,391,864 ¥4,047,122 $47,973,553
Net assets** 1,312,678 1,328,772 1,283,251 1,440,429 1,446,436 1,376,289 15,786,867
Current assets 2,575,613 2,826,662 3,165,059 2,936,886 2,787,315 2,543,485 30,975,502
Current liabilities 1,534,070 1,555,796 1,994,892 1,825,894 1,807,411 1,626,662 18,449,428
Interest-bearing debts 1,325,667 1,495,325 1,612,859 1,365,393 1,273,572 1,198,664 15,943,078
Cash flows:
Cash flows from operating activities ¥ 337,805 ¥ 117,977 ¥ 79,533 ¥ 161,823 ¥ 158,721 ¥ 73,928 $ 4,062,597
Cash flows from investing activities (137,248) (180,704) (156,593) (193,055) (158,653) (104,065) (1,650,607)
Ratios:
Return on equity*** 2.37% 1.12% 1.82% 4.31% 3.48% 2.22%
Equity ratio**** 31.64% 29.98% 27.43% 31.44% 32.52% 34.01%
Notes: * U.S. dollar amounts in this annual report are translated from yen, for convenience only, at the rate of ¥83.15 = US$1, the exchange rate prevailing at March 31, 2011.
** In calculating the net assets, MHI and its consolidated subsidiaries have applied the “Accounting Standard for Presentation of Net Assets in the Balance Sheet” (Accounting Standards Board of Japan (ASBJ) Statement No. 5) and the “Guidance on Accounting Standard for Presentation of Net Assets in the Balance Sheet” (ASBJ Guidance No. 8) since the year ended March 31, 2007.
*** Return on equity = net income / (net assets – share subscription rights – minority interests) × 100
**** Equity ratio = (net assets – share subscription rights – minority interests) / total assets × 100
ConsolIDaTeD fInanCIal HIGHlIGHTs
MITSUBISHI HEAVY INDUSTRIES, LTD.10

net sales(In billions of yen)
operating Income(In billions of yen)
net Income(In billions of yen)
ConsolIDaTeD fInanCIal PerforManCe
4,000
3,000
2,000
1,000
0
09 10 110807
Total assets(In billions of yen)
5,000
4,000
3,000
2,000
1,000
0
09 10 110807
l Net income—basic (left scale)l Net assets (right scale)
Per share Information of Common stock(yen)
25 500
20 400
15 300
10 200
5 100
00
09 10 110807
150
100
50
0
09 10 110807
net assets(In billions of yen)
1,500
1,000
500
0
09 10 110807
l Return on equity (left scale)l Equity ratio (right scale)
ratios(%)
8 40
6 30
4 20
2 10
00
09 10 110807
80
60
40
20
0
09 10 110807
Interest-bearing Debts(In billions of yen)
2,000
1,500
1,000
500
0
09 10 110807
n Cash flows from operating activitiesn Cash flows from investing activities
Cash flows(In billions of yen)
400
200
100
300
0
–100
–200
09 10 110807
ANNUAL REPORT 2011 11

We continued to work assiduously to win orders. As a result, the value of consolidated orders received
rose across all business segments. Although consolidated net sales were largely unchanged year on year,
operating, ordinary and net income all exceeded prior-year performance.
MHI Group continued working vigorously to win new orders.
As a result, the value of consolidated orders received climbed
more than 21% year on year, to ¥2,995.4 billion. Increases
were recorded in every business segment, including Aero-
space, which won major contracts in the U.S.
Consolidated net sales remained around the same level as
a year earlier, at ¥2,903.7 billion. While net sales rose in Ship-
building & Ocean Development on increased deliveries of new
vessels, and in General Machinery & Special Vehicles on a
recovery in demand, net sales decreased in both Power Sys-
tems and Machinery & Steel Structures.
With respect to earnings, the Group was able to increase
profits despite the strong yen, thanks to company-wide
InTervIew wITH THe PresIDenT
activities to boost profitability. This included improved plant
construction profitability in Power Systems and Machinery &
Steel Structures. As a result, operating income increased ¥35.5
billion to ¥101.2 billion, while ordinary income increased ¥44.1
billion to ¥68.1 billion.
We experienced a net extraordinary loss of ¥28.6 billion,
which included extraordinary gains from the sale of fixed assets
and investment securities, and extraordinary losses from busi-
ness structure improvement expenses, investment securities
valuation losses and damages to a thermal power plant (which
was under construction) caused by the Great East Japan Earth-
quake. Overall, net income grew ¥15.9 billion to ¥30.1 billion.
Question
1 Can you give us an overview of business results for fiscal 2010?
Progress on the 2010 Medium-term business Plan and Impact of the March 2011 Great east Japan earthquake
Hideaki Omiya, President
FY2010 Results and Analysis
MITSUBISHI HEAVY INDUSTRIES, LTD.12

Orders received recovered to the ¥3-trillion level, and the 2010 Business Plan’s presence was also
evident in terms of profit.
After temporarily suspending the 2008 Business Plan due to
the global recession, we moved in the previous fiscal year to
advance the new 2010 Business Plan. Consequently, orders
received in fiscal 2010 recovered to the ¥3-trillion level, with
sales and income also beating initial plan.
Under the 2010 Business Plan, we continued and deep-
ened business process reform begun under the 2008 Business
Plan, the benefits of which we enjoyed in fiscal 2010.
To give an analysis of the factors that drove change in
operating income from fiscal 2007 to fiscal 2010, despite the
adverse effects of a strong yen, business process reform within
the Technology & Innovation Headquarters and Production
System Innovation Planning Department resulted in steady
improvements across the board. In that sense, the influence of
the 2010 Business Plan was clearly evident.
Question
2Looking back on performance in fiscal 2010, would you say that the
initiatives outlined in the 2010 Business Plan were successful?
Growth process
Responding to changes in society after the earthquake
Great Eastern Japan Earthquake
FY2006FY2005 FY2007 FY2010 FY2011(Forecast)
FY2009FY2008 FY2012(Intermediary
Targets)
FY2014(Targets)
108.970.9
2.79
2.94 3.273.71
3.06 3.20
3.37
3.26
2.94
2.47
2.99
2.90
3.003.10
2.80
75.0
2.85
3.80
3.40
4.40
4.10
136.0105.8
65.6101.2 110.0
160.0
250.0
3.5
115
2.2
111
4.3
115
1.8
103
1.1
95
2.4
89
3.0
85
5.0
90
8.0
90
Orders received(In trillions of yen)
Net sales(In trillions of yen)
2010 Business Plan
2006 Business Plan 2008 Business Plan
Challenge 09 Reform process
Operating income(In billions of yen)
ROE (%)
Foreign ExchangeRate
(JPY/US$)
(Actual)
Initial plan for FY2010
(1.6)
(90)
The global recession
Strong yen
FY2008 FY2009
Others125.8
FY2010
Foreignexchange
Change inmaterial costs
Systemrevision
Change inR&D costs
Effect of changes in net sales(includingchange in
product mix)2008 Medium-Term
Business Plan2010 Medium-Term
Business Plan
FY2007(Actual)
FY2010(Actual)
136.0 (137.6)
(27.0)
(25.8) (7.1) 37.0
34.7
41.3
49.8
101.2
(In billions of yen)
2010 Business Plan making good progress
Analysis of change in operating income from FY2007 to FY2010
ANNUAL REPORT 2011 13
InTeRvIeW WITH THe PResIdenT
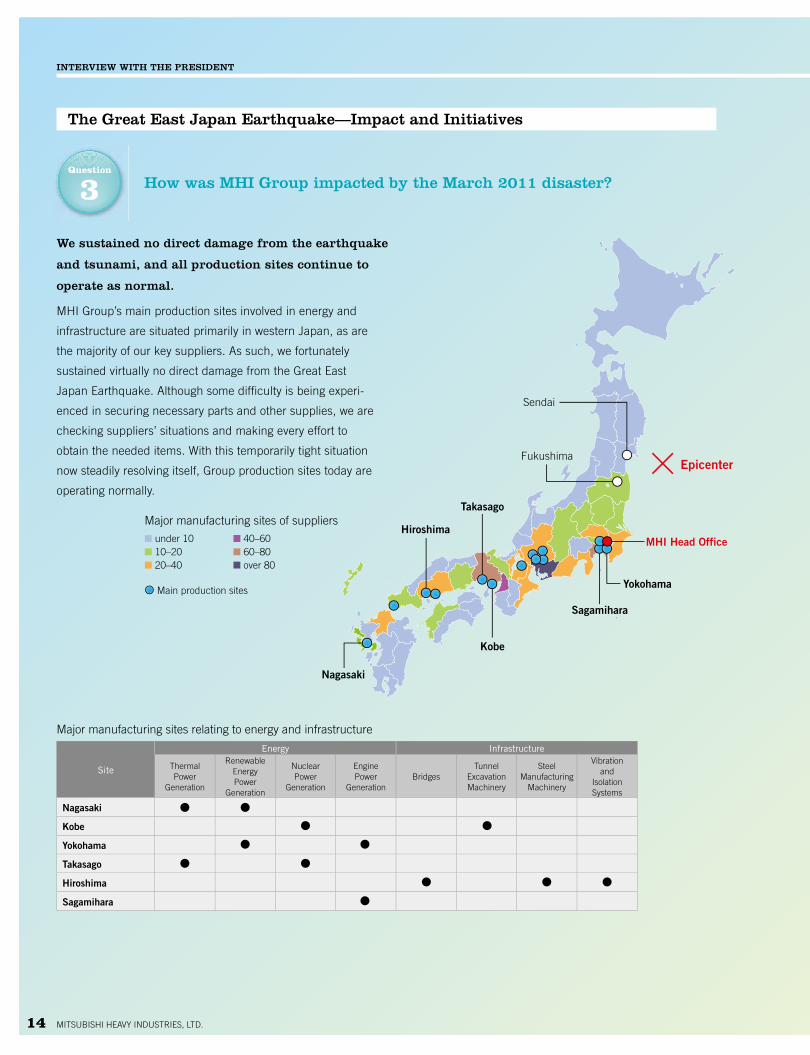
We sustained no direct damage from the earthquake
and tsunami, and all production sites continue to
operate as normal.
MHI Group’s main production sites involved in energy and
infrastructure are situated primarily in western Japan, as are
the majority of our key suppliers. As such, we fortunately
sustained virtually no direct damage from the Great East
Japan Earthquake. Although some difficulty is being experi-
enced in securing necessary parts and other supplies, we are
checking suppliers’ situations and making every effort to
obtain the needed items. With this temporarily tight situation
now steadily resolving itself, Group production sites today are
operating normally.
Question
3 How was MHI Group impacted by the March 2011 disaster?
The Great east Japan earthquake—Impact and Initiatives
Fukushima
Hiroshima
Takasago
Yokohama
MHI Head Office
Epicenter
Sagamihara
Kobe
Nagasaki
Sendai
Major manufacturing sites of suppliers
n under 10n 10–20n 20–40
n 40–60n 60–80n over 80
Main production sites
Major manufacturing sites relating to energy and infrastructure
Site
Energy Infrastructure
ThermalPower
Generation
RenewableEnergyPower
Generation
NuclearPower
Generation
EnginePower
GenerationBridges
TunnelExcavationMachinery
SteelManufacturing
Machinery
Vibrationand
IsolationSystems
Nagasaki
Kobe
Yokohama
Takasago
Hiroshima
Sagamihara
MITSUBISHI HEAVY INDUSTRIES, LTD.14

As a corporate entity that supports Japan’s social infrastructure, we are pooling our comprehensive strengths
in an ongoing push to support a swift recovery in areas hardest hit by the recent earthquake.
MHI Group is committed to providing products of impeccable safety and reliability.
In the wake of the March 2011 disaster, MHI Group has dis-
patched a total of more than 10,000 employees to the
stricken region as of May 31, 2011, with the hopes of swiftly
restoring thermal power plants and other key social infrastruc-
ture that was damaged. In addition to using company aircraft
to transport relief supplies to the areas affected, our emer-
gency disaster response and full-on commitment to support-
ing restoration efforts included carrying out repairs and
inspections of products delivered earlier by MHI Group. This
was particularly the case with respect to nuclear power, where
we launched initiatives with customers immediately following
Customers of MHI Group in the U.S. intend to continue with
slated projects, and so we are implementing them as planned.
And naturally, we will continue to provide safe and reliable
products that will contribute to stable power supplies. Taking
the accident at the Fukushima Daiichi Nuclear Power Plant
seriously, we will of course dedicate all our strength to a recov-
ery in confidence in nuclear power. Furthermore, among MHI’s
range of joint initiatives with Hitachi, we have begun to
the earthquake to confirm the safety of existing power plants.
As for thermal power plants, we are striving to restore dam-
aged plants to working order, and, as an emergency measure,
have significantly stepped up the construction of gas turbine-
based plants and the production of small- and medium-sized
diesel power generators.
Our support also extends to medical activities. At the
request of the Japan Medical Association and other entities, we
dispatched doctors and nurses from company medical facili-
ties, and opened company facilities to accept patients.
consider providing support to actions at the Fukushima Daiichi
Nuclear Power Plant.
Despite a short-term lull in demand, nuclear power gen-
eration is expected to play an important role in the future, both
to meet society’s demand for energy and to preserve the envi-
ronment. We will continue working diligently to provide highly
safe and reliable nuclear power technologies.
Question
4
Question
5
What can you tell us about MHI Group’s role in supporting restoration
efforts following the tragic disaster?
What initiatives are you undertaking in nuclear energy systems?
ANNUAL REPORT 2011 15
InTeRvIeW WITH THe PResIdenT
2010 Business Plan Progress
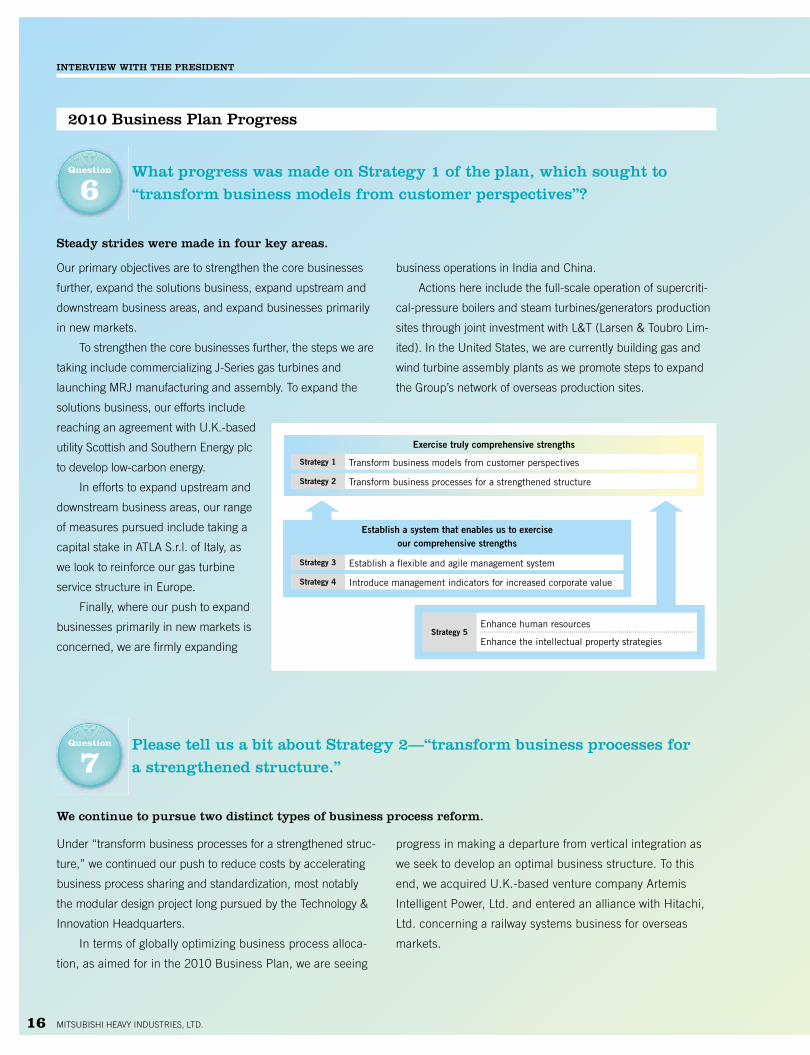
steady strides were made in four key areas.
Our primary objectives are to strengthen the core businesses
further, expand the solutions business, expand upstream and
downstream business areas, and expand businesses primarily
in new markets.
To strengthen the core businesses further, the steps we are
taking include commercializing J-Series gas turbines and
launching MRJ manufacturing and assembly. To expand the
solutions business, our efforts include
reaching an agreement with U.K.-based
utility Scottish and Southern Energy plc
to develop low-carbon energy.
In efforts to expand upstream and
downstream business areas, our range
of measures pursued include taking a
capital stake in ATLA S.r.l. of Italy, as
we look to reinforce our gas turbine
service structure in Europe.
Finally, where our push to expand
businesses primarily in new markets is
concerned, we are firmly expanding
business operations in India and China.
Actions here include the full-scale operation of supercriti-
cal-pressure boilers and steam turbines/generators production
sites through joint investment with L&T (Larsen & Toubro Lim-
ited). In the United States, we are currently building gas and
wind turbine assembly plants as we promote steps to expand
the Group’s network of overseas production sites.
Question
6What progress was made on strategy 1 of the plan, which sought to
“transform business models from customer perspectives”?
We continue to pursue two distinct types of business process reform.
Under “transform business processes for a strengthened struc-
ture,” we continued our push to reduce costs by accelerating
business process sharing and standardization, most notably
the modular design project long pursued by the Technology &
Innovation Headquarters.
In terms of globally optimizing business process alloca-
tion, as aimed for in the 2010 Business Plan, we are seeing
progress in making a departure from vertical integration as
we seek to develop an optimal business structure. To this
end, we acquired U.K.-based venture company Artemis
Intelligent Power, Ltd. and entered an alliance with Hitachi,
Ltd. concerning a railway systems business for overseas
markets.
Question
7Please tell us a bit about strategy 2—“transform business processes for
a strengthened structure.”
Exercise truly comprehensive strengths
Establish a system that enables us to exercise our comprehensive strengths
Strategy 1
Strategy 2
Strategy 3
Strategy 5
Strategy 4
Transform business models from customer perspectives
Transform business processes for a strengthened structure
Establish a flexible and agile management system
Enhance human resources
Enhance the intellectual property strategies
Introduce management indicators for increased corporate value
MITSUBISHI HEAVY INDUSTRIES, LTD.16

We made sweeping reforms to our management system, which had been a long-standing management
issue, crafting a system that can take optimal advantage of MHI Group’s comprehensive strengths.
To establish the flexible and agile management structure tar-
geted in Strategy 3, we implemented sweeping reform of our
management system, which had been a long-standing man-
agement issue.
Our previous management structure saw business seg-
ments and works segregated along functional lines, namely
sales and production. But from April 2011, we opted instead to
concentrate at our business segments all related product busi-
ness functions. From this reform, business segments can use
their now centralized responsibility for business to make faster
decisions, for a system that will enable MHI Group to succeed
against the competition.
Similarly, we have reinforced strategic functions, along with
business support and governance functions, at corporate man-
agement divisions as well. Ultimately, we have put a structure
into place that can optimally showcase the comprehensive
strengths of MHI Group.
Question
8Please say a few words about strategy 3—“establish a flexible and agile
management system.”
From a matrix of business headquarters and sites to a business headquarters system
Enhance the vertical functions
Business headquarters system
Decentralization
Focus more on customer perspectives
Enhance horizontal functions
Clarify the structure and responsibility
Streamline and speed up m
anagement
Promote sales by region
Develop solutions businesses that will combine multiple products and technologies
Enhance technical foundations(R&D, manufacturing, business processes)
Enhance corporate strategy functionsIntegrate business support functions
Business headquarters C
Business headquarters B
Business headquarters A
President
Global Strategy Headquarters
Technical Administration Headquarters(Technical Headquarters + Production System
Innovation Planning Dept.)
Sustainability Energy & Environment Strategic Planning Dept.
CorporateCorporate Planning, Finance, Procurement,
Personnel Affairs
Demonstrate the Group’s comprehensive capability
ANNUAL REPORT 2011 17

InTeRvIeW WITH THe PResIdenT
Outlook for Fiscal 2011
Along with continuing support of restoration efforts following the Great east Japan earthquake, we will
push ahead with management and business process reform and accelerate global business development.
Despite certain volatile factors such as rising crude oil prices,
high unemployment rates, and concerns regarding government
finances and continued financial instability in some industrial-
ized nations, continued overall improvement is expected in the
global economy, fueled by ongoing economic growth in emerg-
ing economies. Likewise, as a result of this continued eco-
nomic growth in the emerging economies, the Japanese
economy is also expected to continue its recovery. The impact
of the Great East Japan Earthquake, however, continues to
cause some uncertainty about the future.
Additionally, we recognize that our business environment
will become even more challenging, with fierce competition
among top global companies vying for emerging markets with
outstanding growth potential. The yen is also likely to remain
strong for the foreseeable future. Particularly since the March
2011 disaster, we have seen power supply shortages in Japan,
as well as reviews of energy policy taking place in countries
worldwide and greater calls to enhance the safety of nuclear
power. The public’s values and approach to considering various
issues are similarly likely to begin changing in the wake of the
tragic disaster.
In this climate, MHI Group will continue to make all pos-
sible efforts to aid Japan’s recovery from the Great East
Japan Earthquake, and thereby fulfill our wider business
responsibility of supporting social and industrial infrastruc-
ture. At the same time, the Group will respond swiftly and
flexibly to social changes triggered by the massive earth-
quake and tsunami. Our other primary focus will be to further
improve management and operating processes in order to
succeed in the increasingly difficult competitive environment,
and to accelerate our global business development.
In terms of our business outlook, for fiscal 2011, ending
March 31, 2012, we are projecting ¥3 trillion in orders
received, net sales of ¥2,850.0 billion, and operating income of
¥110.0 billion. We also expect to see tangible benefits from
business process reform emerge in fiscal 2011.
Question
10Finally, can you briefly discuss the Group’s intended direction in fiscal
2011 and your outlook going forward?
Our management indicator for fiscal 2014 is ROe of 8%, and we plan to fully apply our business grading
system from fiscal 2012 as we emphasize the pursuit of investment efficiency.
In the 2010 Business Plan, we positioned ROE as a key man-
agement indicator, and are exploring the adoption of a busi-
ness grading system.
This business grading system will involve ranking each
product business from multiple perspectives including
marketability, competitiveness and financial health, which in turn
will lead to allocating personnel, funds and other management
resources more efficiently. This system will spearhead our efforts
to construct an optimal business portfolio, and we will advance
further improvements to management processes.
Question
9What progress has been made on strategy 4—“introduce management
indicators for increased corporate value”?
MITSUBISHI HEAVY INDUSTRIES, LTD.18

aerospace
General Machinery & special vehicles
others
shipbuilding & ocean DevelopmentWe develop and build ships and marine structures for a wide range of applications on all the Seven Seas.
Drawing on a century-old tradition and vast depth of accumulated expertise, it proactively addresses future
as well as present needs, responding to environmental regulations and through continuing improvements in
economy, reliability, and safety.
Power systemsWe grapple with issues of concern to everyone, pursuing research on energy problem solutions that keep the
environment safe, as well as new and alternative energy sources. In the nuclear energy field, MHI has been
widely expanding its business as a major manufacturer of nuclear power plants to encompass provision of
PWR (pressurized water reactor) plants, development of FBR (fast breeder reactors), and the establishment
of nuclear fuel cycle plants, among others.
Machinery & steel structuresWe develop and manufacture environmental and chemical plants, transportation systems, bridges, and
crane & material handling systems that form an indispensable part of society’s infrastructure, along with steel
machinery and compressors contributing to the creation of industrial infrastructures. At the same time, MHI
is expanding into new fields such as a diverse range of equipment and devices used in daily life along with
CO2 recovery plants and medical systems contributing to prevention of global warming. MHI will continue to
promote further technological development to contribute to the realization of an enriched society.
We are moving into the space era through R&D based on our leading-edge technologies. The Aircraft
Division is expanding operations through development and participation in commercial airplane and other
new business areas.
The Space Division, serving as the system integrator for the H-IIA Launch Vehicle, is driving Japan’s
exploration and utilization of space.
MHI develops and manufactures a wide range of products that are essential to daily life, such as engine generat-
ing equipment, engines for agricultural/industrial/marine use, turbochargers, forklift trucks and other material
handling equipment. The technological edge we have honed through each of our products is the basis for
making our products environmentally friendly as well, with energy conservation, fuel efficient, and quiet designs.
The Air-conditioning & Refrigeration Systems business boasts an extensive lineup of air-conditioning prod-
ucts, from air-conditioners for commercial, residential and automotive use, to centrifugal chillers. Also, in the
Machine Tool business MHI manufactures a range of machine tools including large machines, gear cutting
machines and other industrial machinery with a focus on minimizing their impact on the environment, such
as through energy-saving design features.
share of net sales
MHI at a GlanCe
10.4%
34.3%
19.2%
16.3%
11.8%
9.7%
ANNUAL REPORT 2011 19

Fiscal 2010 ReviewAs global demand for new shipbuilding began to recover, MHI focused
sales activities on high value-added vessels. Orders for a total of 17 ships
were received, including orders for 2 seismic vessels, 3 LPG carriers and 1
LNG carrier. As a result, FY2010 consolidated orders rose from the previ-
ous year to ¥173.2 billion. Pending consolidated orders for Shipbuilding &
Ocean Development at the end of FY2010 were for 53 ships, totaling
approximately 2.7 million gross tons.
Consolidated net sales rose year on year to ¥302.4 billion, with deliv-
eries of a total of 23 ships, including 11 container ships, 3 LPG carriers,
and 4 “pure car carriers.” Operating income declined to ¥1.8 billion,
despite improved profitability, primarily due to the adverse impact from
the strong yen.
Future InitiativesThe supply-demand balance for regular commercial ships had been greatly
out of sync, reflecting the large volume of orders for ships prior to the global
financial crisis of 2008, which exceeded actual demand. The desire to take
advantage of lower ship prices, however, reignited orders in 2010. Never-
theless, the yen’s growing strength against the U.S. dollar continues to
thwart efforts to close the cost gap with South Korea and China, with severe
conditions on this front expected to continue. In this market environment,
the 2010 Business Plan has targeted Shipbuilding & Ocean Development
as a “Reform Business.” The aims here are to secure stable earnings and
accelerate cost structure reform in order to boost production efficiency. To
do this, MHI is building a business structure suited to changes in the busi-
ness climate, making large-scale projects and products for new business
fields its main business concerns.
Cruise Ship DIAMOND PRINCESS
shipbuilding & ocean Development
300
100
0
FY2010 FY2011forecast
FY2009
200
150.8173.2
210.0
orders received(In billions of yen)
400
0
200
100
300
FY2010 FY2011forecast
FY2009
230.6
302.4 300.0
net sales(In billions of yen)
15
10
5
0
FY2010 FY2011forecast
FY2009
5.0
14.5
1.8
operating Income(In billions of yen)
revIew of oPeraTIons
MITSUBISHI HEAVY INDUSTRIES, LTD.20
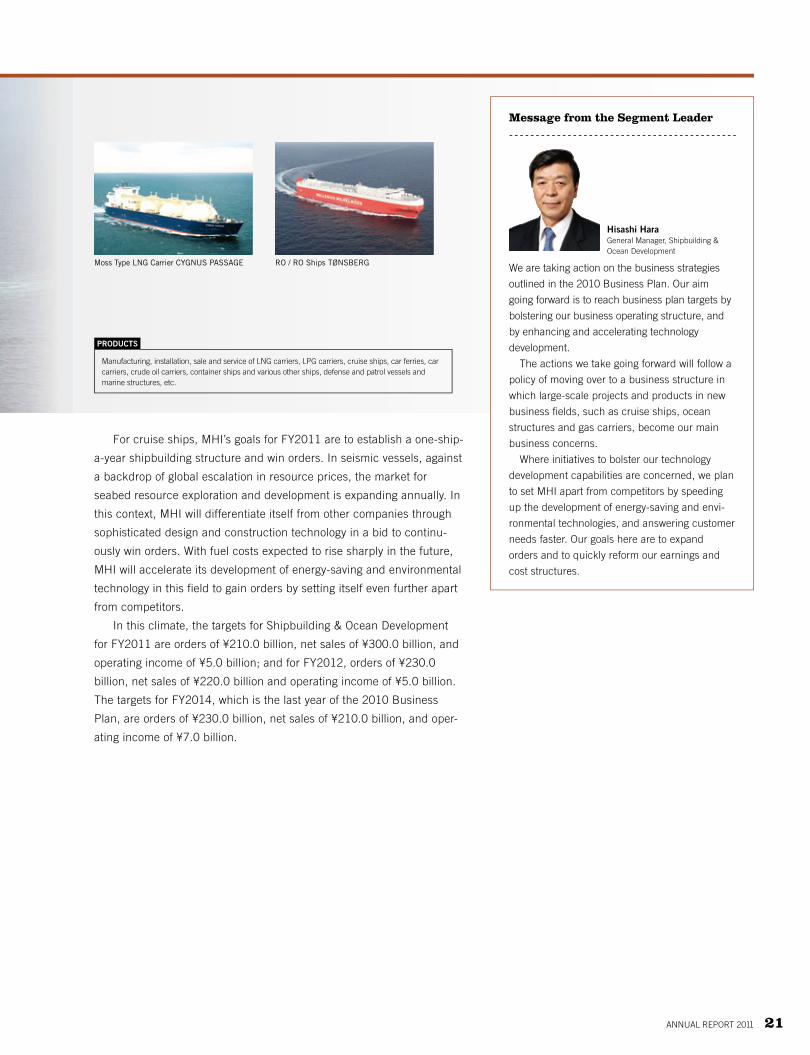
For cruise ships, MHI’s goals for FY2011 are to establish a one-ship-
a-year shipbuilding structure and win orders. In seismic vessels, against
a backdrop of global escalation in resource prices, the market for
seabed resource exploration and development is expanding annually. In
this context, MHI will differentiate itself from other companies through
sophisticated design and construction technology in a bid to continu-
ously win orders. With fuel costs expected to rise sharply in the future,
MHI will accelerate its development of energy-saving and environmental
technology in this field to gain orders by setting itself even further apart
from competitors.
In this climate, the targets for Shipbuilding & Ocean Development
for FY2011 are orders of ¥210.0 billion, net sales of ¥300.0 billion, and
operating income of ¥5.0 billion; and for FY2012, orders of ¥230.0
billion, net sales of ¥220.0 billion and operating income of ¥5.0 billion.
The targets for FY2014, which is the last year of the 2010 Business
Plan, are orders of ¥230.0 billion, net sales of ¥210.0 billion, and oper-
ating income of ¥7.0 billion.
Moss Type LNG Carrier CYGNUS PASSAGE We are taking action on the business strategies
outlined in the 2010 Business Plan. Our aim
going forward is to reach business plan targets by
bolstering our business operating structure, and
by enhancing and accelerating technology
development.
The actions we take going forward will follow a
policy of moving over to a business structure in
which large-scale projects and products in new
business fields, such as cruise ships, ocean
structures and gas carriers, become our main
business concerns.
Where initiatives to bolster our technology
development capabilities are concerned, we plan
to set MHI apart from competitors by speeding
up the development of energy-saving and envi-
ronmental technologies, and answering customer
needs faster. Our goals here are to expand
orders and to quickly reform our earnings and
cost structures.
Message from the segment leader
Manufacturing, installation, sale and service of LNG carriers, LPG carriers, cruise ships, car ferries, car carriers, crude oil carriers, container ships and various other ships, defense and patrol vessels and marine structures, etc.
RO / RO Ships TØNSBERG
PRODUCTS
Hisashi HaraGeneral Manager, Shipbuilding & Ocean Development
ANNUAL REPORT 2011 21

Fiscal 2010 ReviewMHI received orders for gas turbine combined-cycle thermal power plants
within Japan, as the domestic market continues to replace aging facilities to
meet environmental regulations. Gas turbine orders also increased interna-
tionally, particularly in Asia. For nuclear power, MHI was able to reach an
agreement for the pre-construction engineering and planning work for a
U.S. nuclear power plant. The total value of consolidated orders for Power
Systems rose from the previous year to ¥1,022.8 billion.
Consolidated net sales decreased to ¥996.9 billion due to reduced
revenues from thermal power plants, wind turbines and other products.
Nevertheless, despite the net sales decrease and the stronger yen, operat-
ing income increased to ¥83.0 billion as a result of sales growth on the
after-sales service side.
Future InitiativesIn power systems, MHI will move to expand orders won from markets in
both developing and developed countries. To this end, MHI will leverage
manufacturing plants for supercritical-pressure boilers, steam turbines
and generators with Larsen & Toubro Limited (L&T) in India, as well as a
gas turbine assembly plant and wind turbine manufacturing plant in the
U.S. The development of a service network, meanwhile, enabled MHI to
strengthen its service business organization under the slogan CS First!
(Customer Satisfaction First) and develop attractive services. Another
focus will be product development in growth fields. Here, MHI will pro-
mote solution proposal business activities that encompass the “J” series
of gas turbines, which offer the highest level of heat efficiency in the
world, integrated gasification combined cycle (IGCC) power generation,
off-shore wind turbines, the development of lithium-ion batteries, and
measures to help ships comply with environmental regulations and
improve fuel efficiency.
J Gas Turbine
Power systemsRevIeW OF OPeRATIOns
1,500
1,000
500
0
FY2010 FY2011forecast
FY2009
1,100.0982.2 1,022.8
orders received(In billions of yen)
1,500
0
1,000
500
FY2010 FY2011forecast
FY2009
1,066.1996.9 1,000.0
net sales(In billions of yen)
100
80
60
40
20
0
FY2010 FY2011forecast
FY2009
80.082.6 83.0
operating Income(In billions of yen)
MITSUBISHI HEAVY INDUSTRIES, LTD.22

In nuclear energy systems, MHI, in response to changes in the busi-
ness environment, will optimally allocate resources and take action to
meet its planned order targets. In operations in Japan, MHI will take
further steps to improve the safety and reliability of pressurized water
reactor (PWR) plants in light of the lessons learned from the earthquake.
Where support for the Fukushima Daiichi Nuclear Power Plant is con-
cerned, MHI will collaborate with Hitachi, Ltd. to enter alliances with their
respective overseas partners, bringing the collective efforts of Japan, the
U.S. and Europe to the task. In global operations, as well as in Japan,
MHI will seek to enhance further safety and reliability of PWR plants and
focus on priority business negotiations. In addition to strengthening the
promotion of three plant projects in the United States, MHI will focus on
business negotiations in Europe, Jordan and Vietnam, pushing the devel-
opment of the ATMEA1 in partnership with AREVA and the EU-APWR, an
improved PWR plant for the European market. In the service business
overseas, MHI will boost its competitiveness and respond to needs for the
replacement of steam generators and other equipment.
In this climate, the targets for the power systems business are orders of
¥900.0 billion for FY2011, orders of ¥1,200.0 billion for FY2012, and
orders of ¥1,300.0 billion for FY2014. In nuclear energy systems, MHI is
targeting orders of ¥200.0 billion for FY2011, orders of ¥400.0 billion for
FY2012, and orders of ¥600.0 billion for FY2014.
The power systems market is continuing to see
expansion in demand from Asia and emerging
markets. Demand is also expected to gradually
recover in North America and other developed
markets. MHI is pushing for business expansion
through greater localization in promising markets
such as India and the U.S., growing its service
business by enhancing its global network, promot-
ing product development in gas turbines, off-
shore wind turbines and other growth fields, and
securing orders through an assertive approach to
business negotiations. In tandem, we will contrib-
ute to the realization of a low-carbon society
through the pursuit of higher temperature, higher
efficiency technology.
The G8 recently reconfirmed that they will pro-
mote nuclear power generation while insisting
on the highest levels of safety. Furthermore, a
survey taken after the March 2011 earthquake
in Japan showed that 36 countries still have
policies to promote nuclear power. Key MHI
customers have also expressed their intent to
move forward with projects. Upholding a vision
to be the leading company in the global nuclear
energy field, MHI will strive to improve the safety
of PWR plants while supporting recovery and
stable operations at the Fukushima Daiichi
Nuclear Power Plant. By deploying a range of
countermeasures based on the lessons learned
from Fukushima Daiichi, we hope to contribute
broadly to measures to counter global warming,
ensure energy security, and achieve power
supply stability.
Message from the segment leaders
Power systemsManufacturing, installation, sale and service of boilers, steam turbines, gas turbines, diesel engines, water turbine plants, wind turbine plants, geothermal power plants, photovoltaic power systems, SCR (DeNOx) systems, marine machinery, pumps, desalination plants, lithium-ion secondary batteries, etc.
nuclear energy systemsManufacturing, installation, sale and service of pressurized water reactor (PWR) nuclear power plants and equipment, advanced reactor plants, nuclear fuel cycle plants, etc.
Wind Turbine Plants
PRODUCTS
Masafumi WaniGeneral Manager, Power Systems
Shigero MasamoriGeneral Manager, Nuclear Energy Systems
Rendering of proposed US-APWR North Anna unit-3 U.S Utility, Dominion Virginia Power
ANNUAL REPORT 2011 23

Fiscal 2010 ReviewIn general, many customers or potential customers for Machinery & Steel
Structures either postponed or delayed the start of their respective projects,
but MHI was able to focus on new sales activities, which led to an increase in
orders throughout the business segment. Chemical plant orders increased
with a contract for the construction of a large-scale fertilizer plant in the
Republic of Tatarstan (Russian Federation), and transportation systems
orders increased with major orders for Macau LRT and for the Tokyo “Yurika-
mome” waterfront transit line. Environmental equipment orders in Japan also
increased, including an order for a domestic waste treatment plant. Finally,
orders for iron and steel machinery also increased, particularly from China
and India. As a result, the total value of consolidated orders for Machinery &
Steel Structures increased from the previous year to ¥492.6 billion.
Consolidated net sales decreased from the previous year to ¥557.5
billion, mainly as a result of sales declines in steel production machinery
and transportation systems. Nevertheless, operating income rose from
FY2009 to ¥27.0 billion as a result of improved profitability in overseas
plant construction and efficiencies achieved in business restructuring.
Future InitiativesIn terms of growth strategies for major businesses, MHI will aim for further
growth in fertilizer plants and other areas of specialty in environmental and
chemical plants. Other key actions will see growth in the services business
through the enhancement of customer response capabilities from the
establishment of MHI Industrial Engineering & Services Private Ltd. (MIES)
in Singapore, and the establishment of a base in Europe (Amsterdam), to
accelerate the efforts to develop the Middle East and African markets. A
plan to establish an engineering firm in India, thereby strengthening mar-
keting capabilities close to the market, is also under review as MHI aims for
growth through further globalization.
Ammonia Plant (Indonesia)
Machinery & steel structuresRevIeW OF OPeRATIOns
800
600
400
200
FY2010 FY2011forecast
FY20090
610.0
404.3
492.6
orders received(In billions of yen)
800
0
600
400
200
FY2010 FY2011forecast
FY2009
460.0
625.7557.5
net sales(In billions of yen)
30
20
10
0
FY2010 FY2011forecast
FY2009
25.0
3.0
27.0
operating Income(In billions of yen)
MITSUBISHI HEAVY INDUSTRIES, LTD.24
In transportation systems, MHI will grow the solutions business by
promoting business coordination with the Sustainability Energy & Environ-
ment Strategic Planning Department. In parallel, work with Hitachi targeting
urban transportation systems in major cities overseas will accelerate MHI’s
business development efforts in emerging economies.
In iron and steel machinery, MHI will vigorously develop upstream
business mainly through device development in the steel production field.
To accelerate business promotion in emerging markets, where future
demand is anticipated, MHI is taking steps to enhance cost competitive-
ness led by its joint venture in China. Moves will also be made to bolster
alliances with local manufacturers in India through the establishment of a
local subsidiary there.
Turning to compressors, in the natural gas market, where future growth
is expected, MHI is cultivating markets in the energy resources field,
advancing notably into compressors used in off-shore LNG plants. MHI is
also speeding the pace of business development in emerging economies
through a more robust structure that includes local production, and expan-
sion of its service business base in the Middle East.
In this climate, the targets for Machinery & Steel Structures for FY2011
are orders of ¥610.0 billion, net sales of ¥460.0 billion, and operating income
of ¥25.0 billion; and for FY2012, orders of ¥640.0 billion, net sales of ¥600.0
billion and operating income of ¥32.0 billion. The targets for FY2014, which
is the last year of the 2010 Business Plan, are orders of ¥810.0 billion, net
sales of ¥730.0 billion, and operating income of ¥40.0 billion.
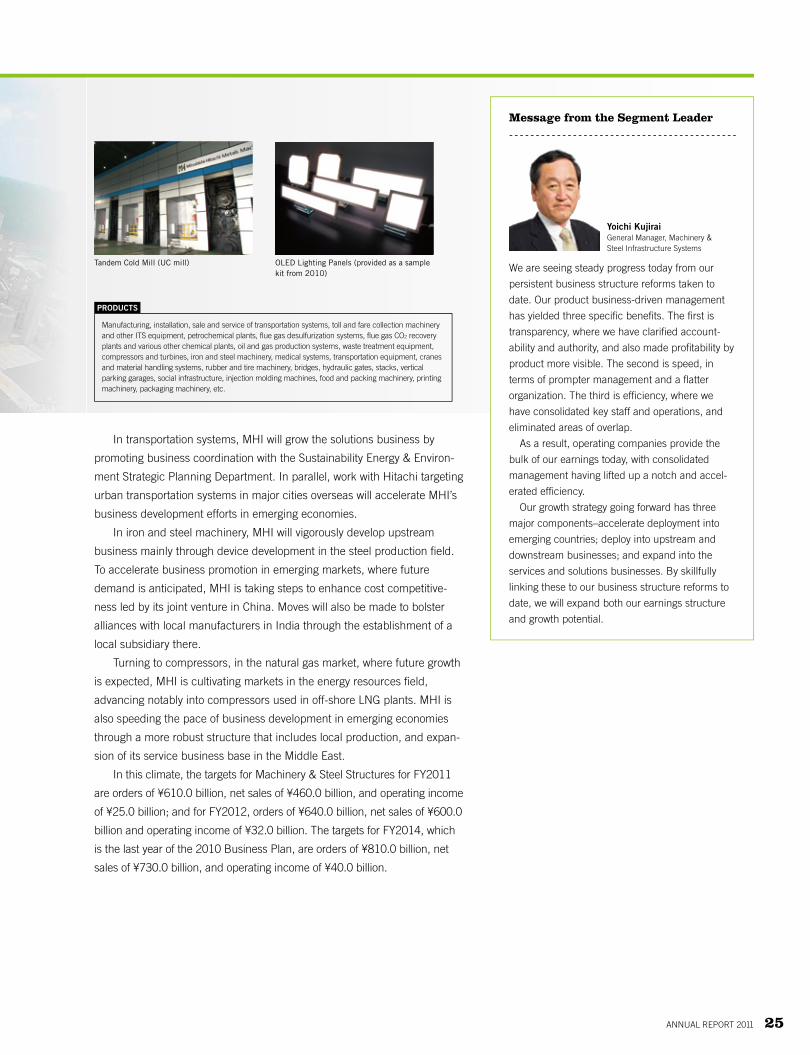
Tandem Cold Mill (UC mill) We are seeing steady progress today from our
persistent business structure reforms taken to
date. Our product business-driven management
has yielded three specific benefits. The first is
transparency, where we have clarified account-
ability and authority, and also made profitability by
product more visible. The second is speed, in
terms of prompter management and a flatter
organization. The third is efficiency, where we
have consolidated key staff and operations, and
eliminated areas of overlap.
As a result, operating companies provide the
bulk of our earnings today, with consolidated
management having lifted up a notch and accel-
erated efficiency.
Our growth strategy going forward has three
major components–accelerate deployment into
emerging countries; deploy into upstream and
downstream businesses; and expand into the
services and solutions businesses. By skillfully
linking these to our business structure reforms to
date, we will expand both our earnings structure
and growth potential.
Message from the segment leader
Manufacturing, installation, sale and service of transportation systems, toll and fare collection machinery and other ITS equipment, petrochemical plants, flue gas desulfurization systems, flue gas CO2 recovery plants and various other chemical plants, oil and gas production systems, waste treatment equipment, compressors and turbines, iron and steel machinery, medical systems, transportation equipment, cranes and material handling systems, rubber and tire machinery, bridges, hydraulic gates, stacks, vertical parking garages, social infrastructure, injection molding machines, food and packing machinery, printing machinery, packaging machinery, etc.
OLED Lighting Panels (provided as a sample kit from 2010)
PRODUCTS
Yoichi KujiraiGeneral Manager, Machinery & Steel Infrastructure Systems
ANNUAL REPORT 2011 25

Fiscal 2010 ReviewIn the commercial aircraft business, orders increased thanks in part to a
large order from a U.S. company for the Mitsubishi Regional Jet (MRJ) and
increased orders for the B777 (aft fuselage), as well as a recovery from low
demand for aircraft passengers. Orders for defense-related products also
increased, notably for Patriot missile systems. Space systems orders also
surpassed the previous year amounts. As a result, the total value of consoli-
dated orders for Aerospace increased to ¥708.1 billion.
Consolidated net sales decreased from the previous year to ¥472.2
billion as a result of lower sales of commercial aircraft, defense-related
products and space systems. Although operating income improved from
the previous year, Aerospace posted an operating loss of ¥3.4 billion,
mainly due to MRJ-related research and development costs.
Future InitiativesThe business environment surrounding the commercial aircraft busi-
ness is right on track for recovery in demand, with long-term expansion
anticipated, by sustained development in emerging nations, and airline
companies’ recovering business vitality in recent years. Against this
backdrop, MHI will work in the commercial aircraft field to increase
earnings by optimizing the portfolio of complete aircraft (MRJ), joint
development under international cooperation (787, others), and aeroen-
gines (Trent 1000, others). Along these lines, in addition to securing
profits with a focus on the 777 and other joint developments under
international cooperation with Boeing, MHI will develop the complete
aircraft (MRJ) business to establish dual earnings sources in this busi-
ness. MHI will also promote overseas production as a measure to miti-
gate foreign exchange rate risks, and pursue further cost reductions.
Boeing787 Dreamliner
aerospaceRevIeW OF OPeRATIOns
800
600
400
200
0
FY2010 FY2011forecast
FY2009
435.5
708.1
470.0
orders received(In billions of yen)
600
0
400
200
FY2010 FY2011forecast
FY2009
490.0500.2472.2
net sales(In billions of yen)
0
–2
–10.0
–4
–6
–8
–10
FY2010 FY2011forecast
FY2009
–6.4
–3.4
operating Income (loss)(In billions of yen)
MITSUBISHI HEAVY INDUSTRIES, LTD.26
In defense-related products, MHI will maintain its production and tech-
nological bases related to fighter jets, and promote the joint development of
a Ballistic Missile Defense (BMD) system between Japan and the United
States. MHI will also respond to budget decreases in this field, securing
base load by acquiring orders for repairs and spare parts. Coupled with the
steady promotion of new programs (Advanced Technology Demonstrator,
new Air-to-Ship missile, others), MHI will expand and develop this business
by responding to national needs.
In space systems, MHI recorded 14 consecutive successful launches of
the H-IIA/H-II B rocket, and will leverage this improved reliability to secure
base load. The development of an H-IIA upgrade/next-generation primary
launch system will also take place, with the aim of strengthening MHI’s
international competitiveness for launch services. Additionally, MHI will push
the development of HTV-R (HTV improved model with recovery functions),
which will help enable future human space activities.
In this climate, the targets for the Aerospace business for FY2011 are
orders of ¥470.0 billion, net sales of ¥490.0 billion, and an operating loss
of ¥10.0 billion; and for FY2012, orders of ¥510.0 billion, net sales of
¥500.0 billion and operating income of ¥0.0 billion. The targets for FY2014,
which is the last year of the 2010 Business Plan, are orders of ¥590.0
billion, net sales of ¥650.0 billion, and operating income of ¥17.0 billion.
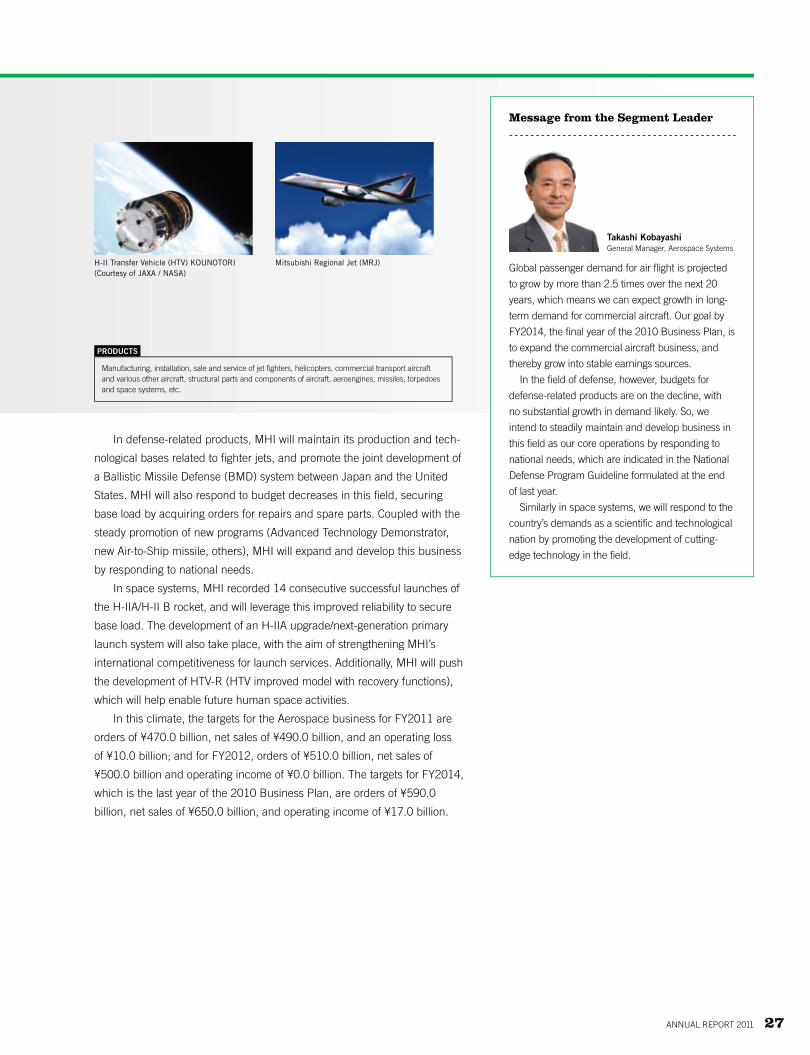
H-II Transfer Vehicle (HTV) KOUNOTORI (Courtesy of JAXA / NASA) Global passenger demand for air flight is projected
to grow by more than 2.5 times over the next 20
years, which means we can expect growth in long-
term demand for commercial aircraft. Our goal by
FY2014, the final year of the 2010 Business Plan, is
to expand the commercial aircraft business, and
thereby grow into stable earnings sources.
In the field of defense, however, budgets for
defense-related products are on the decline, with
no substantial growth in demand likely. So, we
intend to steadily maintain and develop business in
this field as our core operations by responding to
national needs, which are indicated in the National
Defense Program Guideline formulated at the end
of last year.
Similarly in space systems, we will respond to the
country’s demands as a scientific and technological
nation by promoting the development of cutting-
edge technology in the field.
Message from the segment leader
Manufacturing, installation, sale and service of jet fighters, helicopters, commercial transport aircraft and various other aircraft, structural parts and components of aircraft, aeroengines, missiles, torpedoes and space systems, etc.
Mitsubishi Regional Jet (MRJ)
PRODUCTS
Takashi KobayashiGeneral Manager, Aerospace Systems
ANNUAL REPORT 2011 27

Fiscal 2010 ReviewOrders for medium- and small-sized engines increased, particularly in China
where demand remains firm amid continued robust economic growth.
Orders for turbochargers remained strong in Europe, and orders for forklifts
increased as a result of expanded sales activities in Asia and in the Middle
East. As a result, the total value of consolidated orders and consolidated net
sales for General Machinery & Special Vehicles both increased to ¥344.1
billion and ¥343.0 billion, respectively. Although operating results improved
from FY2009, General Machinery & Special Vehicles posted an operating
loss of ¥16.6 billion, in part because of the further strengthening of the yen.
Future InitiativesIn turbochargers, MHI, armed with performance and quality recognized
worldwide, aims for top market share by FY2016. To this end, in addition to
increasing the number of permanent engineers to provide closer support to
customers, test and inspection facilities will also be reinforced. In China,
where demand is rapidly expanding, MHI will leverage its partnership with
China’s largest automaker to expand new orders.
In engines, orders remain firm for engines used in construction
machinery, an MHI specialty, and power generation systems. Going for-
ward, MHI will carry out an extensive program of “selection and concen-
tration” to make the jump to a highly profitable structure in this business.
This effort will entail streamlining the engine lineup to only strong-perform-
ing models. Another component will be service business expansion, driven
by long-term service contracts and service network enhancement. MHI will
also enhance development efforts for compliance with the next step in
emission regulations (Tier 4) and achieving the world’s lowest fuel
Reach Stacker
General Machinery & special vehicles
RevIeW OF OPeRATIOns
400
300
200
100
0
FY2010 FY2011forecast
FY2009
360.0
291.0
344.1
orders received(In billions of yen)
400
0
300
200
100
FY2010 FY2011forecast
FY2009
360.0
286.8
343.0
net sales(In billions of yen)
0
–10
–20
–30
FY2010 FY2011forecast
FY2009
0.0
–23.2
–16.0
operating Income (loss)(In billions of yen)
MITSUBISHI HEAVY INDUSTRIES, LTD.28

consumption.
In forklifts, the market for internal combustion trucks is shifting from
the United States and Europe to emerging markets. In electric trucks,
demand is growing in Europe, which already accounts for the bulk of the
market. Given this market climate, MHI will promote a further shift to
electrification, while also strengthening its global collaborative business
framework and service business.
In special vehicles, MHI will focus on the development of special
equipment for responding to the recent disaster and aiding in Japan’s
recovery, including radiation-shielded forklifts.
In this climate, the targets from FY2011 for General Machinery &
Special Vehicles are orders of ¥360.0 billion, net sales of ¥360.0 billion,
and operating income of ¥0.0 billion for FY2011; and for FY2012, orders
of ¥450.0 billion, net sales of ¥450.0 billion and operating income of
¥13.0 billion. The targets for FY2014, which is the last year of the 2010
Business Plan, are orders of ¥520.0 billion, net sales of ¥520.0 billion,
and operating income of ¥35.0 billion.
Variable Geometry Turbocharger for Automobile We plan to deploy tactics for RE-BIRTH 11, a plan
of action for turning our business model around
and revitalizing our operations. As part of struc-
tural reforms for transforming our business model,
we will thoroughly investigate needs, work to
quicken the pace of development, deliver the
world’s best performance and quality, and create
a global network that will vastly accelerate our
shift to overseas production. At the same time, to
revitalize our operations, we will reform our corpo-
rate culture to one in which each employee is
profit-conscious, has the ability to execute, and
responds swiftly to customer needs.
Message from the segment leader
Manufacturing, installation, sale and service of turbochargers, medium- and small-sized engines, forklift trucks, construction machinery, special vehicles, agricultural machinery, tractors, etc.
Miller Cycle Gas Engine GS16R
PRODUCTS
Atsushi MaekawaGeneral Manager, General Machinery & Special Vehicles
ANNUAL REPORT 2011 29

Fiscal 2010 ReviewOrders for Air-Conditioning and Refrigeration Systems increased, partly as a
result of higher sales of Automotive Thermal Systems on firm automobile
sales and increased orders for Residential Air Conditioners in Southeast Asia,
where our expanded sales activities were successful. Sales of Commercial Air
Conditioners also increased, which corresponded with the improved eco-
nomic situation in Europe. As a result, the total value of consolidated orders
and consolidated net sales for Air-Conditioning & Refrigeration Systems rose
to ¥159.1 billion and ¥158.1 billion, respectively, with an operating loss of
¥2.3 billion.
Future Outlook and InitiativesAs part of production structure reforms, MHI will consolidate the manufac-
ture of “global model” air-conditioner products (excluding for-China market
models) in Thailand (MACO), shifting away from Japan and China (MHAQ),
and promote greater production efficiency and cost reductions.
In Heat-Pump Hot Water Systems, a growth market going forward, MHI
will seek business expansion through offering a wider range of products from
residential to commercial and industrial use.
Shifts in technology are happening in the field of Automotive Thermal
Systems, where MHI is gearing up to win orders for 3D Scroll Compressors,
Electric Compressors, and PTC Heaters for use in “eco-cars (compact cars
and EV/HEVs),” where future growth in demand is expected, as well as
enhancing related production facilities.
In this climate, the targets for Air-Conditioning & Refrigeration Systems for
FY2011 are orders of ¥170.0 billion, net sales of ¥170.0 billion, and operating
income of ¥2.0 billion; and for FY2012, orders of ¥200.0 billion, net sales of
¥200.0 billion and operating income of ¥4.0 billion. The targets for FY2014,
which is the last year of the 2010 Business Plan, are orders of ¥240.0 billion,
net sales of ¥240.0 billion, and operating income of ¥11.0 billion.
othersair-Conditioning & refrigeration systems
RevIeW OF OPeRATIOns
200
150
100
50
0
FY2010 FY2011forecast
FY2009
170.0
138.4
159.1
orders received(In billions of yen)
200
0
150
100
50
FY2010 FY2011forecast
FY2009
170.0
137.4
158.1
net sales(In billions of yen)
2
0
–4
–2
–6
–8
–10
FY2010 FY2011forecast
FY2009
2.0
–9.9
–2.3
operating Income (loss)(In billions of yen)
The “Q-ton” commercial-use CO2 refrigerant heat pump water heater (ESA30)
Taking advantage of global environmental regula-tions as a rare business opportunity, we promote global sales of high-performance, high value-added products that make a major contribution to environmental conservation, and are developing a business that will play a role in MHI’s energy and environmental business. To this end, we will establish a light and nimble business structure, and focus on capturing and maintaining a position as a dominant niche player in specified domains.
Message from the segment leader
Masahiko AriharaGeneral Manager, Air-Conditioning & Refrigeration Systems
Manufacturing, installation, sale and service of Commercial- and Residential-use Air Conditioners, Automotive Thermal Systems, Transport Refrigeration Units and Centrifugal Chillers, etc.
PRODUCTS
MITSUBISHI HEAVY INDUSTRIES, LTD.30

Fiscal 2010 ReviewOrder booking from overseas for machine tools increased, particularly from
China. The total value of consolidated orders and net sales for the Machine
Tool with others segment rose to ¥128.8 billion and ¥124.6 billion, respectively,
with an operating profit of ¥11.6 billion.
Future InitiativesIn the Machine Tool business, efforts will focus on globalizing operations
and developing high-added value for creating a highly profitable structure.
In globalizing operations, in addition to enhancing the overseas sales net-
work and promoting localization, MHI will greatly expand the functional
scope of its new China-based manufacturing plant (Mitsubishi Heavy
Industries (Changshu) Machinery Co., Ltd.). Another initiative will see MHI
bolster its lineup, centered on products for priority enhancement, in striving
to gain the world’s No. 1 market share in gear cutting machines and large
machines. Management resources will also be channeled into promoting
hollow engine valves and other growth products.
In this climate, the targets for the Machine Tool business with others
segment, for FY2011 and beyond are as follows. For FY2011, orders of
¥125.0 billion, net sales of ¥120.0 billion, and operating income of ¥8.0
billion; and for FY2012, orders of ¥150.0 billion, net sales of ¥130.0 billion
and operating income of ¥11.0 billion. The targets for FY2014, which is the
last year of the 2010 Business Plan, are orders of ¥160.0 billion, net sales of
¥140.0 billion, and operating income of ¥15.0 billion.
Machine Tool, others
150
100
50
0
FY2010 FY2011forecast
FY2009
125.0113.4
128.8
orders received(In billions of yen)
150
0
100
50
FY2010 FY2011forecast
FY2009
120.0
146.8
124.6
net sales(In billions of yen)
15
10
5
0
FY2010 FY2011forecast
FY2009
8.0
5.1
11.6
operating Income(In billions of yen)
Gear grinding machine ZE15A
For this division, in addition to achieving a high revenue structure through globalization and increasingly high-added value products, we are working through the Machining Process Technol-ogy Center to support greater sophistication in in-house manufacturing skills. We intend to provide technical support for manufacturing and operational launches at MHI’s overseas manu-facturing plants. We will also expand core opera-tions by moving in parallel to sell our products, made possible through cutting-edge in-house machining technology, to external customers.
Message from the segment leader
Yukio KodamaGeneral Manager, Machine Tool
Manufacturing, installation, sales and service for power transmissions and machine tools, etc.
PRODUCTS
ANNUAL REPORT 2011 31

ToPIC
Q1: One business within the four technology fields that MHI
Group is targeting, and in which its technologies are
being integrated to deliver total solutions, is the Smart
Community business. What progress has MHI Group
made in this area?
a1: The development by 2020 of 300 to 400 Smart Community
projects is being planned and carried out worldwide, with a total
value on the scale of ¥180 trillion. Among these, MHI Group is
promoting projects in India, China, Spain and KEIHANNA (Kyoto,
Osaka and Nara in western Japan) described below.
In India, we completed a Pre-Feasibility study regarding devel-
opment in Sanand-Changodar in Gujarat State. We then proposed
options for enhancement of power generating facilities, promoting
the electrification of transportation infrastructure appropriate for
the stage of local economic development, and the adoption of
renewable energy. Also in January 2011, we signed a memoran-
dum of understanding concerning urban development with the
state government and Delhi-Mumbai Industrial Corridor (DMIC)
development consortium. Plans call for completing a feasibility
study by March 2012.
In China, MHI Group is a project member in the Eco-City
concept taking shape around Beijing, where we are proposing an
electric and thermal energy management project in the region.
In Malaga, Andalusia (Spain), we are planning to conduct
demonstrations of an EV management center, and demonstrations
in electric power management, information system management,
and other areas.
In KEIHANNA, at Kansai Science City in Kyoto Prefecture, in
addition to demonstrations of demand-side energy management,
we are promoting establishment of energy management technol-
ogy, including EVs, life systems (water and waste recycling and
conversion infrastructure), and upcoming demonstrations.
“How is MHI Group pursuing its business for providing total solutions integrating
its technologies in the field of energy and environment?”
Initiatives in energy and environmental Technologies
Q2: What kind of schedule do you anticipate for realizing these
Smart Community projects going forward?
a2: In feasibility studies, in addition to technological evalua-
tions, we will also evaluate profitability, and will move forward
after demonstrations are completed. Using the project in China
as an example, we will be conducting construction work in the
Smart Community there over the next ten years.
Q3: How does energy management in a Smart Community differ
from conventional energy management?
a3: In a Smart Community, energy management has to take into
account natural sources of energy that readily fluctuate with
weather conditions, such as solar and wind power generation.
Also, electric vehicle batteries, as energy devices, are incorpo-
rated into the Community Energy Management System (CEMS)
for optical management of EV recharging and allocation control,
including peak-cuts. Another difference versus conventional
energy management is that it can often allow for more in-depth
management than ever before, especially when weather forecasts
are involved. What’s more, the “Smart” concept goes well beyond
electric power-related areas to encompass every field necessary
for realizing a low-carbon community, including gas, the supply of
heat, water and waste.
Q4: Where does MHI Group stand out in terms of the key tech-
nologies for Smart Community projects?
a4: MHI Group is responsible for different fields in each project.
However, it is difficult to single-handedly provide all of the tech-
nologies required, and the same goes for the other global compa-
nies involved. The products for a Smart Community can vary, but
in addition to products, these communities require (1) network
technology, (2) security technology, and (3) project management/
Katsuhiko TodaGeneral Manager of Sustainability Energy & Environment Strategic Planning Department
MITSUBISHI HEAVY INDUSTRIES, LTD.32

About the Sustainability Energy & Environment Strategic Planning Department
As the shift to a low-carbon society gains momentum,
MHI Group is addressing four specific technological
fields—carbon-free energy, transportation and logis-
tics systems, high-efficiency power generation, and
energy management.
system integration technology. Of the three, MHI Group’s
strengths are in project management/system integration technol-
ogy. For the future, we are eyeing alliances with companies that
excel in network and security technologies as we take on these
Smart Community projects.
Q5: Now that three years have passed since the launch of the
Sustainability Energy & Environment Strategic Planning
Department, what is your outlook for the department?
MHI established the Sustainability Energy & Environment Strate-gic Planning Department in April 2008 as an organization under the direct control of the President for the purpose of developing
Principal Roles of the Sustainability Energy & Environment Strategic Planning Department
1Present opinions related to energy and environmental policies to the government and to industry by gathering information and conducting market trend surveys regarding environmental policies around the world and in Japan.
2Promote horizontally oriented activities throughout the MHI Group while creating business opportunities based on MHI’s energy and environmental technologies and products.
3 Formulate medium- to long-term development policies such as development roadmaps for new fields and new products related to energy and the environment.
business related to energy and the environment and playing a leading role in these activities inside MHI.
Transportation and Logistics
Systems
Energy Management
High-efficiency power
generation
Carbon-free Energy The Four Key
Technological Fields
for the Energy &
Environment Business
a5: Over the years, the Sustainability Energy & Environment
Strategic Planning Department has, among other things, identi-
fied Smart Community projects and linked our in-house organiza-
tion in this area. We can expect to reap benefits from this as the
business solidifies going forward. Furthermore, in the wake of the
Great East Japan Earthquake, in addition to taking a leading role
in the development of energy and environment businesses, the
department will also spearhead work at MHI to support recon-
struction efforts.
Manitoba Electric-driven Power Train
Heat Pumps
Smart Community: Example KEIHANNA
Developing an all-electric transit bus with the government of Canada’s Manitoba Province
Biomass Power Shizukuishi (Biomass Business Operator)
ANNUAL REPORT 2011 33

InTelleCTual ProPerTY anD r&D
MHI’s Intellectual Property Activities PolicyMHI’s priority in acquiring patents is to protect its technology
assets and competitiveness. Accordingly, we must take every
possible step to apply for and acquire patents for technologies
we have developed that will be used in MHI products. Although
this is partly to protect our technology assets from copying by
other parties, our main aim here is to ensure that our custom-
ers can use MHI products with peace of mind.
In order to protect our business through patents, and to
prevail amongst global competition, we will strengthen our twin
intellectual property strategies of “defense” and “offense”
based on two key principles: applying for patents focused on
our products for which there is high risk of the intellectual
property being copied, and protecting our continued royalty
revenues by granting licenses.
Business: An Integrated Approach Linking R&D and Intellectual PropertyMHI’s intellectual property activities are an integral part of its
business and R&D strategies.
MHI has established a team made up of members from its
business divisions (sales and design personnel) and R&D and
intellectual property departments for each core, mainstay and
new product line. These members share information from a
wide variety of sources—business plans, business schemes,
product development, R&D policy, technology roadmaps, and
analyses of R&D trends and patents at both MHI and other
companies—and the team of members works to formulate an
optimal intellectual property strategy.
To promote activities in line with this strategy, the Intellec-
tual Property Division develops effective and efficient business
processes, takes steps to manage intellectual property appro-
priately, and develops highly specialized and skilled personnel.
Guided by MHI’s fundamental business strategy of adopt-
ing a more international approach in its operations, and the
basic R&D strategy of ensuring that MHI remains successful
in the face of ever-intensifying competition worldwide, the
Intellectual Property Division is shifting the focus of patent
acquisition from the domestic market to a more aggressive
global approach.
Research and Development ActivitiesThrough close cooperation among headquarters and divisions,
manufacturing facilities and R&D centers, MHI is working to
reinforce its R&D activities to enhance product competitiveness
in the aerospace, power systems and other business fields, and
drive business expansion.
30
60
90
120
150
0
FY10FY09FY08FY07FY06
123.2
106.3 107.9101.3
129.2
* Includes expenses related to R&D under contract.
8,000
10,000
0
FY10FY09FY08FY07FY06
6,000
2,000
4,000
5,4115,165 5,121 5,006
6,965
6,3015,850 5,828
4,735
5,683
DomesticOverseas
number of Domestic and overseas Patents
r&D Investment(In billions of yen)
MITSUBISHI HEAVY INDUSTRIES, LTD.34

Fundamental PolicyCommitted to the ethos of customer-first, MHI conducts its
business activities as a responsible corporate citizen based on
consideration for all stakeholders.
MHI is implementing a number of initiatives to enhance
management efficiency and strengthen compliance, including
reforming the management system to allow more effective
decision-making in response to radical changes in the eco-
nomic environment, and promoting fair and sound manage-
ment. MHI is also working to make management more
transparent by disclosing information rapidly and accurately to
shareholders and other external stakeholders.
Corporate Governance InitiativesCorporate Governance Framework
MHI is a company with a Board of Statutory Auditors. The
Board of Directors makes important management decisions
and oversees the execution of business operations. Statutory
auditors oversee the execution of director duties by attending
meetings of the Board of Directors and other key meetings.
As of June 23, 2011, of the Company’s 19 directors, three
are from outside MHI. Through receiving valuable opinions and
frank comments from outside directors concerning the man-
agement of the Company, MHI works to strengthen the man-
agement oversight functions. Additionally, MHI has established
an Executive Committee to provide a forum for discussing
important matters related to business execution. This allows for
a more cohesive approach to discussion as part of the opera-
tional execution framework centered on the President, and
consequently leads to more appropriate management decisions
and business execution.
MHI overhauled its corporate governance framework in
June 2005 to improve the soundness and transparency of
management and increase efficiency and flexibility and it now
implements this corporate governance framework. The main
components of this reform included streamlining the Board of
Directors while increasing the number of outside directors,
shortening the terms of directors, and introducing an executive
officer system. These modifications were aimed at enhancing
the oversight functions of the Board of Directors and clearly
delineating the roles and responsibilities of directors and exec-
utive officers. Directors are responsible for general oversight of
the Company’s operations and making important business
decisions, while executive officers are responsible for the day-
to-day business and affairs of the Company.
Enhancing Internal Control Systems
In compliance with laws and regulations, the Board of Directors
has approved resolutions to establish systems that ensure
business operations are conducted in an appropriate manner,
and the Company makes efforts to promote fair and sound
management. An overview of these resolutions is as follows.
1. System to ensure the execution of duties by directors is
in compliance with relevant laws and the Articles of
Incorporation
(i) Directors shall lead by example in realizing the Com-
pany’s fundamental principle of fair and honest business
activities that comply with all relevant laws and empha-
size social norms and business ethics.
(ii) The Board of Directors shall fully discuss all matters
raised and reports submitted by directors and monitor
the Company’s operations from the perspectives of
sound and efficient management. The views of outside
directors shall be employed to introduce greater objectiv-
ity and enhance the effectiveness of oversight.
2. System to store and manage information related to the
execution of duties by directors
(i) Principle matters related to the management of docu-
ments shall be specified in Company regulations, and
information related to the execution of duties by directors
shall be appropriately recorded, stored and managed.
(ii) Directors and statutory auditors shall be given access to
such information at any time where it is deemed neces-
sary to supervise and audit actions by the directors.
CorPoraTe GovernanCe
ANNUAL REPORT 2011 35

CORPORATe GOveRnAnCe
3. Regulations and other systems to manage risk
(i) Systems designed to manage each type of risk shall be
implemented and responsibilities shall be clearly defined
to ensure the appropriate management of risk.
(ii) Risk shall be regularly evaluated and analyzed and nec-
essary avoidance or mitigating measures taken; internal
audits shall monitor the effectiveness and appropriate-
ness of these measures and reports shall be regularly
submitted to the Board of Directors.
(iii) To prepare for cases where significant risk may material-
ize, the Company shall ensure the means to immediately
communicate information to senior management to
respond promptly and accurately to emergency situa-
tions; individuals responsible for crisis management shall
also be appointed in each business division.
4. System to ensure directors execute their duties
efficiently
(i) The Board of Directors shall formulate business
plans and establish Company-wide management
policy and objectives; business execution, led by the
President, shall be conducted with the aim of achiev-
ing these objectives.
(ii) The Company’s organizational structure, division of
duties, and lines of authority shall be specified in Com-
pany regulations to ensure steps to achieve management
objectives are conducted efficiently.
5. System to ensure the duties and actions of employees
comply with relevant laws and the Articles of
Incorporation
(i) The Company shall create a framework comprising the
Compliance Committee and other bodies to raise aware-
ness of compliance among employees by formulating a
code of conduct, implementing various training programs
and taking other steps.
(ii) The Company shall establish a whistleblower system
and other mechanisms to enhance the effectiveness
of compliance, conduct internal audits of the compli-
ance framework, and report the results to the Board
of Directors.
6. System to ensure appropriate business activities by the
MHI Group
(i) The presidents of Group companies shall be responsible
for the independent management of their companies as
autonomous bodies; in addition, the Company shall
create a system to define the management responsibili-
ties of Group companies, determine operational proce-
dures and provide support and guidance with the aim of
improving consolidated operating performance through
sound and efficient Groupwide management.
(ii) To ensure appropriate Group-wide operations, the
Company shall promote various compliance and risk
measures in conjunction with Group companies and
create internal control systems tailored to the size and
specific nature of each company; the respective
departments in the Company responsible for managing
Group companies shall also monitor the status of com-
pliance at these companies.
(iii) MHI and MHI Group companies shall ensure the accu-
racy of their respective financial information, and arrange
the organization, company regulations and other matters
required for the preparation and disclosure of reliable
financial reports.
7. Matters related to employees requested by statutory
auditors to support audit activities
(i) In response to requests by the statutory auditors, the
Company shall establish a Statutory Auditors’ Office with
a dedicated staff to support the smooth conduct of audit
activities.
8. Independence of employees in 7. (above) from directors
(i) To ensure independence from the executive bodies of
the Company, Auditing Office staff shall not be subject to
the orders of directors, and the appointment, transfer
and evaluation of these employees shall be conducted
with the agreement of the statutory auditors.
MITSUBISHI HEAVY INDUSTRIES, LTD.36

9. System to allow directors and employees to report infor-
mation to the statutory auditors and other related report-
ing systems
(i) The Company shall implement arrangements to allow the
reporting and provision of information to statutory audi-
tors, and promote appropriate communication through
regular exchanges of views.
10. Other systems to ensure statutory auditor activities are
conducted effectively
(i) Due consideration shall be given to statutory auditors to
allow them to conduct audits in an effective manner by
gathering information, conducting surveys and taking
other steps to ensure appropriate communication with
related divisions in the Company, the accounting auditors
and other parties.
Internal Audits
On April 1, 2011, the Company reorganized the Internal Audit
Department into the 28-member Management Audit Depart-
ment, which conducts internal audits and evaluation of internal
control related to financial reports to check the effectiveness of
internal control systems.
As part of internal audits, each fiscal year the Management
Audit Department formulates an internal audit policy, and the
Management Audit Department, or the internal audit depart-
ments at each business site, conducts audits in accordance
with the audit theme of this policy and the location of the
department to be audited. The Management Audit Department
also regularly receives reports from the internal control depart-
ment concerning the status of compliance.
Concerning the internal control reporting system related to
financial reports, the Company takes actions appropriately and,
abiding by the Financial Instruments and Exchange Act, and
as of the end of FY2010, the Company had obtained an evalu-
ation result that the internal controls related to the Company’s
financial reports were effective.
General Meeting of Shareholders
Group Companies
Directors(Board of Directors)
President
Executive Officers
(Divisions)
• Administration Departments• Headquarters & Divisions• Works • Research & Development Centers• Domestic Offices .....Other
ExecutiveCommittee
Election/Dismissal Proposal/Report
Audit/ReportProvide opinions
Election/Dismissal Election/Dismissal
Coordination
Report on accounting audit
Audit
Coordination
Instruction
Report
AuditInstruction
Survey
Audit/InstructionAudit/Instruction Survey
General Supervision
Coordination
ReportConsult
ReportInstruction
Consult
Recommendation/Report
Accounting AuditProposal/ReportNomination/Oversight
Deliberate
Report
Statutory Auditors (Board of Statutory Auditors)
Management Audit Department
Accounting Auditor
Statutory Auditors’ Office
CSR Committee
• Compliance Committee
• Export-related Regulations Monitoring Committee • Environment Committee• Risk Management .....Other
ANNUAL REPORT 2011 37

Statutory Auditors
The Company’s Board of Statutory Auditors has five members,
three of whom are outside appointments. Additionally, one of
the full-time statutory auditors has long-standing business expe-
rience in the fields of accounting and finance and those consid-
ered for election as statutory auditors are people with a suitable
level of knowledge in finance and accounting. In accordance
with the auditing policy and auditing plan determined by the
Board of Statutory Auditors, statutory auditors attend meetings
of the Board of Directors, the Executive Committee and other
key meetings related to business planning, enabling them to
accurately assess the status of management in a timely manner.
As part of the audit, statutory auditors make sure the execution
of director duties complies with laws and regulations and the
Articles of Incorporation and ascertain whether or not business
operations of the Company are being executed appropriately by
conducting spot checks and verifying compliance with relevant
laws and regulations, and by monitoring the status of establish-
ment and operation of internal control systems including those
in relation to financial reporting.
In addition to regularly exchanging information and opin-
ions with the Management Audit Department and accounting
auditors, statutory auditors also work in close collaboration in
other ways, including receiving audit results and being present
for the auditing performed by the accounting auditors. The
statutory auditors also regularly receive reports from the inter-
nal control department concerning the status of compliance,
risk management and other activities. As a support to the statu-
tory auditors, the Company has established a Statutory Audi-
tors’ Office with a dedicated six member staff, which assists the
statutory auditors in performing their duties more smoothly.
Accounting Audits
MHI’s accounting auditor is Ernst & Young ShinNihon LLC.
Three of the firm’s certified public accountants (designated
and engagement partners) audit the Company’s financial state-
ments: Masayuki Ueda, Ichiro Ishii and Yoshiaki Morita. None
of these individuals have been continually auditing the Com-
pany’s financial statements for longer than seven years.
In addition to the above, the auditing team includes 16 other
certified public accountants and 21 assistant accountants.
The accounting auditor regularly exchanges opinions with
designated directors concerning initiatives and other matters
related to corporate governance and compliance.
Outside Directors and Outside Statutory Auditors
For the purpose of receiving advice and oversight of the Com-
pany’s management from an objective standpoint not biased by
an internal company perspective and based on abundant expe-
rience and broad knowledge as a corporate manager or govern-
ment official, three of the 19 directors elected and three of the
five statutory auditors elected are from outside the company.
The Company judges these outside directors and outside
statutory auditors to be independent from the Company on the
basis that there are no circumstances that compromise inde-
pendence from the Company such as history of employment by
the Company, an associated company of the Company, or a
major trading partner of the Company, or existence of close
relatives who are directors of the Company or the Company’s
associated companies; and that there are no personal relation-
ships, capital relationships, trading relationships or other spe-
cial interests between the individual and the Company.
CORPORATe GOveRnAnCe
MITSUBISHI HEAVY INDUSTRIES, LTD.38

All the outside directors and outside statutory auditors are
independent from management and they supervise or audit
management. In addition, at meetings of the Board of Direc-
tors, they receive reports of the status of establishment and
operation of internal control systems including compliance, risk
management and other activities; and the results of internal
audits, and they state their opinions when appropriate. In par-
ticular, the outside statutory auditors shall regularly exchange
opinions with directors while conducting effective auditing
through collaboration with the full-time statutory auditors, the
internal audit department and the accounting auditor. In this
way, the Company strives to ensure soundness and appropri-
ateness of management.
In accordance with Article 423, Paragraph 1 of the Corpo-
rate Law, the Company has entered into liability limitation
agreements with each of its outside directors and outside statu-
tory auditors, which provides a limitation on their liabilities to
compensate for damages, the amount of which is the higher of
¥10 million or the minimum liability amount specified in Article
425, Paragraph 1 of the Corporate Law.
The Company’s corporate governance framework, including
internal control systems, is shown in the diagram on page 37.
Director and Statutory Auditor Compensation
Position No. of Recipients
Amounts of Compensation by Category (In millions of yen) Total Amount of Compensation
(In millions of yen)Base CompensationPerformance-Linked
CompensationStock Options
Directors (Excluding Outside Directors) 17 698 215 204 1,118
Statutory Auditors(Excluding Outside Statutory Auditors)
2 69 17 – 87
Outside Officers 7 79 – – 79
Notes 1. The personnel in the table include three directors who retired during the fiscal year under review. Two are stated under the classification “Directors (Excluding Outside Directors)”, with the remaining director stated under “Outside Officers.”
2. Amounts stated in performance-linked compensation include the difference between the amounts disclosed as compensation in the previous fiscal year (the estimated compensation) and the actual amounts paid.
3. Amounts stated as stock options include the cost associated with the accounting of stock acquisition rights issued in a so-called stock-linked compensation scheme. 4. The maximum permitted financial compensation amounts including both base and performance-linked compensations are ¥1,200 million per fiscal year for directors and ¥160 million
per fiscal year for statutory auditors (resolution of the 81st Ordinary General Meeting of Shareholders on June 28, 2006). 5. The maximum permitted total issuance price for stock acquisition rights related to stock-linked stock options is ¥300 million per fiscal year for directors excluding outside directors
(resolution of the 82nd Ordinary General Meeting of Shareholders on June 27, 2007). 6. The retirement allowance program has been abolished effective the conclusion of the 81st Ordinary General Meeting of Shareholders on June 28, 2006. 7. The amount stated in “Directors (Excluding Outside Directors)” includes compensation paid to director Kazuo Tsukuda and director Hideaki Omiya of ¥132 million (base compensation
of ¥80 million, performance-linked compensation of ¥25 million, and stock options of ¥25 million) each. Note that there is no compensation, etc. paid to the two individuals as directors of major consolidated subsidiaries.
Auditing Certified Public Accountant Compensation (In millions of yen)
Category
Fiscal Year 2009 Fiscal Year 2010
Audit Attestation Duty BasedCompensation
Non-Audit BasedCompensation
Audit Attestation Duty BasedCompensation
Non-Audit BasedCompensation
MHI 185 10 185 33
Consolidated Subsidiaries 99 – 114 –
Total 284 10 300 33
ANNUAL REPORT 2011 39

Chairman
DIRECTORS
Senior Executive Vice Presidents
Executive Vice Presidents
President
Kazuo Tsukuda
Masafumi WaniGeneral Manager,
Power Systems
Atsushi Maekawa General Manager, General
Machinery & Special Vehicles
Shunichi MiyanagaAssistant to President, General
Manager, Presidential
Administration Office
Takato Nishizawa Director in charge of Sustainability
Energy & Environment Strategic
Planning Department
Yoshiaki TsukudaAssistant to President, General
Manager, Technology & Innovation
Headquarters
Takashi AbeDirector in charge of General
Affairs, Legal and Personnel
Yujiro KawamotoDirector in charge of Accounting,
Finance and Material
Hisashi HaraGeneral Manager, Shipbuilding &
Ocean Development
Shigero Masamori General Manager,
Nuclear Energy Systems
Takashi Kobayashi General Manager,
Aerospace Systems
Akira HishikawaGeneral Manager, Global Strategic
Planning & Operations
Headquarters
Hideaki Omiya
boarD of DIreCTors
MITSUBISHI HEAVY INDUSTRIES, LTD.40

Outside Directors
STATUTORY AUDITORS
Senior Vice Presidents
(As of June 23, 2011)
Masahiko AriharaGeneral Manager, Air-Conditioning
& Refrigeration Systems
Akihiro WadaAdvisor, Executive Technical
Advisor of Aisin Seiki Co., Ltd.
Hisakazu Mizutani General Manager, Management
Audit Department
Yoshihiro SakamotoFormer Vice-Minister for Interna-
tional Affairs of the Ministry of
International Trade and Industry
Yoichi Kujirai General Manager, Machinery &
Steel Infrastructure Systems
Yorihiko KojimaChairman of the Board of
Mitsubishi Corporation
Naoki Yasaka
Kichisaburo NomuraExecutive Adviser of All Nippon
Airways Co., Ltd.
Toshiro Yagami
Nobuo KuroyanagiChairman of The Bank of
Tokyo-Mitsubishi UFJ, Ltd.
Haruya UeharaChairman of Mitsubishi UFJ Trust
and Banking Corporation
ANNUAL REPORT 2011 41

Aiming to win the solid trust of society through the advancement of CSRThe underlying objective of MHI Group is, as a manufacturer, to carry out CSR (Corporate Social Responsibility) through production activities; and we are working to achieve that goal under our CSR Action Guidelines and CSR Action Plan.
Carrying out CSR through “manufacturing” that contributes to societyMHI Group considers its fundamental business to be “manufac-turing” that contributes to society, and is dedicated to the produc-tion of products that contribute to building social infrastructures and reducing environmental impact for our customers.
While optimally returning to all stakeholders with interest in the business activities the profits that we obtain through provid-ing such products, we base our CSR activities on minimizing the environmental impact of our manufacturing activities.
In July 2007, we formulated MHI Group CSR Action Guide-lines with three basic themes: “close ties with the Earth,” “close ties with Society,” and “a bridge to the next Generation,”
Coral reef restoration and expansion project in the Okinawa seaWhile coral is an animal, like a plant coral reef absorbs CO2 and releases oxygen through photosynthesis. Coral reefs also feature some of the greatest biodiversity on Earth, on par with tropical rainforests. These reefs are increasingly threatened by coral bleaching (and extinction) as a result of rising sea water temperatures.
Since 2004, Mitsubishi Heavy Industries Bridge & Steel Structures Engineering Co., Ltd. has been conducting
CSR TopicsTopic 1
MHI Group CSR Action Guidelines(formulated July 2007)
In order to ensure a secure future for the Earth, we will establish and maintain:
Close ties with the EarthSafeguard an abundantly green Earth through environmental technologies and environmental awareness;
Close ties with SocietyBuild a relationship of trust with society through proactive participation in society and trustworthy actions;
A bridge to the next GenerationContribute to the cultivation of human resources who can shoulder responsibility
in the next generation through technologies that can realize dreams.
experiments in growing coral. Five years later, we succeeded in developing a new method for propagating coral, and in 2011, began our coral regeneration project. This groundbreak-ing project focuses not only on protecting coral, but on actu-ally increasing it.
Corporate SoCial reSponSibility
for the purpose of instilling CSR awareness in each employee and encouraging voluntary actions. Subsequently, in April 2008, we created the CSR Action Plans based on the CSR Action Guidelines, and are working to achieve the continuous improvement of each CSR activity by conducting PDCA cycles.
Furthermore, to promote and establish greater CSR aware-ness group-wide in line with the three themes of the CSR Action Guidelines, in June 2008 we formulated representative CSR activities and, based on these, are implementing a variety of programs.
*For more details, please access the CSR section of our corporate website athttp://www.mhi.co.jp/en/csr/
Close ties with the Earth
MITSUBISHI HEAVY INDUSTRIES, LTD.42
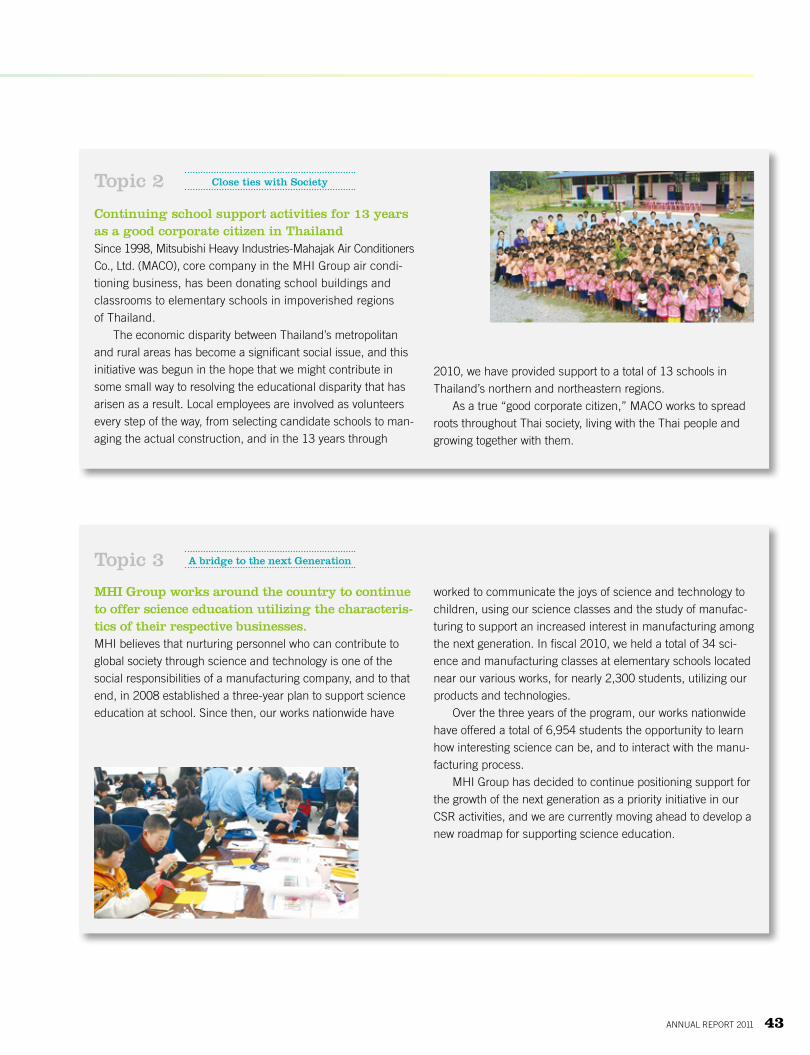
Topic 2
Topic 3
Continuing school support activities for 13 years as a good corporate citizen in ThailandSince 1998, Mitsubishi Heavy Industries-Mahajak Air Conditioners Co., Ltd. (MACO), core company in the MHI Group air condi-tioning business, has been donating school buildings and classrooms to elementary schools in impoverished regions of Thailand.
The economic disparity between Thailand’s metropolitan and rural areas has become a significant social issue, and this initiative was begun in the hope that we might contribute in some small way to resolving the educational disparity that has arisen as a result. Local employees are involved as volunteers every step of the way, from selecting candidate schools to man-aging the actual construction, and in the 13 years through
MHI Group works around the country to continue to offer science education utilizing the characteris-tics of their respective businesses.MHI believes that nurturing personnel who can contribute to global society through science and technology is one of the social responsibilities of a manufacturing company, and to that end, in 2008 established a three-year plan to support science education at school. Since then, our works nationwide have
2010, we have provided support to a total of 13 schools in Thailand’s northern and northeastern regions.
As a true “good corporate citizen,” MACO works to spread roots throughout Thai society, living with the Thai people and growing together with them.
worked to communicate the joys of science and technology to children, using our science classes and the study of manufac-turing to support an increased interest in manufacturing among the next generation. In fiscal 2010, we held a total of 34 sci-ence and manufacturing classes at elementary schools located near our various works, for nearly 2,300 students, utilizing our products and technologies.
Over the three years of the program, our works nationwide have offered a total of 6,954 students the opportunity to learn how interesting science can be, and to interact with the manu-facturing process.
MHI Group has decided to continue positioning support for the growth of the next generation as a priority initiative in our CSR activities, and we are currently moving ahead to develop a new roadmap for supporting science education.
Close ties with Society
A bridge to the next Generation
ANNUAL REPORT 2011 43

In line with its environmental policy formulated in 1996, MHI works to promote environ-
mental preservation activities across all its departments and Group companies.
Basic Policy on Environmental Matters (Established 1996)As clearly laid out in provision 1 of its creed—“We strongly believe that the customer comes first and that we are obligated to be an innovative partner to society.”—MHI believes its primary purpose is to contribute to society through its R&D, manufactur-ing and other business activities. Accordingly, in the perfor-mance of its business activities the company shall embrace the awareness that it is an integral member of society and, in all aspects of its business activities, it will strive to reduce burden on the environment and shall devote its comprehensive techno-logical capabilities to the development of technologies and prod-ucts that will protect the environment, as its way of contributing to the development of a sustainable society.
Action Guidelines (Established 1996)1. Accord high priority to environmental protection within
company operations, and take steps company-wide to protect and enhance the environment.
2. Clarify roles and responsibilities regarding environmental protection by developing an organized structure to deal with environmental protection matters, defining environ-ment-related procedures, etc.
3. Strive to alleviate burden on the environment in all aspects of company business activities—from product
Promoting use of solar power in our works, offices, and dormitoriesAt MHI, we have been working to install solar cell panels at our works, employee dormitories, and other MHI facilities. These are being used to power air conditioning, lighting, and other systems at our works and offices.
In fiscal 2009, domestic installations totaled 2,110 kW, achieving our medium- to long-term company-wide goal of installing a cumulative 2,000 kW or more in solar power equip-ment by fiscal 2010 a full year earlier than planned.
In fiscal 2010, MHI installed a total of 101 kW in photovol-taic equipment at its four dormitories for single employees at its head office, General Machinery & Special Vehicles and
R&D and design to procurement of raw materials, manu-facture, transport, usage, servicing and disposal—through pollution prevention, conservation of resources, energy saving, waste reduction, reuse and recycling.
4. Strive to develop and provide advanced, highly reliable, wholly proprietary technologies and products that will contribute to solving environmental and energy problems.
5. Strive continuously to improve and enhance environmen-tal protection activities not only by fully complying with environmental laws and regulations but also, when nec-essary, by establishing, implementing and evaluating independent standards and setting environmental goals and targets.
6. In the performance of business activities overseas and exportation of products, pay full attention to impact on the local natural and social environments and strive to protect those environments; also, become actively involved in technological cooperation overseas in matters of environ-mental protection.
7. Take steps to raise environmental awareness among all employees through environmental education, etc., under-take activities to provide environment-related information to the public, and proactively make environment-enhancing contributions to society.
ColumnNagasaki and Kobe Shipyard & Machinery Works. This brings the cumulative total installed to 121 kW at six dormitories for single employees.
Solar cell panels installed at an MHI dormitory for single employees
EnvironmEntal activitiEs
MITSUBISHI HEAVY INDUSTRIES, LTD.44

ANNUAL REPORT 2011 45
46 Segment Information
48 Management’s Discussion and Analysis
52 Consolidated Balance Sheets
54 Consolidated Statements of Income
55 Consolidated Statement of Comprehensive Income
56 Consolidated Statements of Changes in Net Assets
57 Consolidated Statements of Cash Flows
58 Notes to Consolidated Financial Statements
76 Report of Independent Auditors
Financial Section
Contents
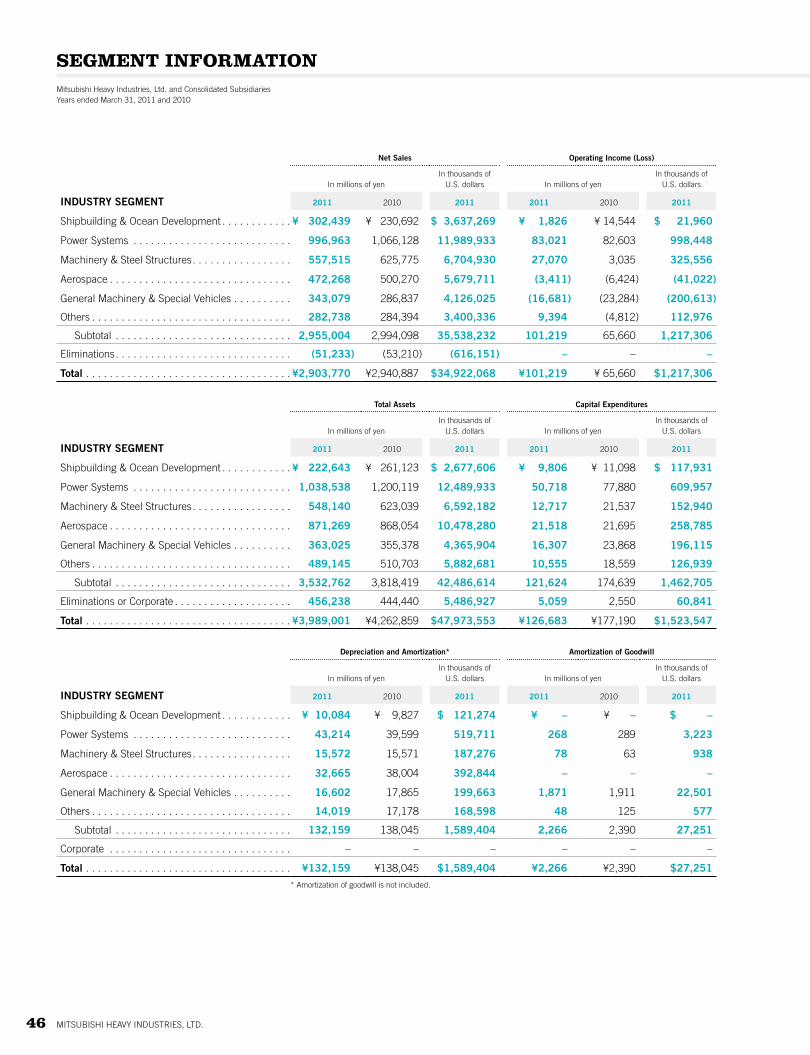
Segment InformatIonMitsubishi Heavy Industries, Ltd. and Consolidated SubsidiariesYears ended March 31, 2011 and 2010
MITSUBISHI HEAVY INDUSTRIES, LTD.46
Net Sales Operating Income (Loss)
In millions of yenIn thousands of
U.S. dollars In millions of yenIn thousands of
U.S. dollars
INDUSTRY SEGMENT 2011 2010 2011 2011 2010 2011
Shipbuilding & Ocean Development . . . . . . . . . . . . ¥ 302,439 ¥ 230,692 $ 3,637,269 ¥ 1,826 ¥ 14,544 $ 21,960
Power Systems . . . . . . . . . . . . . . . . . . . . . . . . . . . 996,963 1,066,128 11,989,933 83,021 82,603 998,448
Machinery & Steel Structures . . . . . . . . . . . . . . . . . 557,515 625,775 6,704,930 27,070 3,035 325,556
Aerospace . . . . . . . . . . . . . . . . . . . . . . . . . . . . . . . 472,268 500,270 5,679,711 (3,411) (6,424) (41,022)
General Machinery & Special Vehicles . . . . . . . . . . 343,079 286,837 4,126,025 (16,681) (23,284) (200,613)
Others . . . . . . . . . . . . . . . . . . . . . . . . . . . . . . . . . . 282,738 284,394 3,400,336 9,394 (4,812) 112,976
Subtotal . . . . . . . . . . . . . . . . . . . . . . . . . . . . . . 2,955,004 2,994,098 35,538,232 101,219 65,660 1,217,306
Eliminations . . . . . . . . . . . . . . . . . . . . . . . . . . . . . . (51,233) (53,210) (616,151) – – –
Total . . . . . . . . . . . . . . . . . . . . . . . . . . . . . . . . . . . ¥2,903,770 ¥2,940,887 $34,922,068 ¥101,219 ¥ 65,660 $1,217,306
Total Assets Capital Expenditures
In millions of yenIn thousands of
U.S. dollars In millions of yenIn thousands of
U.S. dollars
INDUSTRY SEGMENT 2011 2010 2011 2011 2010 2011
Shipbuilding & Ocean Development . . . . . . . . . . . . ¥ 222,643 ¥ 261,123 $ 2,677,606 ¥ 9,806 ¥ 11,098 $ 117,931
Power Systems . . . . . . . . . . . . . . . . . . . . . . . . . . . 1,038,538 1,200,119 12,489,933 50,718 77,880 609,957
Machinery & Steel Structures . . . . . . . . . . . . . . . . . 548,140 623,039 6,592,182 12,717 21,537 152,940
Aerospace . . . . . . . . . . . . . . . . . . . . . . . . . . . . . . . 871,269 868,054 10,478,280 21,518 21,695 258,785
General Machinery & Special Vehicles . . . . . . . . . . 363,025 355,378 4,365,904 16,307 23,868 196,115
Others . . . . . . . . . . . . . . . . . . . . . . . . . . . . . . . . . . 489,145 510,703 5,882,681 10,555 18,559 126,939
Subtotal . . . . . . . . . . . . . . . . . . . . . . . . . . . . . . 3,532,762 3,818,419 42,486,614 121,624 174,639 1,462,705
Eliminations or Corporate . . . . . . . . . . . . . . . . . . . . 456,238 444,440 5,486,927 5,059 2,550 60,841
Total . . . . . . . . . . . . . . . . . . . . . . . . . . . . . . . . . . . ¥3,989,001 ¥4,262,859 $47,973,553 ¥126,683 ¥177,190 $1,523,547
Depreciation and Amortization* Amortization of Goodwill
In millions of yenIn thousands of
U.S. dollars In millions of yenIn thousands of
U.S. dollars
INDUSTRY SEGMENT 2011 2010 2011 2011 2010 2011
Shipbuilding & Ocean Development . . . . . . . . . . . . ¥ 10,084 ¥ 9,827 $ 121,274 ¥ – ¥ – $ –
Power Systems . . . . . . . . . . . . . . . . . . . . . . . . . . . 43,214 39,599 519,711 268 289 3,223
Machinery & Steel Structures . . . . . . . . . . . . . . . . . 15,572 15,571 187,276 78 63 938
Aerospace . . . . . . . . . . . . . . . . . . . . . . . . . . . . . . . 32,665 38,004 392,844 – – –
General Machinery & Special Vehicles . . . . . . . . . . 16,602 17,865 199,663 1,871 1,911 22,501
Others . . . . . . . . . . . . . . . . . . . . . . . . . . . . . . . . . . 14,019 17,178 168,598 48 125 577
Subtotal . . . . . . . . . . . . . . . . . . . . . . . . . . . . . . 132,159 138,045 1,589,404 2,266 2,390 27,251
Corporate . . . . . . . . . . . . . . . . . . . . . . . . . . . . . . . – – – – – –
Total . . . . . . . . . . . . . . . . . . . . . . . . . . . . . . . . . . . ¥132,159 ¥138,045 $1,589,404 ¥2,266 ¥2,390 $27,251* Amortization of goodwill is not included.

ANNUAL REPORT 2011 47
AsiaU.S.A.EuropeCentral and South AmericaAfricaMiddle EastOthers
26.3%
21.4%
15.3%
14.1%
7.2%
11.9%
3.8%
Net Sales
In millions of yenIn thousands of
U.S. dollars
BREAKDOWN OF SALES BY CUSTOMER LOCATION 2011 2010 2011
Japan . . . . . . . . . . . . . . . . . . . . . . . . . . . . . . . . . . ¥1,480,579 ¥1,462,191 $17,806,121
North America (2010) . . . . . . . . . . . . . . . . . . . . . . – 360,183 –
U.S.A. (2011) . . . . . . . . . . . . . . . . . . . . . . . . . . . . 304,766 – 3,665,255
Asia . . . . . . . . . . . . . . . . . . . . . . . . . . . . . . . . . . . . 373,733 390,701 4,494,684
Europe . . . . . . . . . . . . . . . . . . . . . . . . . . . . . . . . . 217,087 223,334 2,610,787
Central and South America . . . . . . . . . . . . . . . . . . 200,850 184,790 2,415,514
Africa . . . . . . . . . . . . . . . . . . . . . . . . . . . . . . . . . . 169,283 138,725 2,035,874
Middle East . . . . . . . . . . . . . . . . . . . . . . . . . . . . . . 102,690 170,760 1,234,996
Others . . . . . . . . . . . . . . . . . . . . . . . . . . . . . . . . . . 54,780 10,198 658,809
Total . . . . . . . . . . . . . . . . . . . . . . . . . . . . . . . . . . . ¥2,903,770 ¥2,940,887 $34,922,068
The amount for North America in 2010 includes the one for Canada, which is included in Others in 2011.
Note1: U.S. dollar amounts in this annual report are translated from yen, for convenience only, at the rate of ¥83.15=US$1, the exchange rate prevailing at March 31, 2011.
Note2: Application of New Accounting Standards on Segment Information The Group has applied the “Accounting Standard for Disclosures about Segments of an Enterprise and Related Information” (ASBJ Statement No.17, amended on March 27, 2009) and the “Guidance on Accounting Standard for Disclosures about Segments of an Enterprise and Related Information” (ASBJ Guidance No.20, issued on March 21, 2008) since the year ended March 31, 2011. The segment information in this section is in accordance with those new standards.
Composition of OverseasNet Sales by Geographic Distribution

ManageMent’s Discussion anD analysis
MITSUBISHI HEAVY INDUSTRIES, LTD.48
Analysis of Operating ResultsIn fiscal 2010, ended March 31, 2011, MHI Group recorded consolidated net sales of ¥2,903,770 million,
on a par with the previous fiscal year. Net sales performance primarily reflected declines in the Power
Systems and Machinery & Steel Structures segments, which outweighed growth in transactions for new
vessels in the Shipbuilding & Ocean Development segment and a recovery in demand seen in the General
Machinery & Special Vehicles segment.
Operating income rose ¥35,558 million, or 54.2% year on year, to ¥101,219 million. While the yen’s
ongoing appreciation was a factor undercutting earnings, income rose atop companywide activities to
boost profitability, including improved profitability in plant construction in the Power Systems and
Machinery & Steel Structures segments.
Net non-operating expense was ¥33,106 million, an improvement of ¥8,545 million from the previ-
ous fiscal year, as improvement in equity in losses of unconsolidated subsidiaries and affiliates offset a
worsening foreign exchange loss.
As a result, ordinary income climbed ¥44,104 million, or 183.7% year on year, to ¥68,113 million.
MHI Group posted an extraordinary gain of ¥15,842 million from sales of fixed assets and investment
securities. The Group also posted an extraordinary loss of ¥44,456 million. In addition to business structure
improvement expenses and loss on revaluation of investment securities, this extraordinary loss consisted of
damages to a thermal power plant under construction caused by the Great East Japan Earthquake.
Consequently, income before income taxes and minority interests increased ¥11,362 million, or
40.4% year on year, to ¥39,499 million. Net income, meanwhile, rose ¥15,954 million, or 112.6%, over
the previous fiscal year to ¥30,117 million.
Key Factors Affecting Operating ResultsKey factors that affect the management of MHI Group include external factors such as market trends,
foreign exchange rate fluctuations and changes in material costs, and internal factors such as risks
associated with various overseas business contracts, accidents and disasters. Another key factor is the
risk of manufacturing capabilities weakening due to technology and skill transfer issues associated with
generational change.
Market trends
Market trends are expected to hold to an improvement trajectory overall, supported by robust perfor-
mance in emerging economies. For MHI Group, there is recognition that the operating environment will
grow more severe going forward, with competition heating up as prominent companies from around the
world vie for a stake in fast-growing emerging markets. In this climate, MHI Group will win out against
this stiffer competition to achieve future growth and development by building a management structure
capable of responding rapidly to the market’s dramatic changes and delivering consistent earnings. At
the same time, the Group will endeavor to leverage unrivaled technology to provide products and ser-
vices that answer customer needs.

ANNUAL REPORT 2011 49
Exchange rate fluctuation
Foreign exchange rate fluctuations can significantly affect MHI Group’s business competitiveness and
operating results. In order to minimize exchange rate fluctuation risk, MHI Group is increasing its liabili-
ties denominated in foreign currencies by expanding the procurement of overseas materials, promoting
greater use of yen-denominated contracts, and hedging risk with timely forward foreign exchange con-
tracts. It is also expanding overseas production.
Changes in costs of materials
MHI Group is responding to the impact of certain material price rises, such as for steel products,
nonferrous metals and crude oil, promoting design standardization, increasing its utilization of
common components, employing standardized parts, signing comprehensive procurement contracts,
and expanding its overseas production activities. The Group is also strengthening relationships with its
business partners, promoting an even greater level of information sharing, and striving to achieve
further cost reductions.
Overseas business contracts
MHI Group is exposed to a number of risks associated with individual business contracts it concludes in
overseas markets. These include the quality and delivery dates of locally procured materials and the skill
levels and specific labor practices of the local staff, as well as the risks inherent in its contractual obliga-
tions. In order to prevent or mitigate these risks, all contracts undergo a rigorous internal assessment
process prior to their formal conclusion. In addition to the segments concerned, several administrative
departments are involved in this process, which includes the verification of local contractual obligations,
the removal of unilateral conditions, and other prudent steps.
Accidents and disasters
Regarding accidents and disasters, which can have a significant impact on management, MHI Group is
taking steps to minimize the probability of accidents and disasters occurring by carrying out ongoing
work-site management activities, including the training of on-site workers to be more aware of risks.
Technology and skill transfer
MHI Group is at risk of manufacturing capabilities weakening due to technology and skill transfer issues
associated with generational change. In response, MHI Group invests in production process improve-
ment aimed at rationalization and carries out focused investment in R&D related to manufacturing tech-
nology. The Group also strives to enhance its basic manufacturing capabilities through programs to train
and improve the skills of its employees.

ManageMent’s Discussion anD analysis
MITSUBISHI HEAVY INDUSTRIES, LTD.50
Source of Funds and LiquidityCash flow analysis
Operating activities provided net cash of ¥337,805 million for the fiscal year under review, an increase
of ¥219,828 million compared with the previous fiscal year. This outcome mainly reflected decreases
in inventories.
Investing activities used net cash of ¥137,248 million, ¥43,456 million less than the previous fiscal
year. This decrease was mainly due to a decline in proceeds from cash used for capital investments.
Financing activities used net cash of ¥169,793 million, ¥64,502 million less than the previous fiscal
year. This decrease was due mainly to the decline in procurement of long-term borrowings and the issu-
ance of bonds.
Primary funding requirements
MHI Group primarily requires funds in operating activities for working capital for manufacturing activities
(materials, outsourcing and personnel costs), order preparation costs and other sales expenses related
to winning new orders, and funds for R&D activities that enhance the competitiveness of its products
and strengthen manufacturing capabilities. In investing activities, funds are required for capital invest-
ments to grow business and enhance productivity, and for the purchase of investment securities related
to the execution of business strategies.
In growth areas, MHI Group is planning to execute necessary capital investments and R&D invest-
ment. As a whole, the Group plans to streamline its assets and selectively concentrate on core invest-
ment schemes, while anticipating fund requirements in future growth fields and closely monitoring the
latest market environments and order trends. Accordingly, funding requirements are expected to trend
lower going forward.
Breakdown of interest-bearing debt and its applications
The breakdown of interest-bearing debt as of March 31, 2011 was as follows:
(In millions of yen)
Total Due within one year Due after one year
Short-term borrowings 85,488 85,488 —
Long-term borrowings 896,104 211,114 684,989
Bonds 344,074 14,074 330,000
Total 1,325,667 310,677 1,014,989

ANNUAL REPORT 2011 51
MHI Group is involved in numerous projects with comparatively long construction periods. It also
owns numerous manufacturing facilities that employ large-scale machinery facilities. Consequently, MHI
Group must secure a stable level of working capital and funds for capital investments. Since the start of
the global financial crisis in 2008, the Group has worked to streamline its assets, and has repaid short-
term borrowings that have come due. As a result, the total interest-bearing debt of MHI Group at the
end of fiscal year 2010 was ¥1,325,667 million, consisting of ¥310,677 million due within one year, and
¥1,014,989 million due after one year.
The interest-bearing debt mentioned above is utilized as working capital and for capital investments
required for business activities, and MHI Group plans to use these funds mainly in key growth fields
expected to require funds, including the Power Systems and Aerospace segments.
Financial policy
MHI Group currently funds its working capital and capital investments from its operating cash flows. Any
additional requirements can be met with interest-bearing debt.
In appropriately determining the amounts and methods of procuring long-term funds through long-
term borrowings, bonds, and other means, MHI Group takes into account the funding requirements of
its business plans, interest-rate trends and various other factors, as well as the repayment schedule for
its existing debt.
Additionally, in its efforts to reduce interest-bearing debt, MHI Group strives to efficiently utilize
surplus funds within the Group using a cash management system. At the same time, MHI Group is
working to improve asset efficiency by reducing trade receivables and inventories and by raising the
utilization rate of its property, plant and equipment.
MHI Group flexibly considers the repurchase of treasury stock based on the financial position of the
Group, the stock price, as well as recent earnings forecasts and other factors.

Mitsubishi Heavy Industries, Ltd. and Consolidated SubsidiariesAs of March 31, 2011 and 2010
consoliDateD Balance sheets
MITSUBISHI HEAVY INDUSTRIES, LTD.52
In millions of yenIn thousands of
U.S. dollars (Note 2)
ASSETS 2011 2010 2011
Current assets:Cash and deposits (Notes 3 and 18) . . . . . . . . . . . . . . . . . . . . . . . . . . . . . . . . . . . . . . . . ¥ 301,047 ¥ 274,061 $ 3,620,529Trade receivables (Notes 3 and 8) . . . . . . . . . . . . . . . . . . . . . . . . . . . . . . . . . . . . . . . . . . 852,645 948,200 10,254,299Securities (Notes 3 and 4) . . . . . . . . . . . . . . . . . . . . . . . . . . . . . . . . . . . . . . . . . . . . . . . . 8 9 96Merchandise and finished products . . . . . . . . . . . . . . . . . . . . . . . . . . . . . . . . . . . . . . . . . 175,630 171,699 2,112,206Work in process . . . . . . . . . . . . . . . . . . . . . . . . . . . . . . . . . . . . . . . . . . . . . . . . . . . . . . . . 803,874 937,740 9,667,757Raw materials and supplies . . . . . . . . . . . . . . . . . . . . . . . . . . . . . . . . . . . . . . . . . . . . . . . 136,701 130,622 1,644,028Deferred income taxes (Note 6) . . . . . . . . . . . . . . . . . . . . . . . . . . . . . . . . . . . . . . . . . . . . 161,823 142,720 1,946,157Other current assets . . . . . . . . . . . . . . . . . . . . . . . . . . . . . . . . . . . . . . . . . . . . . . . . . . . . 151,383 230,490 1,820,601Allowance for doubtful accounts (Note 1) . . . . . . . . . . . . . . . . . . . . . . . . . . . . . . . . . . . . . (7,500) (8,881) (90,198)
Total current assets . . . . . . . . . . . . . . . . . . . . . . . . . . . . . . . . . . . . . . . . . . . . . . . . . . . . . . 2,575,613 2,826,662 30,975,502
Non-current assets:Property, plant and equipment, net (Notes 8 and 20):
Buildings and structures . . . . . . . . . . . . . . . . . . . . . . . . . . . . . . . . . . . . . . . . . . . . . . . 355,449 344,601 4,274,792Machinery and transportation equipment . . . . . . . . . . . . . . . . . . . . . . . . . . . . . . . . . . . 251,507 277,390 3,024,738Tools, equipment and furniture . . . . . . . . . . . . . . . . . . . . . . . . . . . . . . . . . . . . . . . . . . . 39,714 49,527 477,618Land . . . . . . . . . . . . . . . . . . . . . . . . . . . . . . . . . . . . . . . . . . . . . . . . . . . . . . . . . . . . . . 166,494 163,784 2,002,333Leased assets . . . . . . . . . . . . . . . . . . . . . . . . . . . . . . . . . . . . . . . . . . . . . . . . . . . . . . . 6,004 5,871 72,206Construction in progress . . . . . . . . . . . . . . . . . . . . . . . . . . . . . . . . . . . . . . . . . . . . . . . 42,358 55,176 509,416
Total property, plant and equipment, net . . . . . . . . . . . . . . . . . . . . . . . . . . . . . . . . . . . . . . 861,528 896,350 10,361,130
Intangible assets. . . . . . . . . . . . . . . . . . . . . . . . . . . . . . . . . . . . . . . . . . . . . . . . . . . . . . . 25,165 29,149 302,645
Investments and advances:Investment securities (Notes 3 and 4) . . . . . . . . . . . . . . . . . . . . . . . . . . . . . . . . . . . . . 321,285 342,480 3,863,920Long-term loans and advances . . . . . . . . . . . . . . . . . . . . . . . . . . . . . . . . . . . . . . . . . . . 5,180 3,597 62,297Deferred income taxes (Note 6) . . . . . . . . . . . . . . . . . . . . . . . . . . . . . . . . . . . . . . . . . . 10,824 9,367 130,174Others . . . . . . . . . . . . . . . . . . . . . . . . . . . . . . . . . . . . . . . . . . . . . . . . . . . . . . . . . . . . . 198,938 164,917 2,392,519Allowance for doubtful accounts (Note 1) . . . . . . . . . . . . . . . . . . . . . . . . . . . . . . . . . . . (9,535) (9,665) (114,672)
Total investments and advances . . . . . . . . . . . . . . . . . . . . . . . . . . . . . . . . . . . . . . . . . . . 526,693 510,697 6,334,251Total non-current assets . . . . . . . . . . . . . . . . . . . . . . . . . . . . . . . . . . . . . . . . . . . . . . . . . . . 1,413,387 1,436,197 16,998,039Total assets . . . . . . . . . . . . . . . . . . . . . . . . . . . . . . . . . . . . . . . . . . . . . . . . . . . . . . . . . . . . ¥3,989,001 ¥4,262,859 $47,973,553
The accompanying notes to consolidated financial statements are an integral part of these statements.

ANNUAL REPORT 2011 53
In millions of yenIn thousands of
U.S. dollars (Note 2)
LIABILITIES AND NET ASSETS 2011 2010 2011
Liabilities
Current liabilities:Trade payables (Note 3) . . . . . . . . . . . . . . . . . . . . . . . . . . . . . . . . . . . . . . . . . . . . . . . . ¥ 619,107 ¥ 646,538 $ 7,445,664Short-term borrowings (Notes 3, 7 and 8) . . . . . . . . . . . . . . . . . . . . . . . . . . . . . . . . . . . 85,488 117,679 1,028,117Current portion of long-term borrowings (Notes 3, 7 and 8) . . . . . . . . . . . . . . . . . . . . . 211,114 109,539 2,538,953Commercial papers (Note 7) . . . . . . . . . . . . . . . . . . . . . . . . . . . . . . . . . . . . . . . . . . . . – 6,000 –Current portion of bonds (Notes 3 and 7) . . . . . . . . . . . . . . . . . . . . . . . . . . . . . . . . . . . 14,074 20,000 169,260Reserve for product warranties (Note 1) . . . . . . . . . . . . . . . . . . . . . . . . . . . . . . . . . . . . 23,123 28,636 278,087Reserve for losses on construction contracts (Note 1) . . . . . . . . . . . . . . . . . . . . . . . . . . 50,753 24,490 610,378Reserve for legal claims (Note 1) . . . . . . . . . . . . . . . . . . . . . . . . . . . . . . . . . . . . . . . . . 2,167 13,941 26,061Advance payments received on contracts . . . . . . . . . . . . . . . . . . . . . . . . . . . . . . . . . . . 330,275 389,041 3,972,038Other current liabilities (Notes 6 and 7) . . . . . . . . . . . . . . . . . . . . . . . . . . . . . . . . . . . . 197,965 199,928 2,380,817
Total current liabilities . . . . . . . . . . . . . . . . . . . . . . . . . . . . . . . . . . . . . . . . . . . . . . . . . . 1,534,070 1,555,796 18,449,428
Non-current liabilities:Bonds (Notes 3 and 7) . . . . . . . . . . . . . . . . . . . . . . . . . . . . . . . . . . . . . . . . . . . . . . . . . 330,000 344,605 3,968,731Long-term borrowings (Notes 3, 7 and 8) . . . . . . . . . . . . . . . . . . . . . . . . . . . . . . . . . . . 684,989 897,501 8,237,991Deferred income taxes (Note 6) . . . . . . . . . . . . . . . . . . . . . . . . . . . . . . . . . . . . . . . . . . 3,607 17,886 43,379Reserve for retirement allowance (Notes 1 and 10) . . . . . . . . . . . . . . . . . . . . . . . . . . . . 49,842 48,542 599,422Reserve for treatment of PCB waste (Note 1) . . . . . . . . . . . . . . . . . . . . . . . . . . . . . . . . 7,007 7,358 84,269Other non-current liabilities (Note 7) . . . . . . . . . . . . . . . . . . . . . . . . . . . . . . . . . . . . . . 66,805 62,396 803,427
Total non-current liabilities . . . . . . . . . . . . . . . . . . . . . . . . . . . . . . . . . . . . . . . . . . . . . . . 1,142,251 1,378,290 13,737,233Total liabilities . . . . . . . . . . . . . . . . . . . . . . . . . . . . . . . . . . . . . . . . . . . . . . . . . . . . . . . . . . 2,676,322 2,934,087 32,186,674
Net assetsStockholders’ equity (Note 16):
Common stock, without par value:Authorized shares: 6,000,000,000Issued shares: 2011 and 2010 — 3,373,647,813 . . . . . . . . . . . . . . . . . . . . . . . . . . 265,608 265,608 3,194,323
Capital surplus . . . . . . . . . . . . . . . . . . . . . . . . . . . . . . . . . . . . . . . . . . . . . . . . . . . . . . . 203,939 203,938 2,452,663Retained earnings . . . . . . . . . . . . . . . . . . . . . . . . . . . . . . . . . . . . . . . . . . . . . . . . . . . . 815,145 800,199 9,803,307Treasury stock (2011 — 18,582,258 shares and 2010 — 17,414,651 shares) at cost . (5,425) (5,025) (65,243)
Total stockholders’ equity . . . . . . . . . . . . . . . . . . . . . . . . . . . . . . . . . . . . . . . . . . . . . . . . 1,279,267 1,264,721 15,385,051Accumulated other comprehensive income:
Net unrealized gains (losses) on investment securities . . . . . . . . . . . . . . . . . . . . . . . . . 25,579 35,942 307,624Deferred gains (losses) on hedges . . . . . . . . . . . . . . . . . . . . . . . . . . . . . . . . . . . . . . . . (467) (721) (5,616)Foreign currency translation adjustments . . . . . . . . . . . . . . . . . . . . . . . . . . . . . . . . . . . (42,311) (21,894) (508,851)
Total accumulated other comprehensive income . . . . . . . . . . . . . . . . . . . . . . . . . . . . . . (17,199) 13,327 (206,843)Share subscription rights (Note 17) . . . . . . . . . . . . . . . . . . . . . . . . . . . . . . . . . . . . . . . . 1,509 1,184 18,147Minority interests . . . . . . . . . . . . . . . . . . . . . . . . . . . . . . . . . . . . . . . . . . . . . . . . . . . . . . 49,101 49,540 590,511
Total net assets . . . . . . . . . . . . . . . . . . . . . . . . . . . . . . . . . . . . . . . . . . . . . . . . . . . . . . . . . 1,312,678 1,328,772 15,786,867Total liabilities and net assets . . . . . . . . . . . . . . . . . . . . . . . . . . . . . . . . . . . . . . . . . . . . . . ¥3,989,001 ¥4,262,859 $47,973,553

Mitsubishi Heavy Industries, Ltd. and Consolidated SubsidiariesFor the years ended March 31, 2011 and 2010
consoliDateD stateMents of incoMe
MITSUBISHI HEAVY INDUSTRIES, LTD.54
In millions of yenIn thousands of
U.S. dollars (Note 2)
2011 2010 2011
Net Sales . . . . . . . . . . . . . . . . . . . . . . . . . . . . . . . . . . . . . . . . . . . . . . . . . . . . . . . . . . . . . . . ¥2,903,770 ¥2,940,887 $34,922,068Cost of sales . . . . . . . . . . . . . . . . . . . . . . . . . . . . . . . . . . . . . . . . . . . . . . . . . . . . . . . . . . . . . 2,461,857 2,537,257 29,607,420Gross Profit . . . . . . . . . . . . . . . . . . . . . . . . . . . . . . . . . . . . . . . . . . . . . . . . . . . . . . . . . . . . . 441,913 403,629 5,314,648Selling, general and administrative expenses (Note 19) . . . . . . . . . . . . . . . . . . . . . . . . . . . . . 340,693 337,968 4,097,330Operating income . . . . . . . . . . . . . . . . . . . . . . . . . . . . . . . . . . . . . . . . . . . . . . . . . . . . . . . . . 101,219 65,660 1,217,306
Non-operating income (expenses):Interest income . . . . . . . . . . . . . . . . . . . . . . . . . . . . . . . . . . . . . . . . . . . . . . . . . . . . . . . . . 4,029 3,652 48,454Dividend income . . . . . . . . . . . . . . . . . . . . . . . . . . . . . . . . . . . . . . . . . . . . . . . . . . . . . . . . 3,499 3,305 42,080Income (loss) from equity method investments . . . . . . . . . . . . . . . . . . . . . . . . . . . . . . . . . 6,804 (2,074) 81,828Other income . . . . . . . . . . . . . . . . . . . . . . . . . . . . . . . . . . . . . . . . . . . . . . . . . . . . . . . . . . 5,867 5,678 70,559Interest expense . . . . . . . . . . . . . . . . . . . . . . . . . . . . . . . . . . . . . . . . . . . . . . . . . . . . . . . . (22,471) (22,632) (270,246)Foreign exchange loss . . . . . . . . . . . . . . . . . . . . . . . . . . . . . . . . . . . . . . . . . . . . . . . . . . . . (14,556) (419) (175,057)Loss on disposal of fixed assets . . . . . . . . . . . . . . . . . . . . . . . . . . . . . . . . . . . . . . . . . . . . . (5,882) (6,279) (70,739)Other expenses (Note 14) . . . . . . . . . . . . . . . . . . . . . . . . . . . . . . . . . . . . . . . . . . . . . . . . . (10,396) (22,882) (125,027)
Total non-operating income (expenses) . . . . . . . . . . . . . . . . . . . . . . . . . . . . . . . . . . . . . . . . . (33,106) (41,651) (398,147)Ordinary income . . . . . . . . . . . . . . . . . . . . . . . . . . . . . . . . . . . . . . . . . . . . . . . . . . . . . . . . . . 68,113 24,009 819,158
Extraordinary gain (loss):Gain on sales of fixed assets (Note 11) . . . . . . . . . . . . . . . . . . . . . . . . . . . . . . . . . . . . . . . . 10,870 10,086 130,727Gain on sales of investment securities . . . . . . . . . . . . . . . . . . . . . . . . . . . . . . . . . . . . . . . . 4,972 5,063 59,795Gain on revision of retirement benefit plan (Notes 1 and 10) . . . . . . . . . . . . . . . . . . . . . . . – 4,950 –Business structure improvement expenses (Notes 12 and 14) . . . . . . . . . . . . . . . . . . . . . . (22,684) (15,972) (272,808)Loss on disaster (Note 13) . . . . . . . . . . . . . . . . . . . . . . . . . . . . . . . . . . . . . . . . . . . . . . . . . (10,240) – (123,150)Loss on revaluation of investment securities (Note 4) . . . . . . . . . . . . . . . . . . . . . . . . . . . . . (9,519) – (114,479)Loss on the application of the accounting standards for asset retirement obligations (Note 1) . . . (2,012) – (24,197)
Total extraordinary gain (loss) . . . . . . . . . . . . . . . . . . . . . . . . . . . . . . . . . . . . . . . . . . . . . . . . (28,614) 4,128 (344,125)Income before income taxes and minority interests . . . . . . . . . . . . . . . . . . . . . . . . . . . . . . . 39,499 28,137 475,033
Income taxes (Note 6):Current . . . . . . . . . . . . . . . . . . . . . . . . . . . . . . . . . . . . . . . . . . . . . . . . . . . . . . . . . . . . . . . 39,905 26,146 479,915Deferred . . . . . . . . . . . . . . . . . . . . . . . . . . . . . . . . . . . . . . . . . . . . . . . . . . . . . . . . . . . . . . (29,423) (7,920) (353,854)
Total income taxes . . . . . . . . . . . . . . . . . . . . . . . . . . . . . . . . . . . . . . . . . . . . . . . . . . . . . . . . 10,481 18,226 126,049Income before minority interests . . . . . . . . . . . . . . . . . . . . . . . . . . . . . . . . . . . . . . . . . . . . . 29,018 9,911 348,983Minority interests in income (loss) of consolidated subsidiaries . . . . . . . . . . . . . . . . . . . . . . . (1,099) (4,252) (13,217)Net income . . . . . . . . . . . . . . . . . . . . . . . . . . . . . . . . . . . . . . . . . . . . . . . . . . . . . . . . . . . . . ¥ 30,117 ¥ 14,163 $ 362,200
In yenIn U.S. dollars
(Note 2)
2011 2010 2011
Per share information of common stock (Note 1):Net income—basic . . . . . . . . . . . . . . . . . . . . . . . . . . . . . . . . . . . . . . . . . . . . . . . . . . . . . . ¥8.97 ¥4.22 $0.108Net income—diluted . . . . . . . . . . . . . . . . . . . . . . . . . . . . . . . . . . . . . . . . . . . . . . . . . . . . . 8.96 4.22 0.108Cash dividends . . . . . . . . . . . . . . . . . . . . . . . . . . . . . . . . . . . . . . . . . . . . . . . . . . . . . . . . . 4.00 4.00 0.048
The accompanying notes to consolidated financial statements are an integral part of these statements.

Mitsubishi Heavy Industries, Ltd. and Consolidated SubsidiariesFor the year ended March 31, 2011
consoliDateD stateMent of coMprehensive incoMe
ANNUAL REPORT 2011 55
In millions of yenIn thousands of
U.S. dollars (Note 2)
2011 2011
Income before minority interests . . . . . . . . . . . . . . . . . . . . . . . . . . . . . . . . . . . . . . . . . . . . . . . . . ¥ 29,018 $ 348,983
Other comprehensive income (loss):
Net unrealized gains (losses) on investment securities . . . . . . . . . . . . . . . . . . . . . . . . . . . . . . . (10,934) (131,497)
Deferred gains (losses) on hedges . . . . . . . . . . . . . . . . . . . . . . . . . . . . . . . . . . . . . . . . . . . . . . (262) (3,150)
Foreign currency translation adjustments . . . . . . . . . . . . . . . . . . . . . . . . . . . . . . . . . . . . . . . . . (17,337) (208,502)
Share of other comprehensive income (loss) of entities accounted for using the equity method . . . . . . . . . . . . . . . . . . . . . . . . . . . . . . . . . . . . . . . . . . . . . . . . . . . . (2,676) (32,182)
Total other comprehensive income (loss) (Note 15) . . . . . . . . . . . . . . . . . . . . . . . . . . . . . . . . . . . (31,211) (375,357)
Comprehensive income (loss) (Note 15) . . . . . . . . . . . . . . . . . . . . . . . . . . . . . . . . . . . . . . . . . . . ¥ (2,192) $ (26,361)
Comprehensive income (loss) attributable to:
Shareholders of the parent . . . . . . . . . . . . . . . . . . . . . . . . . . . . . . . . . . . . . . . . . . . . . . . . . . . . ¥ (408) $ (4,906)
Minority interests . . . . . . . . . . . . . . . . . . . . . . . . . . . . . . . . . . . . . . . . . . . . . . . . . . . . . . . . . . . (1,784) (21,455)
The accompanying notes to consolidated financial statements are an integral part of these statements.

Mitsubishi Heavy Industries, Ltd. and Consolidated SubsidiariesFor the years ended March 31, 2011 and 2010
consoliDateD stateMents of changes in net assets
MITSUBISHI HEAVY INDUSTRIES, LTD.56
In millions of yen
Stockholders’ equity Accumulated other comprehensive income
Common stock
Capital surplus
Retained earnings
Treasury stock
Total stockholders’
equity
Net unrealized gains (losses) on investment
securities
Deferred gains
(losses) on hedges
Foreign currency
translation adjustments
Total accumulated
other comprehensive
income
Share subscription
rightsMinority interests
Total net assets
Balance as of March 31, 2009 . . . ¥265,608 ¥203,928 ¥788,948 ¥(5,041) ¥1,253,443 ¥ 17,313 ¥ 323 ¥(29,482) ¥(11,845) ¥ 881 ¥40,772 ¥1,283,251Cash dividends (Note 16) . . . . . . (16,781) (16,781) (16,781)Net income . . . . . . . . . . . . . . . . . 14,163 14,163 14,163Changes in scope of consolidation . . . . . . . . . . . . . . . (0) (0) (0)Changes in scope of equity method application . . . . . . . . . . 884 (1) 882 882Changes in equity interest mainly due to reorganization . . . 12,984 12,984 12,984Purchase of treasury stock . . . . . . (21) (21) (21)Disposal of treasury stock . . . . . . 10 38 49 49Net changes in items other than stockholders’ equity . . . . . . . . . . – 18,629 (1,045) 7,588 25,172 303 8,767 34,243
Subtotal . . . . . . . . . . . . . . . . . . – 10 11,250 16 11,277 18,629 (1,045) 7,588 25,172 303 8,767 45,521Balance as of March 31, 2010 . . . ¥265,608 ¥203,938 ¥800,199 ¥(5,025) ¥1,264,721 ¥ 35,942 ¥ (721) ¥(21,894) ¥13,327 ¥1,184 ¥49,540 ¥1,328,772
Cash dividends (Note 16) . . . . . . (13,425) (13,425) (13,425)Net income . . . . . . . . . . . . . . . . . 30,117 30,117 30,117Changes in scope of consolidation . . . . . . . . . . . . . . . (1,763) (1,763) (1,763)Changes in scope of equity method application . . . . . . . . . . 18 18 18Purchase of treasury stock . . . . . . (412) (412) (412)Disposal of treasury stock . . . . . . 0 12 12 12Net changes in items other than stockholders’ equity . . . . . . . . . . – (10,363) 254 (20,416) (30,526) 324 (439) (30,640)
Subtotal . . . . . . . . . . . . . . . . . . – 0 14,946 (400) 14,546 (10,363) 254 (20,416) (30,526) 324 (439) (16,093)Balance as of March 31, 2011 . . . ¥265,608 ¥203,939 ¥815,145 ¥(5,425) ¥1,279,267 ¥ 25,579 ¥ (467) ¥(42,311) ¥(17,199) ¥1,509 ¥49,101 ¥1,312,678
In thousands of U.S. dollars (Note 2)
Stockholders’ equity Accumulated other comprehensive income
Common stock
Capital surplus
Retained earnings
Treasury stock
Total stockholders’
equity
Net unrealized gains (losses) on investment
securities
Deferred gains
(losses) on hedges
Foreign currency
translation adjustments
Total accumulated
other comprehensive
income
Share subscription
rightsMinority interests
Total net assets
Balance as of March 31, 2010 . . . $3,194,323 $2,452,651 $9,623,559 $(60,432) $15,210,114 $ 432,254 $(8,671) $(263,307) $ 160,276 $14,239 $595,790 $15,980,420Cash dividends (Note 16) . . . . . . (161,455) (161,455) (161,455)Net income . . . . . . . . . . . . . . . . . 362,200 362,200 362,200Changes in scope of consolidation . . . . . . . . . . . . . . . (21,202) (21,202) (21,202)Changes in scope of equity method application . . . . . . . . . . 216 216 216Purchase of treasury stock . . . . . . (4,954) (4,954) (4,954)Disposal of treasury stock . . . . . . 0 144 144 144Net changes in items other than stockholders’ equity . . . . . . . . . . – (124,630) 3,054 (245,532) (367,119) 3,896 (5,279) (368,490)
Subtotal . . . . . . . . . . . . . . . . . . – 0 179,747 (4,810) 174,936 (124,630) 3,054 (245,532) (367,119) 3,896 (5,279) (193,541)Balance as of March 31, 2011 . . . $3,194,323 $2,452,663 $9,803,307 $(65,243) $15,385,051 $ 307,624 $(5,616) $(508,851) $(206,843) $18,147 $590,511 $15,786,867

Mitsubishi Heavy Industries, Ltd. and Consolidated SubsidiariesFor the years ended March 31, 2011 and 2010
consoliDateD stateMents of cash flows
ANNUAL REPORT 2011 57
In millions of yenIn thousands of
U.S. dollars (Note 2)
2011 2010 2011
Cash flows from operating activities:Income before income taxes and minority interests . . . . . . . . . . . . . . . . . . . . . . . . . . . . . . ¥ 39,499 ¥ 28,137 $ 475,033Adjustments to reconcile income before income taxes and minority interests to net cash provided by operating activities:Depreciation and amortization . . . . . . . . . . . . . . . . . . . . . . . . . . . . . . . . . . . . . . . . . . . . . . 132,159 138,045 1,589,404Increase (decrease) in reserve for retirement allowance . . . . . . . . . . . . . . . . . . . . . . . . . . . 819 (665) 9,849Interest and dividend income . . . . . . . . . . . . . . . . . . . . . . . . . . . . . . . . . . . . . . . . . . . . . . . (7,529) (6,957) (90,547)Interest expense . . . . . . . . . . . . . . . . . . . . . . . . . . . . . . . . . . . . . . . . . . . . . . . . . . . . . . . . 22,471 22,632 270,246(Income) loss from equity method investments . . . . . . . . . . . . . . . . . . . . . . . . . . . . . . . . . (6,804) 2,074 (81,828)(Gain) loss on sales of investment securities . . . . . . . . . . . . . . . . . . . . . . . . . . . . . . . . . . . . (4,972) (5,063) (59,795)Loss on revaluation of investment securities . . . . . . . . . . . . . . . . . . . . . . . . . . . . . . . . . . . . 9,519 – 114,479(Gain) loss on sales of fixed assets . . . . . . . . . . . . . . . . . . . . . . . . . . . . . . . . . . . . . . . . . . . (10,870) (10,086) (130,727)Loss on disposal of fixed assets . . . . . . . . . . . . . . . . . . . . . . . . . . . . . . . . . . . . . . . . . . . . . 5,882 6,279 70,739Loss on the application of the accounting standards for asset retirement obligations . . . . . . 2,012 – 24,197Business structure improvement expenses . . . . . . . . . . . . . . . . . . . . . . . . . . . . . . . . . . . . 22,684 15,972 272,808Loss on disaster . . . . . . . . . . . . . . . . . . . . . . . . . . . . . . . . . . . . . . . . . . . . . . . . . . . . . . . . . 10,240 – 123,150(Increase) decrease in receivables . . . . . . . . . . . . . . . . . . . . . . . . . . . . . . . . . . . . . . . . . . . 82,377 136,737 990,703(Increase) decrease in inventories and advances to suppliers . . . . . . . . . . . . . . . . . . . . . . . 167,088 40,913 2,009,476(Increase) decrease in other assets . . . . . . . . . . . . . . . . . . . . . . . . . . . . . . . . . . . . . . . . . . (22,024) (2,519) (264,870)Increase (decrease) in payables . . . . . . . . . . . . . . . . . . . . . . . . . . . . . . . . . . . . . . . . . . . . . (27,390) (55,822) (329,404)Increase (decrease) in advance payments received on contracts . . . . . . . . . . . . . . . . . . . . (54,465) (91,386) (655,021)Increase (decrease) in other liabilities . . . . . . . . . . . . . . . . . . . . . . . . . . . . . . . . . . . . . . . . 8,297 (49,177) 99,783Others . . . . . . . . . . . . . . . . . . . . . . . . . . . . . . . . . . . . . . . . . . . . . . . . . . . . . . . . . . . . . . . . (301) 1,139 (3,619)
Subtotal . . . . . . . . . . . . . . . . . . . . . . . . . . . . . . . . . . . . . . . . . . . . . . . . . . . . . . . . . . . . . 368,694 170,253 4,434,082Interest and dividends received . . . . . . . . . . . . . . . . . . . . . . . . . . . . . . . . . . . . . . . . . . . . . 9,472 8,326 113,914Interest paid . . . . . . . . . . . . . . . . . . . . . . . . . . . . . . . . . . . . . . . . . . . . . . . . . . . . . . . . . . . (22,871) (22,105) (275,057)Income taxes paid . . . . . . . . . . . . . . . . . . . . . . . . . . . . . . . . . . . . . . . . . . . . . . . . . . . . . . . (17,490) (38,497) (210,342)
Net cash provided by operating activities . . . . . . . . . . . . . . . . . . . . . . . . . . . . . . . . . . . . 337,805 117,977 4,062,597
Cash flows from investing activities:Net (increase) decrease in time deposits . . . . . . . . . . . . . . . . . . . . . . . . . . . . . . . . . . . . . . (154) (607) (1,852)Purchases of property, plant, equipment and intangible assets . . . . . . . . . . . . . . . . . . . . . . (138,099) (183,304) (1,660,841)Proceeds from sales of property, plant, equipment and intangible assets . . . . . . . . . . . . . . 12,899 30,657 155,129Purchases of investment securities . . . . . . . . . . . . . . . . . . . . . . . . . . . . . . . . . . . . . . . . . . (16,835) (38,841) (202,465)Proceeds from sales and redemption of investment securities . . . . . . . . . . . . . . . . . . . . . . 6,246 8,084 75,117Disbursement of long-term loans . . . . . . . . . . . . . . . . . . . . . . . . . . . . . . . . . . . . . . . . . . . . (2,729) (15,820) (32,820)Collection of long-term loans . . . . . . . . . . . . . . . . . . . . . . . . . . . . . . . . . . . . . . . . . . . . . . . 3,124 19,337 37,570Others . . . . . . . . . . . . . . . . . . . . . . . . . . . . . . . . . . . . . . . . . . . . . . . . . . . . . . . . . . . . . . . . (1,699) (208) (20,432)
Net cash used in investing activities . . . . . . . . . . . . . . . . . . . . . . . . . . . . . . . . . . . . . . . . (137,248) (180,704) (1,650,607)
Cash flows from financing activities:Net increase (decrease) in short-term borrowings and commercial papers . . . . . . . . . . . . . (32,522) (241,103) (391,124)Proceeds from long-term borrowings . . . . . . . . . . . . . . . . . . . . . . . . . . . . . . . . . . . . . . . . . 13,537 182,705 162,802Repayment of long-term borrowings . . . . . . . . . . . . . . . . . . . . . . . . . . . . . . . . . . . . . . . . . . (116,220) (120,038) (1,397,714)Proceeds from issuance of bonds . . . . . . . . . . . . . . . . . . . . . . . . . . . . . . . . . . . . . . . . . . . – 100,000 –Payment for redemption of bonds . . . . . . . . . . . . . . . . . . . . . . . . . . . . . . . . . . . . . . . . . . . (20,000) (20,350) (240,529)Proceeds from issuance of stock to minority stockholders of subsidiaries . . . . . . . . . . . . . . 1,899 13,873 22,838Dividends paid to stockholders . . . . . . . . . . . . . . . . . . . . . . . . . . . . . . . . . . . . . . . . . . . . . (13,351) (16,698) (160,565)Dividends paid to minority stockholders of subsidiaries . . . . . . . . . . . . . . . . . . . . . . . . . . . (598) (819) (7,191)Others . . . . . . . . . . . . . . . . . . . . . . . . . . . . . . . . . . . . . . . . . . . . . . . . . . . . . . . . . . . . . . . . (2,537) (2,860) (30,511)
Net cash used in financing activities . . . . . . . . . . . . . . . . . . . . . . . . . . . . . . . . . . . . . . . . (169,793) (105,291) (2,042,008)Effect of exchange rate changes on cash and cash equivalents . . . . . . . . . . . . . . . . . . . . . . . (2,512) 3,478 (30,210)Net increase (decrease) in cash and cash equivalents . . . . . . . . . . . . . . . . . . . . . . . . . . . . . 28,251 (164,539) 339,759
Cash and cash equivalents at beginning of year . . . . . . . . . . . . . . . . . . . . . . . . . . . . . . . . . . . 261,373 425,913 3,143,391Increase in cash and cash equivalents due to changes in scope of consolidation . . . . . . . . . . 275 – 3,307Decrease in cash and cash equivalents due to changes in scope of consolidation . . . . . . . . . (1,031) – (12,399)Cash and cash equivalents at end of year (Note 18) . . . . . . . . . . . . . . . . . . . . . . . . . . . . . . . ¥ 288,868 ¥ 261,373 $ 3,474,058
The accompanying notes to consolidated financial statements are an integral part of these statements.

Mitsubishi Heavy Industries, Ltd. and Consolidated SubsidiariesYears ended March 31, 2011 and 2010
notes to consoliDateD financial stateMents
MITSUBISHI HEAVY INDUSTRIES, LTD.58
1. SUMMARY OF SIGNIFICANT ACCOUNTING POLICIES
a) Basis of presenting consolidated financial statementsThe accompanying consolidated financial statements of the Mitsubishi Heavy Industries Group (the “Group”), which consists of Mitsubishi Heavy Industries, Ltd. (“MHI”) and its consolidated subsidiaries (“Subsidiaries”), have been prepared in accordance with accounting principles generally accepted in Japan, which are different in certain respects as to the application and disclosure requirements of International Financial Reporting Standards, and have been prepared from the consolidated financial statements filed with the Financial Services Agency (“FSA”) of Japan.
As permitted by the Financial Instruments and Exchange Act of Japan, amounts of less than one million yen have been omitted. Consequently, the totals shown in the accompanying consolidated financial statements (both in yen and U.S. dollars) do not necessarily agree with the sums of the individual amounts.
b) Principles of consolidationThe accompanying consolidated financial statements for the years ended March 31, 2011 and 2010 include the accounts of the Group. All significant inter-company transactions and accounts have been eliminated.
Investments in unconsolidated subsidiaries and affiliates, with certain minor exceptions, are accounted for by the equity method.
c) Foreign currency translationForeign currency monetary assets and liabilities are translated into Japanese yen at the exchange rates in effect at the balance sheet date and the resulting translation gains or losses are included in net income.
All assets and liabilities of overseas subsidiaries and affiliates are translated into Japanese yen at the exchange rates in effect at the balance sheet date, revenues and expenses at the average exchange rates during the year, and stockholders’ equity at historical rates. The resulting foreign currency translation adjustments are accounted for as a component of net assets.
d) SecuritiesSecurities include (1) investments in unconsolidated subsidiaries and affiliates and (2) other securities (available-for-sale securities). Their valuation standards and methods are as follows:(1) Investments in unconsolidated subsidiaries and affiliates excluding those accounted for by the equity method: Historical cost (moving average method).(2a) Other securities with market value: Market value method based on market prices or other fair values at the balance sheet date. Unrealized holding
gains and losses are accounted for as a component of net assets, net of tax effect. The costs of sold securities are computed based on the moving average method.
(2b) Other securities without market value: Historical cost (moving average method). As to the presentation of the balance sheet, the Group has classified securities due within one year as securities
in current assets and the others as investment securities in “Investments and advances.”
e) InventoriesMerchandise and finished products are principally stated at cost determined by the moving average method. (Balance sheet amounts are determined by the method of writing down to reflect a decline in the profitability of the assets.)
Work in process is principally stated at cost determined by the specific identification method. (Balance sheet amounts are determined by the method of writing down to reflect a decline in the profitability of the assets.)
Raw materials and supplies are principally stated at cost determined by the moving average method. (Balance sheet amounts are determined by the method of writing down to reflect a decline in the profitability of the assets.)
f) Depreciation of property, plant and equipmentDepreciation of property, plant and equipment (excluding leased assets) is principally computed using the straight-line method for buildings (excluding the equipment attached to them) and the declining-balance method for the other items of property, plant and equipment over the assets’ useful lives, which are substantially the same as those prescribed in the Corporation Income Tax Law.
Depreciation of leased assets is computed using the straight-line method over the lease terms.

ANNUAL REPORT 2011 59
g) Amortization of intangible assetsAmortization of intangible assets (excluding leased assets) is computed using the straight-line method over the assets’ useful lives, which are substantially the same as those prescribed in the Corporation Income Tax Law.
Amortization of leased assets is computed using the straight-line method over the lease terms.Goodwill is amortized on a straight-line basis over the investment recovery period of up to 20 years.
h) Allowance for doubtful accountsAllowance for doubtful accounts is provided for possible losses on the collection of receivables. The amount of the allowance for general receivables is based on the write-off ratio. As for certain receivables such as the ones from the debtors whose solvency is in doubt, the recoverability of each receivable is examined individually and the estimated unrecoverable amounts are recognized as the allowance.
i) Reserve for product warrantiesReserve for product warranties is provided for the product warranty expenditure after products are delivered. The amounts are estimated based on the past statistics and other relevant factors.
j) Reserve for losses on construction contractsReserve for losses on construction contracts is provided for the expected total losses to be realized in the following years on the construction contracts if (1) those losses are judged inevitable at current year-end and (2) reasonable estimation of the amounts of such losses is possible.
With regard to the construction contracts for which this reserve is recognized, if the year-end balances of their work-in-process already exceed their respective total contract revenues, the exceeding portion is recognized as the loss on devaluation of the work-in-process and, accordingly, is not included in the reserve for losses on construction contracts.
k) Reserve for legal claimsReserve for legal claims is provided based on estimates of damage compensations and other expenses on legal claims.
l) Reserve for retirement allowanceReserve for retirement allowance is provided for employees’ retirement benefits. The amounts are based on the balances of retirement benefit obligations and estimated pension fund assets (including a retirement benefit trust) at the end of the fiscal year.
Prior service costs are either expensed as incurred or amortized by the straight-line method over the years shorter than the average remaining service period of employees.
Actuarial gains and losses for each year are amortized, starting in the following year of the incurrence, by the straight-line method over the years shorter than the average remaining service period of employees.
m) Reserve for treatment of PCB wasteReserve for treatment of PCB (Poly Chlorinated Biphenyl) waste is provided based on estimated costs of the treatment of PCB products and equipment.
n) Revenue recognitionWith regard to construction contracts, the percentage-of-completion method is applied if a reliable estimation of the (1) total costs on and revenues from a contract and (2) percentage of completion at the balance sheet date is available. In applying this method, the percentage of completion at the balance sheet date is estimated based on the costs incurred to date divided by the estimated total costs on the contracts. The completed-contract method is applied when the above conditions are not met.
o) Hedge AccountingThe principal method in applying the hedge accounting is deferral hedge accounting, where gains or losses on a hedging instrument are deferred (and recognized as a component of net assets, net of tax effect) until the losses or gains on the hedged item are recognized in the income statement.
The Group applies the “assigning method for foreign currency receivables or payables” (hereinafter referred to as the “assigning method”) and the “exceptional method for interest rate swaps” (hereinafter referred to as the “exceptional method”) when the transactions meet the requirements of relevant accounting standards.

notes to consoliDateD Financial stateMents
MITSUBISHI HEAVY INDUSTRIES, LTD.60
2. U.S. DOLLAR AMOUNTS
The “assigning method” is applied when a forward exchange contract (hedging instrument) with the corresponding conditions (e.g. amount, currency and settlement period) to the hedged item is concluded to fix the conversion rate of those receivables or payables. Under this method, the hedged item and the hedging instrument are treated as a single item, thus the hedged item is converted by the forward exchange contract rate; the fair value of the hedging instrument is not computed. The assigning method is not applied in case of comprehensive forward exchange contracts.
The “exceptional method” is applied when an interest rate swap (hedging instrument) with the corresponding conditions (e.g. principal amount, maturity and index) to the hedged item is concluded to fix the interest rate on the hedged item. Under this method, the amounts to be paid or received under the contract is added to or deducted from the interest; the fair value of the hedging instrument is not computed.
The Group evaluates the effectiveness of its hedging activities by reference to the accumulated gains or losses on the hedging instruments and those on the hedged items from the commencement of the hedges.
p) Tax-effect accountingDeferred income taxes arise from temporary differences between the financial reporting and tax bases of assets and liabilities. They are accounted for under the asset and liability method, where the amounts of deferred income taxes are calculated using the future tax rates in effect when the temporary differences are recovered or settled.
q) Cash and cash equivalentsFor the purpose of the consolidated statements of cash flows, cash and cash equivalents consist of cash on hand, demand deposits and short-term highly liquid investments with maturities of three months or less when purchased that have insignificant risk of changes in value.
r) Net income per shareThe computation of basic net income per share is based on the net income available to common stockholders and the weighted average number of shares outstanding during each period.
Diluted net income per share is computed based on the assumption that all the share subscription rights are exercised at the beginning of the year (or issue date if later).
s) Change in accounting policyApplication of the accounting standards for asset retirement obligationsThe Group has applied the “Accounting Standard for Asset Retirement Obligations” (ASBJ Statement No.18, issued on March 31, 2008) and the “Guidance on Accounting Standard for Asset Retirement Obligations” (ASBJ Guidance No.21, issued on March 31, 2008) since the year ended March 31, 2011.
As a result, operating income and ordinary income for the year ended March 31, 2011 decreased by 505 million yen ($6,073 thousand); income before income taxes and minority interests for the year ended March 31, 2011 decreased by 2,517 million yen ($30,270 thousand).
t) Additional informationApplication of the accounting standard for presentation of comprehensive incomeThe Group has applied the “Accounting Standard for Presentation of Comprehensive Income” (ASBJ Statement No.25, issued on June 30, 2010) since the year ended March 31, 2011.
U.S. dollar amounts are included solely for convenience. These translations should not be construed as representations that the Japanese yen actually represent, or have been or could be converted into, U.S. dollars.
As the amounts shown in U.S. dollars are for convenience only, the rate of ¥83.15=US$1 prevailing at March 31, 2011 is used for the purpose of the presentation of the U.S. dollar amounts in the accompanying consolidated financial statements.

ANNUAL REPORT 2011 61
The carrying amounts on the consolidated balance sheet, fair values and the variance between them of financial instruments as of March 31, 2011 and 2010 are shown in the following table. The ones whose fair values are extremely difficult to determine are excluded from the following table and shown in Footnote 2. See Note 1 o) for the information on hedge accounting.
In millions of yen In thousands of U.S. dollars
2011 2011Carrying Amount Fair Value Variance Carrying Amount Fair Value Variance
(1) Cash and deposits . . . . . ¥ 301,047 ¥ 301,047 ¥ – $ 3,620,529 $ 3,620,529 $ –(2) Trade receivables . . . . . . 852,645 852,645 – 10,254,299 10,254,299 –(3) Securities and
investment securities . . . 168,795 240,080 71,284 2,030,006 2,887,312 857,294Asset Items Total . . . . . . . . . ¥1,322,487 ¥1,393,772 ¥71,284 $15,904,834 $16,762,140 $857,294(4) Trade payables . . . . . . . 619,107 619,107 – 7,445,664 7,445,664 –(5) Short-term borrowings . . . 85,488 85,488 – 1,028,117 1,028,117 –(6) Bonds . . . . . . . . . . . . . . 344,074 352,480 8,405 4,137,991 4,239,085 101,082(7) Long-term borrowings . . . 896,104 919,911 23,806 10,776,957 11,063,271 286,301Liability Items Total . . . . . . . ¥1,944,774 ¥1,976,987 ¥32,212 $23,388,743 $23,776,151 $387,396(8) Derivatives (*) . . . . . . . . ¥ (1,620) ¥ (1,620) ¥ – $ (19,482) $ (19,482) $ –(*) The derivatives positions shown are net amounts. The amounts in parentheses show liability balances.
In millions of yen
2010
Carrying Amount Fair Value Variance
(1) Cash and deposits . . . . . ¥ 274,061 ¥ 274,061 ¥ –(2) Trade receivables . . . . . . 948,200 948,200 –(3) Securities and
investment securities . . . 188,822 280,742 91,920Asset Items Total . . . . . . . . . ¥1,411,083 ¥1,503,003 ¥91,920
(4) Trade payables . . . . . . . 646,538 646,538 –
(5) Short-term borrowings . . . 117,679 117,679 –
(6) Bonds . . . . . . . . . . . . . . 364,605 371,423 6,818
(7) Long-term borrowings . . . 1,007,041 1,025,214 18,172
Liability Items Total . . . . . . . ¥2,135,864 ¥2,160,855 ¥24,991(8) Derivatives (*) . . . . . . . . ¥ 266 ¥ 266 ¥ –(*) The derivatives positions shown are net amounts.
(Footnote 1) The computation method of the fair values of financial instruments(1) Cash and deposits
The book values are used as the fair values since all the deposits are short-term and the fair values are almost equal to the book values.(2) Trade receivables
The book values are used as the fair values since a large portion of these are settled in a short period and the fair values could be deemed almost equal to the book values.
(3) Securities and investment securities Market prices are used as the fair values.
(4) Trade payables; (5) Short-term borrowings The book values are used as the fair values since a large portion of these are settled in a short period and the fair values are almost equal to the book values.
(6) Bonds If market prices are available, they are used as the fair values. If not, the present values of the principal and total interest (discounted by the rate based on the remaining years and the credit risk of the bonds) are used as the fair values.
(7) Long-term borrowings The present values of the principal and total interest (*) (discounted by the rate assumed to be applied to the new borrowings of the same conditions) are used as the fair values. (*) As for the long-term borrowings to which the “exceptional method for interest-rate swaps” is applied, the principal and total interest according to the interest rate under the interest-rate swaps are used.
(8) Derivatives See Note 5.
(Footnote 2) Financial instruments shown below are excluded from the above table because they do not have market prices and it is extremely difficult to determine their fair values.
In millions of yenIn thousands of
U.S. dollars
2011 2010 2011
Carrying amounts of unlisted securities . . . . . . . . . . . . . . . ¥152,498 ¥153,668 $1,834,010
3. FINANCIAL INSTRUMENTS

notes to consoliDateD Financial stateMents
MITSUBISHI HEAVY INDUSTRIES, LTD.62
(Footnote 3) The contractual maturities of monetary receivables and other securities at March 31, 2011 and 2010 were as follows:
In millions of yen In thousands of U.S. dollars
2011 2011
Due within one year
Due after one year through
five years
Due after five years through 10 years
Due after 10 years
Due within one year
Due after one year through
five years
Due after five years through 10 years
Due after 10 years
Cash and deposits . . . . . . ¥ 300,596 ¥ – ¥ – ¥– $ 3,615,105 $ – $ – $–Trade receivables . . . . . . 812,450 38,504 1,690 – 9,770,895 463,066 20,324 –Securities and investment securities
Other securitiesGovernment bonds . . . 0 9 – – 0 108 – –
Total . . . . . . . . . . . . . . . . ¥1,113,047 ¥38,513 ¥1,690 ¥– $13,386,013 $463,174 $20,324 $–
In millions of yen
2010
Due within one year
Due after one year through
five years
Due after five years through 10 years
Due after 10 years
Cash and deposits . . . . . . ¥ 273,453 ¥ – ¥ – ¥–Trade receivables . . . . . . 912,994 32,328 2,876 –Securities and investment securities
Other securitiesGovernment bonds . . . 0 9 – –Certificate of deposit . . . 7 – – –
Total . . . . . . . . . . . . . . . . ¥1,186,455 ¥32,337 ¥2,876 ¥–
a) Other securities with market value, which were included in securities (current assets) and investment securities (investments and advances) at March 31, 2011 and 2010, consisted of the following:
In millions of yen In thousands of U.S. dollars
2011 2011
Carrying amount Acquisition costUnrealized gain (loss) Carrying amount Acquisition cost
Unrealized gain (loss)
i) Carrying amounts over acquisition costs:Equity securities . . . . . . . . . ¥105,204 ¥ 51,883 ¥53,321 $1,265,231 $ 623,968 $ 641,262Others . . . . . . . . . . . . . . . . 2 1 0 24 12 0
Subtotal . . . . . . . . . . . . . ¥105,206 ¥ 51,884 ¥53,321 $1,265,255 $ 623,980 $ 641,262ii) Acquisition costs over
carrying amounts:Equity securities . . . . . . . . . ¥ 40,660 ¥ 49,457 ¥ (8,797) $ 488,995 $ 594,792 $(105,796)Government bonds . . . . . . 9 9 (0) 108 108 (0)Others . . . . . . . . . . . . . . . . 10 12 (1) 120 144 (12)
Subtotal . . . . . . . . . . . . . ¥ 40,680 ¥ 49,479 ¥ (8,799) $ 489,236 $ 595,057 $(105,820)Total (i+ii) . . . . . . . . . . . . . . . ¥145,887 ¥101,364 ¥44,522 $1,754,503 $1,219,049 $ 535,441
4. SECURITIES

ANNUAL REPORT 2011 63
In millions of yen
2010
Carrying amount Acquisition costUnrealized gain (loss)
i) Carrying amounts over acquisition costs:
Equity securities . . . . . . . . . ¥126,018 ¥57,520 ¥68,498
Government bonds . . . . . . 9 9 0Others . . . . . . . . . . . . . . . . 34 13 21
Subtotal . . . . . . . . . . . . . ¥126,063 ¥57,543 ¥68,520
ii) Acquisition costs over carrying amounts:
Equity securities . . . . . . . . . ¥ 39,115 ¥ 47,420 ¥ (8,305)Total (i+ii) . . . . . . . . . . . . . . . ¥165,179 ¥104,964 ¥60,214
Footnote: The Group treated as impaired those securities whose market values showed a substantial decline and were not judged to recover. The impairment loss amount is recorded as adjustment to the acquisition cost of those securities.
b) Sales amounts of other securities and related gains and losses for the years ended March 31, 2011 and 2010 were as follows:
In millions of yenIn thousands of
U.S. dollars
2011 2010 2011
Sales amounts . . . . . . . . . . . . . . . . . . . . . . . . . . . . . . . . . . . . . ¥3,242 ¥6,985 $38,989Gains . . . . . . . . . . . . . . . . . . . . . . . . . . . . . . . . . . . . . . . . . . . . 2,756 5,021 33,144Losses . . . . . . . . . . . . . . . . . . . . . . . . . . . . . . . . . . . . . . . . . . . (23) (13) (276)
c) Impaired securitiesThe breakdown of the securities impairment recognized in the years ended March 31, 2011 and 2010 was as follows:
In millions of yenIn thousands of
U.S. dollars
2011 2010 2011
Other securities with market value . . . . . . . . . . . . . . . . . . . . . . . ¥9,472 ¥1,343 $113,914Securities whose fair values are extremely difficult to determine . 47 65 565Total . . . . . . . . . . . . . . . . . . . . . . . . . . . . . . . . . . . . . . . . . . . . . ¥9,519 ¥1,409 $114,479
Securities with market value were judged as impaired when their market values had declined 50% or more from their book values at the end of respective fiscal years, or had declined between 30% and 50% from their book values at every quarter end (Q1–Q4) of respective fiscal years.
Impairment losses on securities whose fair values are extremely difficult to determine are recognized when the equity values are judged to have declined 50% or more from their book values due to financial difficulties of the issuers.
The Group uses derivatives for the purpose of reducing the risks mentioned below and does not enter into derivatives for speculative or trading purposes.
The derivative financial instruments which the Group utilizes are principally foreign currency forward and option contracts and interest rate swaps. The former is to hedge against the exchange rate risk on the receivables and payables denominated in foreign currencies and the latter is to fix the interest rate on certain long-term borrowings. See Note 1 o) for the information on hedge accounting.
The use of the derivatives is subject to the internal control policy; the objective of the derivatives transactions is limited to hedging against such risks as exchange rate risks and interest rate risks and their use is limited to the extent corresponding to actual business. Accordingly, the Group believes that market risks resulting from the change in exchange rates and interest rates are insignificant. The Group also believes that the risk of nonperformance by counterparties is insignificant because all the counterparties are banks with high credit ratings.
Summarized below are the notional amounts and the fair values of the derivative positions outstanding at March 31, 2011 and 2010.
5. DERIVATIVE FINANCIAL INSTRUMENTS

notes to consoliDateD Financial stateMents
MITSUBISHI HEAVY INDUSTRIES, LTD.64
1. Derivatives to which hedge accounting is not appliedForward foreign exchange contracts (*1)
In millions of yen In thousands of U.S. dollars
2011 2011
Notional amount (*2) Fair value
Unrealized gain (loss)
Notional amount (*2) Fair value
Unrealized gain (loss)
Sell:US$ . . . . . . . . . . . . . . . . . . ¥20,658 ¥20,603 ¥ 55 $248,442 $247,781 $ 661Euro . . . . . . . . . . . . . . . . . 17,113 17,471 (358) 205,808 210,114 (4,305)Others . . . . . . . . . . . . . . . . 3,578 3,749 (170) 43,030 45,087 (2,044)
Buy:US$ . . . . . . . . . . . . . . . . . . 2,468 2,563 95 29,681 30,823 1,142
Total . . . . . . . . . . . . . . . . . . . ¥38,882 ¥39,260 ¥(378) $467,612 $472,158 $(4,546)
In millions of yen
2010
Notional amount (*2) Fair value
Unrealized gain (loss)
Sell:US$ . . . . . . . . . . . . . . . . . . ¥18,395 ¥18,624 ¥ (229)Euro . . . . . . . . . . . . . . . . . 16,338 15,182 1,155Others . . . . . . . . . . . . . . . . 4,323 4,387 (63)
Buy:US$ . . . . . . . . . . . . . . . . . . 2,332 2,344 11Others . . . . . . . . . . . . . . . . 1,019 1,076 57
Total . . . . . . . . . . . . . . . . . . . ¥35,704 ¥34,774 ¥ 930
(*1) The fair values of exchange contracts are based on forward exchange rates.(*2) Notional amounts shown above are all due within one year.
2. Derivatives to which hedge accounting is applied(1) Forward foreign exchange contracts (to which deferral hedge accounting is applied)
In millions of yen In thousands of U.S. dollars
2011 2011Notional amount
Therein: portion due after one year Fair value
Notional amount
Therein: portion due after one year Fair value
Sell:(*1)
US$ . . . . . . . . . . . . . . . . . . ¥ 9,955 ¥ – ¥ 9,666 $ 119,723 $ – $ 116,247Euro . . . . . . . . . . . . . . . . . 13,288 – 13,718 159,807 – 164,978Others . . . . . . . . . . . . . . . . 3,396 – 3,399 40,841 – 40,877
Buy:(*2)
US$ . . . . . . . . . . . . . . . . . . 26,293 14 25,830 316,211 168 310,643Euro . . . . . . . . . . . . . . . . . 19,065 – 18,875 229,284 – 226,999Others . . . . . . . . . . . . . . . . 4,824 – 4,378 58,015 – 52,651
Total . . . . . . . . . . . . . . . . . . . ¥(23,542) ¥(14) ¥(22,299) $(283,126) $(168) $(268,177)
In millions of yen
2010
Notional amount
Therein: portion due after one year Fair value
Sell:(*1)
US$ . . . . . . . . . . . . . . . . . . ¥83,760 ¥– ¥84,425Euro . . . . . . . . . . . . . . . . . 13,661 – 13,055Others . . . . . . . . . . . . . . . . 4,407 – 4,369
Buy:(*2)
US$ . . . . . . . . . . . . . . . . . . 47,774 – 48,924Euro . . . . . . . . . . . . . . . . . 28,180 – 27,419Others . . . . . . . . . . . . . . . . 8,995 – 7,963
Total . . . . . . . . . . . . . . . . . . . ¥16,879 ¥– ¥17,543
(*1) The hedged items on these derivatives are principally trade receivables.(*2) The hedged items on these derivatives are principally trade payables.

ANNUAL REPORT 2011 65
(2) Forward foreign exchange contracts (to which the “assigning method for foreign currency receivables or payables” is applied)
In millions of yen In thousands of U.S. dollars
2011 2011
Notional amount
Therein: portion due
after one year Fair value Notional amount
Therein: portion due
after one year Fair value
Sell:(*1)
US$ . . . . . . . . . . . . . . . . . . ¥12,682 ¥– (*3) $152,519 $– (*3)Euro . . . . . . . . . . . . . . . . . 18,008 – (*3) 216,572 – (*3)
Buy:(*2)
US$ . . . . . . . . . . . . . . . . . . 2,847 – (*3) 34,239 – (*3)Euro . . . . . . . . . . . . . . . . . 3,891 – (*3) 46,794 – (*3)Others . . . . . . . . . . . . . . . . 785 – (*3) 9,440 – (*3)
Total . . . . . . . . . . . . . . . . . . . ¥23,166 ¥– $278,604 $–
In millions of yen
2010
Notional amount
Therein: portion due
after one year Fair value
Sell:(*1)
US$ . . . . . . . . . . . . . . . . . . ¥46,810 ¥– (*3)Euro . . . . . . . . . . . . . . . . . 3,233 – (*3)Others . . . . . . . . . . . . . . . . 46 – (*3)
Buy:(*2)
US$ . . . . . . . . . . . . . . . . . . 3,516 – (*3)Euro . . . . . . . . . . . . . . . . . 1,323 – (*3)Others . . . . . . . . . . . . . . . . 66 – (*3)
Total . . . . . . . . . . . . . . . . . . . ¥45,184 ¥–
(*1) The hedged items on these derivatives are principally trade receivables.(*2) The hedged items on these derivatives are principally trade payables.(*3) Since the “assigning method for foreign currency receivables or payables” is applied, the above contracts are treated as part of the hedged trade
receivables/payables, thus their fair values are included in those of the trade receivables/payables, which are shown in Note 3.
(3) Interest rate swaps (to which the “exceptional method for interest-rate swaps” is applied) (*1)
In millions of yen In thousands of U.S. dollars
2011 2011
Type of transactions Notional amount
Therein: portion due
after one year Fair value Notional amount
Therein: portion due
after one year Fair value
Fixed payment / variable receipt . . . . . . . . . . ¥342,139 ¥251,001 (*2) $4,114,720 $3,018,653 (*2)
In millions of yen
2010
Notional amount
Therein: portion due
after one year Fair value
Fixed payment / variable receipt . . . . . . . . . . ¥361,770 ¥342,139 (*2)
(*1) The hedged items on these derivatives are principally long-term borrowings.(*2) Since the “exceptional method for interest-rate swaps” is applied, the above interest rate swaps are treated as part of the hedged long-term borrowings,
thus their fair values are included in those of the long-term borrowings, which are shown in Note 3.
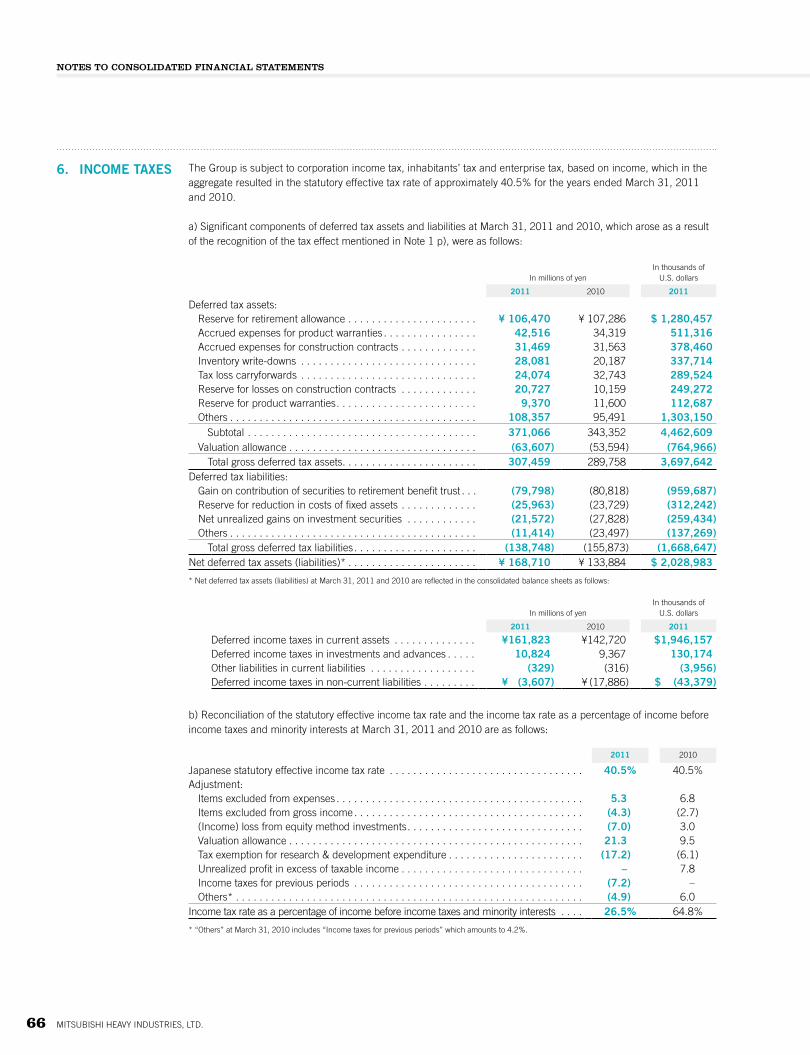
notes to consoliDateD Financial stateMents
MITSUBISHI HEAVY INDUSTRIES, LTD.66
The Group is subject to corporation income tax, inhabitants’ tax and enterprise tax, based on income, which in the aggregate resulted in the statutory effective tax rate of approximately 40.5% for the years ended March 31, 2011 and 2010.
a) Significant components of deferred tax assets and liabilities at March 31, 2011 and 2010, which arose as a resultof the recognition of the tax effect mentioned in Note 1 p), were as follows:
In millions of yenIn thousands of
U.S. dollars
2011 2010 2011
Deferred tax assets:Reserve for retirement allowance . . . . . . . . . . . . . . . . . . . . . . ¥ 106,470 ¥ 107,286 $ 1,280,457Accrued expenses for product warranties . . . . . . . . . . . . . . . . 42,516 34,319 511,316Accrued expenses for construction contracts . . . . . . . . . . . . . 31,469 31,563 378,460Inventory write-downs . . . . . . . . . . . . . . . . . . . . . . . . . . . . . . 28,081 20,187 337,714Tax loss carryforwards . . . . . . . . . . . . . . . . . . . . . . . . . . . . . . 24,074 32,743 289,524Reserve for losses on construction contracts . . . . . . . . . . . . . 20,727 10,159 249,272Reserve for product warranties . . . . . . . . . . . . . . . . . . . . . . . . 9,370 11,600 112,687Others . . . . . . . . . . . . . . . . . . . . . . . . . . . . . . . . . . . . . . . . . . 108,357 95,491 1,303,150
Subtotal . . . . . . . . . . . . . . . . . . . . . . . . . . . . . . . . . . . . . . . 371,066 343,352 4,462,609Valuation allowance . . . . . . . . . . . . . . . . . . . . . . . . . . . . . . . . (63,607) (53,594) (764,966)
Total gross deferred tax assets. . . . . . . . . . . . . . . . . . . . . . . 307,459 289,758 3,697,642Deferred tax liabilities:
Gain on contribution of securities to retirement benefit trust . . . (79,798) (80,818) (959,687)Reserve for reduction in costs of fixed assets . . . . . . . . . . . . . (25,963) (23,729) (312,242)Net unrealized gains on investment securities . . . . . . . . . . . . (21,572) (27,828) (259,434)Others . . . . . . . . . . . . . . . . . . . . . . . . . . . . . . . . . . . . . . . . . . (11,414) (23,497) (137,269)
Total gross deferred tax liabilities . . . . . . . . . . . . . . . . . . . . . (138,748) (155,873) (1,668,647)Net deferred tax assets (liabilities)* . . . . . . . . . . . . . . . . . . . . . . ¥ 168,710 ¥ 133,884 $ 2,028,983
* Net deferred tax assets (liabilities) at March 31, 2011 and 2010 are reflected in the consolidated balance sheets as follows:
In millions of yenIn thousands of
U.S. dollars
2011 2010 2011
Deferred income taxes in current assets . . . . . . . . . . . . . . ¥161,823 ¥142,720 $1,946,157Deferred income taxes in investments and advances . . . . . 10,824 9,367 130,174Other liabilities in current liabilities . . . . . . . . . . . . . . . . . . (329) (316) (3,956)Deferred income taxes in non-current liabilities . . . . . . . . . ¥ (3,607) ¥ (17,886) $ (43,379)
b) Reconciliation of the statutory effective income tax rate and the income tax rate as a percentage of income before income taxes and minority interests at March 31, 2011 and 2010 are as follows:
2011 2010
Japanese statutory effective income tax rate . . . . . . . . . . . . . . . . . . . . . . . . . . . . . . . . . 40.5% 40.5%Adjustment:
Items excluded from expenses . . . . . . . . . . . . . . . . . . . . . . . . . . . . . . . . . . . . . . . . . . 5.3 6.8Items excluded from gross income . . . . . . . . . . . . . . . . . . . . . . . . . . . . . . . . . . . . . . . (4.3) (2.7)(Income) loss from equity method investments . . . . . . . . . . . . . . . . . . . . . . . . . . . . . . (7.0) 3.0Valuation allowance . . . . . . . . . . . . . . . . . . . . . . . . . . . . . . . . . . . . . . . . . . . . . . . . . . 21.3 9.5Tax exemption for research & development expenditure . . . . . . . . . . . . . . . . . . . . . . . (17.2) (6.1)Unrealized profit in excess of taxable income . . . . . . . . . . . . . . . . . . . . . . . . . . . . . . . – 7.8Income taxes for previous periods . . . . . . . . . . . . . . . . . . . . . . . . . . . . . . . . . . . . . . . (7.2) –Others* . . . . . . . . . . . . . . . . . . . . . . . . . . . . . . . . . . . . . . . . . . . . . . . . . . . . . . . . . . . (4.9) 6.0
Income tax rate as a percentage of income before income taxes and minority interests . . . . 26.5% 64.8%
* “Others” at March 31, 2010 includes “Income taxes for previous periods” which amounts to 4.2%.
6. INCOME TAXES
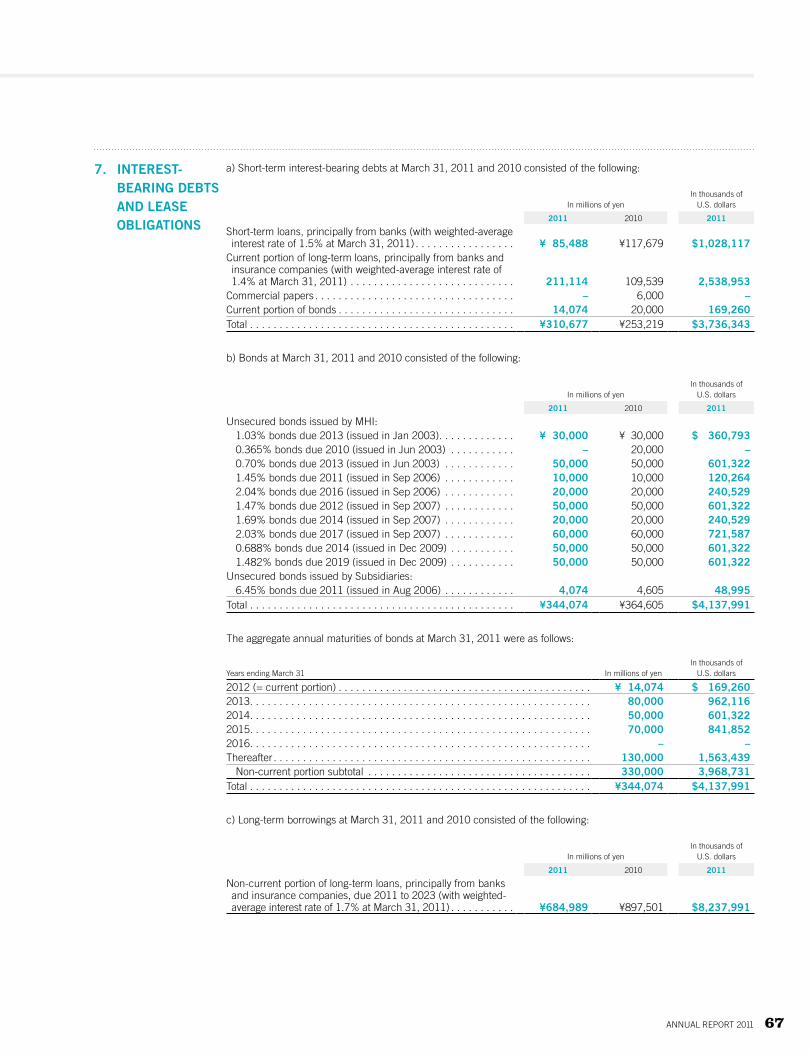
ANNUAL REPORT 2011 67
7. INTEREST- BEARING DEBTS AND LEASE OBLIGATIONS
a) Short-term interest-bearing debts at March 31, 2011 and 2010 consisted of the following:
In millions of yenIn thousands of
U.S. dollars
2011 2010 2011
Short-term loans, principally from banks (with weighted-average interest rate of 1.5% at March 31, 2011) . . . . . . . . . . . . . . . . . ¥ 85,488 ¥117,679 $1,028,117Current portion of long-term loans, principally from banks and insurance companies (with weighted-average interest rate of 1.4% at March 31, 2011) . . . . . . . . . . . . . . . . . . . . . . . . . . . . 211,114 109,539 2,538,953
Commercial papers . . . . . . . . . . . . . . . . . . . . . . . . . . . . . . . . . . – 6,000 –Current portion of bonds . . . . . . . . . . . . . . . . . . . . . . . . . . . . . . 14,074 20,000 169,260Total . . . . . . . . . . . . . . . . . . . . . . . . . . . . . . . . . . . . . . . . . . . . . ¥310,677 ¥253,219 $3,736,343
b) Bonds at March 31, 2011 and 2010 consisted of the following:
In millions of yenIn thousands of
U.S. dollars
2011 2010 2011
Unsecured bonds issued by MHI:1.03% bonds due 2013 (issued in Jan 2003) . . . . . . . . . . . . . ¥ 30,000 ¥ 30,000 $ 360,7930.365% bonds due 2010 (issued in Jun 2003) . . . . . . . . . . . – 20,000 –0.70% bonds due 2013 (issued in Jun 2003) . . . . . . . . . . . . 50,000 50,000 601,3221.45% bonds due 2011 (issued in Sep 2006) . . . . . . . . . . . . 10,000 10,000 120,2642.04% bonds due 2016 (issued in Sep 2006) . . . . . . . . . . . . 20,000 20,000 240,5291.47% bonds due 2012 (issued in Sep 2007) . . . . . . . . . . . . 50,000 50,000 601,3221.69% bonds due 2014 (issued in Sep 2007) . . . . . . . . . . . . 20,000 20,000 240,5292.03% bonds due 2017 (issued in Sep 2007) . . . . . . . . . . . . 60,000 60,000 721,5870.688% bonds due 2014 (issued in Dec 2009) . . . . . . . . . . . 50,000 50,000 601,3221.482% bonds due 2019 (issued in Dec 2009) . . . . . . . . . . . 50,000 50,000 601,322
Unsecured bonds issued by Subsidiaries:6.45% bonds due 2011 (issued in Aug 2006) . . . . . . . . . . . . 4,074 4,605 48,995
Total . . . . . . . . . . . . . . . . . . . . . . . . . . . . . . . . . . . . . . . . . . . . . ¥344,074 ¥364,605 $4,137,991
The aggregate annual maturities of bonds at March 31, 2011 were as follows:
Years ending March 31 In millions of yenIn thousands of
U.S. dollars
2012 (= current portion) . . . . . . . . . . . . . . . . . . . . . . . . . . . . . . . . . . . . . . . . . . . ¥ 14,074 $ 169,2602013. . . . . . . . . . . . . . . . . . . . . . . . . . . . . . . . . . . . . . . . . . . . . . . . . . . . . . . . . . 80,000 962,1162014. . . . . . . . . . . . . . . . . . . . . . . . . . . . . . . . . . . . . . . . . . . . . . . . . . . . . . . . . . 50,000 601,3222015. . . . . . . . . . . . . . . . . . . . . . . . . . . . . . . . . . . . . . . . . . . . . . . . . . . . . . . . . . 70,000 841,8522016. . . . . . . . . . . . . . . . . . . . . . . . . . . . . . . . . . . . . . . . . . . . . . . . . . . . . . . . . . – –Thereafter . . . . . . . . . . . . . . . . . . . . . . . . . . . . . . . . . . . . . . . . . . . . . . . . . . . . . . 130,000 1,563,439
Non-current portion subtotal . . . . . . . . . . . . . . . . . . . . . . . . . . . . . . . . . . . . . . 330,000 3,968,731Total . . . . . . . . . . . . . . . . . . . . . . . . . . . . . . . . . . . . . . . . . . . . . . . . . . . . . . . . . . ¥344,074 $4,137,991
c) Long-term borrowings at March 31, 2011 and 2010 consisted of the following:
In millions of yenIn thousands of
U.S. dollars
2011 2010 2011
Non-current portion of long-term loans, principally from banks and insurance companies, due 2011 to 2023 (with weighted-average interest rate of 1.7% at March 31, 2011) . . . . . . . . . . . ¥684,989 ¥897,501 $8,237,991

notes to consoliDateD Financial stateMents
MITSUBISHI HEAVY INDUSTRIES, LTD.68
8. PLEDGED ASSETS AND RELATED LIABILITIES
9. CONTINGENT LIABILITIES
The aggregate annual maturities of long-term borrowings at March 31, 2011 were as follows:
Years ending March 31 In millions of yenIn thousands of
U.S. dollars
2012 (= current portion) . . . . . . . . . . . . . . . . . . . . . . . . . . . . . . . . . . . . . . . . . . . ¥211,114 $ 2,538,9532013. . . . . . . . . . . . . . . . . . . . . . . . . . . . . . . . . . . . . . . . . . . . . . . . . . . . . . . . . . 129,584 1,558,4362014. . . . . . . . . . . . . . . . . . . . . . . . . . . . . . . . . . . . . . . . . . . . . . . . . . . . . . . . . . 150,047 1,804,5332015. . . . . . . . . . . . . . . . . . . . . . . . . . . . . . . . . . . . . . . . . . . . . . . . . . . . . . . . . . 181,083 2,177,7872016. . . . . . . . . . . . . . . . . . . . . . . . . . . . . . . . . . . . . . . . . . . . . . . . . . . . . . . . . . 49,701 597,726Thereafter . . . . . . . . . . . . . . . . . . . . . . . . . . . . . . . . . . . . . . . . . . . . . . . . . . . . . . 174,572 2,099,482
Non-current portion subtotal . . . . . . . . . . . . . . . . . . . . . . . . . . . . . . . . . . . . . . 684,989 8,237,991Total . . . . . . . . . . . . . . . . . . . . . . . . . . . . . . . . . . . . . . . . . . . . . . . . . . . . . . . . . . ¥896,104 $10,776,957
d) The aggregate annual maturities of lease obligations at March 31, 2011 were as follows:
Years ending March 31 In millions of yenIn thousands of
U.S. dollars
2012 (= current portion) . . . . . . . . . . . . . . . . . . . . . . . . . . . . . . . . . . . . . . . . . . . ¥ 2,233 $ 26,8552013. . . . . . . . . . . . . . . . . . . . . . . . . . . . . . . . . . . . . . . . . . . . . . . . . . . . . . . . . . 2,118 25,4722014. . . . . . . . . . . . . . . . . . . . . . . . . . . . . . . . . . . . . . . . . . . . . . . . . . . . . . . . . . 1,701 20,4572015. . . . . . . . . . . . . . . . . . . . . . . . . . . . . . . . . . . . . . . . . . . . . . . . . . . . . . . . . . 920 11,0642016. . . . . . . . . . . . . . . . . . . . . . . . . . . . . . . . . . . . . . . . . . . . . . . . . . . . . . . . . . 572 6,879Thereafter . . . . . . . . . . . . . . . . . . . . . . . . . . . . . . . . . . . . . . . . . . . . . . . . . . . . . . 4,618 55,538
Non-current portion subtotal . . . . . . . . . . . . . . . . . . . . . . . . . . . . . . . . . . . . . . 9,931 119,434Total . . . . . . . . . . . . . . . . . . . . . . . . . . . . . . . . . . . . . . . . . . . . . . . . . . . . . . . . . . ¥12,164 $146,289
In millions of yenIn thousands of
U.S. dollars
Assets pledged as collateral 2011 2010 2011
Property, plant and equipment . . . . . . . . . . . . . . . . . . . . . . . . . ¥14,925 ¥15,404 $179,494Trade receivables . . . . . . . . . . . . . . . . . . . . . . . . . . . . . . . . . . . 1,263 1,183 15,189Others . . . . . . . . . . . . . . . . . . . . . . . . . . . . . . . . . . . . . . . . . . . . 386 306 4,642Total . . . . . . . . . . . . . . . . . . . . . . . . . . . . . . . . . . . . . . . . . . . . . ¥16,574 ¥16,894 $199,326
In millions of yenIn thousands of
U.S. dollars
Liabilities related to the assets pledged as collateral 2011 2010 2011
Short-term borrowings . . . . . . . . . . . . . . . . . . . . . . . . . . . . . . . . ¥10,276 ¥10,101 $123,583Long-term borrowings . . . . . . . . . . . . . . . . . . . . . . . . . . . . . . . . 7,123 8,090 85,664Total . . . . . . . . . . . . . . . . . . . . . . . . . . . . . . . . . . . . . . . . . . . . . ¥17,400 ¥18,191 $209,260
In millions of yenIn thousands of
U.S. dollars
Contingent liabilities 2011 2010 2011
Guarantee obligations on such debts as borrowings from financial institutions by companies outside the MHI Group . . . . ¥72,543 ¥89,214 $872,435

ANNUAL REPORT 2011 69
10. RETIREMENT BENEFITS
The Group has several non-contributory defined benefit pension plans and severance indemnity plans, and there are occasions where employees receive special lump-sum payments at retirement. Contributions to the plans are funded in accordance with the applicable laws and regulations. See Note 1 l) for accounting polices and related information.
a) Benefit obligations and related information at March 31, 2011 and 2010 were as follows:
In millions of yenIn thousands of
U.S. dollars
2011 2010 2011
①Retirement benefit obligations . . . . . . . . . . . . . . . . . . . . . . . . ¥(629,674) ¥(662,323) $(7,572,748)②Fair value of plan assets . . . . . . . . . . . . . . . . . . . . . . . . . . . . . 527,925 586,920 6,349,067③Unfunded benefit obligations (① + ②). . . . . . . . . . . . . . . . . . . (101,748) (75,402) (1,223,668)④Unrecognized actuarial losses (gains) . . . . . . . . . . . . . . . . . . . 147,425 120,101 1,773,000⑤Unrecognized prior service costs (credits) . . . . . . . . . . . . . . . . (136) (368) (1,635)⑥ Net benefit liability recognized on the consolidated
balance sheets (③ + ④ + ⑤) . . . . . . . . . . . . . . . . . . . . . . . . . 45,539 44,330 547,672⑦Prepaid pension expenses . . . . . . . . . . . . . . . . . . . . . . . . . . . 95,382 92,873 1,147,107⑧Reserve for retirement allowance (⑥ – ⑦) . . . . . . . . . . . . . . . . ¥ (49,842) ¥ (48,542) $ (599,422)
b) The components of net periodic retirement benefit expenses for the years ended March 31, 2011 and 2010consisted of the following:
In millions of yenIn thousands of
U.S. dollars
2011 2010 2011
Service cost . . . . . . . . . . . . . . . . . . . . . . . . . . . . . . . . . . . . . . . ¥ 28,783 ¥ 28,347 $ 346,157Interest cost . . . . . . . . . . . . . . . . . . . . . . . . . . . . . . . . . . . . . . . 13,026 13,538 156,656Expected return on plan assets . . . . . . . . . . . . . . . . . . . . . . . . . (13,884) (10,639) (166,975)Amortization of actuarial losses (gains) . . . . . . . . . . . . . . . . . . . 18,959 26,152 228,009Amortization of prior service costs (credits) . . . . . . . . . . . . . . . . (195) (5,052)* (2,345)Retirement benefit expenses . . . . . . . . . . . . . . . . . . . . . . . . . . . ¥ 46,689 ¥ 52,346 $ 561,503
* Amortization of prior service costs (credits) for the year ended March 31, 2010 included the credits caused by the reduction in the additional interest rate on the retirement annuities, which were credited as incurred.
c) The principal assumptions used in determining the information above at March 31, 2011 and 2010 were as follows:
2011 2010
Discount rate . . . . . . . . . . . . . . . . . . . . . . . . . . . . . . . . . . . . . . 2.0% 2.0%Expected rate of return on plan assets . . . . . . . . . . . . . . . . . . . . 3.5% 3.5%
Amortization period for prior service costs . . . . . . . . . . . . . . . . . Expensed as incurred
or 9 to 15 yearsExpensed as incurred
or 9 to 11 years Amortization period for actuarial gains and losses . . . . . . . . . . . 9 to 19 years 10 to 19 years

notes to consoliDateD Financial stateMents
MITSUBISHI HEAVY INDUSTRIES, LTD.70
12. BUSINESS STRUCTURE IMPROVEMENT EXPENSES
13. LOSS ON DISASTER
In millions of yenIn thousands of
U.S. dollars
2011 2010 2011
Land . . . . . . . . . . . . . . . . . . . . . . . . . . . . . . . . . . . . . . . . . . . . . ¥10,946 ¥10,148 $131,641Others . . . . . . . . . . . . . . . . . . . . . . . . . . . . . . . . . . . . . . . . . . . . (76) (62) (914)Total . . . . . . . . . . . . . . . . . . . . . . . . . . . . . . . . . . . . . . . . . . . . . ¥10,870 ¥10,086 $130,727
Business structure improvement expenses for the year ended March 31, 2011 consisted of business reorganization expenses relating mainly to Power Systems business and Machinery & Steel Structures business.
Business structure improvement expenses for the year ended March 31, 2010 consisted of the following expenses relating mainly to Mass & Medium-Lot Manufactured Machinery business and Power Systems business.
In millions of yen
2010
Business reorganization expenses . . . . . . . . . . . . . . . . . . . . . . . . . . . . . . . . . . . . ¥ 9,411Business withdrawal expenses . . . . . . . . . . . . . . . . . . . . . . . . . . . . . . . . . . . . . . 6,561Total . . . . . . . . . . . . . . . . . . . . . . . . . . . . . . . . . . . . . . . . . . . . . . . . . . . . . . . . . . ¥15,972
Loss on disaster for the year ended March 31, 2011 arose from the Great East Japan Earthquake. It consisted of the following items.
In millions of yenIn thousands of
U.S. dollars
2011 2011
Expenses on restoration or disposal of damaged assets . . . . . . . . . . . . . . . . . . . . ¥ 9,981 $120,036Abnormal idle time cost . . . . . . . . . . . . . . . . . . . . . . . . . . . . . . . . . . . . . . . . . . . . 259 3,114Total . . . . . . . . . . . . . . . . . . . . . . . . . . . . . . . . . . . . . . . . . . . . . . . . . . . . . . . . . . ¥10,240 $123,150
11. GAIN ON SALES OF FIXED ASSETS

ANNUAL REPORT 2011 71
14. LOSS ON IMPAIRMENT OF FIXED ASSETS
The following is a description of the loss on impairment of fixed assets recognized in the year ended March 31, 2011.
a) Description of the impaired asset groupThe impaired asset group consisted mainly of construction in progress, machinery and transportation equipment for operating purpose which were located in Nagasaki, Hiroshima, etc.
b) Method of asset groupingThe principal unit of asset grouping is works. Basically, assets for rental purpose, idle assets and assets to be disposed of due to termination or transfer of some operation are each treated as separate asset groups.
c) Reason to recognize the impairmentBecause some assets are going out of use in relation to transfer of some operation, their book values were written down to recoverable amounts.
d) Calculation method of recoverable amountsRecoverable amounts are measured either by fair value less costs to sell or the value in use. The value in use is computed by discounting the future cash flows to be derived from the assets to present value with the rate of 3.5%.
e) Impairment loss amount and the breakdown
Breakdown by the income statement accounts In millions of yenIn thousands of
U.S. dollars
“Business structure improvement expenses” under extraordinary loss . . . . . . . . . ¥16,203 $194,864“Other expenses” under non-operating expenses . . . . . . . . . . . . . . . . . . . . . . . . 1,438 17,294Total . . . . . . . . . . . . . . . . . . . . . . . . . . . . . . . . . . . . . . . . . . . . . . . . . . . . . . . . . . ¥17,641 $212,158
Breakdown by the category of the fixed assets In millions of yenIn thousands of
U.S. dollars
Construction in progress . . . . . . . . . . . . . . . . . . . . . . . . . . . . . . . . . . . . . . . . . . . ¥12,653 $152,170Machinery and transportation equipment, etc . . . . . . . . . . . . . . . . . . . . . . . . . . . 4,987 59,975Total . . . . . . . . . . . . . . . . . . . . . . . . . . . . . . . . . . . . . . . . . . . . . . . . . . . . . . . . . . ¥17,641 $212,158
Comprehensive income (loss) for the year ended March 31, 2010 was as follows:
In millions of yen
2010
Comprehensive income (loss) attributable to shareholders of the parent . . . . . . . . ¥52,320Comprehensive income (loss) attributable to minority interests . . . . . . . . . . . . . . . (4,148)Total . . . . . . . . . . . . . . . . . . . . . . . . . . . . . . . . . . . . . . . . . . . . . . . . . . . . . . . . . . ¥48,172
Other comprehensive income (loss) for the year ended March 31, 2010:Net unrealized gains (losses) on investment securities . . . . . . . . . . . . . . . . . . . ¥17,583Deferred gains (losses) on hedges . . . . . . . . . . . . . . . . . . . . . . . . . . . . . . . . . . (778)Foreign currency translation adjustments . . . . . . . . . . . . . . . . . . . . . . . . . . . . . 6,960Share of other comprehensive income (loss) of entities accounted for using the equity method . . . . . . . . . . . . . . . . . . . . . . . . . . . . . . . . . . . . . . . . . 1,747Changes in equity interest mainly due to reorganization . . . . . . . . . . . . . . . . . . 12,747
Total . . . . . . . . . . . . . . . . . . . . . . . . . . . . . . . . . . . . . . . . . . . . . . . . . . . . . . . . . . ¥38,261
15. CONSOLIDATED STATEMENT OF COMPREHENSIVE INCOME

notes to consoliDateD Financial stateMents
MITSUBISHI HEAVY INDUSTRIES, LTD.72
a) Retained earningsThe Corporate Law of Japan provides that an amount equal to 10% of the amount of the dividends of surplus shall be recorded as legal reserves (i.e. capital reserves or retained earnings reserves) unless the legal reserves balance is equal to or exceeds 25% of stated capital. The distribution of the dividends can be made at any time by resolution of the shareholders, or of the Board of Directors if certain conditions are met.
b) Total number of shares issued and treasury stock at March 31, 2011 and 2010 are as follows:
Type of shares At March 31, 2010
Increase by March 31,
2011
Decrease by March 31,
2011 At March 31, 2011
Total number of shares issued . . . . . . Common
stock 3,373,647,813 – – 3,373,647,813
Treasury stock . . . . . . . . . . . . . . . . . . Common
stock 17,414,651 1,210,015 42,408 18,582,258
(1) Reason for increase of treasury stockRepurchasing of shares held by lost shareholders (under Article 197, Paragraphs 3 and 4 of the Corporate Law of Japan) . . . . . . . . . . . . . . . . . . . . 1,144,637Repurchasing of shares that were less than the minimum trading unit . . . . . . . . . . . . . . . . . . . . . . 65,378Total . . . . . . . . . . . . . . . . . . . . . . . . . . . . . . . . . . . . . . . . . . . . . . . . . . . . . . . . . . . . . . . . . . . . . . . 1,210,015
(2) Reason for decrease of treasury stockDisposal resulting from the exercise of share subscription rights, which were issued for the purpose of providing stock options . . . . . . . . . . . . . . . . . . . . . . . . . . . . . . . . . . . . . . . . . . . . . . . . 31,000Disposal resulting from purchase request from shareholders who have some shares that were less than the minimum trading unit . . . . . . . . . . . . . . . . . . . . . . . . . . . . . . . . . . . . . . . . . . . . . . . 11,408Total . . . . . . . . . . . . . . . . . . . . . . . . . . . . . . . . . . . . . . . . . . . . . . . . . . . . . . . . . . . . . . . . . . . . . . . 42,408
c) Cash dividends(1) Cash dividends paid
Cash dividends per share Total cash dividends paid
ResolutionType of shares Record date Effective date In yen
In U.S. dollars
In millions of yen
In thousands of U.S. dollars
June 24, 2010
Ordinary General Meeting of Shareholders . . .
Common stock
March 31, 2010
June 25, 2010 ¥2 $0.0241 ¥ 6,712 $ 80,721
October 29, 2010Board of Directors . . . . . . . .
Common stock
September 30, 2010
December 3, 2010 ¥2 $0.0241 ¥ 6,712 $ 80,721
Total . . . . . . . . . . . . . . . . . . . . . . . . . . . . . . . . . . . . . . . . . . . . . . . . . . . . . . . . . . . . . . . . ¥13,425 $161,455
(2) Dividends of which record date is within this fiscal year but the effective date is within next fiscal year
Cash dividends per share Total cash dividends paid
ResolutionType of shares Record date Effective date In yen
In U.S. dollars
In millions of yen
In thousands of U.S. dollars
June 23, 2011
Ordinary General Meeting of Shareholders . . .
Common stock
March 31, 2011
June 24, 2011 ¥2 $0.0241 ¥ 6,710 $ 80,697
16. CONSOLIDATED STATEMENTS OF CHANGES IN NET ASSETS

ANNUAL REPORT 2011 73
17. SHARE-BASED COMPENSATION PLANS
MHI has the following share-based compensation plans for the directors and corporate executive officers.The share-based compensation expenses, which amount to 324 million yen ($3,896 thousand) in the year
ended March 31, 2011 and 326 million yen in the year ended March 31, 2010, are included in selling, general and administrative expenses.
a) Conditions for issue of stock options
Stock options (1st grant)
Stock options (2nd grant)
Stock options (3rd grant)
Stock options (4th grant)
Stock options (5th grant)
Stock options (6th grant)
Stock options (7th grant)
Stock options (8th grant)
Stock options (9th grant)
Grantee (Number of individuals) . . .
Directors (29)
Directors (27)
Directors & Executive
officers (26)
Directors & Executive
officers (25)
Directors & Executive
officers (30)
Directors & Executive
officers (33)Executive officers (2)
Directors & Executive
officers (33)
Directors & Executive
officers (35)
Number of shares . . . . . . 535,000 500,000 502,000 663,000 400,000 806,000 46,000 1,109,000 1,259,000Type of share . . . . . . . . . . Common stock Common stock Common stock Common stock Common stock Common stock Common stock Common stock Common stock
Grant date . . . . . . . . . . . . . August 11, 2003 August 11, 2004 August 11, 2005 August 17, 2006 August 16, 2007 August 18, 2008 February 20, 2009 August 17, 2009 August 17, 2010
Exercise period (from) . . . . June 27, 2005 June 26, 2006 June 29, 2007 August 18, 2006 August 17, 2007 August 19, 2008 February 21, 2009 August 18, 2009 August 18, 2010
(to) . . . . . . June 26, 2009 June 25, 2010 June 28, 2011 June 28, 2036 August 16, 2037 August 18, 2038 February 20, 2039 August 17, 2039 August 17, 2040
b) Activities of stock options in the years ended March 31, 2011 and 2010
Number of shares
Stock options (1st grant)
Stock options (2nd grant)
Stock options (3rd grant)
Stock options (4th grant)
Stock options (5th grant)
Stock options (6th grant)
Stock options (7th grant)
Stock options (8th grant)
Stock options (9th grant)
Unexercised at March 31, 2009 . . . . 1,000 21,000 148,000 580,000 366,000 806,000 46,000 – –Granted . . . . . . . . . . . . . . . . . . . – – – – – – – 1,109,000 –Vested . . . . . . . . . . . . . . . . . . . . – – – – – – – 1,109,000 –Exercised . . . . . . . . . . . . . . . . . . – 21,000 55,000 18,000 10,000 18,000 – – –Expired . . . . . . . . . . . . . . . . . . . 1,000 – – – – – – – –
Unexercised at March 31, 2010 . . . . – – 93,000 562,000 356,000 788,000 46,000 1,109,000 –Granted . . . . . . . . . . . . . . . . . . . – – – – – – – – 1,259,000Vested . . . . . . . . . . . . . . . . . . . . – – – – – – – – 1,259,000Exercised . . . . . . . . . . . . . . . . . . – – 31,000 – – – – – –Expired . . . . . . . . . . . . . . . . . . . – – – – – – – – –
Unexercised at March 31, 2011 . . . . – – 62,000 562,000 356,000 788,000 46,000 1,109,000 1,259,000
c) Price per share
In yen
Stock options (1st grant)
Stock options (2nd grant)
Stock options (3rd grant)
Stock options (4th grant)
Stock options (5th grant)
Stock options (6th grant)
Stock options (7th grant)
Stock options (8th grant)
Stock options (9th grant)
Weighted-average exercise price . . . . ¥315 ¥289 ¥294 ¥ 1 ¥ 1 ¥ 1 ¥ 1 ¥ 1 ¥ 1W eighted-average market share
price when the share subscription rights were exercised in the year ended March 31, 2010 . . . . . . . . – 354 352 350 350 350 – – –
W eighted-average market share price when the share subscription rights were exercised in the year ended March 31, 2011 . . . . . . . . – – 307 – – – – – –
Grant date fair value . . . . . . . . . . . . – – – 443 644 471 194 294 258
In U.S. dollars
Stock options (1st grant)
Stock options (2nd grant)
Stock options (3rd grant)
Stock options (4th grant)
Stock options (5th grant)
Stock options (6th grant)
Stock options (7th grant)
Stock options (8th grant)
Stock options (9th grant)
Weighted-average exercise price $3.79 $3.48 $3.54 $0.01 $0.01 $0.01 $0.01 $0.01 $0.01W eighted-average market share
price when the share subscription rights were exercised in the year ended March 31, 2011 . . . . . . . . – – 3.69 – – – – – –
Grant date fair value . . . . . . . . . . . . – – – 5.33 7.75 5.66 2.33 3.54 3.10

notes to consoliDateD Financial stateMents
MITSUBISHI HEAVY INDUSTRIES, LTD.74
d) Estimate method of fair value of stock optionsThe fair value of stock options granted in the years ended March 31, 2011 and 2010 (8th and 9th grant) were estimated using the Black-Scholes option-pricing model with the following assumptions.
Stock options (8th grant) Stock options (9th grant)
Expected volatility *1 36.888% 36.990%Expected life of option *2 15 years 15 years
Expected dividends *3¥6
per share¥4 ($0.048)
per shareRisk-free interest rate *4 1.834% 1.363%
(*1) Estimated based on the actual share prices of 15 years shown below. Stock options (8th grant): August 17, 1994–August 17, 2009 Stock options (9th grant): August 17, 1995–August 17, 2010(*2) Calculated on the assumption that the share subscription rights would be excised at the middle point of the exercise period.(*3) Actual cash dividends for the following periods. Stock options (8th grant): full year ended March 31, 2009 Stock options (9th grant): full year ended March 31, 2010(*4) Yield of Japanese government bonds with the same years to maturity as the above expected life of option.
e) Estimate method of the number of vested share subscription rightsAll of the share subscription rights were vested when granted.
“Cash and cash equivalents at end of year” in the statements of cash flows for the years ended March 31, 2011 and 2010 consisted of the following:
In millions of yenIn thousands of
U.S. dollars
2011 2010 2011
Cash and deposits . . . . . . . . . . . . . . . . . . . . . . . . . . . . . . . . . . . ¥301,047 ¥274,061 $3,620,529Time deposits with maturities over three months . . . . . . . . . . . . (12,178) (12,687) (146,458)Total . . . . . . . . . . . . . . . . . . . . . . . . . . . . . . . . . . . . . . . . . . . . . ¥288,868 ¥261,373 $3,474,058
In millions of yenIn thousands of
U.S. dollars
2011 2010 2011
Research and development expenses . . . . . . . . . . . . . . . . . . . . ¥123,293 129,262 $1,482,778
18. CASH AND CASH EQUIVALENTS
19. RESEARCH AND DEVELOPMENT EXPENSES

ANNUAL REPORT 2011 75
22. SIGNIFICANT AFFILIATES
In millions of yenIn thousands of
U.S. dollars
2011 2010 2011
Accumulated depreciation of property, plant and equipment . . . ¥1,720,375 ¥1,673,488 $20,690,018
When the Group disposes of certain assets belonging to nuclear energy business, those assets are required to be treated with a special care as radioactive wastes. In principle, the Group recognizes asset retirement obligations on those assets. With regard to some of those assets, however, the Group does not recognize asset retirement obligations because estimation of necessary costs to dispose of them is not available due to the fact that the technology necessary to dismantle or dispose of them and the legislation on how they should be disposed of have been developed only partially. Those assets include the facilities conducting research and development concerning the safeness of constituting material of reactors, nuclear fuel and so on.
Disclosure of condensed consolidated financial statements of significant affiliates under statutory criteria is required. Caterpillar Japan Ltd. was a significant affiliate in the year ended March 31, 2011.
In millions of yenIn thousands of
U.S. dollars
Caterpillar Japan Ltd. 2011 2011
Total current assets . . . . . . . . . . . . . . . . . . . . . . . . . . . . . . . . . . . . . . . . . . . . . . . ¥139,567 $1,678,496Total non-current assets . . . . . . . . . . . . . . . . . . . . . . . . . . . . . . . . . . . . . . . . . . . 88,004 1,058,376
Total current liabilities . . . . . . . . . . . . . . . . . . . . . . . . . . . . . . . . . . . . . . . . . . . . . 129,583 1,558,424Total non-current liabilities. . . . . . . . . . . . . . . . . . . . . . . . . . . . . . . . . . . . . . . . . . 16,860 202,766
Total net assets . . . . . . . . . . . . . . . . . . . . . . . . . . . . . . . . . . . . . . . . . . . . . . . . . . 81,127 975,670
Sales . . . . . . . . . . . . . . . . . . . . . . . . . . . . . . . . . . . . . . . . . . . . . . . . . . . . . . . . . . 367,958 4,425,231Income before income taxes and minority interests . . . . . . . . . . . . . . . . . . . . . . . 37,623 452,471Net income . . . . . . . . . . . . . . . . . . . . . . . . . . . . . . . . . . . . . . . . . . . . . . . . . . . . . ¥ 22,656 $ 272,471
20. ACCUMULATED DEPRECIATION
21. ASSET RETIREMENT OBLIGATIONS
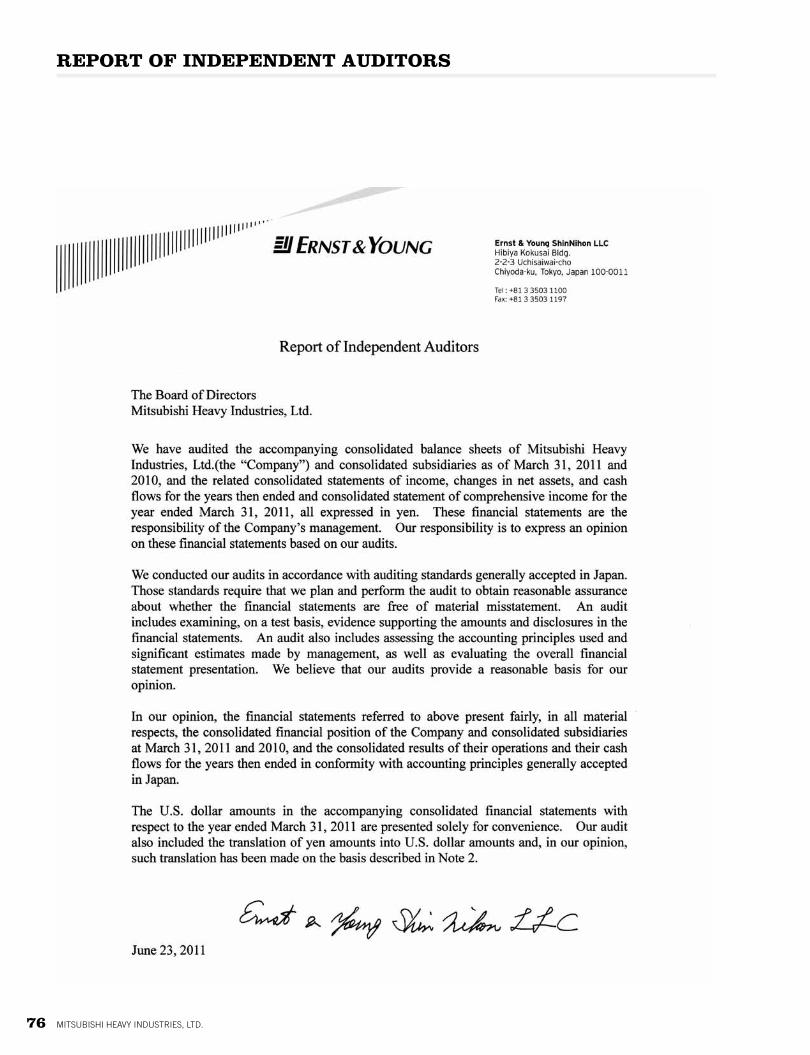
MITSUBISHI HEAVY INDUSTRIES, LTD.76
report of inDepenDent auDitors

How will MHI meet th e world’s growing demand for energy in the future?“MHI Group Thermal Power Generation”
Monthly Stock Price Range & Trading Volume(Tokyo Stock Exchange)
Financial Institutions32.95%
Government and Local Public EntitiesUnder 0.01%
Foreign Institutionsand Individuals19.27%
Individualsand Others36.33%
Other Corporations10.19%
Securities Companies1.26%
Common stock price range (Left scale) TOPIX (Right scale)
FY2006 FY2007 FY2008 FY2009 FY2010
FY2006 FY2007 FY2008 FY2009 FY2010(Thousands of shares)
(TOPIX)
0
750
250
500
1,000(¥)
0
500
1,000
1,500
2,000
0
200,000
400,000
600,000
800,000
1,000,000
1,200,000
1,400,000
1,600,000
Head Office16-5, Konan 2-chome, Minato-ku, Tokyo 108-8215, JapanPhone: +81-3-6716-3111Fax: +81-3-6716-5800
Established: January 11, 1950
Paid-in Capital: ¥265.6 billion
Total Number of Issuable Shares: 6,000,000,000
Total Number of Shares Issued: 3,373,647,813
Number of Shareholders: 349,540
Number of Employees: 68,816 (Consolidated)
Composition of Shareholders
Number of shares owned % of Major Shareholders by major shareholders total shares
Japan Trustee Services Bank, Ltd. (Holder in Trust) 168,868,900 5.01
The Master Trust Bank of Japan, Ltd. (Holder in Trust) 142,166,000 4.21
The Nomura Trust and Banking Co., Ltd. (Holder in Retirement Benefit Trust for The Bank of Tokyo-Mitsubishi UFJ, Ltd.) 125,666,000 3.72
Meiji Yasuda Life Insurance Company 80,022,741 2.37
SSBT OD05 OMNIBUS ACCOUNT – TREATY CLIENTS 63,129,700 1.87
Tokio Marine & Nichido Fire Insurance Co., Ltd. 50,400,000 1.49
Japan Trustee Services Bank, Ltd. (Holder in Trust 9) 49,795,000 1.48
The Nomura Trust and Banking Co., Ltd. (Holder in Retirement Benefit Trust for Mitsubishi UFJ Trust and Banking Corporation) 45,934,000 1.36
MHI Stock Ownership Plan 35,869,216 1.06
The Nomura Trust and Banking Co., Ltd. (Holder in Investment Trust) 31,542,000 0.93
Stock Listings: Tokyo, Osaka, Nagoya, Fukuoka and Sapporo Stock Exchanges
Ticker Code: 7011
Manager of the Register of Shareholders: Mitsubishi UFJ Trust and Banking Corporation
4-5, Marunouchi 1-chome, Chiyoda-ku, Tokyo 100-8212, Japan
Independent Auditors: Ernst & Young ShinNihon LLC
Hibiya Kokusai Bldg., 2-2-3, Uchisaiwai-cho, Chiyoda-ku, Tokyo 100-0011, Japan
As of March 31, 2011
CorPoraTe DaTa
ANNUAL REPORT 2011 77

To protect the environment, this annual report is printed on FSC-certified paper, and the cover is printed on recycled paper, by a waterless printing method that generates no harmful wastewater.
MIT
SU
BIS
HI H
EA
VY
IND
US
TR
IES
, LT
D. A
nnual Report 2011
K060-ANAL11E1-A-0,(6.5)11-7,R


