MIZUHO RESEARCH PAPER 31 Globalization of Japanisation Japanisation is not a uniquely Japanese phenomenon What does it mean for the world? Hajime Takata, Chief Economist Koji Takeuchi, Senior Economist Ryo Yamasaki, Economist
Transcript
MIZUHORESEARCHPAPER
31
Globalization of Japanisation Japanisation is not a uniquely Japanese phenomenon What does it mean for the world?
Hajime Takata, Chief Economist
Koji Takeuchi, Senior Economist
Ryo Yamasaki, Economist
Hajime Takata, Managing Executive Of ficer and Chief Economist of Mizuho Research Institute Ltd. (MHRI), possesses deep knowledge and acute insight on the financial markets. He has also held past positions such as Executive Of ficer and Chief Strategist of the Fixed Income Research Depar tment, Global Research Division, Mizuho Securities Co., Ltd. Among his recent works are, “Kako nikai no daishinsai no sankyotsuten, ‘endaka defure, kinyukiki, seijifuan’ wa kaihikano ka – baransu sheeto mondai ni fukaketsu na sanmi–ittai gensoku” (The three common aspects of the past two major earthquakes – can ‘strong yen deflation, financial crisis, political instability’ be avoided?), The Securities Analysts Association of Japan, June 17, 2011, Kinyu fukyo dasshutsu (Escape from financial recession), (Nikkei Publishing: 2003) (with T. Shibasaki), Sekai kokusai boraku – sekai wo mushibamu nihonkagensho (Global government bond crash – the Japanisation phenomenon eroding the world), (Toyo Keizai: 2010) (with T. Shibasaki et al).E–mail: hajime.takata@mizuho–ri.co.jp
Koji Takeuchi engages in research on financial markets as senior economist of MHRI. In par ticular, he possesses wide expertise and knowledge on stock market trends.E–mail: koji.takeuchi@mizuho–ri.co.jp
Ryo Yamasaki engages in research on forex market trends, the international currency system and the US economy as economist of MHRI. E–mail: ryo.yamasaki@mizuho–ri.co.jp
This publication is compiled solely for the purpose of providing readers with
information and is in no way meant to encourage readers to buy or sell financial
instruments. Although this publication is compiled on the basis of sources which
we believe to be reliable and correct, the Mizuho Research Institute does not
warrant its accuracy and certainty. Readers are requested to exercise their own
judgment in the use of this publication. Please also note that the contents of this
publication may be subject to change without prior notice.
Globalization of Japanisation Japanisation is not a uniquely
Japanese phenomenon What does it mean for
the world?
Hajime Takata, Chief Economist
Koji Takeuchi, Senior Economist
Ryo Yamasaki, Economist
Published by
Tokyo, June 2012
Contents
pageSummary 1
1. Introduction 2
2. Japanisation is a process of balance sheet adjustment 5
3. The tale of three cities and the collapse of their bubbles 15
4. The symptoms of balance sheet adjustment 29
5. How long will Japanisation continue? 34
6. Implications of Japanisation upon investment 46
7. The global spread of Japanisation 55
References 62
Endnotes 64
1
Summary
1. Today, the term Japanisation discussed in the US and Europe refers to a phenomenon of prolonged economic stagnation. However, it should be noted that this phenomenon is not uniquely Japanese. Rather, it is a universal phenomenon in the course of adjustment after the collapse of the credit bubble. What happened in Japan from the 1990s is only a precursor of the balance sheet adjustment process which the US and Europe are experiencing since 2007.
2. While the “bubble” in Japan occurred mainly in the corporate sector, the real estate bubble in the household sector was the trigger of the adjustment process in the US – as symbolized by the subprime loan crisis. In Europe, the trigger was the debt crisis of the state itself (hence the name “sovereign debt crisis”) of the GIIPS (Greece, Italy, Ireland, Portugal and Spain) coupled with the real estate bubble in Southern Europe. While adjustments to solve sovereign debt usually depend upon external demand, Europe faces constraints that the major countries of the world are in a simultaneous adjustment process and that it cannot expect support in the form of currency depreciation due to the use of the single currency euro. Although the adjustment process in Japan took approximately 15 years, the US and Europe are forecast to remain in adjustment mode at least until the mid–2010s and the second half of the 2010s respectively.
3. Balance sheet adjustment processes are characterized by the following symptoms stemming from the fall of funding demand accompanying a credit crunch: (1) the contraction of lending, (2) low–for–long policy interest rate levels, and (3) stabilization of long–term interest rates at a low level. In a state of Japanisation, financial institutions tend to shift their asset allocation from equities to bonds, with banks engaging in carry–trades taking advantage of the dif ferential between long– and shor t–term interest rates. At the same time, the stabilization of liquidity is
2
perceived as an indicator of stability amid the financial crisis.4. In the balance sheet adjustment process, the gap between the high
expectations among the public which existed during the “bubble” and the reality after the collapse of the bubble leads to social disaffection and political destabilization. The political situation in Japan which unfolded since the 1990s is a typical example. The demonstrations in New York provide signs of destabilization starting to emerge in 2011–2012, approximately four years after the collapse of the bubble in 2007 in the West. Japanisation is spreading to become a widespread global social phenomenon.
5. During the past two decades of balance sheet adjustment, Japanese corporate enterprises and financial institutions have lapsed into a mentality skewed toward deleveraging and deflation. The countries in the global credit expansion came to perceive Japan as irrelevant (“Japan passing”), capable only of producing idiosyncratic products and services (a state dubbed “Galapagos”) due to its weak growth and low profitability. On the other hand, it is also true that Japan – at the forefront of the Japanisation phenomenon – has “evolved” as a “species” capable of surviving the “glacial age” of the ongoing credit crunch in the US and Europe, enabling it to utilize the strength of the yen to acquire overseas assets.
1. Introduction
In the second half of September 2011, US 10–yr interest rates temporarily dipped to the 1.6%–level. This is the lowest level in approximately 60 years since the 1950s in the aftermath of the Great Depression. Despite the existence of numerous seasoned financial market participants in the US due to its long financial market history, most of these current generation market participants have never experienced interest rates as low as the current level. Indeed, the
3
market is entering unchar ted territor y. This means that past experience will provide little help in such an environment. On the other hand, market participants in Japan’s bond market have already weathered conditions in the uncharted zone for more than a decade since the second half of the 1990s.
The conditions in the US bond market and its market participants may be interpreted as one form of Japanisation. Japan’s market participants and policymakers have survived the unprecedented conditions for more than a decade. The quantitative monetary easing and low–for–long interest rate policy were implemented in actual practice for the first time in Japan. While Japan’s financial market players are often said to lack financial literacy, they are worthy of more self–confidence in their experience of such unprecedented market conditions.
Note: Monthly average of interest rates over 10 yearsSource: Haver.
The study of economics (including finance) was established through the construction of theories on the basis of past economic phenomena. Among these theories, the theory of investment – used widely in a textbook sense – only has a history of 40 to 50 years, being established sometime after the 1970s amid the rapid shift toward indirect finance and credit expansion. The capital asset
4
pricing model (CAPM) – which appears in the first pages of textbooks on investment analysis – was also born during this period. Insofar as government bonds were classed as risk–free assets, no one ever imagined that the value of government bonds would erode due to uncertainties regarding sovereign risk.
While we have used the term Japanisation over the past few years, the term might be somewhat misleading. This feeling stems from our understanding that the prolonged economic stagnation in the US and Europe is not a peculiar and unique phenomenon of Japan, but rather, is a universal symptom which occurs in the course of balance sheet adjustment. This Time is Different: Eight Centuries of Financial Folly (Reinhar t & Rogof f) refers to government–level crises as examples of balance sheet adjustment. The implications set forth therein is that financial crises stemming from balance sheet adjustment move into a phase of public debt crises, dragging the economy into a prolonged slump. This has many similarities with conventional views on balance sheet adjustment.
In September 2011, the International Monetar y Fund (IMF) released the Global Financial Stability Report: Grappling with Crisis Legacies. Here again, the gist of the theory is that financial system and sovereign debt crises arising out of excessive credit expansion lead to prolonged economic stagnation. Furthermore, the IMF report also calls attention to the difficulties in efforts to address the crises because of political processes within the countries involved. This is also a subject we wish to discuss in this paper.
Thus far, since the balance sheet adjustment process started in the US in 2007, the US has provided temporary boosts to the stock market through successive “shots in the arm” by combining monetary easing and fiscal expansion in the form of QE1 in 2009 and QE2 in 2010. Despite the rise of market expectations toward another shot in the arm through monetary easing in the second half of 2011, lingering inflation concerns made it dif ficult to prescribe another shot. Moreover, it was also true that its ef fect was viewed as somewhat dubious. Policy measures were also depleted in terms of the political environment.
5
2. Japanisation is a process of balance sheet adjustment
Assuming that Japanisation referred to in the previous section is a universal phenomenon, we shall start out with the hypothesis that it is equivalent to the process of balance sheet adjustment.
While current US economic conditions and the European sovereign debt crisis differ from conditions after the collapse of the economic bubble in Japan, they share the common characteristic that they are fundamentally balance sheet adjustment processes. Harking back to history, the Great Depression of the 1930s was also a process of balance sheet adjustment. These balance sheet problems are relatively simple in structure sharing numerous common aspects. However, in the real world, we have felt that it is difficult to explain balance sheet problems, and in particular, that it is difficult to explain the phenomenon to the public via the media.
Since the 1990s, the impression from watching media reports during the past decade, for example such as television broadcast, is that it is very difficult to provide an explanation on balance sheets on television and that attempts to do so would not be well–understood. Other concepts in accounting such as profit/loss statements, “profit or loss” which are clear–cut “black–or–white” concepts are easy to explain on television, given television’s capability to provide explanations through instantaneous image projections. In contrast, just the mere preparation of flip charts would be dif ficult for the explanation of concepts possessing breadth such as balance sheets.
In reality, the problem Japan faced during the past two decades was a balance sheet problem, which was also an extremely important issue for the public. Moreover, public agreement was indispensable insofar as policy responses required political decisions. To provide a specific example, Diet action was necessary in order to inject public funds into financial institutions during the financial system crisis in the second half of the 1990s. The essence of the discussions centered on balance sheet adjustment. Financial sector issues –
6
which were once limited to the world of financial sector specialists and participants – were “politicized”, leading to the formation of public opinion through tabloid television shows. Balance sheet adjustment is an easily politicized issue, given the necessity for policy responses. The demonstrations against financial institutions most likely stem from the perception that labor cost cuts are insufficient in light of the injection of public funds.
Let us turn to the basics of balance sheet problems. To begin with, “balance sheet adjustment” refers to adjustment pressures upon capital generated by debt resulting from the following development: (1) expansion of the balance sheet (on both the asset and debt side of the balance sheet) of various economic actors (corporate enterprises, financial institutions, non–financial sector (in many cases, the household sector)) due to credit expansion → (2) asset price falls. In the credit expansion phase, there is usually a sharp expansion of credit accompanying excessive expectations. However, note that balance sheet problems never surface while asset prices are rising and become evident only when asset prices take a downturn.
In Chart 2, a gap arises between the right and left hand sides of the balance sheet as a result of debt remaining in contrast to the loss of asset value, thereby creating a serious capital shortage. In turn, this spirals out into a financial system problem. While the impairment of deposits such as in the household sector is unacceptable in normal circumstances (the asymmetric nature of debt” referred to in Chart 2), loan assets which are impaired in value become debt problems for financial institutions as nonperforming loans. In balance sheet adjustment, the problem develops in the following phases: (1) a debtor crisis → (2) a financial institution crisis → (3) a government (sovereign) debt crisis.
7
Chart 2: Diagrammatic representation of the balance sheet crisis
An oft–cited argument during the 1990s was that “a collapse of the bubble would not cause any problem because a plunge of equity/real estate prices (assuming that such should happen) would just put us where we started out in the first place”. Assuming the absence of credit expansion in the foregoing case and that an individual merely used his/her available funds for real estate acquisitions and that the price of such real estate merely rose and fell back to its original level, this would indeed put the individual where he/she “started out in the first place”. However, it must be noted that “credit” is indispensable in economic activity and that in the event credit expanded in the form o f l o a n s, d e b t w o u l d a l s o e x p a n d s h a r p l y. A c o m m o n misunderstanding – or an oft–forgotten aspect – of balance sheet adjustment is that debts continue to exist even when asset values are impaired. This is the cause of the misguided argument that “it would only put us where we started out in the first place”.
Stated differently, financial activity and credit activity are a given precondition of balance sheet adjustment. In the bubble–expansion phase, credit would expand along with excessive expectations, and the reversal of/reaction to such expectations leads to the collapse of the bubble and balance sheet adjustment.
The balance sheet problem following the collapse of the bubble in
8
Japan is a subject we have focused on with much interest. In 2003, we discussed the balance sheet problem in “Kinyu fukyo dasshutsu” (Escape from financial recession) (Takata and Shibasaki) (note 1). At the beginning of this book, we focused attention on the fact that the level of national wealth (as a percentage of GDP) lost as a result of the collapse of the bubble in the 1990s was higher than the percentage lost in the Second World War (WWII). “Japan’s Lost Decade” was a condition resulting from political inaction to address the problem without any awareness that such an enormous loss of national wealth had occurred. Perhaps, today, Japan might be commended for coping with such a loss and shock solely on its own, and without descent into economic depression or outbreak of social riots.
The balance sheet adjustment subsequent to WWII was an extremely simple process. In a diagrammatic representation (Chart
3), the balance sheets of all sectors (corporate, financial and non–financial sectors) were cut in the face of the impairment of asset value. However, a note of mention is necessary that bank deposits of depositors were also impaired, leading to the closure of bank deposits after WWII.
Chart 3: Diagrammatic representation of balance sheet adjustment (post–WWII)
That said, a bank deposit closure would not be possible in ordinary circumstances, and it was only possible to implement such a measure because of a national consensus (or national resignation) in an “emergency situation” after defeat in war (note 2). While we shall note this as a successful example of Japan’s post–War policy response in the summary of past cases of balance sheet adjustment later on, it should also be noted that it would be dif ficult to implement this measure in today’s peacetime environment.
While the collapse of Japan’s bubble economy stems from the plunge of asset prices in a backlash to the surge of asset prices due to the excessive expansion of credit, the balance sheet adjustment after the Great East Japan Earthquake is a balance sheet adjustment caused by the physical loss of hard assets due to a huge earthquake. The only difference between the two is whether the asset impairment occurred in accounting terms or in physical terms.
Chart 4: Diagrammatic representation of balance sheet adjustment (earthquake)
Bubbles and their collapse are part of human desire, and the quest for its control is the histor y of economics itself. Credit expansion – a prerequisite in the formation of bubbles – is equivalent to “leverage” in the world of finance, and refers to the utilization of
10
funds one does not possess. A look back into the histor y of economics reveals the recurrence of credit expansions and subsequent adjustments. Credit as such, may be perceived as one of the most fundamental desires of human beings. Thus, the history of economics is also the history of the construction of an institution to control the expansion of credit in a bid to provide responses to the recurrence of excessive credit expansions and depressions.
Banking regulation started out with the regulation of banks which are permitted to provide credit. Therefore, by banning the provision of credit by entities other than banks, the act of collecting funds from the public in the form of deposits was only permitted to banks under regulatory control. Furthermore, foreign currency funding enabling the collection of funds from overseas was also limited. The US dollar, which functioned as a global currency in the period following WWII, was backed by gold and possessed vestiges of the gold–standard currency regime.
However, the history of finance during the past 40 or so years developed in the direction of expanding the financial mediation functions of nonbank entities. On a global scale, the US dollar was separated from its gold–backing, thus leading to a further expansion of credit through the spread of the US dollar around the world. The past 40 or so years were a history of setting the financial industry free from its self–regulations on various levels. Indeed, this was the original starting point of the recent collapse of the bubble.
Among the various desires of human beings, one such primal desire is “credit”. Credit also functions as “leverage” – the driving force of economic expansion – and copious amounts of leverage unleashes “god’s wrath” in the form of recurring bubble crashes. Japanisation may be construed as god’s wrath toward such excesses.
Here, we shall look at government bonds in balance sheet adjustment. Over the years, we have used the analogy of a sacrifice or “migawari–jizo” (a Buddhist deity who sacrifices oneself for the benefit of others) to describe government bonds which have ballooned as substitutes for the copious amounts of debt incurred elsewhere. In the process of loss disposal accompanying balance
11
sheet adjustment, government bonds act as a “vessel to secure time to address the problem”. In a negative sense, it has functioned as a “tool for procrastination” for debt disposal. In the early stages after the collapse of the bubble in the 1990s, debt, capital investment and employment of corporate enterprises were referred to as the “Three Excesses”. In the course of the subsequent two decades, Japanese companies have shed off their debt, transforming themselves into leaner entities. Meanwhile, as a well–known fact, outstanding government debt has surged as a result of shouldering (serving as substitutes of) the debt burden. Considering that national wealth lost in the 1990s runs up to an unprecedented amount surpassing the losses in the aftermath of WWII, it is hardly surprising that Japan’s outstanding government debt is an astronomical figure.
Chart 5: Diagrammatic representation of balance sheet adjustment and government bonds
Assets
Assets Debts Savings
Capital
Capital
Government bond issuanceSacrifice "migawari jizo"for debt burden
Chart 6 also provides a diagrammatic representation of the balance sheet adjustment in “graduated phases”. The basic structure of balance sheet adjustment is a simple structure which can be
12
explained in a package of three basic principles. Namely, in the event capital is impaired in the course of balance sheet adjustment, the three basic principles are: (1) debt substitution, (2) securing of capital for debt disposal (in many cases the devaluation of one’s own currency), and (3) expectations toward future improvement. First of all, debts are “substituted” by government bonds. At the same time, debt substitution requires debt disposal by securing both time and capital for debt disposal set forth on the left hand side of Chart 6. Usually, the burden of capital for debt disposal for adjustment on a domestic level is usually shifted overseas. In such case, measures for currency devaluation are usually implemented. Reinhart & Rogoff’s This Time is Different also refers to cases where countries resorted to currency devaluations to stem the crisis.
Chart 6: Diagrammatic representation of balance sheet adjustment
Ove
rsea
s as
sets
Impr
ovem
ent o
fpr
oduc
tivity
Ord
er o
f ent
ities
bea
ring
burd
ens
Burden upon corporate andhousehold sectors
Government bonds
Monetary easingQuantitative easing
Fiscal expansionGovernment (public sector)
Reflationary measuresMonetary, fiscal
measures
Impr
ovem
ent o
f fut
ure
expe
ctat
ions
Securing of capital for debtdisposal
Source: Made by Mizuho Research Institute (MHRI).
13
Currency devaluations serve as the trump card to secure capital necessar y for debt redemption. Indeed, most countries have resorted to this measure in the past. However, idealistically, the creation of new markets through the development of new products and productivity gains are also options (Chart 6). In any event, given the slim prospects of a recovery of domestic demand, the idea is to secure cash flows from other areas for the purpose of debt redemptions for one’s own countr y. Currency devaluations are measures to secure cash flow from the market through a price strategy. New products are a means to secure new markets. Furthermore, from the perspective of securing markets, protectionist measures are often implemented.
The third and last principle in the above–mentioned three basic principles of balance sheet adjustment is imperative in balance sheet adjustment. As set forth in Chart 6, balance sheet adjustment is a phenomenon caused by the fall of asset prices in a balance sheet. Asset prices are a vital factor in balance sheet adjustment and expectations toward the future are the most important factor in price formation. Moreover, it is necessary to set forth a viable future outlook. Future expectations are dependent upon the sentiment of economic actors. Furthermore, since they are based upon past experience, once expectations take a downturn, a recovery back to former levels is extremely difficult. Japan is a case where sentiment has fallen due to an adjustment process of nearly two decades.
Policy responses for balance sheet adjustment require political decisions based upon a long–term perspective and a long–term view of economic welfare. However, it is not an easy matter to gain public approval for such long–term policy responses. In the event political process is involved, the ruling political party would normally opt for debt substitution and loss compensation from the perspective of economic welfare. However, from a populist perspective and in view of the rise of public envy, the opposition party(ies) would usually gravitate to the decision that it would be better from an election point of view to take a position against the realization of the support
14
measures. In order to realize the support measures amid such political
headwinds, it would be necessary for the ruling party to construct the argument that they are emergency measures in a state of emergency. The ruling party would thus be able to foment a sense of public acceptance by using the crisis as a lever, or by placing the onus upon the entities receiving support, through a ritual casting of such entities as the “sacrificial lamb”.
In a country such as Japan which has virtually lost any sense of threat from overseas (including those of militar y force), discussions on profit/loss on a national scope tend to diminish and lead the way toward populism and inward–focused debate. Even so, the adjustment of interests in periods of high growth was a relatively easy matter which could be achieved by channeling the benefits of the entire economy to those who fail to share the benefits. However, in times of balance sheet adjustment in which the entire economy shrinks, the capital necessary for disposal are nowhere to be found within the country. This makes it all the more necessary for a ritual to facilitate the process. Note that recent events unfolding in the US and the eurozone indicate that such a political situation is not unique to Japan.
The following sections shall provide an account of balance sheet adjustment by looking at past cases. In Chart 7, we have assessed past balance sheet adjustments in terms of the three basic principles mentioned before, namely, (1) debt substitution, (2) suppor t (securing of capital for debt disposal), and (3) future expectations. While we shall elaborate on this matter (including the assessment) later on, a look at past cases highlights the severity of Japan’s condition after the collapse of the bubble.
15
Chart 7: Comparison of past balance sheet adjustments
Timing Debt substitution Support Future expectations
Collapse of Japan’s asset
bubble
× Slow response by
financial institutions
× Difficulty to depend upon
external demand due to yen appreciation
× Downbeat due to
deflationary sentiment
Since the US subprime loan
crisis
Despite slow adjustment
in household sector, financial system
measures are taken at an early stage
Dependence upon external
demand by a weak dollar policy
Stock market support through maintenance
of sentiment by measures such as
QE2
European debt crisis
× Lingering problems among the GIIPS
Real estate problems linger
German support exists,
although its impact is tenuous under a single currency
× Eurozone sentiment is
maintained
Response toward 311 Earthquake
× Lingering burdens upon
disaster-hit regions
× Insufficient dependence upon
external demand
× Future expectations remain downbeat
Response toward electrical power
shortage after 311Earthquake
× Burdens mainly upon
corporations
× Emphasis upon rationalization (cost cuts) may stall electricity
charge hikes
× Future energy policy
measures are insufficient
Post WWII conditions
Balance sheet
adjustment – including bank deposit closure – is accomplished all at once
Weak yen policy and capital supply using quasi-equities
under fixed forex regime
Presentation of clear
catch-up model
Source: Made by Mizuho Research Institute (MHRI).
3. The tale of three cities and the collapse of their bubbles
The subject of this paper is balance sheet adjustment referred to as Japanisation. We have consistently held the belief that conditions in the US, and some parts of Europe since 2007, stem from balance sheet adjustment similar to Japan after the collapse of the bubble.
We said before that credit expansion is a precondition of balance sheet adjustment. Chart 8 sets forth a comparison of private–sector
16
debt as a percentage of GDP among the US, Japan and the eurozone. The chart shows that in Japan’s case, the credit expansion peaked around 1990 and that its adjustment took approximately 15 years until the mid–2000s. Meanwhile, the chart shows a sharp rise of debt in the US and the eurozone since the mid–1990s. The chart indicates that the US has been in an adjustment since 2008 and that the adjustment is still benign. The adjustment process in the eurozone appears to have made very little progress so far.
Chart 8: Private–sector debt as a percentage of GDP
80
100
120
140
160
180
200
1980 1985 1990 1995 2000 2005 2010(Yr)
US Japan Eurozone
Note: The US and eurozone are calendar year–based and Japan is fiscal year–based. The private sector = private non–financial corporate sector + household sector
Source: Made by MHRI based upon Haver, Cabinet Office, and European Commission.
Chart 8 sets forth the debt conditions of three countries/areas – Japan, the US and the eurozone. Each possesses their peculiar characteristics, and the description thereof shall be dubbed the “Tale of Three Cities”. The tale will depict the adjustment processes upon highlighting the differences in the actors involved in the bubble.
17
Chart 9: Comparison of the balance sheet adjustments in Japan, the US and the eurozone
Japan US Eurozone
Debtors
Mainly the corporate sector
Construction companies, real
estate companies, nonbanks
Mainly the household sector
A housing sector crisis due
to subprime loans
The government sector
A housing sector crisis in
some Southern European
countries
Expansion
of finance
Mainly loans
(not affected much by
mark-to-market accounting)
Expansion of marketable
credit
(conditions akin to a market
run due to mark-to-market
accounting)
Expansion of loans,
marketable credit
(conditions akin to a market
run due to mark-to-market
accounting)
Public
support
Public funds from the
mid-1990s
Prompt public support from
the Lehman Shock onward
Prompt public support from
the Lehman Shock onward
Debt
adjustment
Facilitation of direct
charge-offs from balance
sheets through the overhaul of
bankruptcy laws from the
2000s
Slow debt adjustment mainly
in the household sector
Being a sovereign debt
crisis, debt adjustment is a
slow process
Support by
external
demand
The strength of the yen up to
1995 serve as a negative
factor
Weak dollar from 2007
onward
Weak euro since 2010
onward
Source: Made by MHRI.
Firstly, note that Japan’s bubble is deemed as a problem of companies which were considered to be “bubble enterprises” in the 1980s. Given that these “bubble enterprises” emerged out of speculation in the real estate and stock markets, the real estate, construction and nonbank sectors were referred to as the “three malignant sectors”. Subsequently in the 2000s, as part of a package of measures to improve the financial system, there were calls for the direct charge–off of bad assets upon their detachment from banks’ balance sheets. The debate culminated in a list of firms referred to as the “30 firms” (30 firms which were alleged to be virtual zombie firms which would be bankrupt without bank support) and the rise of public opinion to charge off the bad assets and firms. Note that the principal sectors of the firms in this list were the aforementioned
18
three malignant sectors. Given the characteristic of credit mediation in Japan, credit
expands primarily through bank loans in Japan. On the other hand, loans are provided by nonbanks in a “by–pass” route in Japan. Stated differently, since bank loans were the primary vehicle of credit in Japan, and since such loan assets were seldom securitized and market–valued, it took time for the crisis to manifest itself. At the same time, this also meant that Japan was blessed with time to deal with the problem. As explained in more detail later on, this is the main difference with the situation in the US. Due to the dependence of credit mediation upon marketable products such as securitized products in the US, sudden funding difficulties in the market cause situations likened to a “market run”.
In the case of Japan, since the adjustment process took place mainly in the corporate sector, debt recovery progressed along with corporate liquidation and rehabilitation through the overhaul of Japan’s corporate bankruptcy laws. The Resolution and Collection Corporation and the Industrial Revitalization Corporation of Japan established in the 1990s are such examples. In Japan, the basic purpose of securitization and measures to facilitate liquidation was to facilitate the liquidity of assets for the disposal of bad loans. Naturally, the situation would differ from the US where securitization was used as a tool for credit expansion. Moreover, an efficient bad loan disposal process took place in Japan where bad loans were gradually concentrated in the “main bank” (the principal lender) which assumed the role of the de facto “bad bank”.
In Japan’s case, despite the rather lengthy time for the crisis to sur face due to credit mediation roles assumed by banks, the adjustment process took place primarily in the corporate sector. Thus, the adjustment process (including the response to corporate bankruptcies) – once started – was a relatively quick process. The full–fledged NPL disposal process in Japan which started in the early 2000s was more or less settled by around 2005 to 2006. The situation was also helped by macroeconomic conditions where external demand was driven by the weak yen from the 2000s onward.
19
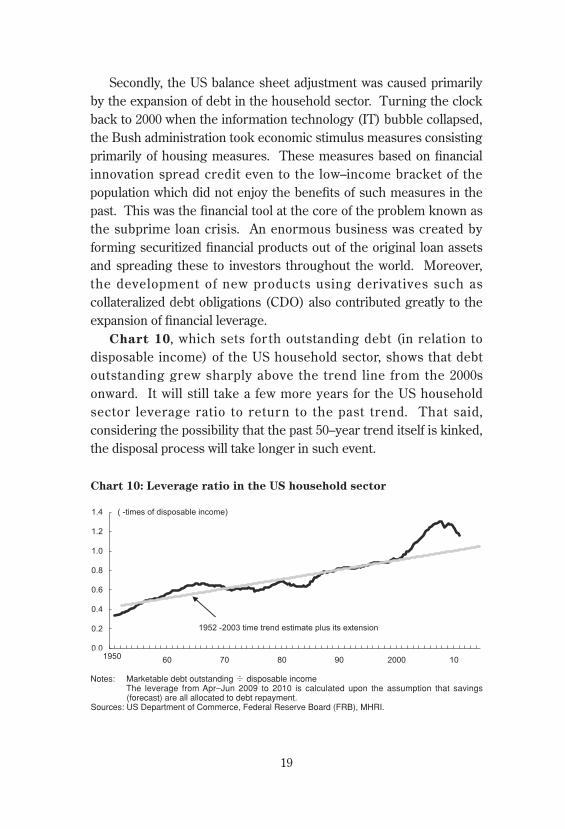
Secondly, the US balance sheet adjustment was caused primarily by the expansion of debt in the household sector. Turning the clock back to 2000 when the information technology (IT) bubble collapsed, the Bush administration took economic stimulus measures consisting primarily of housing measures. These measures based on financial innovation spread credit even to the low–income bracket of the population which did not enjoy the benefits of such measures in the past. This was the financial tool at the core of the problem known as the subprime loan crisis. An enormous business was created by forming securitized financial products out of the original loan assets and spreading these to investors throughout the world. Moreover, the development of new products using derivatives such as collateralized debt obligations (CDO) also contributed greatly to the expansion of financial leverage.
Chart 10, which sets for th outstanding debt (in relation to disposable income) of the US household sector, shows that debt outstanding grew sharply above the trend line from the 2000s onward. It will still take a few more years for the US household sector leverage ratio to return to the past trend. That said, considering the possibility that the past 50–year trend itself is kinked, the disposal process will take longer in such event.
Chart 10: Leverage ratio in the US household sector
0.0
0.2
0.4
0.6
0.8
1.0
1.2
1.4
1950 60 70 80 90 2000 10
( -times of disposable income)
1952 -2003 time trend estimate plus its extension
1950
Notes: Marketable debt outstanding ÷ disposable income The leverage from Apr–Jun 2009 to 2010 is calculated upon the assumption that savings (forecast) are all allocated to debt repayment.
Sources: US Department of Commerce, Federal Reserve Board (FRB), MHRI.
20
The balance sheet adjustment in the US is characterized by the fact that it stems primarily from the expansion of debt in the household sector. The expansion of debt, as exemplified by home equity loans, was fueled by additional loans based upon profits from higher property prices. Credit expansion driven by the rise of home prices led to the expansion of consumer spending. However, given the downturn of home prices triggered in 2007, there has been a surge of individuals whose balance sheets have dipped deep into debt. Indeed, it is difficult to rule out the possibility that this has af fected labor mobility and dynamism which have served as the source of US dynamism. Given balance sheet problems, geographic mobility would be difficult in the event households are weighed down with latent losses on homes.
Earlier on, we wrote that the adjustment process in Japan took place mainly in the corporate sector and that adjustment progressed under various legal measures. In contrast, given that balance sheet adjustment took place mainly in the household sector, the personal bankruptcy process in the US is relatively easier than Japan in certain aspects. Even so, balance sheet adjustment through personal bankruptcies is a politically unpalatable option. In fact, full–fledged disposal of personal debt has not been implemented since the inauguration of the Obama administration in 2009.
Around the year 2000, Japan was subject to “gaiatsu” (external pressure) from the US and Europe to facilitate the disposal of companies which had fallen into excessive debt, based upon the precept that such “zombie companies” should not be allowed to sur vive. In the US, the “zombie” is the household sector itself. Despite the spread of zombies throughout the US, deeply unpopular (election–wise) policy measures to facilitate the personal adjustment process are unlikely at least until the end of the US presidential election in 2012.
In contrast, the policy responses to stem the financial system crisis were taken relatively promptly in the US. Credit expanded in the US via marketized products (dubbed the “shadow bank”) such as securitized products of original loan assets in the household sector.
21
However, once credit takes a downturn, the market value of such securitized products declines, and the fall of credit ratings leads to a sharp evaporation of financing in the market (a virtual “bank run”). Prompt financial system responses were indispensable, considering the structure of credit mediation in the US enabling the rapid “spread of venom”.
In summar y, in contrast to the fast response to the financial system crisis due to the characteristics of credit mediation primarily though the market in the US, responses toward the current crisis will require time since individuals are the holders of original debt. Moreover, to secure cash flows to ser ve as resources for debt redemption, companies with relatively light debt burdens usually opt to depend upon foreign demand. The US “weak dollar” policy since 2007 may be perceived as a necessity under the foregoing environment.
In view of the global macroeconomic environment, the US current account deficit stemming from credit expansion primarily in the US household sector served to prop up global external demand. The peak of this trend was 2007. Chart 11 shows the trends in global current account balances. The concentration of the current account deficit in the US up to 2007 served as the engine of global economic growth through external demand. The global economy is facing a turning point of this structure. The environment in which the US provided all other parts of the world with external demand has taken a major turn, with the US now seeking external demand itself.
22
Chart 11: Trends in global current account balances
-2.0
-1.5
-1.0
-0.5
0.0
0.5
1.0
1.5
2.0
2.5
2000 2002 2004 2006 2008 2010 2012 2014 2016
(% of nominal GDP)
Year)
US
India
Japan
China
Eurozone
Others
ASEAN
NIEs
Sources: International Monetary Fund (IMF), MHRI.
Lastly, let us look at the eurozone. From the perspective of original debt, while the balance sheet adjustments of Japan and the US originated from “bubble” enterprises and households with subprime loans respectively, the problem in the eurozone stems from the state itself holding excessive debt. This is the problem often referred to as the GIIPS (note 3) crisis in countries such as Greece. Moreover, financial innovation and the rise of expectations are requisite for credit expansion in the formation of bubbles. In Japan, this corresponds to the “land myth” (the myth that land prices in Japan will never fall due to its limited geographic area) and the rise of nonbank institutions in the course of financial sector deregulation. In the US, it was the subprime loan, a financial product enabling loans to subprime (low income) borrowers who were unable to take out loans in the past, and “financial innovation” primarily by shadow banks. In the case of the eurozone, the innovation of a single currency – the
23
euro – opened the way for credit expansion by countries (which were unable to borrow sufficient funds in the past). Indeed, the single currency, creating the “euro bubble” provided countries such as Greece with levels of credit comparable to Germany.
Chart 12, showing the financial conditions of the countries of Europe, reveals the expansion of the fiscal deficit in countries such as Greece since the eurozone currency union in 1999.
Chart 12: Eurozone fiscal deficit (as a percentage of GDP)
As a result of the expansion of the fiscal deficit, the deficit in the external balance (current account balance) continued to expand from the perspective of the savings–investment (I–S) balance. Chart 13, which sets forth the current account balances of the countries of the eurozone, shows that the sovereign debt crisis among the GIIPS is the flip side of the coin of Germany’s current account surplus. In macroeconomic terms, the expansion of the external imbalance within the eurozone served to support the “euro bubble” during the past decade.
2. “ Other fiscal deficit countries” = Greece, Portugal, Ireland. Data on 2011 are forecasts by the European Commission
Source: European Commission.
German exports – the engine of Europe’s growth – was supported by the weaker–than–actual euro. The euro was weakened below levels deemed appropriate in terms of German economic strength due to Greece’s deficit and the existence of weak countries such as Greece. By the same token, from Greece’s perspective, Greece’s fiscal deficit expanded due to the stronger–than–actual euro strengthened by the existence of Germany. Moreover, the additional fiscal expansion due to the Athens Olympic Games in 2004 served as the cause of the imbalance.
Since Greece was in a state of de facto default during half of the period since its independence in 1830 (180 years), it was difficult for Greece to bor row funds in abundance before its eurozone membership. The euro bubble was a bubble created by a sharp reversal of conditions regarding Greece’s funding ability.
In Europe, the expansion of the imbalance due to the euro bubble served as the engine of economic growth. The global credit bubble peaking in 2007 was caused by the double leverage of the expansion
25
of the US imbalance and the eurozone imbalance. The current global economic slowdown stems largely from the fact that the world has lost two of its main engines.
A look at balance sheet adjustment from the perspective of the issuer of original debt reveals that the state itself is the cause in Europe. The Greek crisis is one such example. According to the contention mentioned earlier that entities with debt should be eliminated, Greece may be referred to as the “zombie” in Europe. However, the conundrum today is that there is no way to dispose of “zombie” states. It would be dif ficult to apply the corporate bankr uptcy system to the state itself. Fur thermore, debt restructuring is not an easy matter under the euro single currency. Even if Greece succeeds in reducing existing debt through means such as defaults, it would have to keep defaulting every year in the most extreme case as long as it continues to run a current account deficit. Under normal circumstances, sovereign state debt adjustment is carried out through the separation of debt on the stock side and the securing of a budget surplus (currency devaluation) on the flow side. Responses would be difficult, given the difficulty to resort to the latter step.
Furthermore, Europe also has a debt crisis in its private sector as a result of the euro bubble. A look at Chart 8, setting forth private–sector debt as a percentage of GDP of Japan, the US and Europe, shows that the adjustment process has barely started in Europe. During the course of the euro bubble in the past decade, the expansion of debt in the private sector proceeded in the countries of Southern Europe such as Spain, Portugal and Italy simultaneously with the expansion of sovereign debt. Today, the fiscal tightening measures in these countries are serving as a negative impact upon domestic demand, leading to the view that property prices will also continue to fall. Thus, there are lingering risks of the sovereign debt crisis in Europe spreading to a private–sector financial crisis. Chart
14 (eurozone housing prices) shows that housing prices are continuing to decline after peaking in 2007 mainly in the countries of Southern Europe.
26
Chart 14: Eurozone housing prices
100
150
200
250
300
350
98 00 02 04 06 08 10
France IrelandSpain NetherlandsUK
1998 1Q 100
Sources: INSEE, ESRI, CSO, Nationwide, Ministry of Housing of Spain, CBS.
Chart 15 is a diagrammatic representation of the possible “negative impact” which could arise out of the sovereign debt crisis. The fall of the price of government bonds due to the European sovereign debt crisis led to a capital shor tage among financial institutions. As a result, the decline of lending (credit crunch) serves as a negative impact upon the real economy, and most notably, the real estate market. Furthermore, the budget cuts and tax hikes among the countries subject to the sovereign debt crisis will also have a negative impact upon the real economy. Hence, the fall of tax revenues due to the stagnation of the economy will lead to further concerns regarding sovereign debt. Such a “negative spiral” cannot be stopped without support from outside the af fected areas. In Europe, the adjustment subsequent to the collapse of the real estate bubble in countries of Southern Europe is not yet finished, and the assumption of debt is still a pending issue. Thus, there is the possibility that additional burdens upon financial institutions will still have a negative impact upon the real economy.
27
Chart 15: Diagrammatic representation of the “negative impact” from the European sovereign debt crisis
Corporate, household sectors
Financial institutions
Government bondsSovereigndebt crisis
Tax hike,spending
cuts
Fall of lending
Price fallsPublic funds
Det
erio
ratio
n of
sen
timen
t
Eco
nom
ic s
low
dow
n
Tax revenue falls
Source: MHRI.
Chart 16 sets for th a comparison of the process of debt assumption in Europe and the debt assumption process in Japan since the 1990s. In the early stages of the collapse of the bubble in Japan, financial institutions and companies attempted to solve their debt burdens by themselves by resorting to their profitability and latent profits. However, when it became apparent that the problem could not be solved independently, a request for support was made toward their peers (fellow companies and banks) (referred to as the “hokacho” system – a Buddhist term referring to a manuscript setting forth the names of parties providing donations for a certain cause). One such example in Japan was the establishment of the Tokyo Kyodo Bank in 1995. However, exter nal suppor t became indispensable amid the increase of debt burdens due to the rise of market uncertainties. This led to the injection of public funds in the latter half of the 1990s. In Europe, the process of debt assumption thus far is currently at the “hokacho” or donation stage (seen in the first half of the 1990s in Japan’s case) where requests for support are made toward fellow countries in the area. At some point in time, additional credit supplementation from outside may become necessary.
28
Chart 16: The debt assumption processes in Japan and Europe
Europe's case Japan (from the 1990s)
Independent recovery Utilize government bonds Utilize one's own profitabilityof its own country and latent profits
Support by peers ECB, EFSF, "Hokacho " (donation) by BOJmajor powers and peers
External support IMF Public fund injectionsG20Non-eurozone countries
External support = stronger monitoring
"A crisis ritual" is necessary for external support
Difficulty ofindependent recovery
External creditsupplementation
Source: MHRI.
Covered bonds serve as an effective funding tool for European financial institutions and may be considered the aorta of Europe’s financial sector providing stable financial intermediation under institutional support. Possessing characteristics similar to ABS (asset–backed security), backed by loan assets of European banks, covered bonds enjoy high creditworthiness given its government regulation and market confidence.
Looking back, one of the funding tools of banking institutions which were affected in the aftermath of the collapse of the bubble in Japan was the bank bond issued by long–term credit banks. Bank bonds may be deemed similar to covered bonds, due to its characteristics as a funding tool compatible with lending for capital investment. In the escalation of the financial crisis in the latter half of the 1990s, the rise of uncertainties regarding bank bonds served as a major turning point. Looking for ward, the stabilization of the covered bond market may become a major issue in the stabilization of the financial sector in Europe. Should the covered bond market destabilize, that may be deemed as a symptom of Japanisation. Japan’s experience may be one of the background factors in the
29
ECB’s decision in October 2011 to resume the purchase (albeit in small amounts) of covered bonds.
The dif ficulty in the balance sheet adjustment process today stems from its characteristic that the crisis is driven by market movements. Namely, a liquidity crunch (a “market run”) arises due to uncer tainties and loss of confidence in the market, and the condition is escalated into a crisis due to the acceleration of market dependence upon financial innovations such as CDS, mark–to–market accounting and credit ratings.
Summarizing the “Tale of Three Cities” above, the situation in Europe is the most serious and the adjustment process is only at a very early stage.
4. The symptoms of balance sheet adjustment
To analyze Japanisation, it is necessary to ascertain the degree of the credit crunch in the balance sheet adjustment process. Upon doing so, we need to consider the state of the saving–investment balance (“I–S balance”) in Japan, the US and Europe. Chart 17, which sets forth the I–S balance of Japan, shows that the corporate sector shifted from a capital shortage to a capital surplus around 1990.
30
Chart 17: The I–S balance (Japan)
-15
-10
-5
0
5
10
15
85 89 93 97 01 05 09FY
Sho
rtag
e
S
urpl
us
(% of nominal GDP)
Current account balance
Households Business corporations
Central government
Source: Bank of Japan (BOJ), Cabinet Office, Ministry of Finance of Japan.
Note that the I–S balance of the US is turning increasingly similar to Japan’s I–S balance. In the US, the I–S balance up to 2007 was characterized by over–spending in the household sector. However, a turnaround in 2007 has led to a capital surplus in both the household and corporate sectors.
Chart 18: The I–S balance (US)
(% of nominal GDP)
Sho
rtage
S
urpl
us
Current account balanceCentral government
Business corporations
Households
Sources: FRB, US Department of Commerce.
31
Let us also look at the I–S balance in the eurozone. As shown by Chart 19, the corporate and household sectors have shifted into a capital surplus. The global economy has never experienced a simultaneous surplus in the private sectors (the corporate and household sectors) of Japan, the US and Europe in post–WWII histor y. This fact alone provides reason to take note of the simultaneous nature of the current credit crunch.
Chart 19: The I–S balance (Europe)
-8
-6
-4
-2
0
2
4
6
8
80 85 90 95 00 05 10
Current account balance CorporationsGovernment Households
(% of nominal GDP)
(CY)
Fundsurpus
Fundshortage
Note: Eurozone 12–nation basis. Countries without data up to 2000 are excluded.Source: European Commission.
The foregoing change of the liquidity flow is reflected in the contraction of lending. We have held the view that the most readily visible symptom of Japanisation appears in lending. Chart 20 sets forth the trends in loan–deposit ratio and JGB holdings of Japanese banks
32
Chart 20: The loan–deposit ratio and JGB holdings of Japanese banks
As shown in Chart 21, the US faces similar structural conditions due to the fall of lending in the balance sheet adjustment process. Namely, US banks are also increasing their holdings of treasury bonds and agency bonds amid the decline of their loan–deposit ratios.
Chart 21: The loan–deposit ratio and treasury bond + agency bond holdings of US banks
400
600
800
1,000
1,200
1,400
1,600
1,800
00 01 02 03 04 05 06 07 08 09 10 11 12
80
85
90
95
100
105
110
115
120
Outstanding balance of holdings of government bonds + agency bonds
Loan-deposit ratio (right scale, reversed)
(USD billion)
(CY)
(%)
Note: Reflects the accounting regulation changes of April 2010. Data prior to April 2010 are also retroactively amended.
Source: Made by MHRI based upon Haver.
33
At the same time, Europe is structurally similar to Japan due to the fall of lending in the balance sheet adjustment process. European banks are increasing their holdings of general government bonds amid the decline of their loan–deposit ratios.
Chart 22: The loan–deposit ratio and holdings of general government securities of European banks
900
1,000
1,100
1,200
1,300
1,400
1,500
1,600
1,700
1,800
00 01 02 03 04 05 06 07 08 09 10 11 12
115
120
125
130
135
Outstanding balance of general governmentsecurity holdings
Loan-deposit ratio (right scale, reversed)
(EUR billion)
(CY)
(%)
Note: General government securities include government bonds and state government securities etc. Inter–bank loans and deposits are excluded from the loan–deposit ratio
Sources: Made by MHRI based upon ECB.
The loan–deposit ratios of banks in the foregoing charts may serve as a measure of credit stability and liquidity stability of banks in various areas. Looking back at the second half of the 1990s, the bank crisis – notably that of Japan’s major banking institutions – was a liquidity crisis stemming from the high loan–deposit ratio of banks. The loan–deposit ratios of major Japanese banks back then stood above 100%, leading to a serious liquidity crisis. Currently, the loan–deposit ratios of US and European banks are still higher than that of Japan. In particular, the loan–deposit ratio of European banks is over 100%, indicating that they are vulnerable to changes in the future environment. Furthermore, from a financial regulatory perspective,
34
there are incentives to increase deposits and government bond–holdings as a means to regulate liquidity.
Chart 23 is also a diagrammatic representation we have used since the 1990s to show the money flows in Japan’s balance sheet adjustment process. This chart shows that even when the central bank supplies money through monetary easing, the money is not directed to lending, but is channeled to government bonds (via Route 2) and overseas (via Route 1).
Chart 23: Diagrammatic representation of money flows
Credit crunch
Sources: Made by MHRI.
5. How long will Japanisation continue?
In this section, we shall provide a perspective view on how long Japanisation will continue by looking back at the world subject to this phenomenon. The phenomenon in balance sheet adjustment appears
35
most significantly in the credit contraction accompanying the balance sheet tightening of economic entities which had expanded their leverage. This normally leads to the contraction of bank lending. In turn, this tends to serve as a drag upon the real estate market. In view of these conditions, monetary authorities cut the target interest rate, which in turn serves to prolong its monetary easing policy. Federal Reserve Board Chairman Ben S. Bernanke’s statement to the effect that the federal funds rate will be kept around zero for at least two years may be viewed as a policy response based upon its resolve in view of the prolongation of balance sheet adjustment. The low–for–long policy serves to lower the long–term interest rate under the pure expectations hypothesis of the yield curve. The common phenomenon here is the prolongation of the decline of future expectations.
The subsequent charts set forth below are graphs depicting the real estate markets of Japan and the US by aligning the respective peaks of the credit bubbles in each country. In Japan, the credit bubble peaked around 1990 while the US credit bubble peaked in 2007. Note a surprising similarity between the two graphs. We do not posit that the adjustment processes in the US and Europe will persist for a prolonged period over a decade as in the case of the collapse of the bubble in Japan. Since the US benefits from a better demographic environment in comparison with Japan, the adjustment in the US will take shorter than Japan. However, unlike the 30–40 year cycle previously assumed by market participants, we believe that the adjustment will take longer than expected. Japanisation refers to a longer–than–expected stagnation as in Japan since the 1990s resulting in a socio–political phenomenon and not a market crash like the crash triggered by the failure of Lehman Brothers in 2008. The gradual spread of such recognition among the people of the West provides reason to believe that a shift in market sentiment will occur.
Chart 24 sets forth the publicly announced land price in Japan
36
and the US home price index.The US home price index took its first downturn in 2007 and marked a double–digit year–on–year fall in 2008. Purportedly, US home prices are said to have bottomed out in 2009. The chart shows that the bottom was deeper than the fall at the time of the collapse of the bubble in Japan and that the rebound from such depth led to a recovery in 2010. Moreover, there are rising concerns that the recovery of the residential real estate market may stall once again. The seriousness of Japan’s real estate–led recession stems from the prolonged length of the stagnation rather than the depth of the fall. In view of the lingering balance sheet adjustment pressures in the US household sector, the real estate market may continue to stagnate even after the pace of decline moderates. There are many who indicate that the uncertainties regarding economic conditions in the US stem from the slow recovery of the real estate market. By the same token, the GIIPS in the eurozone also possess problems in the real estate sector.
Chart 24: The publicly announced land price in Japan and the US home price index
(25)
(20)
(15)
(10)
(5)
0
5
10
15
20
25
30
86 88 90 92 94 96 98 00 02 04 06 08 10
Publicly announced land price (residential land, nationwide average)
Case-Shiller Home price Indices (10-city composite)
(Y-o-y % change)
(CY)
Note: Land price trends in Japan (1990) set forth along with land price trends in the US (2007)
Sources: Made by MHRI based upon Bloomberg.
37
Chart 25 sets forth the policy interest rates of Japan, the US and the eurozone. Japan has cut its policy interest rate sharply since 1991. The process of policy interest rate cuts in the US since 2008 has resulted in a graph very similar in shape as Japan’s. While debate on an “exit” arose also in Japan in 1994, a superimposition of the graphs shows that current conditions in the US are very similar to the environment surrounding Japan around that time. In Europe, despite a step forward to an exit by an interest rate hike by the ECB in April 2011, an interest rate cut is now expected under the current conditions.
Chart 25: Trends in policy interest rates (Japan, US, eurozone)
0
1
2
3
4
5
6
7
86 88 90 92 94 96 98 00 02 04 06 08 10
BOJ O/N call rateFF rateECB Repo rate
(%)
(CY)
Note: Policy interest rate trends in Japan (October 1990) set forth along with policy interest rate trends in the US and eurozone (July 2007)
Sources: Made by MHRI based upon Bloomberg.
Likewise, a superimposition of the long–term interest rates of Japan, the US and Germany reveals a similarity among the three countries, leading to the view that long–term interest rates will remain low for a prolonged period also in the US and the eurozone.
Note: Government bond yield trends in Japan (October 1990) set forth along with government bond trends in the US and eurozone (July 2007)
Sources: Made by MHRI based upon Bloomberg.
Chart 27 represents the lending environment in Japan, US and the eurozone. Note that conditions are very similar to Japan where prolonged monetary easing does not lead readily to the expansion of lending. In the background is the financial stance in the corporate sector which is reluctant toward balance sheet expansion and cash hoarding. Looking forward, the banking sector will likely remain cautious toward balance sheet expansion reflecting the tightening of financial regulations.
39
Chart 27: Trends in lending in Japan, US and Europe (o–y–a)
Notes: 1. Data on Japan from Oct 1993 to Sep 1994 are not disclosed. 2. Data on the US are retroactively revised to reflect the accounting rule change in Apr 2010. 3. Data on the eurozone exclude interbank loans. 4. Data on Japan in Oct 1990 are set forth to correspond to data on the US and eurozone in
Jul 2007.Sources: Made by MHRI based upon BOJ, Haver, ECB.
Chart 28 shows conditions in Japan in FY1990 and those of the US and the eurozone in 2007. Here again, the chart shows the similarities in the rise of private sector debt prior to the bubble and the subsequent adjustment.
Chart 28: Trends in private–sector debt (as a percentage of GDP)
80
100
120
140
160
180
200
1980 1985 1990 1995 2000 2005 2010 CY
Japan US Eurozone
Note: 1. Data on the US and the eurozone are on a calendar year basis and data on Japan is on fiscal year basis.
2. “Private–sector” is calculated as private–sector non–financial enterprises + householdsSources: Made by MHRI based upon Haver, Cabinet Office, Eurostat, European Commission.
40
A look at Chart 29 shows a similarity also in the price environment. However, concerns regarding the fall of prices and deflation which intensified in 2010 have receded significantly. Glimpses of an uptick in prices were in fact detected in 2011. In the US, the deterioration of sentiment is relatively benign, unlike the fall of confidence which led Japan into a deflationary spiral from 1995 onward. Basically, the US is characterized by the relative absence of uncertainties regarding deflation. However, we forecast the ebb of inflationary sentiment in the US and the eurozone amid the ongoing credit contraction.
Chart 29: Trends in Japanese and US core CPI and eurozone core HICP (o–y–a)
-1.0
-0.5
0.0
0.5
1.0
1.5
2.0
2.5
3.0
3.5
90 91 92 93 94 95 96 97 98 99
Core CPI (Japan)
Core CPI (US)
Core HICP (eurozone)
(%)
(CY)
Notes: 1. Data on Japan in Oct 1990 are set forth to correspond to data on the US and eurozone in Jul 2007.
2. Japan’s core CPI in 1997 is adjusted to reflect the impact of the consumption tax hike.Source: Bloomberg.
A look at the stock market trends (Chart 30) shows a temporary departure from the similarity till then, triggered by a major stock market rebound in the US and the eurozone from the implementation of monetary easing (referred to as the second round of quantitative easing or “QE2”) in November 2010. However, the unique movement of the stock market among the foregoing series of charts depicting market trends indicates that the stock market rebound in the US and eurozone was due to expectations rather than real economic
41
conditions. The stock market correction from July 2011 onward may be interpreted as a reaction to the surge of the market driven by future expectations.
Chart 30: Stock market trends (Japan, US)
0
50
100
150
200
250
300
86 88 90 92 94 96 98 00 02 04 06 08 10 120
50
100
150
200
250
300
Japan - Nikkei average
US - Dow Jones average (right scale)
Germany -DAX index (right scale)
(End of Jan 1986 = 100)
(CY)
(End of Oct 2002 = 100)
Note: Data on Japan in Oct 1990 are set forth to correspond to data on the US and eurozone in Jul 2007.
Source: Bloomberg.
As indicated in Chart 31, economic growth is continuing to stall in the US and the eurozone just as in Japan’s case since the 1990s.
Chart 31: Trends in real GDP growth (Japan, US, eurozone)
-8
-6
-4
-2
0
2
4
6
8
85 87 89 91 93 95 97 99 01 03 05 07 09
JapanUSEurozone
(%)
(CY
Note: Data on Japan in Oct 1990 are set forth to correspond to data on the US and eurozone in Jul 2007.
Source: IMF, World Economic Outlook April 2011.
42
Just as in Japan in the 1990s, the US and the eurozone are facing a ballooning fiscal deficit since the subprime loan crisis in 2007. The rapid pace of expansion of the fiscal deficit in the US and the eurozone is even faster than in Japan at its fastest pace after the collapse of the bubble.
Chart 32: Trends in fiscal deficits (Japan, US, eurozone)
-14
-12
-10
-8
-6
-4
-2
0
2
4
85 87 89 91 93 95 97 99 01 03 05 07 09
JapanUSEurozone
(% of nominal GDP)
CY
Note: Data on Japan in Oct 1990 are set forth to correspond to data on the US and eurozone in Jul 2007.
Source: IMF, World Economic Outlook April 2011.
The US and the eurozone are only four years into the balance sheet adjustment process which started in 2007 and a deterioration of sentiment is not yet detected. The major dif ference with Japan – which was unable to depend upon external demand due to a sharp appreciation of the yen immediately after the start of the adjustment process – is that the US and the eurozone depended upon external demand. Furthermore, an oft–cited dif ference with Japan lies in demographic conditions. In comparison with Japan, it is true that there are factors which will make the adjustment process relatively faster in the US. Chart 33 sets for th a comparison of the environments in Japan, Europe and the US
43
Chart 33: Four major differences in the balance sheet adjustment processes of Japan, Europe and the US
The forex environment
Deflationary sentiment remains low due to dependence upon
measures to weaken its own currency
Deflationary sentiment remains low due to dependence upon measures to weaken the euro itself. However, imbalances
persist in each of the countries
Rise of deflationary sentiment due to historical appreciation
of the yen in 1995
Overseas environment
Emerging economies
Strong dependence upon economic growth
among emerging economies from the mid-2000 onward.
The weak dollar also benefits dependence
upon overseas economies
Strong dependence upon economic growth among
emerging economies from the mid-2000 onward.
In addition, the possibility to depend upon Eastern Europe also provides the merits of a European
bloc economy. The weak euro also benefits dependence upon overseas
economies
Japan could not depend upon external demand since the
1990s were still too early for the emerging economies
boom. The strong yen is also a
negative factor
Financial system
environment
The fast response to support the financial
system - as a result of lessons learned from Japan – served to halt
the spread of the financial crisis
Slow response to financial system crisis
Slow monetary easing due to concerns regarding inflation
Slow response in providing public funds led to a financial
crisis
Demographic environment
Deflationary sentiment remains low due to an
ongoing optimistic outlook stemming from
the rise of the population and national
character
Deflationary sentiment remains low due to an ongoing optimistic
outlook stemming from the rise of the population and national
character
Sentiment turns completely negative from the mid-1990s
Source: Made by MHRI.
Along with the factors set forth in Chart 33, demographic factors are closely watched by the market, given their significant impact upon balance sheet adjustment.
The demographic conditions of the countries of the world set forth in Chart 34 were taken from material used by Bank of Japan (BOJ) Deputy Governor Kiyohiko Nishimura at a conference in September 2011 (note 4). The “ratio of the working–age population to the non–working–age population”, calculated by dividing the working–age population by the non–working–age population, shows
44
how many working–age persons are needed to support one non–working–age person. Chart 34 shows that the peak was 1990 for Japan and 2005 in the US. Looking back, the peak of the bubble was 1990 in Japan and the peak of the US subprime loan bubble was around 2007. Thus, the demographic peak and peak of the bubble more or less coincide with each other.
Chart 34: The ratio of the working–age population to the non–working–age population (Japan, US)
Note: Based upon data released every five years.Sources: Made by MHRI based upon United Nations World Population Prospects, the
2010 Revision.
Let us provide an outlook on the duration (time axis) of Japanisation in the US and the eurozone. Assuming that Japanisation is an adjustment of the balance sheet, the process in Japan started in 1990 and was more or less settled by mid–2000. Considering that the zero interest rate policy was terminated in 2006, Japan’s balance sheet adjustment process took approximately 16 years. Having said so, it should be noted that a government debt problem still persists. Moreover, private–sector sentiment is sti l l languishing in “deleveraging & deflationary” mode.
Looking forward, the balance sheet adjustment process in the US
45
and the eurozone may persist for a prolonged period, in view of the “synchronized” character of the adjustment where Europe and the US – the major areas of the world – face an adjustment at the same time, and the limits to how much they can depend upon external demand. Furthermore, even though the US is better–positioned than Japan in terms of demographics, the fact remains unchanged that demographic conditions in the US and Europe are past the peak just like Japan and that the balance sheet adjustment process will require a certain period of time.
Indeed, it is true that much of the recovery since 2009 after the collapse of Lehman Brothers depended upon, and will continue to depend upon, growth among the emerging economies outside the sphere of the major economic powers of Japan, the US and Europe. However, judging from the limited size of the emerging economies, the odds are high that we will continue to see a recurrence of booms and subsequent backlashes.
In the US, we expect the adjustment process to continue until the mid–2010s in view of the fact that the US enjoys the benefit of (1) the easiness of currency adjustments, (2) the use of global markets for political and militar y purposes, and (3) relatively advantageous demographic conditions compared to Japan. However, note that the adjustment may require another four to five years from the foregoing outlook.
In Europe, in contrast, the adjustment may require more time than the US and continue until the late 2010s due to (1) the slow debt adjustment process in comparison to the US, (2) the constraints upon currency adjustment of the single currency euro, (3) the existence of constraints also in terms of policy responses.
Thus, even though the adjustment may not require as much time as in Japan’s case, we expect the adjustment process to last a period of time equivalent to the “Lost Decade”, based upon the assumption that the adjustment process star ted in 2007. Moreover, in consideration of the “synchronized nature” of such adjustments taking place at the same time in the relevant countries, the adjustment process may even take longer.
46
6. Implications of Japanisation upon investment
In this section, we shall examine how Japanisation will affect the investment environment. For this purpose, we shall first look at monetary policy as a pre–condition for the investment environment.
Let us look at US monetary policy from the perspective of its “time–axis policy”. The Japanisation phenomenon in monetary policy is the prolonged state of monetary easing centering upon the “time–axis policy” (which promises to keep an accommodative monetary policy stance until some point in the future).
Japanisation has a major impact upon the valuation of financial products. Given that “expectations” have a large impact upon the price formation of assets such as equities and real estate, the decline of such expectations leads to price adjustments of assets. The decline of future expectations in the valuation of equities has a negative impact upon prices. Meanwhile, it also leads to a tendency to shift assets to bonds.
Turning to bonds, prolonged low interest rate levels and confidence in the “time–axis policy” lead investors to an emphasis upon “carr y” in investment to secure the long– and short–term interest rate differential. Hence, the rise of an investment strategy where “cash is king” and “carry is queen”. Even though the strategy placing emphasis upon “carr y”, holding massive amounts of government bonds was once said to be a unique investment behavior of Japanese banks, the same behavior may spread to European and US banks.
Investment behavior in Japanisation
Stock market correction due to decline of future expectationsAsset allocation shifts from equities to bondsEmphasis upon “carry” in bond investment, reflecting the “time–axis policy”
47
Ever since the second half of the 1990s, major Japanese investors have raised the percentage of government bond (JGB) holdings and reduced the percentage of equities in their investment portfolios. Charts 35, 36, and 37 show the trends in percentages of JGB and equity–holdings in the portfolios of Japanese banks, life insurance companies and pension funds. Note the ongoing trend to lower the percentage of equities and raise the percentage of JGBs among all these entities since the second half of the 1990s.
Chart 35: Trends in ratio of JGBs and equities in securities portfolios of Japanese banks
0
10
20
30
40
50
60
70
83 85 87 89 91 93 95 97 99 01 03 05 07 09 11
JGB ratioEquity ratio
(FY)
%
Note: 6–month average.Source: BOJ, Assets and Liabilities of Financial Institutions, etc.
Chart 36: Trends in ratio of JGBs and equities in securities portfolios of Japanese life insurance companies
0
5
10
15
20
25
30
35
40
45
96 99 02 05 08 11
JGB ratioEquity ratio
FY
(%)
Note: Excludes Japan Post Insurance Co. 6–month averageSource: The Life Insurance Association of Japan, Summary of Life Insurance Business
48
Chart 37: Trends in ratio of JGBs and equities in securities portfolios of Japanese pension funds
0
5
10
15
20
25
30
35
97 00 03 06 09
JGB ratioEquity ratio
(%)
(FY)
Source: BOJ, Flow of Funds Accounts.
Shifts are detected in the asset allocation of European and US investors. Chart 38, which shows the change in asset allocation among European and US investors, reveals that since 2007, they are reducing the percentage of equities and raising the percentage of bonds in their portfolios much like the behavior among Japanese investors.
Chart 38: Trends in asset allocation among European and US investors
45
50
55
60
65
70
03 04 05 06 07 08 09 10 1125
30
35
40
45
Bond ratio(Right scale)
(%) (%)
Equity ratio
Source: Made by MHRI based upon Reuters
49
While Chart 39 shows the cash ratios of European and US investors, Chart 38 indicates that investors are raising their cash ratios even while reducing the percentage of equity–holdings in their portfolios. Amid instable market conditions, investors in the US and Europe are maintaining cash–rich positions so that they may be ready for any investment opportunities. This appears to indicate a deep–seated belief that the current adjustment is temporary and, that investors wish to return to risk assets once the market returns to its previous trend. However, should such expectations ebb, we would naturally see a shift in investment stance.
Chart 39: Trends in cash ratios among European and US investors
3.0
4.0
5.0
6.0
7.0
8.0
9.0
03 04 05 06 07 08 09 10 11
( )
Source: Made by MHRI based upon Reuters, Bloomberg.
Let us turn to the investment behavior of financial institutions –mainly with respect to banks. In doing so, we shall focus upon the interest rate differential between short–term and long–term interest rates. Theoretically, long–term interest rates may be broken up into short–term interest rates and the long–term and short–term interest rate differential. Assuming the federal funds rate (FF rate) to be the short–term interest rate,
Assuming that the current FF rate level is zero, the long–term and short–term interest rate differential would be 2.0%. A look back at the long–term and short–term interest rate differential in the US during the past 60 years reveals that the average interest rate dif ferential between long– and short–term interest rates was not even 1%, at 0.98%. The current 2% interest rate differential is double the average during the past 60 years.
Chart 40: Short–term and long–term interest rate differential (US)
Gap between long and short-term interest rates (right scale)Federal Funds rate (left scale)10-yr Treasury bond yield (left scale) Average: 98bp
Sources: Made by MHRI based upon Haver.
Despite the low level of the US long–term interest rate itself, the level of the interest rate differential between long–term and short–term interest rates is quite high. Then, it follows that it is the FF rate – the policy interest rate – that is “too low”. Thus, if market participants are cautious about higher prices of US treasury bonds,
51
what should really be watched closely is the rise of the FF rate which is “too low”. However, FRB Chairman Ben S. Bernanke set forth a time–axis policy of keeping the FF rate unchanged for two years from August 2011. Therefore, given the high probability of the FF rate being unchanged at the current level, it would be dif ficult to argue that the current long–term interest rate level of 2% is “too low”.
If the policy interest rate is interpreted as the funding rate of financial institutions (mainly banks), the interest rate dif ferential between long–term and short–term interest rates would refer to the income generated through carry trades. From the 2000s onward, we have likened government bond investment to a dietary staple such as rice for financial institutions. In this analogy, the taste of rice refers to the long–term and short–term interest rate differential. During the balance sheet adjustment since the 1990s, the largest revenue source for Japanese financial institutions was the carr y income stemming from the long–term and shor t–term interest rate differential earned through investment in government bonds. Why did US banks fail to acquire a taste for “rice (or a dietary staple such as bread)”, namely carry income from the long–term and short–term interest rate differential?
Chart 40 shows an intermittent rise of the long–term and short–term interest rate differential even from the 2000s, reaching nearly 4% at the peak. Why did government bond investment fail to rise among US banks even amid these conditions? Despite the large interest rate differential, US banks most likely believed that there are more profitable investment options. In other words, even though the taste of “rice (or bread)” was considered favorable, there were much more attractive options, such as “steak”. From the 2000s, there were investment options with high expected yields such as credit derivatives among securitized products, lending in retail banking and stock investment for institutional investors. Given such an abundant array of attractive options, no wonder that “rice (or bread)” was considered unpalatable. In contrast, in Japan, the lack of lending options and credit derivatives made “rice” the only means to gain sustenance.
52
A central issue of this paper is the assumption that US banks will acquire a taste for carry income from the long–term and short–term interest rate differential if the expected rate of return of alternative investment options declines. US banks will have no choice but to eat “rice (or bread)” which were once shunned as being “tasteless”. Moreover, from the perspective of the taste of rice (or bread) in the US, note that there could be a new–founded recognition that the current “taste” – or the long–term and short–term interest rate differential of 2% – is more than double the average.
“Cash is king, carry is queen” has been a long–standing aphorism in the capital market. However, in the age of Japanisation, carry may succeed as king, resulting in a world where “carry is king” on a global level. Such conditions reflect the fall of the expected earnings rate and the decrease of alternative investment options with high expected earnings on a global level.
Meanwhile, if we assume the overnight (ON) call rate – the Japanese policy interest rate – to be the short–term interest rate,
Based upon the current level of the ON call rate (0.15%), the long–term and short–term interest rate differential would be 0.9%. A look at the trends in the long–term and shor t–term interest rate differential in Japan during the past 30 years, the current 0.9% level falls below the past average.
53
Chart 41: Short–term and long–term interest rate differential (Japan)
0
2
4
6
8
10
12
14
1980 1985 1990 1995 2000 2005 2010-500
-400
-300
-200
-100
0
100
200
300
400
500Gap between long and short-term interest rates (right scale)Call rate (left scale)10-yr JGB yield (left scale)
(CY)
(%) bp
Average: 96bp
Notes: 1. The secured call rate up to June 1985. The overnight call rate is unsecured from then onward.
2. The 10–yr JGB yield is the highest yield on 10–yr bonds up to December 1984 and the yield on newly–issued bonds from then onward.
Sources: Made by MHRI based upon BOJ, Bloomberg.
The investment model of Japanese banks from the mid–1990s was based upon securing the long–term and short–term interest rate differential above the historical average of 1%. Even in terms of the I–S balance mentioned before, banks continued to depend upon government bond investment amid the decline of lending. That said, as long as the long–term and short–term interest rate differential is at a level of 0.9%, this would not necessarily be sufficient as a risk premium. Thus, government bond investment would remain jittery under an absolute level of 1%.
In terms of the I–S balance above, the sectors with demand for funds are the government sector and the overseas sector. Here, it should be noted that the expected yields on overseas assets may be falling. The rise of Japanese interest rates from the 2000s onward was driven mainly by the improvement of expected yields mainly overseas and that this was due primarily to the gap in nominal growth rates between Japan and the overseas economies. Note also
54
that the strength of the dollar persisted during this period.
T ur ning to the institutional aspect, as indicated in the diagrammatic representation in Chart 42, the impact upon life insurance companies and pension funds – business entities holding long–term debt – requires attention. In terms of pension funds, a crisis may occur due to the difficulty to realize payouts committed to on a long–term basis. In the asset liability management (ALM) of pensions, a gap would arise between the burden of pension benefit payouts committed on the debt side and the yields on the asset side. The same also applies to the social security system and health insurance system of developed countries.
Chart 42: Diagrammatic representation of pension fund ALM
Pension fund ALMCapital DebtReality Ideal
Pension fund crisis
Gap betweenexpectations and
reality
Profitability of assetsin reality
Commitment tohigh yieldexpectations(past track record) Reduction of expectation level
Reduction of benefits
Source: Made by MHRI
The global economy portrayed by the foregoing accounts faces a grim reality. However, it has been customary for human society to resort to “a shot in the arm” or anesthetics in order to ease the “pain” of such a grim reality. The nature of the economic policy measures
55
implemented in the US and the eurozone during the past four years is of this character. Given the regulator y constraints upon investment behavior, a sharp shift is unlikely. However, amid the contraction of money flows, the odds are high that the investment stance in the US and the eurozone will tend to shift toward bond carry trades based upon the view that interest rates will remain low for a prolonged period.
7. The global spread of Japanisation
Japanisation – the subject of this paper – is a phenomenon of credit contraction in the course of balance sheet adjustment. The current juncture is characterized by its synchronized nature where the Japanisation phenomenon tends to unfold simultaneously around the world. In view of the foregoing events, the global events which could develop is the contraction of the US–driven engine which provided the world with demand for real goods and intentional restraints upon expansion in the financial sector, leading to limitations in the current trend toward expansion of the frontier to the emerging economies.
Fur thermore, the separate decisions made by each of the government authorities will result in stronger downward pressures upon the economy through a “fallacy of composition”. In the implementation of new policy measures, government authorities calculate the policy impact based upon the presumption of ceteris paribus, that all other factors are equal or held constant. The central concept here is that of a “partial equilibrium”. In the event all other government authorities take policy steps in a simultaneous fashion, the forecast of a “general equilibrium” would be difficult.
In particular, during the period prior to and after the bubble, each of the relevant countries would be compelled to take financial support measures after the collapse of the bubble and would be
56
necessar y to justify such steps in the political process. In the injection of public funds toward financial institutions, it would be necessary to set forth “measures to prevent a recurrence” toward the people. In other words, in a “reflection” to the massive public fund injections subsequent to the collapse of Lehman Brothers in 2008 in the US and the eurozone, the implementation of new financial regulations would be necessary as a political ritual.
However, discussions on the implementation of financial regulations have created a credit crunch in the course of the balance sheet adjustment process. There is a possibility that a new set of financial regulations would result in the acceleration of the credit crunch. In particular, in terms of the financial system, it should be noted that the series of financial regulatory measures will have a “procyclical ef fect” which leads to the aggravation of the credit crunch. Today, the monetary policy authorities of the world must discuss “prevention measures” to avoid a recurrence of the conditions which led to the excessive credit expansion up to 2007. However, quite ironically, the institutionalization and implementation of financial regulations just at the time when a credit crunch had star ted due to balance sheet adjustment, is making a fur ther contraction of credit all the more likely. In other words, Japanisation in the course of financial system measures is biased toward a further credit crunch due to bubble prevention measures.
At the same time, it is also necessar y to take note of the synchronized nature of the global macroeconomic environment. As mentioned before, the prescription for balance sheet adjustment consists of the three basic principles of balance sheet composition – debt substitution, support measures through currency devaluation, and improvement of future expectations. In many cases, the measures depend upon support from other countries. Given the stagnation of domestic demand due to a credit crunch stemming from balance sheet adjustment, measures to address the problem would have to depend upon external demand. Furthermore, in the substitution of debt, most cases rely upon support by other countries (burden upon other countries), making countries such as Japan
57
where the debt substitution occurs within the country a rare case.Chart 43, comparing the past balance sheet adjustment
processes, shows that debt substitution by other countries is the easiest in a case where the subject of balance sheet adjustment is a small country and that the neighboring countries enjoy favorable economic conditions. Stated dif ferently, the larger the economic power of the supporting country compared with the debt of the country receiving support, the smoother the overseas–dependent balance sheet adjustment process. The economic crises of Northern European countries in the early 1990s and the Asian financial crisis in the second half of the 1990s are past examples of balance sheet adjustments. Both cases involved relatively small countries, making an external demand–dependent recovery accompanying currency devaluations possible due to the existence of large economic powers among its neighbors.
Chart 43: Balance sheet adjustment (past cases)
Northern
European crisis Early 1990 Small
Surge of demand related to
unification of Germany
Improvement in short
term by currency
devaluation
Asian financial
crisis 1997 Small
IT bubble in the US and
Europe
Improvement in short
term by currency
devaluation
Argentine crisis 2001 Small Economic bubbles in the
US and Europe
Improvement in short
term by currency
devaluation
Collapse of
bubble in Japan 1990 onward Large
Helped by the US and
European economic
bubbles from 2000
Long-term
Collapse of
bubble in the US
and Europe
2007 onward Super-
power
Only the emerging
economies Long-term
Source: Made by MHRI
58
As indicated in Chart 43, the fact that the balance sheet adjustment since 2007 is proceeding in the largest country and area of the world (the US and the eurozone) makes it difficult to depend upon external economies to weather the adjustment process (note 5). The foregoing perspective is an example of a “fallacy of composition” from a geographical aspect. The sharp rise of expectations in the US and Europe toward the emerging countries and likewise, the rise of expectations upon the G20 from the G7 in global politics, are natural consequences of the necessity to expand the entities providing support in the balance sheet adjustment process.
Lastly, let us look at the ripple effect of Japanisation upon society and politics. Balance sheet adjustment occurs as a result of a gap between expectations and reality. Namely, it is created out of a divergence between (1) expectations based upon past trends and systems based upon the foregoing, and (2) reality. As a result, the gap between expectations and reality leads to social dissatisfaction and political unrest. Put differently, the “divergence” between the expectations held by the general public based upon past trends during the bubble and reality where asset prices have fallen, tends to breed opposition toward r uling political par ties and social dissatisfaction. While Japan’s political instability is ver y often attributed to a qualitative issue of Japanese politicians, we have held the view that it stems from an intrinsic gap between expectations and reality in the balance sheet adjustment process.
Chart 44: Diagrammatic representation of the gap between expectations and reality
Gap betweenexpectationsand reality
PopulismBenefits (expectations)
along conventional trends
Skew after collapse of bubble (reality)Social dissatisfaction,political destabilization
Sources: Made by MHRI.
59
Looking for ward, Japanisation may por tend socio–political instability in the US and Europe. The concentration of government leadership elections in many of the countries in 2012 possesses the tendency for further political destabilization and rise of populism.
As indicated in Chart 44, balance sheet adjustment symbolized by Japanisation stems from a gap between expectations and reality. The US and the eurozone, which have stepped into balance sheet adjustment from 2007, will most likely follow a process of successive “shots in the arm” in a bid to satisfy expectations.
Japan has also followed a similar process ever since the collapse of the bubble in 1990, administering successive “shots in the arm” to return to a trend to satisfy expectations. Note also that politicians are still continuing to issue empty promises to serve such expectations. However, the failure to meet such empty promises has only led to a revolving door of successive short–tenure prime ministers.
The Japanese poli t ical process has responded to such expectations by a power shift from one political party to another every few years or so. In the meantime, the people of Japan resorted to a survival strategy given the gap between expectations and reality and the recurrence of frustrated ideals. Amid the entry into an unprecedented economic environment from the 1990s, the strategy consisted of an “evolution” to sur vive in an environment where dreams and ideals are perpetually thwarted. The strategy was to take an “evolved” behavioral pattern to survive in a diminishing equilibrium by lowering levels of expectation. In terms of financial behavior, it refers to deleveraging among corporate enterprises, a deflationary sentiment in terms of prices, and a general shift in mood among individuals referred to as “herbivores” in Japan (note 6). This presents a major shift if the prevailing mood in Japan up to the bubble was one of leverage expansion, inflationary sentiment and an “economic animal” driven by animal spirits. By transforming oneself into such an “evolved entity”, the Japanese have built a domestic order in self–defense and have maintained stability even in times of political turmoil.
Just as in Japan, the balance sheet adjustment process in the US and the eurozone is a process of evolution into “herbivores”. Namely, Japanisation is a process of evolution into herbivores. Having said so, in reality there are plenty of “carnivores” (note 7) in the US and around the world, who are committed to past expectations. For carnivores, the survival strategy in a world of diminished domestic demand would be to expand into markets of other countries even at the expense of those countries. Despite Japan’s evolution into herbivores, dif ficulties remain due to the existence of numerous carnivores beyond its borders.
Even so, note that Japan possesses relative soundness. In the US and the eurozone, there is a sense that their arsenals have been depleted, due to a renewed awareness regarding the heavy weight of balance sheet adjustment upon their economies, the difficulty to take fiscal policy measures due to the sovereign debt crisis, and the difficulty to take further financial system support measures in view of the demonstrations against European and US banks. In contrast, Japan has much more leeway in its environment making it just about the only country in the world that will take an expansionary fiscal policy in 2012.
The markets of the US and Europe are stepping into uncharted territory in post–WWII history due to balance sheet adjustment. Japan has “matured” and “evolved”, having survived life in uncharted territory for more than a decade since the 1990s. Running foremost in the Japanisation phenomenon, Japan has evolved as a result of a
61
prolonged balance sheet adjustment process. If the US and Europe are moving into a “glacial age” of prolonged credit contraction accompanying balance sheet adjustment, it would mean their evolution to survive such an environment.
Chart 46: A conceptual reversal in the shift from a credit expansion to credit contraction phase
As shown in Chart 46, during a global credit expansion such as the period up to 2007, Japanese companies and financial institutions – being herbivores and in a state of deleveraging – were continually dismissed as being unable to generate profit or growth. Japan was viewed as an idiosyncratic island of stagnation akin to the “Galapagos Islands” and subjected to years of disregard, or, “Japan passing”. However, in the ongoing credit crunch in the US and eurozone, Japan is the only “herbivore” that has “evolved” to adapt to such a “glacial” environment.
Moreover, Japan still possesses stable funds and technology. In a reversal of thought, we may even see a renewed interest in Japan in 2012. A reversal of thought on the part of Japan could also enable it to use the current strength of the yen to utilize overseas assets which were sold of f in the course of the credit crunch.
62
Furthermore, the year 2012 could hold the possibility of Japanese corporate enterprises to take strategic steps based upon such recognition.
Despite the use of the term Japanisation by the western media, the awareness on Japanisation is most likely still limited in the US. Even if uncertainties regarding Japanisation should arise in the US, most Americans would still think of it as an improbable scenario. Furthermore, the odds are high that the balance sheet adjustment theory is not yet widespread in the US. The emphasis upon “flow” rather than “stock” will not change readily either. The US is only four years into its balance sheet adjustment process which started in 2007 in the subprime loan crisis. Looking back at 1994 – four years after the collapse of the bubble in Japan in 1990 – Japan’s awareness of its balance sheet problem was also weak. Just as in the current US consensus scenario, many in Japan thought that the economy would star t to pick up from the following year. This time, in 2012, we believe that the global spread of awareness on Japanisation will start to have an impact upon various facets and corners of the world.
References
Kobayashi, Keiichiro (2011), “Kotekikikan no kaizai de hisai–kigyo no saimu sakugen wo isoge” (Facilitate the debt reduction of disaster–hit corporate enterprises through inter vention by public institutions), KINZAI Institute for Financial Affairs, Inc., Shukan Kinyu Zaisei Jijo, March 16, 2011, No. 2930
Nishimura, Kiyohiko G. (2011), Macro–Prudential Policy Framework from an Asian Pespective, Speech at ADBI–FSA Conference in Tokyo, September 3, 2011, Bank of Japan
63
Reinhart, Carmen M. and Kenneth S. Rogoff, (2009), This Time Is Different: Eight Centuries of Financial Folly, Princeton University Press
Takata, Hajime (2011), “Kako nikai no daishinsai no 3kyotsuten, ‘endaka defure, kinyukiki, seijifuan’ wa kaihikano ka – baransu sheeto mondai ni fukaketsu na sanmi–ittai gensoku” (The three common aspects of the past two major earthquakes – can ‘strong yen deflation, financial crisis, political instability’ be avoided?), in Shinsai, fukko ni taisuru shijo karano teigen – shoken anarisuto no tachiba kara (Recommendations on post–earthquake recovery – from the standpoint of securities analysts), The Securities Analysts Association of Japan, June 17, 2011
Takata, Hajime and Takeshi Shibasaki (2003), Kinyu fukyo dasshutsu (Escape from financial recession), Nikkei Publishing Inc.
Takata, Hajime, Takeshi Shibasaki, and Tetsuo Ishihara (2010), Sekai kokusai boraku – sekai wo mushibamu nihonkagensho (Global government bond crash – the Japanisation phenomenon eroding the world), Toyo Keizai Inc.
Takata, Hajime and Kazuhiko Yano (2011), “2016nen madeno no naigai keizai chuuki mitooshi – ‘beikoku ni tayorenai jidai’, nihon wa mada ‘motteiru kuni’” (The medium–term economic outlook – an age without dependence upon the US, Japan still has it), Mizuho Research Institute Ltd., October 21, 2011
Yano, Kazuhiko (2011), “Nihonka ga amerikan doreemu wo obiyakasu” (Japanisation is a threat to the American dream), Economist Eyes, Mizuho Research Institute Ltd., October 17, 2011
International Monetar y Fund, (2011), Global Financial Stability Report, September
64
Mizuho Research Institute Ltd. (2011a), FY2011 and FY2012 Economic Outlook, Mizuho Research Institute Ltd., August 17, 2011
Mizuho Research Institute Ltd. (2011b), FY2011 and FY2012 Economic Outlook (REVISED to reflect the 2nd QE for the Apr–Jun Qtr of 2011), Mizuho Research Institute Ltd., September 8, 2011
* * * * * * * * * *
(Endnotes) 1 Takata and Shibasaki (2003) 2 The deposit closure was implemented after WWII under the authority of the GHQ by
Potsdam decree through supra–political process without Diet passage. Meanwhile, the implementation today under normal political processes would lead to an outflow of deposits and capital flight amid the passage of time. The same difficulty also applies in the discussions regarding Greece’s exit from the eurozone.
3 Refers to the following member countries of the European Union which are said to
be have weak fiscal health: Greece, Italy, Ireland, Portugal and Spain
4 Kiyohiko G. Nishimura (2011), “Macro–Prudential Policy Framework from an Asian Perspective” (Bank of Japan, September 30, 2011, http://www.boj.or.jp/announcements/press/koen_2011/ko110930b.html/ )
5 Paul Krugman, Nobel laureate in economics, commented that when the US – the world’s largest economy – adjusts, it would have to depend on support not “on earth” but upon “space aliens”, in reference to the difficulty of the balance sheet adjustment process in the US.
6 The trend was reported by overseas media as “Japan’s herbivore men”. 7 “Carnivorous” or “predatory” in adjective form
Nittochi Uchisaiwaicho Building 2-1, Uchisaiwaicho 1-chome, Chiyoda-ku, Tokyo 100-0011TEL: (03) 3591-1241FAX: (03) 3591-1399http://www.mizuho-ri.co.jp/english/index.html