76
Mobile Digest of Education Statistics, 2014
| Date post: | 29-Apr-2018 |
| Category: |
Documents |
| Upload: | nguyenmien |
| View: | 214 times |
| Download: | 0 times |

Mobile Digest of Education Statistics, 2014

Suggested Citation: Snyder, Thomas D. (2016). Mobile Digest of Education Statistics, 2014 (NCES 2016-011). National Center for Education Statistics, U.S. Department of Education. Washington, DC.
Mobile Digest of Education Statistics 2014
A u g u s t 2 0 1 6
Thomas D. Snyder National Center for Education Statistics
U . S . Department o f E d u c a t i o n N C E S 2 0 1 6 - 0 1 1
U.S. Department of Education John B. King, Jr., Secretary Institute of Education Sciences Ruth Neild, Deputy Director for Policy and Research Delegated Duties of the Director National Center for Education Statistics Peggy G. Carr, Acting Commissioner The National Center for Education Statistics (NCES) is the primary federal entity for collecting, analyzing, and reporting data related to education in the United States and other nations. It fulfills a congressional mandate to collect, collate, analyze, and report full and complete statistics on the condition of education in the United States; conduct and publish reports and specialized analyses of the meaning and significance of such statistics; assist state and local education agencies in improving their statistical systems; and review and report on education activities in foreign countries.
National Center for Education Statistics Institute of Education Sciences U.S. Department of Education 550 12th Street, SW Washington, DC 20202
August 2016 The NCES Home Page address is http://nces.ed.gov.

iii
Contents Page
Foreword ..................................................................... v Overview ................................................................... vi The Structure of American Education.................. vii Enrollment ............................................................................... 1 Elementary and Secondary Schools ........................... 2
Public Schools .............................................................. 2 Private Schools ............................................................. 3 Projections .................................................................... 4 Prekindergarten and Kindergarten Enrollment .............. 5 Enrollment Rates .......................................................... 6 Enrollment by Race and Ethnicity ................................ 7 Enrollment in Programs for Children With Disabilities . 8
Degree-Granting Institutions ......................................... 9 College Enrollment ....................................................... 9 Enrollment by Level and Attendance .......................... 10 Enrollment Rates of 18- to 24-Year-Olds ................... 11 Enrollment by Sex and Age ........................................ 12 Enrollment by Race and Ethnicity .............................. 13 Undergraduate Enrollment .......................................... 14 Postbaccalaureate Enrollment ..................................... 15
Teachers, Faculty, and Staff ............................... 17 Elementary and Secondary Schools ......................... 18
Number of Teachers .................................................... 18 Teachers’ Salaries ....................................................... 20 Teacher Characteristics, Public Schools ..................... 21 Teacher Characteristics, Private Schools .................... 22
Degree-Granting Institutions ....................................... 23
iv
Page College Staff ............................................................... 23 Faculty Salaries for Males and Females ...................... 24 Faculty Salaries at Public and Private Institutions ...... 25
Educational Outcomes ................................................. 27 Reading Performance .................................................. 28 Mathematics Performance .......................................... 29 Science Performance ................................................... 30 High School Coursetaking Patterns ............................ 31 Graduates .................................................................... 33 Dropouts ..................................................................... 35 College Degrees .......................................................... 36 Educational Attainment .............................................. 39
Finance .................................................................................. 41 Total Expenditures ..................................................... 42 Public Elementary and Secondary Schools ............ 44
Revenues ..................................................................... 44 Expenditures ............................................................... 46
Degree-Granting Institutions ..................................... 47 Revenues for Public Institutions ................................. 47 Revenues for Private Nonprofit Institutions ................ 48 Revenues for Private For-Profit Institutions ............... 49 Expenditures of Public Institutions ............................. 50 Expenditures of Private Nonprofit Institutions ........... 51 Expenditures of Private For-Profit Institutions ........... 52 College Costs .............................................................. 53 Financial Aid for Students .......................................... 54 Federal Funding .......................................................... 56
Source Information ............................................................. 58 NCES Website Tools ............................................................ 65

v
Foreword Welcome to the second edition of the Mobile Digest of Education Statistics. This compact compilation of statistical information covers prekindergarten through graduate school to describe the current American education scene. The Mobile Digest is designed as an easy mobile reference for materials found in detail in the Digest of Education Statistics, 2014.
The Digest includes selections of data from many government sources, especially those of the National Center for Education Statistics (NCES). The Digest includes information on schools and colleges, enrollments, teachers, graduates, finances, and educational outcomes. Unless otherwise stated, all data are extracted from the Digest of Education Statistics, 2014 (http://nces.ed.gov/programs/digest/). Unless indicated as a projection or estimate, all data presented in this report are actual. Information on statistical procedures, definitions, and survey sources appears in the introduction, and appendixes A and B of the Digest of Education Statistics, 2014.
For more information on education statistics, please go to http://nces.ed.gov. For further detail on the tools available through the NCES website, go to page 65 of this publication.

vi
Overview In the fall of 2014, about 85.1 million people in the United States were either enrolled or employed in public and private schools and colleges (Digest of Education Statistics, 2014, table 105.10). Included in this total were 75.2 million students enrolled in American schools and colleges.1 About 4.6 million people were employed as elementary and secondary school teachers or as college faculty, as measured in full-time equivalents (FTE). Other professional, administrative, and support staff of educational institutions totaled 5.3 million. In a nation with a population of about 319 million in 2014, more than 1 out of every 4 people participated in the education system (Digest of Education Statistics, 2014, table 106.60).
1 Tables in this report on elementary and secondary schools do not include data on homeschooled children. In 2012, there were 1.8 million home-schooled children (Parent and Family Involvement in Education, From the National Household Education Surveys Program of 2012, NCES 2013-028).

vii
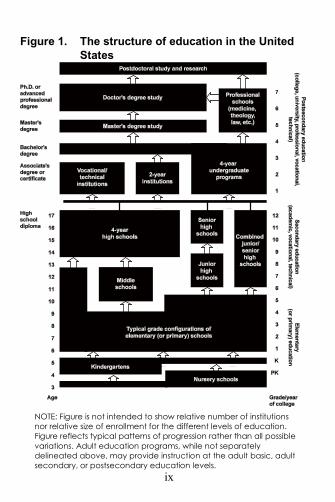
The Structure of American Education Figure 1 shows the structure of education in the United States: the three levels of education—elementary, secondary, and postsecondary—and the approximate age range of people at the elementary and secondary levels. Students ordinarily spend 6 to 8 years in the elementary grades, which may be preceded by 1 to 3 years in early childhood education programs and kindergarten. The elementary program is frequently followed by a middle school or junior high school program, which generally lasts 2 or 3 years. Students then may finish their compulsory schooling at the secondary or high school level, which may last 3 to 6 years depending on the structure within their school district. Students normally complete the entire program through grade 12 by age 18.
High school completers who decide to continue their education may enter a career or technical institution, a 2-year college, a 4-year college, or a university. A 2-year college normally offers the first 2 years of a standard 4-year college curriculum and a selection of career and technical programs.
Academic courses completed at a 2-year college are usually transferable for credit at a 4-year college or university. A career or technical education institution offers postsecondary technical training leading to a specific career.

viii
The term “degree-granting institutions” used in this report refers to colleges and universities that offer associate’s or higher degrees and whose students are eligible to participate in Title IV federal financial aid programs.
An associate’s degree requires the equivalent of at least 2 years of full-time college-level work; a bachelor’s degree normally can be earned in 4 years. At least 1 year beyond the bachelor’s is necessary for a master’s degree, while a doctor’s degree usually requires a minimum of 3 or 4 years beyond the bachelor’s.
Professional schools differ widely in admissions requirements and in program length. Medical students, for example, generally complete a 4-year program of premedical studies at a college or university before they can enter the 4-year program at a medical school. Law programs normally require 3 years of coursework beyond the bachelor’s degree level.
Other types of educational opportunities for adults are offered by community organizations, libraries, religious institutions, and businesses.
ix
Figure 1. The structure of education in the United States
NOTE: Figure is not intended to show relative number of institutions nor relative size of enrollment for the different levels of education. Figure reflects typical patterns of progression rather than all possible variations. Adult education programs, while not separately delineated above, may provide instruction at the adult basic, adult secondary, or postsecondary education levels.

1
Enrollment

2
Elementary and Secondary Schools Public Schools Overall, public school enrollment increased 27 percent between 1985 and 2014. Elementary (prekindergarten through grade 8) enrollment rose from 27.0 million in fall 1985 to a projected 35.2 million in fall 2014, an increase of 30 percent. In the secondary grades (9 through 12), the net result of changes in enrollment over the same period was a 20 percent increase.
Table 1. Enrollment in public elementary and secondary schools: Selected years, fall 1985 through fall 2014
[In thousands]
Year Total
Elementary (prekindergarten through grade 8)
Secondary (grades 9
through 12) 1985 39,422 27,034 12,388 1990 41,217 29,876 11,341 1995 44,840 32,338 12,502 2000 47,204 33,686 13,517 2005 49,113 34,204 14,909 2008 49,266 34,286 14,980 2009 49,361 34,409 14,952 2010 49,484 34,625 14,860 2011 49,522 34,773 14,749 2012 49,771 35,018 14,753 20131 49,942 35,188 14,754 20141 49,986 35,159 14,826 1 Projected. NOTE: Detail may not sum to totals because of rounding. Some data have been revised from previously published figures.
3
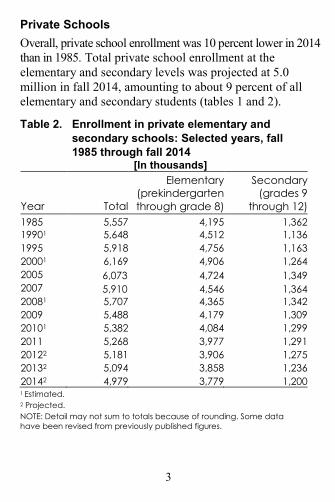
Private Schools Overall, private school enrollment was 10 percent lower in 2014 than in 1985. Total private school enrollment at the elementary and secondary levels was projected at 5.0 million in fall 2014, amounting to about 9 percent of all elementary and secondary students (tables 1 and 2).
Table 2. Enrollment in private elementary and secondary schools: Selected years, fall 1985 through fall 2014
[In thousands]
Year Total
Elementary (prekindergarten through grade 8)
Secondary (grades 9
through 12) 1985 5,557 4,195 1,362 19901 5,648 4,512 1,136 1995 5,918 4,756 1,163 20001 6,169 4,906 1,264 2005 6,073 4,724 1,349
2007 5,910 4,546 1,364 20081 5,707 4,365 1,342
2009 5,488 4,179 1,309 20101 5,382 4,084 1,299 2011 5,268 3,977 1,291 20122 5,181 3,906 1,275 20132 5,094 3,858 1,236 20142 4,979 3,779 1,200 1 Estimated. 2 Projected. NOTE: Detail may not sum to totals because of rounding. Some data have been revised from previously published figures.

4
Projections Fall 2014 enrollment marked a new record for total public school enrollment, according to projections. Public elementary enrollments are expected to continue increasing, with an overall increase of 7 percent between 2014 and 2024. Secondary enrollment is expected to increase 4 percent between 2014 and 2024.
Table 3. Projected enrollment in public elementary and secondary schools: Fall 2014 to fall 2024
[In thousands]
Year Total
Elementary (prekindergarten through grade 8)
Secondary (grades 9
through 12) 2014 49,986 35,159 14,826 2015 50,094 35,182 14,912 2016 50,229 35,282 14,947 2017 50,584 35,595 14,989 2018 50,871 35,856 15,015 2019 51,183 36,125 15,058 2020 51,547 36,366 15,182 2021 51,910 36,587 15,324 2022 52,260 36,839 15,421 2023
52,601 37,223 15,378 2024 52,920 37,615 15,304 NOTE: Detail may not sum to totals because of rounding.

5
Prekindergarten and Kindergarten Enrollment In 2013, about 65 percent of 3- to 5-year-olds were enrolled in prekindergarten or kindergarten programs. About 60 percent of these children in prekindergarten and kindergarten programs attended a full-day program, up from 53 percent in 2000.
Table 4. Enrollment of 3- to 5-year-olds in prekindergarten and kindergarten programs, by control, level of school, and attendance status: Selected years, October 1990 through October 2013
[Numbers in thousands] Control, level of school, and attendance status 1990 2000 2010 2013
Total 6,659 7,592 8,246 7,878 Percent enrolled 59.4 64.0 63.7 64.8
Control Public 3,971 4,847 5,829 5,448 Private 2,688 2,745 2,417 2,430
Level of school Prekindergarten 3,379 4,326 4,797 4,625 Kindergarten 3,280 3,266 3,449 3,254
Attendance status Full-day 2,577 4,008 4,813 4,753 Part-day 4,082 3,584 3,432 3,125 Percent full-day 38.7 52.8 58.4 60.3
NOTE: Starting in 1994, prekindergarten and kindergarten enrollment data were collected using new procedures and may not be comparable to figures for earlier years. This revision primarily affected rates for 3- and 4- year-olds. Detail may not sum to totals because of rounding.

6
Enrollment Rates School enrollment rates were higher for 3- and 4-year-olds in 2013 (55 percent) than in 2000 (52 percent), but rates for 5- and 6-year-olds decreased from 96 percent to 94 percent. There was no measurable change in the enrollment rates of 7- to 13-year-olds and 14- to 17-year-olds between 2000 and 2013.
Table 5. Percentage of 3- to 17-year-olds enrolled in school: Selected years, October 1990 through October 2013
Year 3 and 4
years 5 and 6
years 7 to 13
years 14 to 17
years 1990 44.4 96.5 99.6 95.8 2000 52.1 95.6 98.2 95.7 2001 52.4 95.3 98.3 95.8 2002 56.3 95.5 98.3 96.4 2003 55.1 94.5 98.3 96.2 2004 54.0 95.4 98.4 96.5 2005 53.6 95.4 98.6 96.5 2006 55.7 94.6 98.3 96.4 2007 54.5 94.7 98.4 96.4 2008 52.8 93.8 98.7 96.8 2009 52.4 94.1 98.2 96.3 2010 53.2 94.5 98.0 97.1 2011 52.4 95.1 98.3 97.1 2012 53.5 93.2 98.0 97.0 2013 54.9 93.8 98.1 96.1 NOTE: Starting in 1994, prekindergarten and kindergarten enrollment data were collected using new procedures and may not be comparable to figures for earlier years. This revision primarily affected rates for 3- and 4-year-olds. Includes enrollment in any school or college.
7
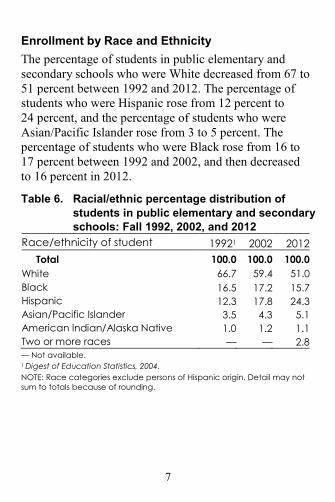
Enrollment by Race and Ethnicity The percentage of students in public elementary and secondary schools who were White decreased from 67 to 51 percent between 1992 and 2012. The percentage of students who were Hispanic rose from 12 percent to 24 percent, and the percentage of students who were Asian/Pacific Islander rose from 3 to 5 percent. The percentage of students who were Black rose from 16 to 17 percent between 1992 and 2002, and then decreased to 16 percent in 2012.
Table 6. Racial/ethnic percentage distribution of students in public elementary and secondary schools: Fall 1992, 2002, and 2012
Race/ethnicity of student 19921 2002 2012 Total 100.0 100.0 100.0
White 66.7 59.4 51.0 Black 16.5 17.2 15.7 Hispanic 12.3 17.8 24.3 Asian/Pacific Islander 3.5 4.3 5.1 American Indian/Alaska Native 1.0 1.2 1.1 Two or more races — — 2.8 — Not available. 1 Digest of Education Statistics, 2004. NOTE: Race categories exclude persons of Hispanic origin. Detail may not sum to totals because of rounding.

8
Enrollment in Programs for Children With Disabilities The percentage of students (3 to 21 years old) served by federally supported special education programs rose from 8 percent to 14 percent between 1976–77 and 2004–05, and then decreased to 13 percent in 2012–13. Between 2004–05 and 2012–13, the percentage of students identified as having autism increased from 0.4 percent to 1.0 percent of enrollment; and the percentage of those with specific learning disabilities decreased from 5.7 percent to 4.6 percent of enrollment (see Digest of Education Statistics, 2014, table 204.30).
Table 7. Number and percentage of 3- to 21-year-olds served in programs for children with disabilities: Selected years, 1976–77 through 2012–13
Year
Number of students with disabilities, in
thousands
Students with disabilities
as a percent of public
enrollment1
Students with specific learning
disabilities as a percent
of public enrollment1
1976–77 3,694 8.3 1.8 1980–81 4,144 10.1 3.6 1990–91 4,710 11.4 5.2 2000–01 6,296 13.3 6.1 2004–05 6,720 13.8 5.7 2012–13 6,429 12.9 4.6 1 Based on the enrollment in public elementary and secondary schools (prekindergarten through 12th grade).
9
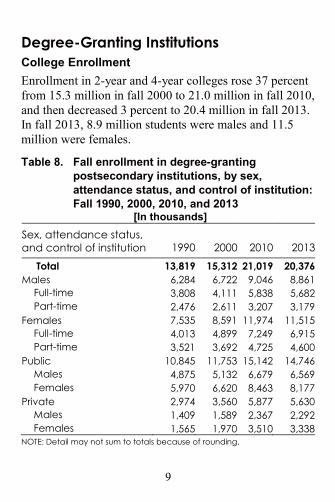
Degree-Granting Institutions College Enrollment Enrollment in 2-year and 4-year colleges rose 37 percent from 15.3 million in fall 2000 to 21.0 million in fall 2010, and then decreased 3 percent to 20.4 million in fall 2013. In fall 2013, 8.9 million students were males and 11.5 million were females.
Table 8. Fall enrollment in degree-granting postsecondary institutions, by sex, attendance status, and control of institution: Fall 1990, 2000, 2010, and 2013
[In thousands] Sex, attendance status, and control of institution 1990 2000 2010 2013
Total 13,819 15,312 21,019 20,376 Males 6,284 6,722 9,046 8,861
Full-time 3,808 4,111 5,838 5,682 Part-time 2,476 2,611 3,207 3,179
Females 7,535 8,591 11,974 11,515 Full-time 4,013 4,899 7,249 6,915 Part-time 3,521 3,692 4,725 4,600
Public 10,845 11,753 15,142 14,746 Males 4,875 5,132 6,679 6,569 Females 5,970 6,620 8,463 8,177
Private 2,974 3,560 5,877 5,630 Males 1,409 1,589 2,367 2,292 Females 1,565 1,970 3,510 3,338
NOTE: Detail may not sum to totals because of rounding.

10
Enrollment by Level and Attendance Enrollment at public institutions increased 29 percent from 2000 to 2010, but then decreased 3 percent between 2010 and 2013. Enrollment at private for-profit institutions grew by 349 percent from 2000 to 2010, and then decreased 18 percent between 2010 and 2013. Enrollment at private nonprofit institutions increased 24 percent from 2000 to 2010, and by another 3 percent between 2010 and 2013.
Table 9. Fall enrollment in degree-granting postsecondary institutions, by control and level of institution: Fall 1990, 2000, 2010, and 2013
[In thousands] Control and level of institution 1990 2000 2010 2013
Total 13,819 15,312 21,019 20,376 4-year 8,579 9,364 13,336 13,407 2-year 5,240 5,948 7,684 6,969 Public 10,845 11,753 15,142 14,746
4-year 5,848 6,055 7,924 8,120 2-year 4,996 5,697 7,218 6,625
Private 2,974 3,560 5,877 5,630 Private, nonprofit 2,760 3,109 3,854 3,974
4-year 2,671 3,051 3,822 3,942 2-year 89 59 33 32
Private, for-profit 214 450 2,023 1,656 4-year 59 258 1,590 1,345 2-year 154 192 433 311
NOTE: Detail may not sum to totals because of rounding.

11
Enrollment Rates of 18- to 24-Year-Olds The percentage of 18- and 19-year-olds enrolled in high school or postsecondary education in 2013 (67 percent) was higher than in 2000 (61 percent). Also, the enrollment rates of 20- and 21-year-olds were higher in 2013 (53 percent) than in 2000 (44 percent). Similarly, enrollment rates for 22- to 24-year-olds were higher in 2013 (30 percent) than in 2000 (25 percent).
Table 10. Percentage of 18- to 24-year-olds enrolled in high school or postsecondary education: Selected years, October 1985 through October 2013
Year 18- and 19-
year-olds 20- and 21-
year-olds 22- to 24- year-olds
1985 51.6 35.3 16.9 1990 57.2 39.7 21.0 1995 59.4 44.9 23.2 2000 61.2 44.1 24.6 2003 64.5 48.3 27.8 2004 64.4 48.9 26.3 2005 67.6 48.7 27.3 2006 65.5 47.5 26.7 2007 66.8 48.4 27.3 2008 66.0 50.1 28.2 2009 68.9 51.7 30.4 2010 69.2 52.4 28.9 2011 71.1 52.7 31.1 2012 69.0 54.0 30.7 2013 67.1 52.8 29.7

12
Enrollment by Sex and Age Between 2000 and 2013, the enrollment of people under age 25 grew 35 percent and enrollment of people age 25 and older increased 30 percent. Enrollment of females under age 25 grew by 35 percent, and enrollment of females age 25 and older grew by 33 percent. Enrollment of males under age 25 grew by 36 percent, and enrollment of males age 25 and older grew by 25 percent. Table 11. Fall enrollment in degree-granting
postsecondary institutions, by sex and age: 1990, 2000, and 2013
[In thousands] Sex and age 1990 2000 2013
Total 13,819 15,312 20,376 19 years and younger 2,930 3,389 3,980 20 and 21 years old 2,593 3,005 4,248 22 to 24 years old 2,202 2,600 3,949 25 years and older 6,094 6,319 8,199 Males, total 6,284 6,722 8,861
19 years and younger 1,364 1,522 1,812 20 and 21 years old 1,259 1,411 1,956 22 to 24 years old 1,129 1,222 1,879 25 years and older 2,532 2,566 3,214
Females, total 7,535 8,591 11,515 19 years and younger 1,566 1,867 2,168 20 and 21 years old 1,334 1,593 2,293 22 to 24 years old 1,073 1,378 2,070 25 years and older 3,562 3,753 4,985
NOTE: Detail may not sum to totals because of rounding. Some data have been revised from previously published figures.
13
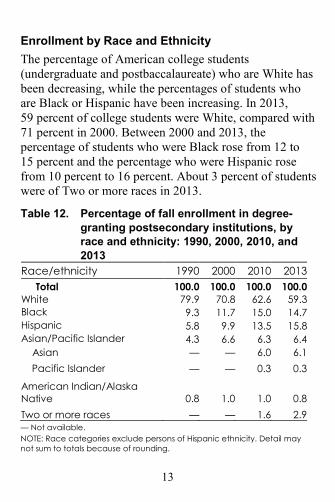
Enrollment by Race and Ethnicity The percentage of American college students (undergraduate and postbaccalaureate) who are White has been decreasing, while the percentages of students who are Black or Hispanic have been increasing. In 2013, 59 percent of college students were White, compared with 71 percent in 2000. Between 2000 and 2013, the percentage of students who were Black rose from 12 to 15 percent and the percentage who were Hispanic rose from 10 percent to 16 percent. About 3 percent of students were of Two or more races in 2013.
Table 12. Percentage of fall enrollment in degree-granting postsecondary institutions, by race and ethnicity: 1990, 2000, 2010, and 2013
Race/ethnicity 1990 2000 2010 2013 Total 100.0 100.0 100.0 100.0
White 79.9 70.8 62.6 59.3 Black 9.3 11.7 15.0 14.7 Hispanic 5.8 9.9 13.5 15.8 Asian/Pacific Islander 4.3 6.6 6.3 6.4 Asian — — 6.0 6.1 Pacific Islander — — 0.3 0.3
American Indian/Alaska Native 0.8 1.0 1.0 0.8 Two or more races — — 1.6 2.9 — Not available. NOTE: Race categories exclude persons of Hispanic ethnicity. Detail may not sum to totals because of rounding.
14
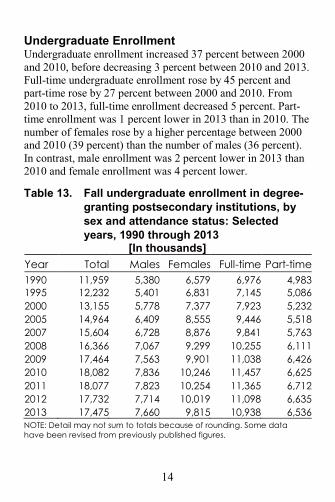
Undergraduate Enrollment Undergraduate enrollment increased 37 percent between 2000 and 2010, before decreasing 3 percent between 2010 and 2013. Full-time undergraduate enrollment rose by 45 percent and part-time rose by 27 percent between 2000 and 2010. From 2010 to 2013, full-time enrollment decreased 5 percent. Part-time enrollment was 1 percent lower in 2013 than in 2010. The number of females rose by a higher percentage between 2000 and 2010 (39 percent) than the number of males (36 percent). In contrast, male enrollment was 2 percent lower in 2013 than 2010 and female enrollment was 4 percent lower.
Table 13. Fall undergraduate enrollment in degree-granting postsecondary institutions, by sex and attendance status: Selected years, 1990 through 2013
[In thousands] Year Total Males Females Full-time Part-time 1990 11,959 5,380 6,579 6,976 4,983 1995 12,232 5,401 6,831 7,145 5,086 2000 13,155 5,778 7,377 7,923 5,232 2005 14,964 6,409 8,555 9,446 5,518 2007 15,604 6,728 8,876 9,841 5,763 2008 16,366 7,067 9,299 10,255 6,111 2009 17,464 7,563 9,901 11,038 6,426 2010 18,082 7,836 10,246 11,457 6,625 2011 18,077 7,823 10,254 11,365 6,712 2012 17,732 7,714 10,019 11,098 6,635 2013 17,475 7,660 9,815 10,938 6,536 NOTE: Detail may not sum to totals because of rounding. Some data have been revised from previously published figures.
15
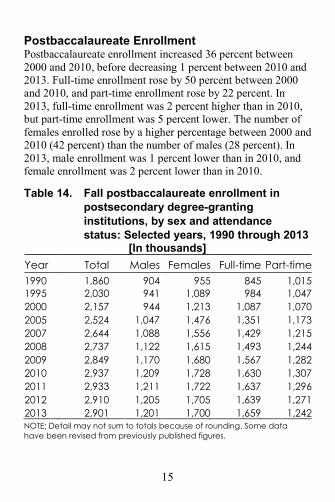
Postbaccalaureate Enrollment Postbaccalaureate enrollment increased 36 percent between 2000 and 2010, before decreasing 1 percent between 2010 and 2013. Full-time enrollment rose by 50 percent between 2000 and 2010, and part-time enrollment rose by 22 percent. In 2013, full-time enrollment was 2 percent higher than in 2010, but part-time enrollment was 5 percent lower. The number of females enrolled rose by a higher percentage between 2000 and 2010 (42 percent) than the number of males (28 percent). In 2013, male enrollment was 1 percent lower than in 2010, and female enrollment was 2 percent lower than in 2010.
Table 14. Fall postbaccalaureate enrollment in postsecondary degree-granting institutions, by sex and attendance status: Selected years, 1990 through 2013
[In thousands] Year Total Males Females Full-time Part-time 1990 1,860 904 955 845 1,015 1995 2,030 941 1,089 984 1,047 2000 2,157 944 1,213 1,087 1,070 2005 2,524 1,047 1,476 1,351 1,173 2007 2,644 1,088 1,556 1,429 1,215 2008 2,737 1,122 1,615 1,493 1,244 2009 2,849 1,170 1,680 1,567 1,282 2010 2,937 1,209 1,728 1,630 1,307 2011 2,933 1,211 1,722 1,637 1,296 2012 2,910 1,205 1,705 1,639 1,271 2013 2,901 1,201 1,700 1,659 1,242 NOTE: Detail may not sum to totals because of rounding. Some data have been revised from previously published figures.

This page intentionally left blank

17
Teachers, Faculty, and Staff

18
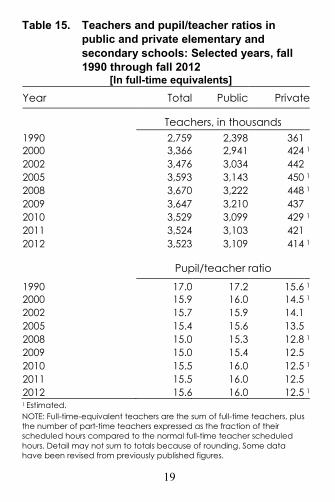
Elementary and Secondary Schools Number of Teachers Some 3.5 million elementary and secondary school teachers were engaged in classroom instruction in the fall of 2012, with about 3.1 million teachers in public schools and 0.4 million in private schools.
The number of public elementary and secondary school teachers rose by 2 percent between 2002 and 2012. The number of public school teachers increased by a slightly lower percentage than the number of students during that period (3 percent). Although the number of teachers in 2012 was higher than in 2002, the number of teachers in 2012 (3.1 million) was slightly lower than the number in 2008 (3.2 million).
In the fall of 2012 the pupil/teacher ratio for public schools was 16.0, compared to 15.9 in 2002. The pupil/teacher ratio in private schools was 12.5 pupils per teacher in 2012, compared to 14.1 in 2002.
19
Table 15. Teachers and pupil/teacher ratios in public and private elementary and secondary schools: Selected years, fall 1990 through fall 2012
[In full-time equivalents] Year Total Public Private
Teachers, in thousands 1990 2,759 2,398 361 2000 3,366 2,941 424 1 2002 3,476 3,034 442
2005 3,593 3,143 450 1 2008 3,670 3,222 448 1 2009 3,647 3,210 437 2010 3,529 3,099 429 1 2011 3,524 3,103 421 2012 3,523 3,109 414 1
Pupil/teacher ratio
1990 17.0 17.2 15.6 1 2000 15.9 16.0 14.5 1 2002 15.7 15.9 14.1 2005 15.4 15.6 13.5 2008 15.0 15.3 12.8 1 2009 15.0 15.4 12.5 2010 15.5 16.0 12.5 1 2011 15.5 16.0 12.5 2012 15.6 16.0 12.5 1 1 Estimated. NOTE: Full-time-equivalent teachers are the sum of full-time teachers, plus the number of part-time teachers expressed as the fraction of their scheduled hours compared to the normal full-time teacher scheduled hours. Detail may not sum to totals because of rounding. Some data have been revised from previously published figures.
20
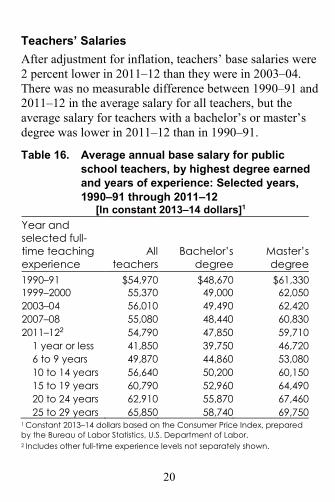
Teachers’ Salaries After adjustment for inflation, teachers’ base salaries were 2 percent lower in 2011–12 than they were in 2003–04. There was no measurable difference between 1990–91 and 2011–12 in the average salary for all teachers, but the average salary for teachers with a bachelor’s or master’s degree was lower in 2011–12 than in 1990–91.
Table 16. Average annual base salary for public school teachers, by highest degree earned and years of experience: Selected years, 1990–91 through 2011–12
[In constant 2013–14 dollars]1 Year and selected full-time teaching experience
All teachers
Bachelor’s degree
Master’s degree
1990–91 $54,970 $48,670 $61,330 1999–2000 55,370 49,000 62,050 2003–04 56,010 49,490 62,420 2007–08 55,080 48,440 60,830 2011–122 54,790 47,850 59,710
1 year or less 41,850 39,750 46,720 6 to 9 years 49,870 44,860 53,080 10 to 14 years 56,640 50,200 60,150 15 to 19 years 60,790 52,960 64,490 20 to 24 years 62,910 55,870 67,460 25 to 29 years 65,850 58,740 69,750 1 Constant 2013–14 dollars based on the Consumer Price Index, prepared by the Bureau of Labor Statistics, U.S. Department of Labor. 2 Includes other full-time experience levels not separately shown.
21
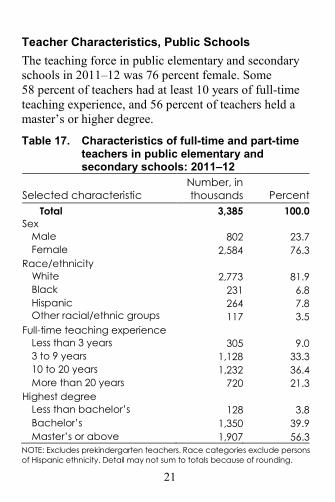
Teacher Characteristics, Public Schools The teaching force in public elementary and secondary schools in 2011–12 was 76 percent female. Some 58 percent of teachers had at least 10 years of full-time teaching experience, and 56 percent of teachers held a master’s or higher degree.
Table 17. Characteristics of full-time and part-time teachers in public elementary and secondary schools: 2011–12
Selected characteristic Number, in thousands Percent
Total 3,385 100.0 Sex
Male 802 23.7 Female 2,584 76.3
Race/ethnicity White 2,773 81.9 Black 231 6.8 Hispanic 264 7.8 Other racial/ethnic groups 117 3.5
Full-time teaching experience Less than 3 years 305 9.0 3 to 9 years 1,128 33.3 10 to 20 years 1,232 36.4 More than 20 years 720 21.3
Highest degree Less than bachelor’s 128 3.8 Bachelor’s 1,350 39.9 Master’s or above 1,907 56.3
NOTE: Excludes prekindergarten teachers. Race categories exclude persons of Hispanic ethnicity. Detail may not sum to totals because of rounding.
22
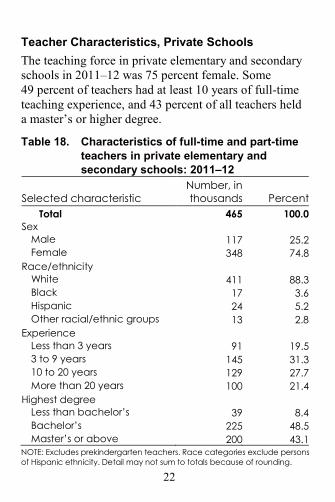
Teacher Characteristics, Private Schools The teaching force in private elementary and secondary schools in 2011–12 was 75 percent female. Some 49 percent of teachers had at least 10 years of full-time teaching experience, and 43 percent of all teachers held a master’s or higher degree.
Table 18. Characteristics of full-time and part-time teachers in private elementary and secondary schools: 2011–12
Selected characteristic Number, in thousands Percent
Total 465 100.0 Sex
Male 117 25.2 Female 348 74.8
Race/ethnicity White 411 88.3 Black 17 3.6 Hispanic 24 5.2 Other racial/ethnic groups 13 2.8
Experience Less than 3 years 91 19.5 3 to 9 years 145 31.3 10 to 20 years 129 27.7 More than 20 years 100 21.4
Highest degree Less than bachelor’s 39 8.4 Bachelor’s 225 48.5 Master’s or above 200 43.1
NOTE: Excludes prekindergarten teachers. Race categories exclude persons of Hispanic ethnicity. Detail may not sum to totals because of rounding.
23
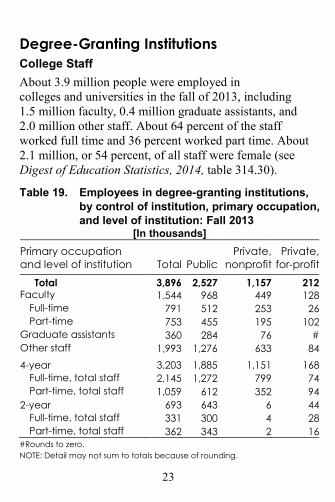
Degree-Granting Institutions College Staff About 3.9 million people were employed in colleges and universities in the fall of 2013, including 1.5 million faculty, 0.4 million graduate assistants, and 2.0 million other staff. About 64 percent of the staff worked full time and 36 percent worked part time. About 2.1 million, or 54 percent, of all staff were female (see Digest of Education Statistics, 2014, table 314.30).
Table 19. Employees in degree-granting institutions, by control of institution, primary occupation, and level of institution: Fall 2013
[In thousands] Primary occupation and level of institution Total Public
Private, nonprofit
Private, for-profit
Total 3,896 2,527 1,157 212 Faculty 1,544 968 449 128
Full-time 791 512 253 26 Part-time 753 455 195 102
Graduate assistants 360 284 76 # Other staff 1,993 1,276 633 84
4-year 3,203 1,885 1,151 168 Full-time, total staff 2,145 1,272 799 74 Part-time, total staff 1,059 612 352 94
2-year 693 643 6 44 Full-time, total staff 331 300 4 28 Part-time, total staff 362 343 2 16
#Rounds to zero. NOTE: Detail may not sum to totals because of rounding.
24
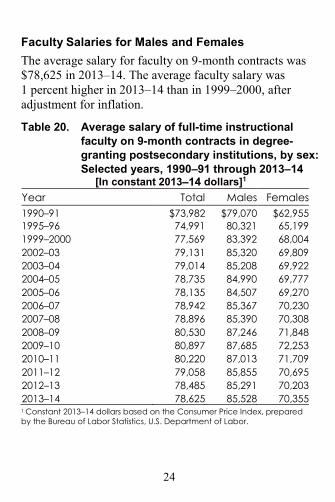
Faculty Salaries for Males and Females The average salary for faculty on 9-month contracts was $78,625 in 2013–14. The average faculty salary was 1 percent higher in 2013–14 than in 1999–2000, after adjustment for inflation.
Table 20. Average salary of full-time instructional faculty on 9-month contracts in degree-granting postsecondary institutions, by sex: Selected years, 1990–91 through 2013–14
[In constant 2013–14 dollars]1 Year Total Males Females 1990–91 $73,982 $79,070 $62,955 1995–96 74,991 80,321 65,199 1999–2000 77,569
83,392 68,004 2002–03 79,131 85,320 69,809 2003–04 79,014 85,208 69,922 2004–05 78,735 84,990 69,777 2005–06 78,135 84,507 69,270 2006–07 78,942 85,367 70,230 2007–08 78,896 85,390 70,308 2008–09 80,530 87,246 71,848 2009–10 80,897 87,685 72,253 2010–11 80,220 87,013 71,709 2011–12 79,058 85,855 70,695 2012–13 78,485 85,291 70,203 2013–14 78,625 85,528 70,355 1 Constant 2013–14 dollars based on the Consumer Price Index, prepared by the Bureau of Labor Statistics, U.S. Department of Labor.

25
Faculty Salaries at Public and Private Institutions From 1999–2000 to 2013–14, faculty salaries increased by 7 percent at private 4-year institutions, after adjustment for inflation. Faculty salaries at public 4-year institutions were 1 percent lower in 2013–14 than in 1999–2000, and salaries in public 2-year institutions were 6 percent lower.
Table 21. Average salary of full-time instructional faculty on 9-month contracts in degree-granting postsecondary institutions, by control and level of institution: Selected years, 1990–91 through 2013–14
[In constant 2013–14 dollars]1
Year Public 4-year
Public 2-year
Private 4-year
Private 2-year
1990–91 $78,096 $65,015 $74,085 $42,264 1995–96 77,824 65,844 77,287 48,537 1999–2000 80,430 66,954 80,948 49,861 2003–04 81,238 67,016 84,510 45,861 2004–05 80,964 66,107 84,571 45,756 2005–06 80,235 65,421 84,147 45,517 2006–07
81,100 66,144 84,756 47,351 2007–08 80,863 66,201 84,730 48,172 2008–09 82,363 67,245 86,922 47,661 2009–10 82,552 67,502 87,376 48,512 2010–11 81,681 66,274 87,252 47,980 2011–12 2012–13 2013–14
80,375 64,587 86,423 49,360 79,230 63,890 86,426 45,681 79,711 63,198 86,467 44,566
1 Constant 2013–14 dollars based on the Consumer Price Index, prepared by the Bureau of Labor Statistics, U.S. Department of Labor.

This page intentionally left blank

27
Educational Outcomes

28
Reading Performance The 2013 average National Assessment of Educational Progress (NAEP) reading score for 4th-graders was 5 points higher than the 1992 score, and the average score for 8th-graders was 8 points higher (see Digest of Education Statistics, 2013, table 221.10). Females at both grade levels had higher average scores than males in 2013.
Table 22. Performance of 8th-graders in NAEP reading assessments, by selected characteristics: 1992, 2011, and 2013
Selected characteristic 1992 2011 2013 Average scale score 260 265 268
Sex Male 254 261 263 Female 267 270 273
Race/ethnicity White 267 274 276 Black 237 249 250 Hispanic 241 252 256 Asian/Pacific Islander 268 275 280
American Indian/Alaska Native — 252 251 Percent of students at performance
levels
At or above Basic 69 76 78 At or above Proficient 29 34 36 At or above Advanced 3 3 4
— Not available. NOTE: Scale ranges from 0 to 500. Race categories exclude persons of Hispanic ethnicity.

29
Mathematics Performance The average NAEP mathematics scores of 4th- and 8th-graders were higher in 2013 than in 1990 (see Digest of Education Statistics, 2013, table 222.10). White students had higher average scores than Black and Hispanic students at both grade levels in 2013, but lower average scores than Asian/Pacific Islander students.
Table 23. Performance of 8th-graders in NAEP mathematics assessments, by selected characteristics: 1990, 2011, and 2013
Selected characteristic 1990 2011 2013 Average scale score 263 284 285
Sex Male 263 284 285 Female 262 283 284
Race/ethnicity White 270 293 294 Black 237 262 263 Hispanic 246 270 272 Asian/Pacific Islander 275 305 309 American Indian/Alaska Native ‡ 265 269
Percent of students at performance
At or above Basic 52 73 74 At or above Proficient 15 35 35 At or above Advanced 2 8 9
‡ Reporting standards not met. NOTE: Scale ranges from 0 to 500. Race categories exclude persons of Hispanic ethnicity.

30
Science Performance The average NAEP science scores were higher for males than females at the 4th, 8th, and 12th grades in the most recent assessments. White students had higher average scores than Black, Hispanic, and American Indian/Alaska Native students at all three grade levels. White students had higher average scores than Asian/Pacific Islander students at grades 4 and 8.
Table 24. Performance of 4th-, 8th-, and 12th-graders in NAEP science assessments, by selected characteristics: 2009 and 2011
Selected characteristic
4th grade,
2009
8th grade,
2011
12th grade,
2009 Average scale score 150 152 150
Sex Male 151 154 153 Female 149 149 147
Race/ethnicity White 163 163 159 Black 127 129 125 Hispanic 131 137 134 Asian/Pacific Islander 160 159 164 American Indian/Alaska Native 135 141 144
Percent at performance levels At or above Basic 72 65 60 At or above Proficient 34 32 21 At or above Advanced 1
2 1
NOTE: Scale ranges from 0 to 300, but scores cannot be compared across grades. Race categories exclude persons of Hispanic ethnicity.
31
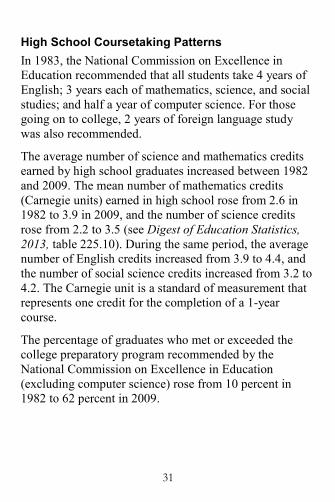
High School Coursetaking Patterns In 1983, the National Commission on Excellence in Education recommended that all students take 4 years of English; 3 years each of mathematics, science, and social studies; and half a year of computer science. For those going on to college, 2 years of foreign language study was also recommended.
The average number of science and mathematics credits earned by high school graduates increased between 1982 and 2009. The mean number of mathematics credits (Carnegie units) earned in high school rose from 2.6 in 1982 to 3.9 in 2009, and the number of science credits rose from 2.2 to 3.5 (see Digest of Education Statistics, 2013, table 225.10). During the same period, the average number of English credits increased from 3.9 to 4.4, and the number of social science credits increased from 3.2 to 4.2. The Carnegie unit is a standard of measurement that represents one credit for the completion of a 1-year course.
The percentage of graduates who met or exceeded the college preparatory program recommended by the National Commission on Excellence in Education (excluding computer science) rose from 10 percent in 1982 to 62 percent in 2009.
32
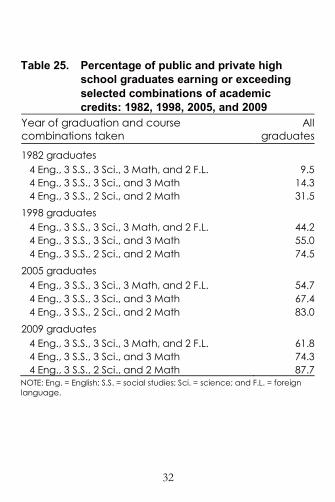
Table 25. Percentage of public and private high school graduates earning or exceeding selected combinations of academic credits: 1982, 1998, 2005, and 2009
Year of graduation and course combinations taken
All graduates
1982 graduates 4 Eng., 3 S.S., 3 Sci., 3 Math, and 2 F.L. 9.5 4 Eng., 3 S.S., 3 Sci., and 3 Math 14.3 4 Eng., 3 S.S., 2 Sci., and 2 Math 31.5 1998 graduates 4 Eng., 3 S.S., 3 Sci., 3 Math, and 2 F.L. 44.2 4 Eng., 3 S.S., 3 Sci., and 3 Math 55.0 4 Eng., 3 S.S., 2 Sci., and 2 Math 74.5 2005 graduates 4 Eng., 3 S.S., 3 Sci., 3 Math, and 2 F.L. 54.7 4 Eng., 3 S.S., 3 Sci., and 3 Math 67.4 4 Eng., 3 S.S., 2 Sci., and 2 Math 83.0 2009 graduates 4 Eng., 3 S.S., 3 Sci., 3 Math, and 2 F.L. 61.8 4 Eng., 3 S.S., 3 Sci., and 3 Math 74.3 4 Eng., 3 S.S., 2 Sci., and 2 Math 87.7 NOTE: Eng. = English; S.S. = social studies; Sci. = science; and F.L. = foreign language.

33
Graduates
About 3,430,000 high school students are expected to graduate during the 2014–15 school year, including 3,137,000 public school graduates and 293,000 private school graduates. High school graduates include only recipients of diplomas, not recipients of equivalency credentials. The 2014–15 projection of high school graduates is lower than the record high projection of 3,471,000 graduates for 2012–13, but exceeds the high point during the baby boom era in 1975–76, when 3,142,000 students earned diplomas.
The averaged freshman graduation rate is an estimate of the percentage of students in the incoming freshman class who graduate 4 years later. In 2011–12, the averaged freshman graduation rate was 80.8 percent for public schools. The 2011–12 averaged freshman graduation rate was 8.2 percentage points higher than the rate in 2001–02 (72.6 percent).

34
Table 26. High school graduates, by control of school and averaged freshman graduation rate for public schools: Selected years, 1975–76 through 2014–15
School year
High school graduates, in thousands
Averaged freshman
graduation rate for
public schools (percent) Total Public Private
1975–76 3,142 2,837 305 74.9 1979–80 3,042 2,748 295 71.5 1989–901 2,574 2,320 254 73.6 1999–20001 2,833 2,554 279 71.7 2002–03 3,016 2,720 296 73.9 2003–041 3,054 2,753 301 74.3 2004–05 3,106 2,799 307 74.7 2005–061 3,123 2,816 307 73.4 2006–07 3,200 2,893 307 73.9 2007–081 3,312 3,001 311 74.7 2008–09 3,348 3,039 309 75.5 2009–101 3,439 3,128 311 78.2 2010–11 3,450 3,144 306 79.6 2011–121 3,454 3,148 306 80.8 2012–132 3,471 3,171 300 — 2013–142 3,452 3,155 297 — 2014–152 3,430 3,137 293 — — Data not available. 1 Private high school data are estimated. 2 Projected. NOTE: Graduates include diploma recipients only and exclude other completers. Some data have been revised from previously published figures.

35
Dropouts The dropout rate among 16- to 24-year-olds decreased from 10 to 7 percent between 2003 and 2013. Rates for Hispanics, Blacks, and Whites decreased over this period. The dropout rate for Hispanics in 2013 (12 percent) was higher than the rates for Whites (5 percent) and Blacks (7 percent).
Table 27. Percentage of high school dropouts (status dropouts) among persons 16 to 24 years old, by race/ethnicity: Selected years, 1980 through 2013
Year All races1 White Black Hispanic 1980 14.1 11.4 19.1 35.2 1985 12.6 10.4 15.2 27.6 1990 12.1 9.0 13.2 32.4 19952 12.0 8.6 12.1 30.0 20002 10.9 6.9 13.1 27.8 20032 9.9 6.3 10.9 23.5 20052 9.4 6.0 10.4 22.4 20082 8.0 4.8 9.9 18.3 20092 8.1 5.2 9.3 17.6 20102 7.4 5.1 8.0 15.1 20112 7.1 5.0 7.3 13.6 20122 6.6 4.3 7.5 12.7 20132 6.8 5.1 7.3 11.7 1 Includes all other racial/ethnic groups not separately shown. 2 Wording of questionnaire on educational attainment was changed in 1992. NOTE: Status dropouts are persons not enrolled in school who neither completed high school nor received GED credentials. Race categories exclude persons of Hispanic ethnicity.

36
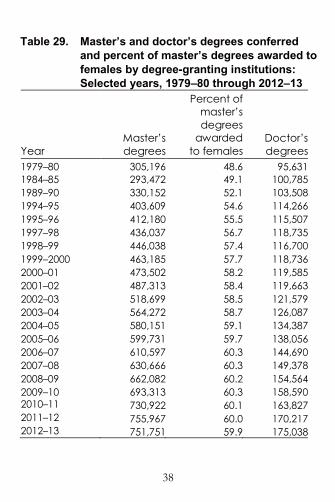
College Degrees Between 2002–03 and 2012–13, the number of people earning associate’s degrees increased by 59 percent; the number earning bachelor’s degrees, by 36 percent; the number earning master’s degrees, by 45 percent; and the number earning doctor’s degrees, by 44 percent. The number of associate’s, master’s, and doctor’s degrees conferred to females increased by a higher percentage than the number conferred to males between 2002–03 and 2012–13 (see Digest of Education Statistics, 2014, table 318.10). Between 2002–03 and 2012–13, the number of bachelor’s degrees awarded to males increased by 37 percent, while the number awarded to females increased by 36 percent. In 2012–13, colleges and universities awarded 1,007,000 associate’s degrees; 1,840,000 bachelor’s degrees; 752,000 master’s degrees; and 175,000 doctor’s degrees. In 2012–13, females earned the majority of degrees at all degree levels. Of the 1,840,000 bachelor’s degrees conferred in 2012–13, the largest numbers of degrees were conferred in the fields of business (361,000), health professions and related programs (181,000), social sciences and history (178,000), psychology (114,000), and education (105,000) (see Digest of Education Statistics, 2014, tables 322.10, 323.10, and 324.10). At the master’s degree level, the largest numbers of degrees were in the fields of business (189,000) and education (165,000). The fields with the largest number of degrees at the doctor’s degree level were health professions and related programs (64,200), legal professions and studies (47,200), education (10,600), engineering and engineering technologies (9,500), biological and biomedical sciences (7,900), psychology (6,300), and physical sciences and science technologies (5,500).

37
Table 28. Associate’s and bachelor’s degrees conferred and percentage of bachelor’s degrees awarded to females by degree-granting institutions: Selected years, 1979–80 through 2012–13
Year Associate’s
degrees Bachelor’s
degrees
Percent of bachelor’s
degrees awarded
to females 1979–80 400,910 929,417 49.0 1984–85 454,712 979,477 50.7 1989–90 455,102 1,051,344 53.2 1994–95 539,691 1,160,134 54.6 1997–98 558,555
1,184,406 56.1
1998–99 564,984 1,202,239 56.8 1999–2000 564,933 1,237,875 57.2 2000–01 578,865 1,244,171 57.3 2001–02 595,133 1,291,900 57.4 2002–03 634,016 1,348,811 57.5 2003–04 665,301 1,399,542 57.5 2004–05 696,660 1,439,264 57.4 2005–06 713,066 1,485,242 57.5 2006–07 728,114 1,524,092 57.4 2007–08 750,164 1,563,069 57.3 2008–09 787,243 1,601,399 57.2 2009–10 848,856 1,649,919 57.2 2010–11 943,506 1,716,053 57.2 2011–12 1,021,718 1,792,163 57.3 2012–13 1,006,961 1,840,164 57.2
38
Table 29. Master’s and doctor’s degrees conferred and percent of master’s degrees awarded to females by degree-granting institutions: Selected years, 1979–80 through 2012–13
Year Master’s degrees
Percent of master’s degrees
awarded to females
Doctor’s degrees
1979–80 305,196 48.6 95,631 1984–85 293,472 49.1 100,785 1989–90 330,152 52.1 103,508 1994–95 403,609 54.6 114,266 1995–96 412,180 55.5 115,507 1997–98 436,037 56.7 118,735 1998–99 446,038 57.4 116,700 1999–2000 463,185 57.7 118,736 2000–01 473,502 58.2 119,585 2001–02 487,313 58.4 119,663 2002–03 518,699 58.5 121,579 2003–04 564,272 58.7 126,087 2004–05 580,151 59.1 134,387 2005–06 599,731 59.7 138,056 2006–07 610,597 60.3 144,690 2007–08 630,666 60.3 149,378 2008–09 662,082 60.2 154,564 2009–10 693,313 60.3 158,590 2010–11 730,922 60.1 163,827 2011–12 755,967 60.0 170,217 2012–13 751,751 59.9 175,038
39
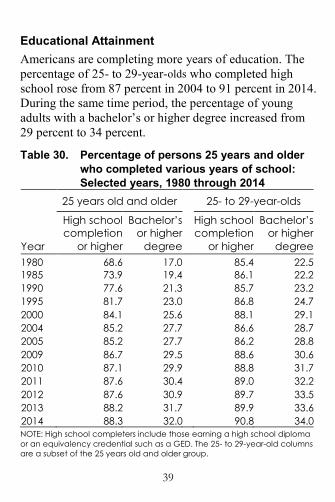
Educational Attainment Americans are completing more years of education. The percentage of 25- to 29-year-olds who completed high school rose from 87 percent in 2004 to 91 percent in 2014. During the same time period, the percentage of young adults with a bachelor’s or higher degree increased from 29 percent to 34 percent.
Table 30. Percentage of persons 25 years and older who completed various years of school: Selected years, 1980 through 2014
Year
25 years old and older 25- to 29-year-olds
High school completion
or higher
Bachelor’s or higher
degree
High school completion
or higher
Bachelor’s or higher
degree 1980 68.6 17.0 85.4 22.5
1985 73.9 19.4 86.1 22.2 1990 77.6 21.3 85.7 23.2 1995 81.7 23.0 86.8 24.7 2000 84.1 25.6 88.1 29.1 2004 85.2 27.7 86.6 28.7 2005 85.2 27.7 86.2 28.8 2009 86.7 29.5 88.6 30.6 2010 87.1 29.9 88.8 31.7 2011 87.6 30.4 89.0 32.2 2012 87.6 30.9 89.7 33.5 2013 88.2 31.7 89.9 33.6 2014 88.3 32.0 90.8 34.0 NOTE: High school completers include those earning a high school diploma or an equivalency credential such as a GED. The 25- to 29-year-old columns are a subset of the 25 years old and older group.

This page intentionally left blank

41
Finance

42
Total Expenditures Expenditures for public and private education, from preprimary through graduate school, are projected at $1.2 trillion for 2013–14. The expenditures of elementary and secondary schools are expected to total $682 billion for 2013–14, while colleges and universities will spend about $512 billion (see Digest of Education Statistics, 2014, tables 106.10 and 106.20). After adjustment for inflation, total expenditures for all educational institutions rose by an estimated 14 percent between 2003–04 and 2013–14. Expenditures for elementary and secondary schools were 5 percent higher in 2013–14 than in 2003–04, while total expenditures for colleges and universities rose by 28 percent.
The total expenditures for education are estimated to amount to about 7.1 percent of the gross domestic product in 2013–14.

43
Table 31. Total expenditures of educational institutions and percentage of gross domestic product: Selected years, 1980–81 through 2013–14
Year
Expenditures in billions of
current dollars
Expenditures in billions of
constant 2013–14 dollars1
Percent of gross
domestic product2
1980–81 $176 $478 6.2 1985–86 259 560 6.0 1990–91 395 694 6.6 1995–96 509 773 6.6 2000–01 705 946 6.9 2001–02 753 993 7.1 2002–03 796 1,027 7.2 2003–04 830 1,048 7.2 2004–05 876 1,074 7.1 2005–06 925 1,093 7.1 2006–07 984 1,133 7.1 2007–08 1,055 1,171 7.3 2008–09 1,090 1,193 7.4 2009–10 1,101 1,194 7.6 2010–11 1,124 1,194 7.5 2011–12 1,137 1,174 7.3 2012–133 1,165 1,183 7.2 2013–143 1,194 1,194 7.1 1 Constant 2013–14 dollars based on the Consumer Price Index, prepared by the Bureau of Labor Statistics, U.S. Department of Labor. 2 Gross domestic product data from the Bureau of Economic Analysis, U.S. Department of Commerce. 3 Projected. NOTE: Includes expenditures for public and private education, from preprimary through graduate school. Some data have been revised from previously published figures.

44
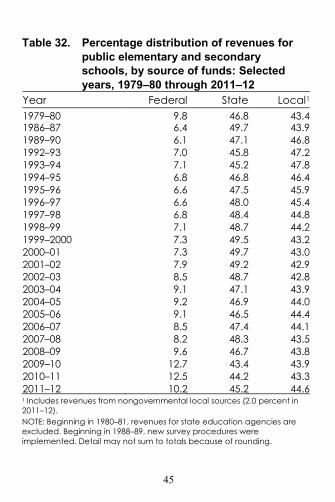
Public Elementary and Secondary Schools Revenues The state share of revenues for public elementary and secondary schools generally grew from the 1930s through the mid-1980s, while the local share decreased during the same time period (see Digest of Education Statistics, 2014, table 235.10). However, this pattern changed in the late 1980s, when the local share began to increase at the same time the state share decreased. Between 1986–87 and 1993–94, the state share decreased from 49.7 percent to 45.2 percent, while the local share rose from 43.9 percent to 47.8 percent. Between 1993–94 and 2000–01, the state share rose again to 49.7 percent, the highest share since 1986–87, but decreased every school year thereafter until 2005–06, when the state share was 46.5 percent. Total revenues increased 12 percent between 2001–02 and 2011–12, after adjustment for inflation. Federal revenues increased 44 percent and local revenues increased 17 percent during this time period. Revenues from state sources were 3 percent higher in 2011–12 than in 2001–02. The federal revenue per student was $1,235 in 2011–12, amounting to 10.2 percent of public school revenues.
45
Table 32. Percentage distribution of revenues for public elementary and secondary schools, by source of funds: Selected years, 1979–80 through 2011–12
Year Federal State Local1 1979–80 9.8 46.8 43.4 1986–87 6.4 49.7 43.9 1989–90 6.1 47.1 46.8 1992–93 7.0 45.8 47.2 1993–94 7.1 45.2 47.8 1994–95 6.8 46.8 46.4 1995–96 6.6 47.5 45.9 1996–97 6.6 48.0 45.4 1997–98 6.8 48.4 44.8 1998–99 7.1 48.7 44.2 1999–2000 7.3 49.5 43.2 2000–01 7.3 49.7 43.0 2001–02 7.9 49.2 42.9 2002–03 8.5 48.7 42.8 2003–04 9.1 47.1 43.9 2004–05 9.2 46.9 44.0 2005–06 9.1 46.5 44.4 2006–07 8.5 47.4 44.1 2007–08 8.2 48.3 43.5 2008–09 9.6 46.7 43.8 2009–10 12.7 43.4 43.9 2010–11 12.5 44.2 43.3 2011–12 10.2 45.2 44.6 1 Includes revenues from nongovernmental local sources (2.0 percent in 2011–12). NOTE: Beginning in 1980–81, revenues for state education agencies are excluded. Beginning in 1988–89, new survey procedures were implemented. Detail may not sum to totals because of rounding.

46
Expenditures After an increase of 37 percent during the 1980s, current expenditure per pupil in public schools fluctuated during the early 1990s. Between 2001–02 and 2011–12, current expenditure per pupil rose 8 percent after adjustment for inflation. In 2011–12, the current expenditure per pupil in fall enrollment was $11,014 (in 2013–14 dollars).
Table 33. Total and current expenditure per pupil in fall enrollment in public schools: Selected years, 1979–80 through 2011–12
Year
Total expenditure1 Current expenditure Unad-justed dollars
Constant 2013–14 dollars2
Unad- justed dollars
Constant 2013–14 dollars2
1979–80 $2,290 $6,930 $2,088 $6,321 1989–90 5,172
9,570 4,643 8,591 1994–95 6,206 9,695
5,529 8,637 1999–2000 8,030 11,145 6,912 9,594 2001–02 8,993 11,858
7,727 10,189 2003–04 9,625 12,153 8,310 10,493 2004–05 10,078 12,354 8,711 10,677 2005–06 10,603 12,520 9,145 10,798 2006–07 11,252 12,951 9,679 11,141 2007–08 11,965 13,280 10,298 11,430 2008–09 12,222 13,379 10,540 11,537 2009–10 12,133 13,154 10,636 11,531 2010–11 12,054 12,811 10,663 11,332 2011–12 12,010 12,401 10,667 11,014 1 Includes current expenditures, capital outlay, and interest on school debt. 2 Constant 2013–14 dollars based on the Consumer Price Index, prepared by the Bureau of Labor Statistics, U.S. Department of Labor.
47
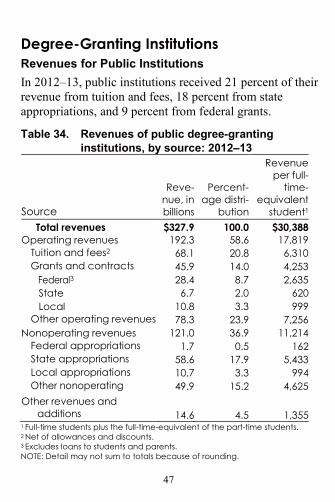
Degree-Granting Institutions Revenues for Public Institutions In 2012–13, public institutions received 21 percent of their revenue from tuition and fees, 18 percent from state appropriations, and 9 percent from federal grants.
Table 34. Revenues of public degree-granting institutions, by source: 2012–13
Source
Reve-nue, in billions
Percent- age distri-
bution
Revenue per full-
time-equivalent
student1 Total revenues $327.9 100.0 $30,388
Operating revenues 192.3 58.6 17,819 Tuition and fees2 68.1 20.8 6,310 Grants and contracts 45.9 14.0 4,253
Federal3 28.4 8.7 2,635 State 6.7 2.0 620 Local 10.8 3.3 999
Other operating revenues 78.3 23.9 7,256 Nonoperating revenues 121.0 36.9 11,214
Federal appropriations 1.7 0.5 162 State appropriations 58.6 17.9 5,433 Local appropriations 10.7 3.3 994 Other nonoperating 49.9 15.2 4,625
Other revenues and additions 14.6 4.5 1,355
1 Full-time students plus the full-time-equivalent of the part-time students. 2 Net of allowances and discounts. 3 Excludes loans to students and parents. NOTE: Detail may not sum to totals because of rounding.
48
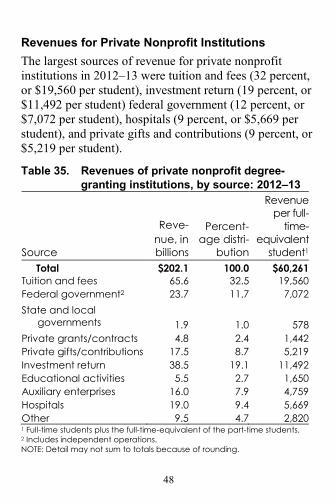
Revenues for Private Nonprofit Institutions The largest sources of revenue for private nonprofit institutions in 2012–13 were tuition and fees (32 percent, or $19,560 per student), investment return (19 percent, or $11,492 per student) federal government (12 percent, or $7,072 per student), hospitals (9 percent, or $5,669 per student), and private gifts and contributions (9 percent, or $5,219 per student).
Table 35. Revenues of private nonprofit degree-granting institutions, by source: 2012–13
Source
Reve- nue, in billions
Percent-age distri-
bution
Revenue per full-
time- equivalent
student1 Total $202.1 100.0 $60,261
Tuition and fees 65.6 32.5 19,560 Federal government2 23.7 11.7 7,072 State and local
governments 1.9 1.0 578 Private grants/contracts 4.8 2.4 1,442 Private gifts/contributions 17.5 8.7 5,219 Investment return 38.5 19.1 11,492 Educational activities 5.5 2.7 1,650 Auxiliary enterprises 16.0 7.9 4,759 Hospitals 19.0 9.4 5,669 Other 9.5 4.7 2,820 1 Full-time students plus the full-time-equivalent of the part-time students. 2 Includes independent operations. NOTE: Detail may not sum to totals because of rounding.

49
Revenues for Private For-Profit Institutions Private for-profit institutions received 91 percent of their revenues, or about $15,887 per student, from student tuition and fees in 2012–13. The next largest sources in 2012–13 were federal government (4 percent), auxiliary enterprises (2 percent), and educational activities and other (1 percent from each source).
Table 36. Revenues of private for-profit degree-granting institutions, by source: 2012–13
Source
Reve-nue, in billions
Percent-age distri-
bution
Revenue per full-
time- equivalent
student1 Total $24.78 100.0 $17,510
Tuition and fees 22.48 90.7 15,887 Federal government 1.09 4.4 772 State and local
governments 0.10 0.4 68 Private gifts, grants,
and contracts 0.01 0.1 10 Investment return 0.06 0.2 41 Educational activities 0.31 1.3 220 Auxiliary enterprises 0.48 2.0 343 Other 0.24 1.0 168 1 Full-time students plus the full-time-equivalent of the part-time students. NOTE: Detail may not sum to totals because of rounding.
50
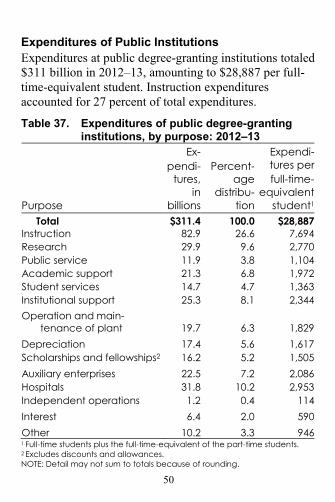
Expenditures of Public Institutions Expenditures at public degree-granting institutions totaled $311 billion in 2012–13, amounting to $28,887 per full-time-equivalent student. Instruction expenditures accounted for 27 percent of total expenditures.
Table 37. Expenditures of public degree-granting institutions, by purpose: 2012–13
Purpose
Ex- pendi-
tures, in
billions
Percent- age
distribu- tion
Expendi-tures per full-time-
equivalent student1
Total $311.4 100.0 $28,887 Instruction 82.9 26.6 7,694 Research 29.9 9.6 2,770 Public service 11.9 3.8 1,104 Academic support 21.3 6.8 1,972 Student services 14.7 4.7 1,363 Institutional support 25.3 8.1 2,344 Operation and main-
tenance of plant 19.7 6.3 1,829 Depreciation 17.4 5.6 1,617 Scholarships and fellowships2 16.2 5.2 1,505 Auxiliary enterprises 22.5 7.2 2,086 Hospitals 31.8 10.2 2,953 Independent operations 1.2 0.4 114 Interest 6.4 2.0 590 Other 10.2 3.3 946 1 Full-time students plus the full-time-equivalent of the part-time students. 2 Excludes discounts and allowances. NOTE: Detail may not sum to totals because of rounding.
51
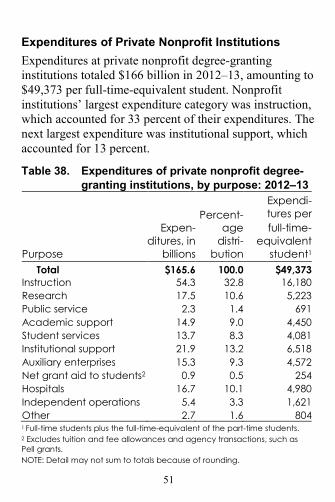
Expenditures of Private Nonprofit Institutions Expenditures at private nonprofit degree-granting institutions totaled $166 billion in 2012–13, amounting to $49,373 per full-time-equivalent student. Nonprofit institutions’ largest expenditure category was instruction, which accounted for 33 percent of their expenditures. The next largest expenditure was institutional support, which accounted for 13 percent.
Table 38. Expenditures of private nonprofit degree-granting institutions, by purpose: 2012–13
Purpose
Expen-ditures, in
billions
Percent- age
distri- bution
Expendi-tures per full-time-
equivalent student1
Total $165.6 100.0 $49,373 Instruction 54.3 32.8 16,180 Research 17.5 10.6 5,223 Public service 2.3 1.4 691 Academic support 14.9 9.0 4,450 Student services 13.7 8.3 4,081 Institutional support 21.9 13.2 6,518 Auxiliary enterprises 15.3 9.3 4,572 Net grant aid to students2 0.9 0.5 254 Hospitals 16.7 10.1 4,980 Independent operations 5.4 3.3 1,621 Other 2.7 1.6 804 1 Full-time students plus the full-time-equivalent of the part-time students. 2 Excludes tuition and fee allowances and agency transactions, such as Pell grants. NOTE: Detail may not sum to totals because of rounding.

52
Expenditures of Private For-Profit Institutions Expenditures at private for-profit 4-year and 2-year degree-granting institutions totaled $22 billion in 2012–13, amounting to $15,502 per full-time-equivalent student. Private for-profit institutions’ largest expenditure category was student services, academic and institutional support, which accounted for 65 percent of their expenditures in 2012–13. The next largest category was instruction, which accounted for 25 percent of their expenditures.
Table 39. Expenditures of private for-profit degree-granting institutions, by purpose: 2012–13
Purpose
Expendi- tures, in billions
Percent- age distri-
bution
Expenditures per full-time-
equivalent student1
Total $21.94 100.0 $15,502 Instruction 5.42 24.7 3,833 Research and public
service 0.03 0.1 20 Student services,
academic and institutional support 14.36 65.4 10,145
Auxiliary enterprises 0.46 2.1 328 Net grant aid to
students2 0.05 0.2 38 Other 1.61 7.3 1,139 1 Full-time students plus the full-time-equivalent of the part-time students. 2 Excludes tuition and fee allowances and agency transactions, such as student awards made from contributed funds or grant funds. NOTE: Detail may not sum to totals because of rounding.
53
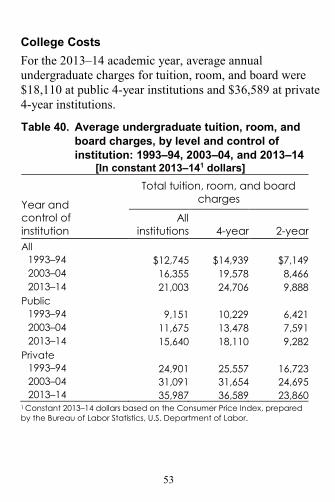
College Costs For the 2013–14 academic year, average annual undergraduate charges for tuition, room, and board were $18,110 at public 4-year institutions and $36,589 at private 4-year institutions.
Table 40. Average undergraduate tuition, room, and board charges, by level and control of institution: 1993–94, 2003–04, and 2013–14
[In constant 2013–141 dollars]
Year and control of institution
Total tuition, room, and board charges
All institutions 4-year 2-year
All 1993–94 $12,745 $14,939 $7,149 2003–04 16,355 19,578 8,466 2013–14 21,003 24,706 9,888
Public 1993–94 9,151 10,229 6,421 2003–04 11,675 13,478 7,591 2013–14 15,640 18,110 9,282
Private 1993–94 24,901 25,557 16,723 2003–04 31,091 31,654 24,695 2013–14 35,987 36,589 23,860
1 Constant 2013–14 dollars based on the Consumer Price Index, prepared by the Bureau of Labor Statistics, U.S. Department of Labor.

54
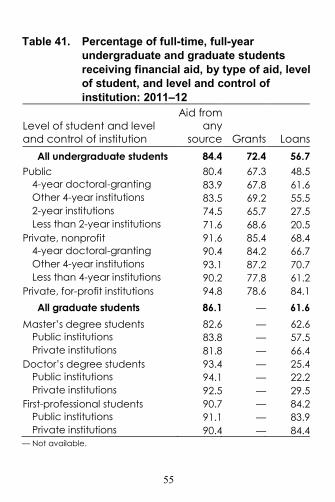
Financial Aid for Students About 84 percent of all full-time undergraduates who attended postsecondary institutions for the full academic year (full-year) received some form of financial aid in 2011–12. A higher percentage of students at private institutions received aid than did students at public institutions. About 92 percent of full-time undergraduates at private nonprofit institutions and 95 percent at private for-profit institutions received aid, compared with 80 percent at public institutions. Full-time students obtained aid through a variety of programs: 73 percent received some sort of federal aid, 24 percent received state aid, 34 percent received institutional aid, and 28 percent received aid from other sources (see Digest of Education Statistics, 2014, table 331.50). Private nonprofit institutions provided institutional aid to 74 percent of their full-time undergraduates. For all full-time, full-year undergraduates, the average student aid package from all sources (including grants, loans, work-study, and other) totaled $15,510 in 2011–12 (see Digest of Education Statistics, 2014, table 331.40).
In 2011–12, some 86 percent of all full-time, full-year graduate students received at least one form of financial aid. About 62 percent of graduate students received loans, 26 percent received fellowship grants, 21 percent received assistantships, 10 percent received tuition waivers, and 10 percent received support through their employers (see Digest of Education Statistics, 2014, table 332.30).
55
Table 41. Percentage of full-time, full-year undergraduate and graduate students receiving financial aid, by type of aid, level of student, and level and control of institution: 2011–12
Level of student and level and control of institution
Aid from any
source Grants Loans All undergraduate students 84.4 72.4 56.7
Public 80.4 67.3 48.5 4-year doctoral-granting 83.9 67.8 61.6 Other 4-year institutions 83.5 69.2 55.5 2-year institutions 74.5 65.7 27.5 Less than 2-year institutions 71.6 68.6 20.5
Private, nonprofit 91.6 85.4 68.4 4-year doctoral-granting 90.4 84.2 66.7 Other 4-year institutions 93.1 87.2 70.7 Less than 4-year institutions 90.2 77.8 61.2
Private, for-profit institutions 94.8 78.6 84.1 All graduate students 86.1 — 61.6
Master’s degree students 82.6 — 62.6 Public institutions 83.8 — 57.5 Private institutions 81.8 — 66.4
Doctor’s degree students 93.4 — 25.4 Public institutions 94.1 — 22.2 Private institutions 92.5 — 29.5
First-professional students 90.7 — 84.2 Public institutions 91.1 — 83.9 Private institutions 90.4 — 84.4
— Not available.

56
Federal Funding Federal on-budget support for education increased 383 percent from fiscal year (FY) 1965 to FY 2014, after adjustment for inflation. (On-budget support excludes education funds that are generated by federal subsidies, such as Federal Family Education Loans and the Federal Direct Student Loans.) Increases occurred from 1965 to 1975. After a change of 1 percent from 1975 to 1980, federal funding for education decreased approximately 16 percent from 1980 to 1985. Federal on-budget funding for education increased 128 percent from 1985 to 2014.
Federal support for education in FY 2014 was estimated at $80.1 billion for elementary and secondary education, $57.0 billion for postsecondary education, and $9.5 billion for other programs (see Digest of Education Statistics, 2014, table 401.10). Research support at educational institutions was estimated at $32.9 billion.
In FY 2013, an estimated $91.1 billion (about 50 percent of the $183.4 billion spent by the federal government on education) came from the U.S. Department of Education (see Digest of Education Statistics, 2014, table 401.20). The other agencies with the largest amounts of education funding included the U.S. Department of Health and Human Services ($28.8 billion), the U.S. Department of Agriculture ($23.3 billion), U.S. Department of Veterans Affairs ($11.7 billion) and the U.S. Department of Defense ($7.1 billion).

57
Table 42. Federal on-budget funds for education: Selected fiscal years 1965 through 2014
[In billions of dollars]
Year
Total on-budget support Unadjusted
dollars Constant 2014
dollars1 1965 $5.3 $37.2 1970 12.5 71.4 1975 23.3 93.5 1980 34.5 94.5 1985 39.0 78.6 1990 51.6 89.6 1995 71.6 106.1 2000 85.9 116.7 2001 94.8 125.5 2002 109.2 142.1 2003 124.4 157.4 2004 132.4 163.3 2005 147.9 176.2 2006 166.5 191.8 2007 145.7 163.5 2008 144.3 156.5 2009 271.3 293.7 2010 183.2 196.0 2011 183.7 192.7 2012 189.8 195.5 2013 183.4 186.2 2014 179.3 179.3 1 Data adjusted by the federal funds composite deflator prepared by the data source. NOTE: Some data have been revised from previously published figures.

58
Source Information
The following reports and surveys from the National Center for Education Statistics, Institute of Education Sciences, U.S. Department of Education (except where noted otherwise) were used as sources for this document.
Table 1: Digest of Education Statistics, 2014 (table 105.30), Common Core of Data (CCD), “State Nonfiscal Survey of Public Elementary and Secondary Education,” 1985–86 through 2012–13; National Elementary and Secondary Enrollment Projection Model, 1972 through 2024.
Table 2: Digest of Education Statistics, 2014 (table 105.30), Private Schools in American Education; Private School Universe Survey (PSS), 1989–90 through 2011–12; National Elementary and Secondary Enrollment Projection Model, 1972 through 2024.
Table 3: Digest of Education Statistics, 2014 (table 105.30), National Elementary and Secondary Enrollment Projection Model, 1972 through 2024.
Table 4: Digest of Education Statistics, 2014 (table 202.10), U.S. Department of Commerce, Census Bureau, Current Population Survey (CPS), October 1990 through October 2013.
Table 5: Digest of Education Statistics, 2014 (table 103.20), U.S. Department of Commerce, Census Bureau, Current Population Survey (CPS), October 1990 through October 2013.
Table 6: Digest of Education Statistics, 2004 (table 42), Digest of Education Statistics, 2014 (table 203.50), Common Core of Data (CCD), “State Nonfiscal Survey of Public Elementary/Secondary Education,” 1992–93, 2002–03, and 2012–13.
59
Table 7: Digest of Education Statistics, 2014 (table 204.30),
Statistics of Public Elementary and Secondary School Systems, 1977–78 and 1980–81; Common Core of Data (CCD), “State Nonfiscal Survey of Public Elementary/Secondary Education,” 1990–91 through 2012–13. U.S. Department of Education, Office of Special Education and Rehabilitative Services, Annual Report to Congress on the Implementation of The Individuals with Disabilities Education Act, selected years, 1977 through 1996; and Individuals with Disabilities Education Act (IDEA) database, retrieved October 3, 2014, from https://inventory.data.gov/dataset/8715a3e8-bf48-4eef-9deb-fd9bb76a196e/resource/a68a23f3-3981-47db-ac75-98a167b65259.
Table 8: Digest of Education Statistics, 2014 (table 303.30), Integrated Postsecondary Education Data System (IPEDS), “Fall Enrollment Survey” (IPEDS-EF:90), and Spring 2001, Spring 2011, and Spring 2014, Enrollment component.
Table 9: Digest of Education Statistics, 2014 (table 303.25), Integrated Postsecondary Education Data System (IPEDS), “Fall Enrollment Survey” (IPEDS-EF:90), and Spring 2001, Spring 2011, and Spring 2014, Enrollment component.
Table 10: Digest of Education Statistics, 2014 (table 103.20), U.S. Department of Commerce, Census Bureau, Current Population Survey (CPS), October 1985 through October 2013.
Table 11: Digest of Education Statistics, 2014 (table 303.40), Integrated Postsecondary Education Data System (IPEDS), “Fall Enrollment Survey” (IPEDS-EF:90), Spring 2001 and Spring 2014, Enrollment component; and Enrollment in Degree-Granting Institutions Projection Model, 1972 through 2024. U.S. Department of Commerce, Census Bureau, Current Population Survey (CPS), October, 1990, 2000, and 2013.
60
Table 12: Digest of Education Statistics, 2014 (table 306.10),
Integrated Postsecondary Education Data System (IPEDS), “Fall Enrollment Survey” (IPEDS-EF:90), Spring 2001, Spring 2011, and Spring 2014, Enrollment component.
Table 13: Digest of Education Statistics, 2014 (table 303.70), Integrated Postsecondary Education Data System (IPEDS), “Fall Enrollment Survey” (IPEDS-EF:90–99), and Spring 2001 through Spring 2014, Enrollment component.
Table 14: Digest of Education Statistics, 2014 (table 303.80), Integrated Postsecondary Education Data System (IPEDS), “Fall Enrollment Survey” (IPEDS-EF:90–99), and Spring 2001 through Spring 2014, Enrollment component.
Table 15: Digest of Education Statistics, 2014 (table 208.20), Common Core of Data (CCD), “State Nonfiscal Survey of Public Elementary/Secondary Education,” 1990–91 through 2012–13; Private School Universe Survey (PSS), 1989–90 through 2011–12.
Table 16: Digest of Education Statistics, 2014 (table 211.20), Schools and Staffing Survey (SASS), “Public School Teacher Data File,” 1990–91, 1999–2000, 2003–04, 2007–08, and 2011–12; and “Charter School Teacher Data File,” 1999-2000. U.S. Department of Labor, Bureau of Labor Statistics, Consumer Price Index.
Table 17: Digest of Education Statistics, 2014 (table 209.20), Schools and Staffing Survey (SASS), “Public School Teacher Data File,” 2011–12.
Table 18: Digest of Education Statistics, 2014 (table 209.20), Schools and Staffing Survey (SASS), “Private School Teacher Data File,” 2011–12.
Table 19: Digest of Education Statistics, 2014 (table 314.30), Integrated Postsecondary Education Data System (IPEDS), Spring 2014, Human Resources component, Fall Staff section.

61
Tables 20 and 21: Digest of Education Statistics, 2014 (table
316.10), Integrated Postsecondary Education Data System (IPEDS), “Salaries, Tenure, and Fringe Benefits of Full-Time Instructional Faculty Survey” (IPEDS-SA:90–99), and Winter 2002–03 through Winter 2011–12, Spring 2013 and Spring 2014, Human Resources component, Salaries section. U.S. Department of Labor, Bureau of Labor Statistics, Consumer Price Index.
Table 22: Digest of Education Statistics, 2014 (table 221.10), National Assessment of Educational Progress (NAEP), 1992, 2011, and 2013 Reading Assessments, retrieved June 16, 2014, from the Main NAEP Data Explorer (http://nces.ed.gov/nationsreportcard/naepdata/).
Table 23: Digest of Education Statistics, 2014 (table 222.10), National Assessment of Educational Progress (NAEP), 1990, 2011, and 2013 Mathematics Assessments, retrieved June 16, 2014, from the Main NAEP Data Explorer (http://nces.ed.gov/nationsreportcard/naepdata/).
Table 24: Digest of Education Statistics, 2014 (table 223.10), National Assessment of Educational Progress (NAEP), 2009 and 2011 Science Assessments.
Table 25: Digest of Education Statistics, 2014 (table 225.50), High School and Beyond Longitudinal Study of 1980 Sophomores (HS&B-So:80/82), “High School Transcript Study”; and 1998, 2005, and 2009 High School Transcript Study (HSTS).
62
Table 26: Digest of Education Statistics, 2014 (table 219.10),
Statistics of Public Elementary and Secondary School Systems, 1976–77 and 1979–80; Statistics of Nonpublic Elementary and Secondary Schools, 1976 through 1980; Common Core of Data (CCD), “State Nonfiscal Survey of Public Elementary/Secondary Education,” 1984–85 through 2009–10; “State Dropout and Completion Data File,” 2005–06 through 2011–12; Private School Universe Survey (PSS), 1989 through 2011; and National High School Graduates Projection Model, 1972–73 through 2023–24.
Table 27: Digest of Education Statistics, 2014 (table 219.70), U.S. Department of Commerce, Census Bureau, Current Population Survey (CPS), October 1975 through October 2014.
Tables 28 and 29: Digest of Education Statistics, 2014 (table 318.10), Higher Education General Information Survey (HEGIS), “Degrees and Other Formal Awards Conferred” surveys, 1979–80 and 1984–85; and Integrated Postsecondary Education Data System (IPEDS), “Completions Survey” (IPEDS-C:90–98), and Fall 2000 through Fall 2013, Completions component.
Table 30: Digest of Education Statistics, 2014 (table 104.10 and 104.20), U.S. Department of Commerce, Census Bureau, Current Population Survey (CPS), March 1980 through March 2014.

63
Table 31: Digest of Education Statistics, 2014 (table 106.10),
Revenues and Expenditures for Public Elementary and Secondary Education, 1980–81 and 1985–86; Common Core of Data (CCD), “National Public Education Financial Survey,” 1990–91 through 2011–12; Higher Education General Information Survey (HEGIS), Financial Statistics of Institutions of Higher Education, 1980–81 and 1985–86; Integrated Postsecondary Education Data System (IPEDS), “Finance Survey” (IPEDS-F:FY91–99), and Spring 2002 through Spring 2014. U.S. Department of Commerce, Bureau of Economic Analysis, National Income and Product Accounts Tables, retrieved May 1, 2015, from http://www.bea.gov/iTable/index_nipa.cfm.
Table 32: Digest of Education Statistics, 2014 (table 235.10), Revenues and Expenditures for Public Elementary and Secondary Education, 1970–71 through 1985–86; Common Core of Data (CCD), “National Public Education Financial Survey,” 1986–87 through 2011–12.
Table 33: Digest of Education Statistics, 2014 (table 236.55), Revenues and Expenditures for Public Elementary and Secondary Education, 1970–71 through 1985–86; Common Core of Data (CCD), “National Public Education Financial Survey,” 1986–87 through 2011–12.
Table 34: Digest of Education Statistics, 2014 (table 333.10), Integrated Postsecondary Education Data System (IPEDS), Spring 2013, Enrollment component and Spring 2014, Finance component.
Table 35: Digest of Education Statistics, 2014 (table 333.50), Integrated Postsecondary Education Data System (IPEDS), Spring 2013, Enrollment component and Spring 2014, Finance component.
Table 36: Digest of Education Statistics, 2014 (table 333.60),
64
Integrated Postsecondary Education Data System (IPEDS), Spring 2013, Enrollment component and Spring 2014, Finance component.
Table 37: Digest of Education Statistics, 2014 (table 334.10), Integrated Postsecondary Education Data System (IPEDS), Spring 2013, Enrollment component and Spring 2014, Finance component.
Table 38: Digest of Education Statistics, 2014 (table 334.40), Integrated Postsecondary Education Data System (IPEDS), Spring 2013, Enrollment component and Spring 2014, Finance component.
Table 39: Digest of Education Statistics, 2014 (table 334.60), Integrated Postsecondary Education Data System (IPEDS), Spring 2013, Enrollment component and Spring 2014, Finance component.
Table 40: Digest of Education Statistics, 2014 (table 330.10), Integrated Postsecondary Education Data System (IPEDS), “Fall Enrollment Survey” (IPEDS-EF:92), “Institutional Characteristics Survey” (IPEDS-IC:92), Spring 2004 and Spring 2014, Enrollment component, and Fall 2003 and Fall 2013, Institutional Characteristics component. U.S. Department of Labor, Bureau of Labor Statistics, Consumer Price Index.
Table 41: Digest of Education Statistics, 2014 (tables 331.60 and 332.30), 2011–12 National Postsecondary Student Aid Study (NPSAS:12).
Table 42: Digest of Education Statistics, 2014 (table 401.10), U.S. Department of Education, Budget Service. U.S. Department of Education, National Center for Education Statistics, unpublished tabulations. U.S. Office of Management and Budget, Budget of the U.S. Government, Appendix, fiscal years 1967 through 2015. National Science Foundation, Federal Funds for Research and Development, fiscal years 1967 through 2014.

65
NCES Website Tools http://nces.ed.gov The NCES website serves as your gateway to a rich source of data. A variety of information access tools help you find the education data you need, quickly and easily.
You can... (1) access thousands of publications and data products: http://nces.ed.gov/pubsearch/
(2) learn about the more than 40 NCES programs and surveys, including those shown below: http://nces.ed.gov/surveys/
(3) build your own tables using raw data from NCES surveys: http://nces.ed.gov/datatools/
(4) obtain information on individual schools, colleges, and libraries: http://nces.ed.gov/globallocator/
(5) explore Kids’ Zone with a child: http://nces.ed.gov/nceskids/


