Vol. 108 (2005) ACTA PHYSICA POLONICA A No. 1 Proceedings of the XXI International Meeting on Radio and Microwave Spectroscopy RAMIS 2005, Pozna´ n-B¸ edlewo, Poland, April 24–28, 2005 Mobile NMR for Analysis of Polyethylene Pipes B. Bl ¨ umich a , F. Casanova a , A. Buda a , K. Kremer a and T. Wegener b a Institute of Technical and Macromolecular Chemistry RWTH Aachen University Worringerweg 1, 52056 Aachen, Germany b Institut f¨ ur Rohrleitungsbau, FH Oldenburg Industriestr. 11, 26121 Oldenburg, Germany NMR relaxometry is a suitable tool to determine the morphology of semi-crystalline polymers by its ability to discriminate between rigid, mostly crystalline and soft, usually amorphous material. The NMR-MOUSE ◦ R (nu- clear magnetic resonance mobile universal surface explorer) was explored in this work to supply morphological data of poly(ethylene) pipes nonde- structively. PE-100 pipes were investigated in the new state, after squeezing them flat, and after annealing well below the glass temperature. Further- more, the change in morphology induced by a pressure load from the inside and a point load from the outside was investigated as a function of depth, and the morphology change across a welding line was imaged. A shear-band was detected by destructive high-field NMR imaging in an area of severe deformation of a pipe, where an anomalous depths profile was observed by the NMR-MOUSE. These results demonstrate that the NMR-MOUSE is a suitable tool for non-destructive state assessment of polymer pipes on the basis of laboratory reference data. PACS numbers: 81.05.Lg, 82.35.Lr, 76.60.–k 1. Introduction Polymer pipes are widely used for gas and water transport. A material of high commercial interest is high density polyethylene (PE), and the testing procedures for the prediction of their lifetime are spelled out in norms and regu- lations [1]. A fundamental issue of discussion is the laboratory testing conditions for accelerated aging which come closest to the deterioration of the pipes in actual use. (13)
Transcript
Vol. 108 (2005) ACTA PHYSICA POLONICA A No. 1
Proceedings of the XXI International Meeting on Radio and Microwave SpectroscopyRAMIS 2005, Poznan-Bedlewo, Poland, April 24–28, 2005
Mobile NMR for Analysis
of Polyethylene Pipes
B. Blumicha, F. Casanovaa, A. Budaa, K. Kremera
and T. Wegenerb
aInstitute of Technical and Macromolecular ChemistryRWTH Aachen University
NMR relaxometry is a suitable tool to determine the morphology of
semi-crystalline polymers by its ability to discriminate between rigid, mostly
crystalline and soft, usually amorphous material. The NMR-MOUSE◦R (nu-
clear magnetic resonance mobile universal surface explorer) was explored
in this work to supply morphological data of poly(ethylene) pipes nonde-
structively. PE-100 pipes were investigated in the new state, after squeezing
them flat, and after annealing well below the glass temperature. Further-
more, the change in morphology induced by a pressure load from the inside
and a point load from the outside was investigated as a function of depth,
and the morphology change across a welding line was imaged. A shear-band
was detected by destructive high-field NMR imaging in an area of severe
deformation of a pipe, where an anomalous depths profile was observed by
the NMR-MOUSE. These results demonstrate that the NMR-MOUSE is a
suitable tool for non-destructive state assessment of polymer pipes on the
basis of laboratory reference data.
PACS numbers: 81.05.Lg, 82.35.Lr, 76.60.–k
1. Introduction
Polymer pipes are widely used for gas and water transport. A materialof high commercial interest is high density polyethylene (PE), and the testingprocedures for the prediction of their lifetime are spelled out in norms and regu-lations [1]. A fundamental issue of discussion is the laboratory testing conditionsfor accelerated aging which come closest to the deterioration of the pipes in actualuse.
(13)
14 B. Blumich et al.
The macroscopic properties of semi-crystalline polymers are determined bythe morphology which changes at elevated temperature due to annealing and atelevated stress due to creep [2]. For lifetime predictions, polymer pipes are testedunder pressure at an elevated temperature of 80◦C, and the results are then ex-trapolated to room temperature based on an Arrhenius relationship [3]. Wettingagents are used to approximate the conditions encountered in real use [4].
However, the lifetime prediction of PE pipes buried in the ground is stillunder discussion [5, 6], and to answer the question how far the conditions of accel-erated laboratory aging defined in different norms and regulations are a sufficientlygood approximation for the material deterioration under conditions of actual use,further investigations with methods sensitive to the different aspects of the poly-mer morphology are required. NMR relaxometry in combination with differentialscanning calorimetry (DSC) has been found recently to be a powerful combinationof methods for studying the effects of pressure and temperature on the morphologyand the lifetime of poly(propylene) pipes [7]. While the investigations reportedby Litvinov and Soliman were conducted in the laboratory on samples taken frompipes, the NMR-MOUSE◦R [8] is capable of providing similar data, albeit withlower signal-to-noise ratio, in a non-destructive fashion, opening up the perspec-tive to quantify the state of PE pipes and to predict their lifetime on the basisof reference data. To substantiate this claim we have conducted first experimentswith the NMR-MOUSE on PE pipes [9].
PE is a partially crystalline material consisting of crystalline lamellae withfolded polymer chains and amorphous regions, where the polymer chains are ex-pected to be randomly coiled. Yet, depending on the processing conditions, theorientation of the chain segments in the amorphous domains is not necessarilyrandom. Due to shrinkage upon cooling and mechanical load, local order can beintroduced. Furthermore, the polymer chains in the crystalline lamellae are by nomeans absolutely rigid, but can diffuse through the crystalline domains giving riseto creep and stress relaxation [10]. In addition to temperature, these moleculardynamics are further modified by the contact and ingress of solvent molecules. Itis therefore clear that the material properties depend on the morphology, in par-ticular the crystallinity and the order in the amorphous domains, which in turndepend on the mechanical and thermal history of the object and its contact withsolvents and gases. Further material changes can be induced chemically, for ex-ample, by reaction of chain defects and residual catalyst with permeating oxygenand other chemicals.
2. Experimental procedure
Commercial PE-100 water pipes were investigated at room temperature withthe NMR-MOUSE, a mobile unilateral NMR sensor which collects the NMR sig-nal in the stray field from a region outside the device (Fig. 1) [8, 11]. TheNMR-MOUSE is operated by a portable spectrometer which provides the radio-
Mobile NMR for Analysis of Polyethylene Pipes 15
Fig. 1. Mobile NMR for nondestructive testing of PE pipes. The NMR-MOUSE is
visible underneath the pipe. The NMR spectrometer for operation of the sensor is in
the pilots case next to the pipe. The spectrometer is operated by a notebook computer.
-frequency (rf) excitation pulses and collects the data. As the measurement isconducted in inhomogeneous polarization and rf fields, the envelope of a Carr–Purcell–Meiboom–Gill (CPMG)-type multi-echo train is acquired [11]. In weaklyinhomogeneous fields, the CPMG echo envelope corresponds to the envelope of thefree induction decay in a perfectly homogeneous field, and for a mono-exponentialdecay, the decay time constant would be the transverse relaxation time T2. Instrongly inhomogeneous fields, the flip angle distribution gives rise to a superpo-sition of the Hahn and stimulated echoes in the multi-echo train, and the signaldecay is determined by effective transverse relaxation time T2eff > T2 [12].
For PE, the echo envelope measured with the NMR-MOUSE can be wellapproximated by a bi-exponential function
y = y0 + Ashort exp(−t/T2eff,short) + Along exp(−t/T2eff,long). (1)
The experimental data (Fig. 2a) are evaluated in either of two ways (Fig. 2b).For data with a good signal-to-noise ratio, the relative amplitude ratioAshort/(Ashort + Along), and the relaxation rates 1/T2eff,short and 1/T2eff,long aredetermined from a fit of Eq. (1) to the measured data and interpreted in terms ofthe crystallinity, a measure of the average size of the crystallites, and a measure ofthe order in the amorphous domains, respectively. Let us note that the NMR crys-tallinity is defined via the segmental mobility and may include signal from rigidamorphous domains, thus differing from the X-ray crystallinity. Alternatively, arelaxation weight can be calculated from suitably selected partial sums of echoesyi (Fig. 2b). For example, the weight function
w(2, k, l,m) =k∑
i=1
yi/
(k∑
i=2
yi +m∑
i=l
yi
)(2)
16 B. Blumich et al.
Fig. 2. (a) Experimental NMR signal from PE. Each point corresponds to the maxi-
mum of an NMR echo. (b) Principle of data evaluation for calculation of a relaxation
weight. The sums defined in Eq. (2) are represented in terms of integrals as areas
underneath the decay curve.
scales between 0 and 1 and is large for morphologies with a high content in rigiddomains and is small for morphologies with a high content in mobile domains, aslong as the partial sums are suitably placed at the beginning and in the middle ofthe decay. The relaxation weight is another measure of the crystallinity, which iseasier to compute than a fit as no particular functional dependence of the signaldecay needs to be assumed. But it depends on the summation limits and the echotime tE used for measurement.
3. Results
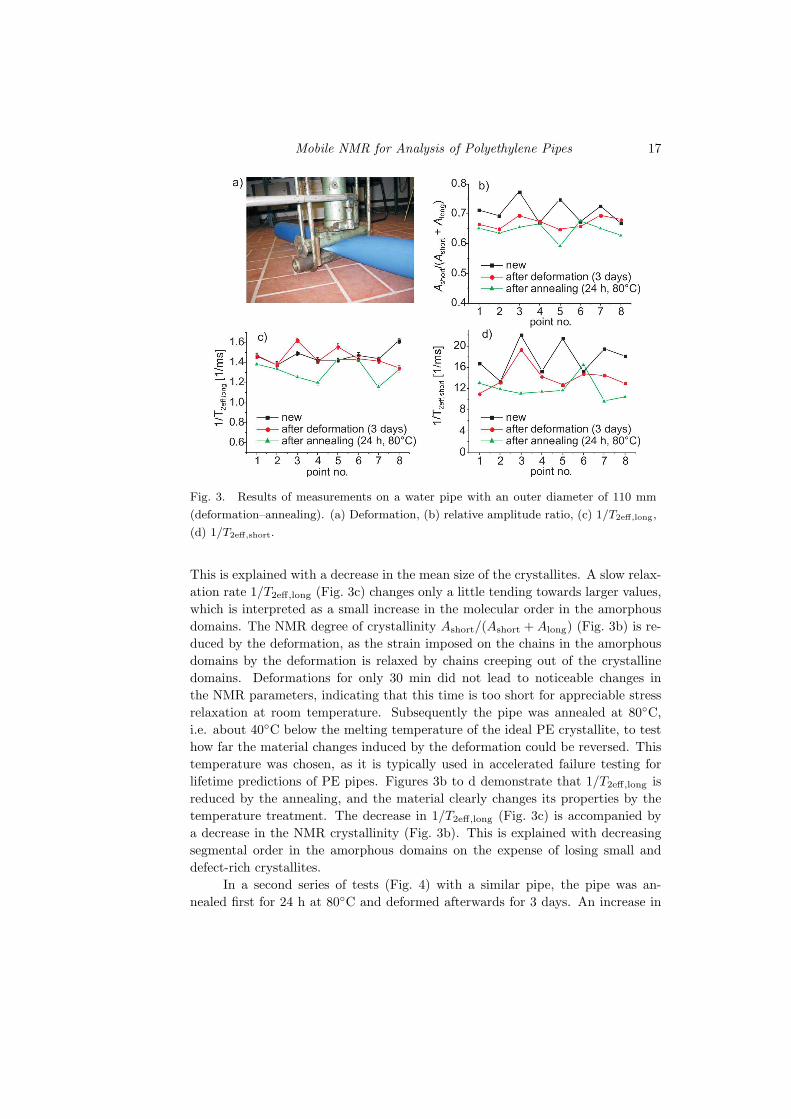
To explore the use of the NMR-MOUSE for non-destructive testing of PEpipes, an extreme deformation, here a full compression, of a blue water pipe (PE100, SDR 17) with an outer diameter of 110 mm and a wall thickness of 7 mmwas investigated. Such deformations are permitted by the regulations to turn offthe water flow for repair work. The NMR-MOUSE used operated at a frequencyof 13.7 MHz in a depth of 1 mm. The pipe was measured at 8 points placedin equidistant steps on the circumference. Then the compression was executedfor 3 days following the procedures spelled out in sheet GW 332 of DVGW witha commercial device (Fig. 3a) in such a way that points 1 and 5 marked thepositions of extreme deformation. There, crazes were observed on the outside wallas a result of the deformation. Following the deformation, the pipe was returnedinto the round original state and measured again at the same points. Subsequentlythe pipe was annealed at 80◦C for 24 h and after cooling measured again at roomtemperature.
Already the new pipe showed a scatter of about 12% in the fit parameters1/T2eff,long, 1/T2eff,short, and Ashort/(Ashort + Along) (Figs. 3b–d). This scatter isreproducible and in accordance with the existence of local strain in the pipe. Theeffects remaining from the deformation shorten the values of 1/T2eff,short (Fig. 3d).
Mobile NMR for Analysis of Polyethylene Pipes 17
Fig. 3. Results of measurements on a water pipe with an outer diameter of 110 mm
This is explained with a decrease in the mean size of the crystallites. A slow relax-ation rate 1/T2eff,long (Fig. 3c) changes only a little tending towards larger values,which is interpreted as a small increase in the molecular order in the amorphousdomains. The NMR degree of crystallinity Ashort/(Ashort + Along) (Fig. 3b) is re-duced by the deformation, as the strain imposed on the chains in the amorphousdomains by the deformation is relaxed by chains creeping out of the crystallinedomains. Deformations for only 30 min did not lead to noticeable changes inthe NMR parameters, indicating that this time is too short for appreciable stressrelaxation at room temperature. Subsequently the pipe was annealed at 80◦C,i.e. about 40◦C below the melting temperature of the ideal PE crystallite, to testhow far the material changes induced by the deformation could be reversed. Thistemperature was chosen, as it is typically used in accelerated failure testing forlifetime predictions of PE pipes. Figures 3b to d demonstrate that 1/T2eff,long isreduced by the annealing, and the material clearly changes its properties by thetemperature treatment. The decrease in 1/T2eff,long (Fig. 3c) is accompanied bya decrease in the NMR crystallinity (Fig. 3b). This is explained with decreasingsegmental order in the amorphous domains on the expense of losing small anddefect-rich crystallites.
In a second series of tests (Fig. 4) with a similar pipe, the pipe was an-nealed first for 24 h at 80◦C and deformed afterwards for 3 days. An increase in
18 B. Blumich et al.
Fig. 4. Experimental results from a water pipe with an outer diameter of 110 mm
(annealing–deformation). (a) Deformed pipe after annealing and deformation, (b) rela-
1/T2eff,short is observed with annealing (Fig. 4d) corresponding to an increase in thecrystallite size. At the same time the decrease in 1/T2eff,long (Fig. 4c) shows thatorder in the amorphous domains is reduced as local stress is relaxed. The increasein the NMR crystallinity (Fig. 4b) upon annealing below the melting temperatureof the ideal crystal is explained with a recrystallization of small crystallites anda growth of small crystallites on the expense of a loss of mobile amorphous ma-terial. The larger crystallinity after annealing explains the observation that thepipe could not completely be reshaped into its original circular form after defor-mation and appeared stiffer than before (Fig. 4a). After deformation, 1/T2eff,short
is reduced in all measurement positions (Fig. 4d) with a particularly large effectin positions 1 and 5 where the deformation was strongest. No significant changesare observed in 1/T2eff,long (Fig. 4c) indicating that the amorphous regions are notmuch affected in this case.
In another series of measurements two further, blue PE-100 water pipes of thesame kind were investigated in an internal pressure test with an external point load.Before the test, pipe 1 was mapped from the inside with a specially designed NMR--MOUSE on a 1 cm2 grid. The NMR-MOUSE and the measurement results aredepicted in Fig. 5. The parameter plotted is the weight function according toEq. (2) in a measurement depth of 0–1 mm acquired with an echo time tE =25 µs. From an axial trace through the 2D map at 2 cm circumference it is clear
Mobile NMR for Analysis of Polyethylene Pipes 19
Fig. 5. Map of the relaxation weight for a section in the center of pipe 1 on a 1 cm2 grid
(top). At some positions, the measured values clearly deviate from the mean. The axial
trace at 2 cm circumference is plotted with error bars to compare the variation with
the measurement error (bottom). The data were acquired with a special NMR-MOUSE
constructed for measuring inside a pipe (bottom right).
that the values vary beyond the experimental error. At each position the weightfunction was measured three times, and the average and the standard deviationwere computed. For reasons of simplicity, the mean value is denoted as w. At9 cm, w assumes a much higher value in the selected trace and at 14 cm a muchlower value than the mean value from the different positions of the pipe. Clearly,the pipe is inhomogeneous in agreement with the results depicted in Figs. 3 and 4.
After mapping pipe 1 at different positions, the pipe was tested accordingto Kiesselbach [13] with external point loads and internal water pressure (Fig. 6).The testing temperature was +5◦C. At three positions external point loads wereapplied with pins having half spherical caps of 10 mm diameter deforming theunpressurized pipe by 0%, 1%, and 6%. Then the internal water pressure was
Fig. 6. Setup at the University of Oldenburg for conducting the pressure test with an
external point load according to Kiesselbach.
20 B. Blumich et al.
Fig. 7. Measured material changes on pipes subjected to the internal pressure test
with an external point load. (a) Pipe 1, tE = 25 µs. (b) Pipe 2, tE = 45 µs. The
deformation-dependent data were measured from the inside with the NMR-MOUSE
depicted in Fig. 5. (c) Material changes in pipe 2 at different depths. The measurements
were conducted with a different NMR-MOUSE from the outside and a different echo
time, so that the values on the abscissae of parts (b) and (c) are not comparable in
absolute numbers.
turned on for 24 h to 15 bar, which is by a factor of 1.5 higher than the maximumvalue allowed for the operation of drinking water pipes. Following the pressure test,the same positions were measured again with the NMR-MOUSE from the inside.The values obtained before and after the pressure test are compared in Fig. 7a.The reference measurements on a point outside the deformation region produce thesame values before and after the test. Similarly, the values for 0% deformation areclose but not identical as the pipe expanded upon pressurizing. However, alreadyfor the 1% deformation, the weight function w changes significantly, and a 17%change is observed for 6% deformation. This is in agreement with finite elementsimulations by Kiesselbach [13], who predicted a beginning damage in the innerpipe wall for this situation.
Pipe 2 was also investigated in the pressure test with a point load and threedeformations but with a lower inner pressure of 6 bar corresponding to the 1.5 foldof the maximum value allowed for gas pipes. Furthermore, instead of the relaxationweight w (Eq. (2)) the amplitude ratio (Eq. (1)) was evaluated (Fig. 7b). The sametrend of the data is observed as in Fig. 7a, but the change in the amplitude ratiois only about 6% at 6% deformation in agreement with a lower pressure load.
The pressure points of pipe 1 were further investigated by depth-dependentmeasurements with a conventional NMR-MOUSE from the outside. For the ref-erence point, for 0%, and for 1% deformation, the amplitude ratios increase withdepth changing from 0 to 2 mm. This corresponds to NMR crystallinity increas-ing from the outside to the inside. The values for the reference point and for 0%deformation are about the same. Those for 1% deformation are somewhat lower,which can be explained by material inhomogeneities. However, the values for 6%deformation are very different. Here the amplitude ratio decreases with depth,indicating a significant and unexpected change in the material properties.
An increase in the amplitude ratio or in w correlates with reduced segmentalmobility of the macromolecular chains (cf. Eqs. (1) and (2)), in agreement with the
Mobile NMR for Analysis of Polyethylene Pipes 21
expected crystallinity gradient induced by cooling of the pipe during manufactur-ing and with the NMR-crystallinity gradient observed for increasing deformations(Figs. 7a, b). The data in Fig. 7a therefore confirm that the areas of high w inthe map of pipe 1 (Fig. 5) can be interpreted as regions of increased local strain.
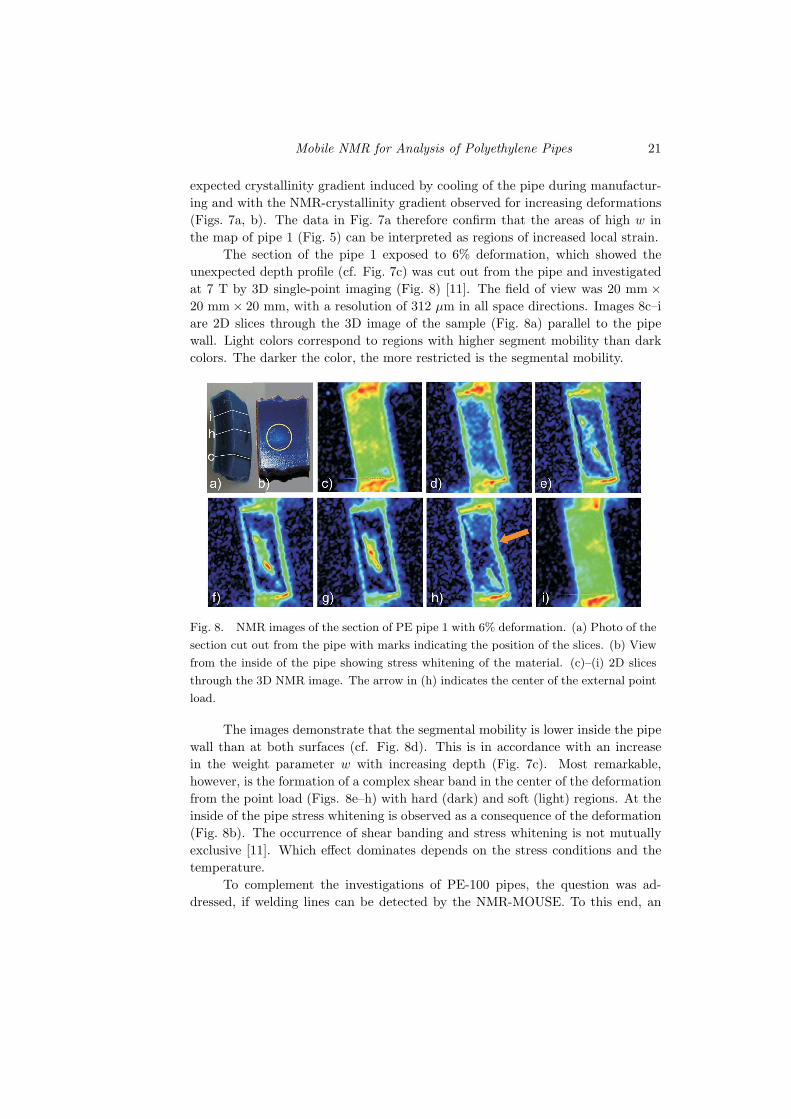
The section of the pipe 1 exposed to 6% deformation, which showed theunexpected depth profile (cf. Fig. 7c) was cut out from the pipe and investigatedat 7 T by 3D single-point imaging (Fig. 8) [11]. The field of view was 20 mm ×20 mm× 20 mm, with a resolution of 312 µm in all space directions. Images 8c–iare 2D slices through the 3D image of the sample (Fig. 8a) parallel to the pipewall. Light colors correspond to regions with higher segment mobility than darkcolors. The darker the color, the more restricted is the segmental mobility.
Fig. 8. NMR images of the section of PE pipe 1 with 6% deformation. (a) Photo of the
section cut out from the pipe with marks indicating the position of the slices. (b) View
from the inside of the pipe showing stress whitening of the material. (c)–(i) 2D slices
through the 3D NMR image. The arrow in (h) indicates the center of the external point
load.
The images demonstrate that the segmental mobility is lower inside the pipewall than at both surfaces (cf. Fig. 8d). This is in accordance with an increasein the weight parameter w with increasing depth (Fig. 7c). Most remarkable,however, is the formation of a complex shear band in the center of the deformationfrom the point load (Figs. 8e–h) with hard (dark) and soft (light) regions. At theinside of the pipe stress whitening is observed as a consequence of the deformation(Fig. 8b). The occurrence of shear banding and stress whitening is not mutuallyexclusive [11]. Which effect dominates depends on the stress conditions and thetemperature.
To complement the investigations of PE-100 pipes, the question was ad-dressed, if welding lines can be detected by the NMR-MOUSE. To this end, an
22 B. Blumich et al.
Fig. 9. 1D image across a welding line of two PE plates scanned in a pointwise fashion
by lateral displacement of an NMR-MOUSE.
NMR-MOUSE was constructed with a narrow coil to reduce the width of thesensitive volume, and a lateral profile across the welding line was measured at adepth of 1 mm. Within the area of the welding line, the relaxation weight w ishigher than outside, indicating higher NMR crystallinity. The spatial resolutionis remarkably good, because the width of the imaged profile is only slightly largerthan the width of the welding line (Fig. 9). Further investigations are needed tocorrelate the NMR signal with the quality of the welding line and to develop theNMR-MOUSE into a tool for safety inspection of welding lines.
4. Summary
The NMR-MOUSE has been shown to be suitable to characterize morpho-logical changes in semi-crystalline polymers non-destructively. PE-100 pipes wereinvestigated with the NMR-MOUSE with regard to material inhomogeneities andmaterial changes before and after deformation and annealing at 80◦C as well asbefore and after pressure tests with a point load. The results demonstrate thatthe associated changes in the semi-crystalline morphology can be followed by theNMR-MOUSE and consistently be explained. High-field NMR imaging revealedthe formation of a shear band in a zone of high deformation by a point load.The investigations conducted so far serve to illustrate the potential use of mobileNMR for non-destructive testing of PE pipes. In particular, they demonstrate thatthis methodology is sufficiently sensitive to material changes and can be used fornon-destructive state assessment of PE pipes in the field. This substantiates theperspective to conduct lifetime predictions on the basis of non-destructive field
Mobile NMR for Analysis of Polyethylene Pipes 23
tests and laboratory reference data. Moreover, the method can potentially beuseful for safety inspection of welding lines in polymer products.
Acknowledgments
The authors thank M. Adams, K. Munnemann, and A. Amar at ITMCof RWTH Aachen for their help with the NMR-MOUSE measurements and thesingle-point imaging measurements as well as T. Wegner, M. Boge, and M. Heyer atIRO Oldenburg for conducting the pressure tests with a point load. The stimulat-ing initiatives and interesting comments of H. Wagener to this work are gratefullyacknowledged.
References
[1] See for example DVGW-Arbeitsblatt G 401 and DVGW-Hinweis W 401.
[2] D.W. van Krevelen, Properties of Polymers, Elsevier, Amsterdam 1990.
[3] Rohrsysteme aus PE 100, Ed. H. Bromstrup, Vulkan-Verlag, Essen 2004.
[4] J. Hessel, 3R International 40, 178, 360 (2001).
[5] H. Krietenbrink, R. Kloth, 3R International 43, 576 (2004).
[6] R. Grosse-Boes, R. Kloth, 3R International 43, 233 (2004).
[7] V.M. Litvinov, M. Soliman, Polymer 46, 3077 (2005).
[8] G. Eidmann, R. Savelsberg, P. Blumler, B. Blumich, J. Magn. Reson. A 122,
104 (1996).
[9] B. Blumich, F. Casanova, A. Buda, K. Kremer, T. Wegener, 3R International, in
press.
[10] G. Strobl, The Physics of Polymers, Springer, Berlin 1996.
[11] B. Blumich, NMR Imaging of Materials, Clarendon Press, Oxford 2000.
[12] F. Balibanu, K. Hailu, R. Eymael, D.E. Demco, B. Blumich, J. Magn. Reson.
145, 246 (2000).
[13] G. Kiesselbach, gwf-Wasser/Abwasser 145, 45 (2004).