29
Q3 2015 A MoPub Marketplace Report MOBILE PROGRAMMATIC TRENDS
Q3 2015A MoPub Marketplace Report
MOBILE PROGRAMMATIC TRENDS
Inventory discovery is a critical element in today’s mobile programmatic landscape. With more than 335 billion monthly ad requests on MoPub alone, there’s never been more supply available. While more supply is good, for advertisers, it means finding the right impressions can be more difficult; and for publishers, connecting with the right buyers becomes more competitive. That’s why we focus on the uncharted inventory opportunity in this quarter’s report — and how it performs for publishers and advertisers alike.
At this critical juncture in the year, we also assess the state of programmatic as a precursor to holiday spending. To do this, we take an in-depth look at how Q3 2015 compared to Q3 2014, giving us an indication of what may lie ahead.
Finally, we continue to follow the trend of how specific moments in time matter to mobile advertisers. While moments have always been important in traditional media like television, advertisers are now focusing spend in the same manner on mobile. We saw this during the Super Bowl in Q1 of this year — and seek to expand on those findings in this quarter’s report.
FOREWORD
© MoPub, Inc. 2015. All Rights Reserved. Twitter, Inc., MoPub, Inc, the Twitter logo and MoPub logo are trademarks or registered trademarks of Twitter, Inc. and MoPub, Inc. respectively. All other trademarks and logos are the property of their respective owners. This data is provided for information purposes only and while efforts are made to ensure accuracy, errors may arise.
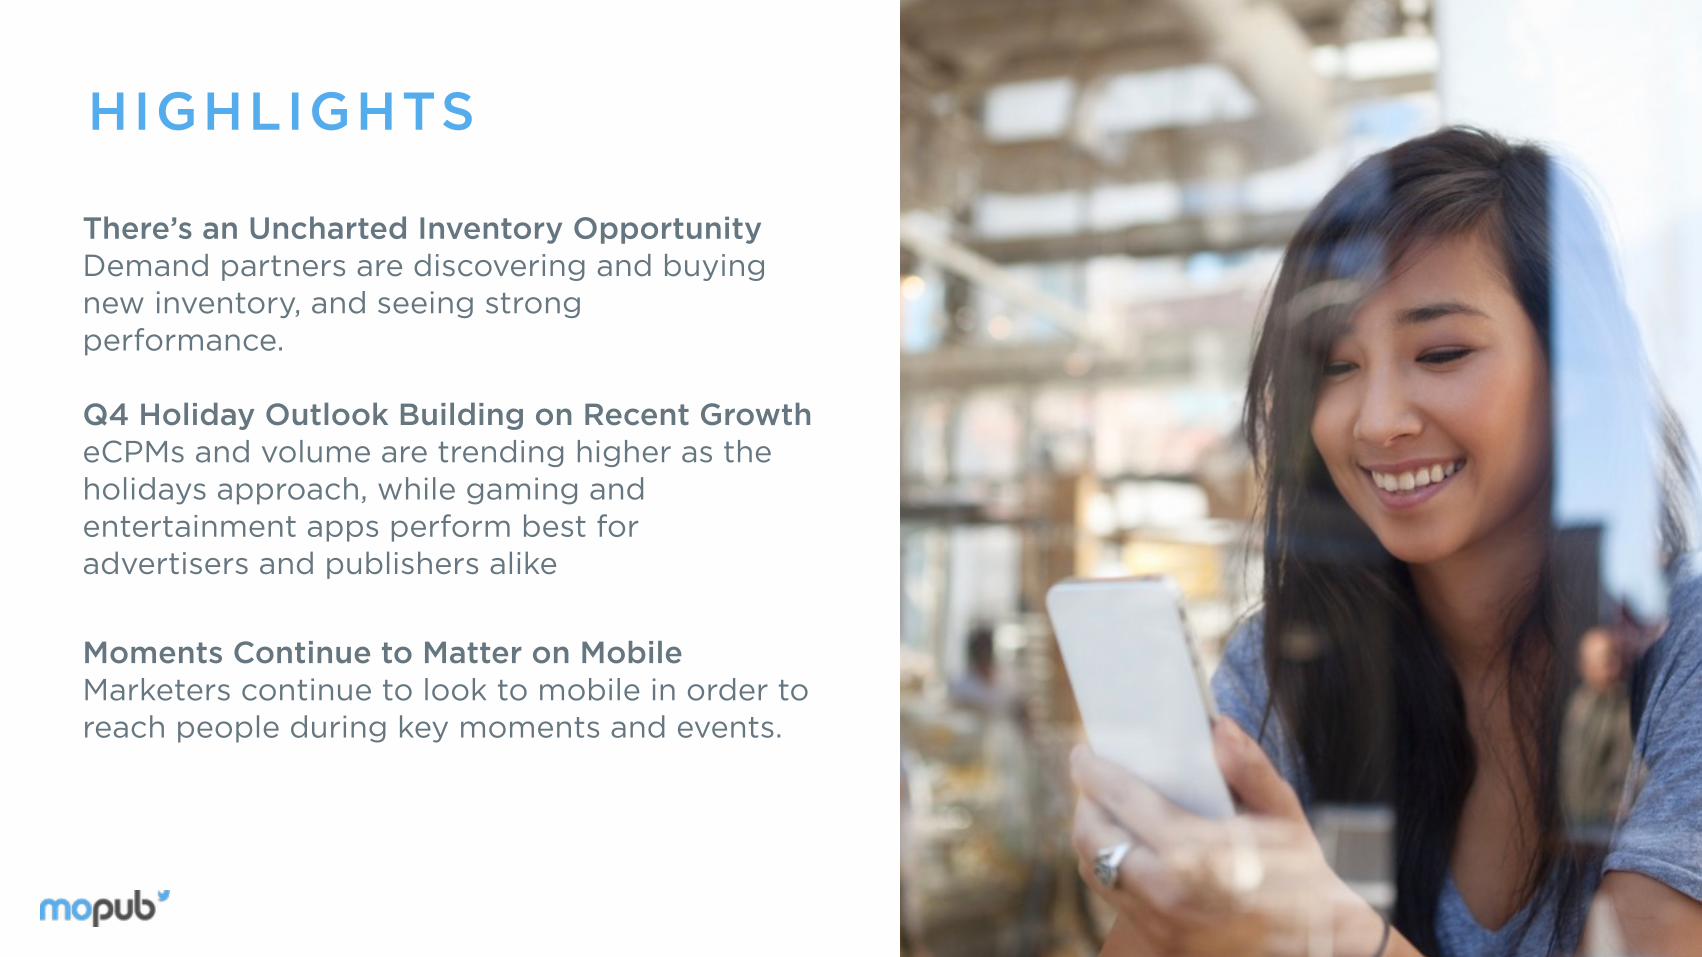
There’s an Uncharted Inventory Opportunity Demand partners are discovering and buying new inventory, and seeing strong performance.
Q4 Holiday Outlook Building on Recent Growth eCPMs and volume are trending higher as the holidays approach, while gaming and entertainment apps perform best for advertisers and publishers alike
Moments Continue to Matter on Mobile Marketers continue to look to mobile in order to reach people during key moments and events.
HIGHLIGHTS

THE UNCHARTED INVENTORY OPPORTUNITY
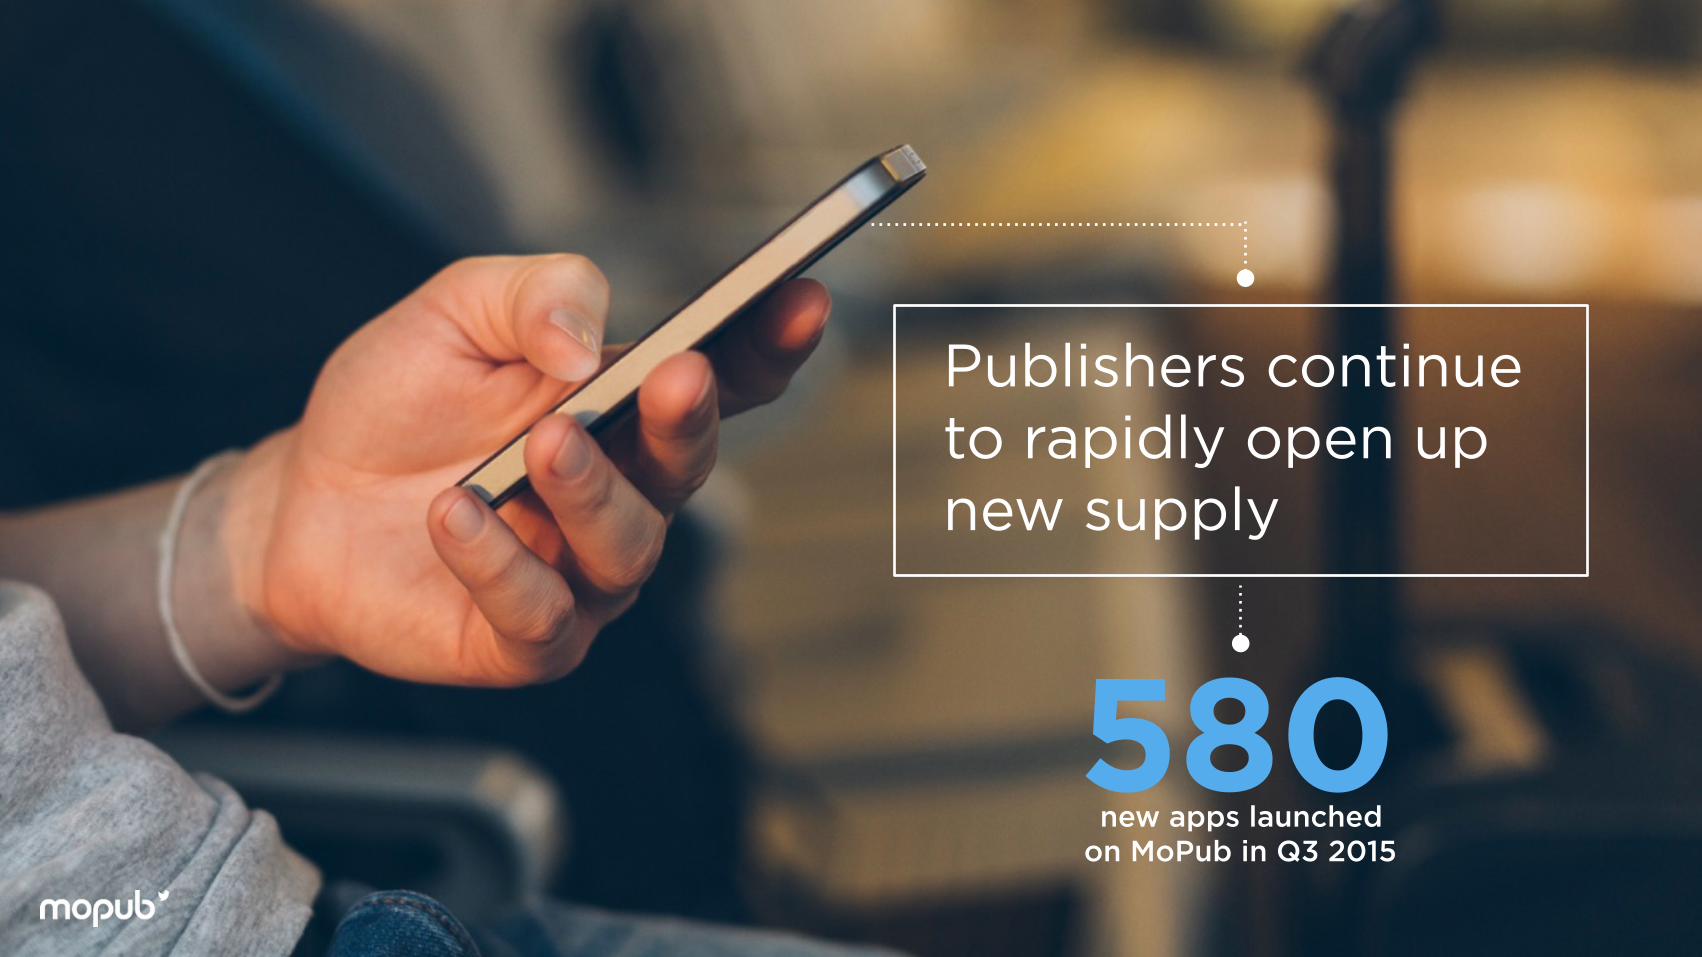
Publishers continue to rapidly open up new supply
new apps launched on MoPub in Q3 2015
580

Seasoned Apps New Apps
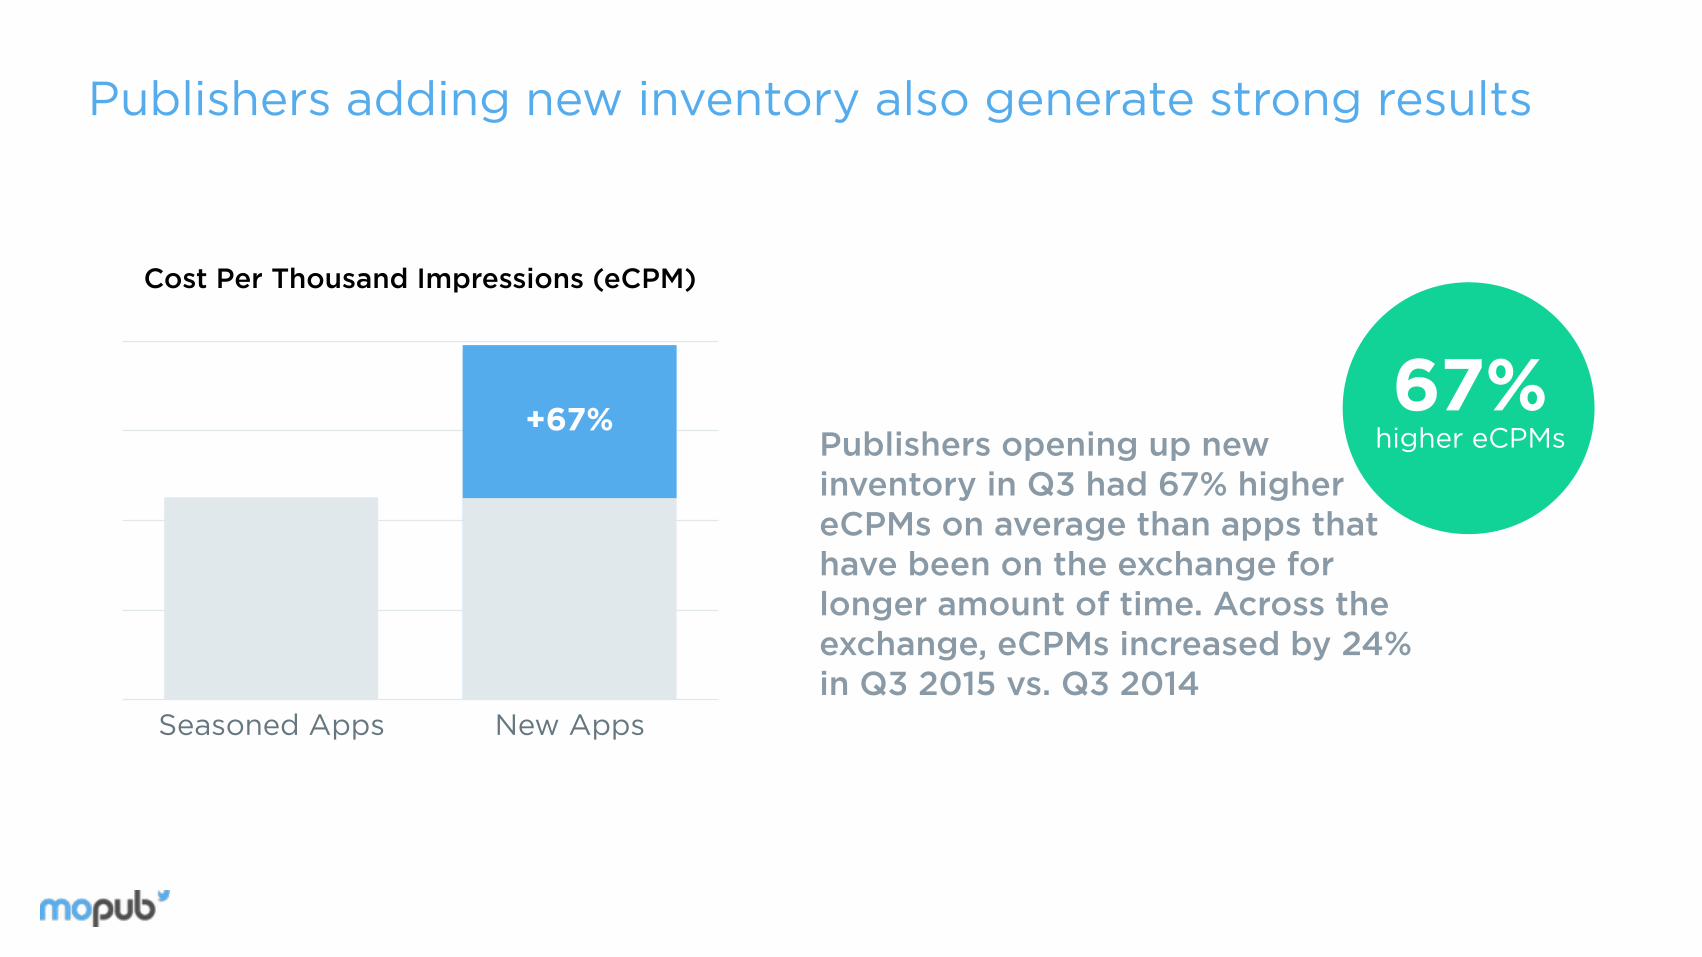
Cost Per Thousand Impressions (eCPM)
+67%
Publishers adding new inventory also generate strong results
Publishers opening up new inventory in Q3 had 67% higher eCPMs on average than apps that have been on the exchange for longer amount of time. Across the exchange, eCPMs increased by 24% in Q3 2015 vs. Q3 2014
higher eCPMs67%

One DSP diversified spend by buying on 957 new apps between May and September 2015. This buyer accessed 22% more impressions and increased spend by 52%. In addition to this scale, they were able to increase CTR by 23% and decrease eCPC by 26% more than all other DSPs on the exchange.
May September
Total Apps with Purchased Ads in May vs. September
Case Study: Diversifying spend helps DSP drive a higher CTR and lower eCPC
+95722%more impressions
Access to
26%more than all other DSPs
Decreased eCPC
23%more than all other DSPs
Increased CTR

Q4 HOLIDAY OUTLOOK

Will the Q4 holiday spend come again?

In the Q4 2014 Marketplace Report, we saw brand spend overtake performance spend during the holidays. In fact, brand spend even came to gaming — with 54% of spend on the popular Trivia Crack app from Etermax coming by way of brands in December 2014. We’ll keep a close eye on how these trends continue in Q4 2015.
Looking back at the Q4 2014 report…
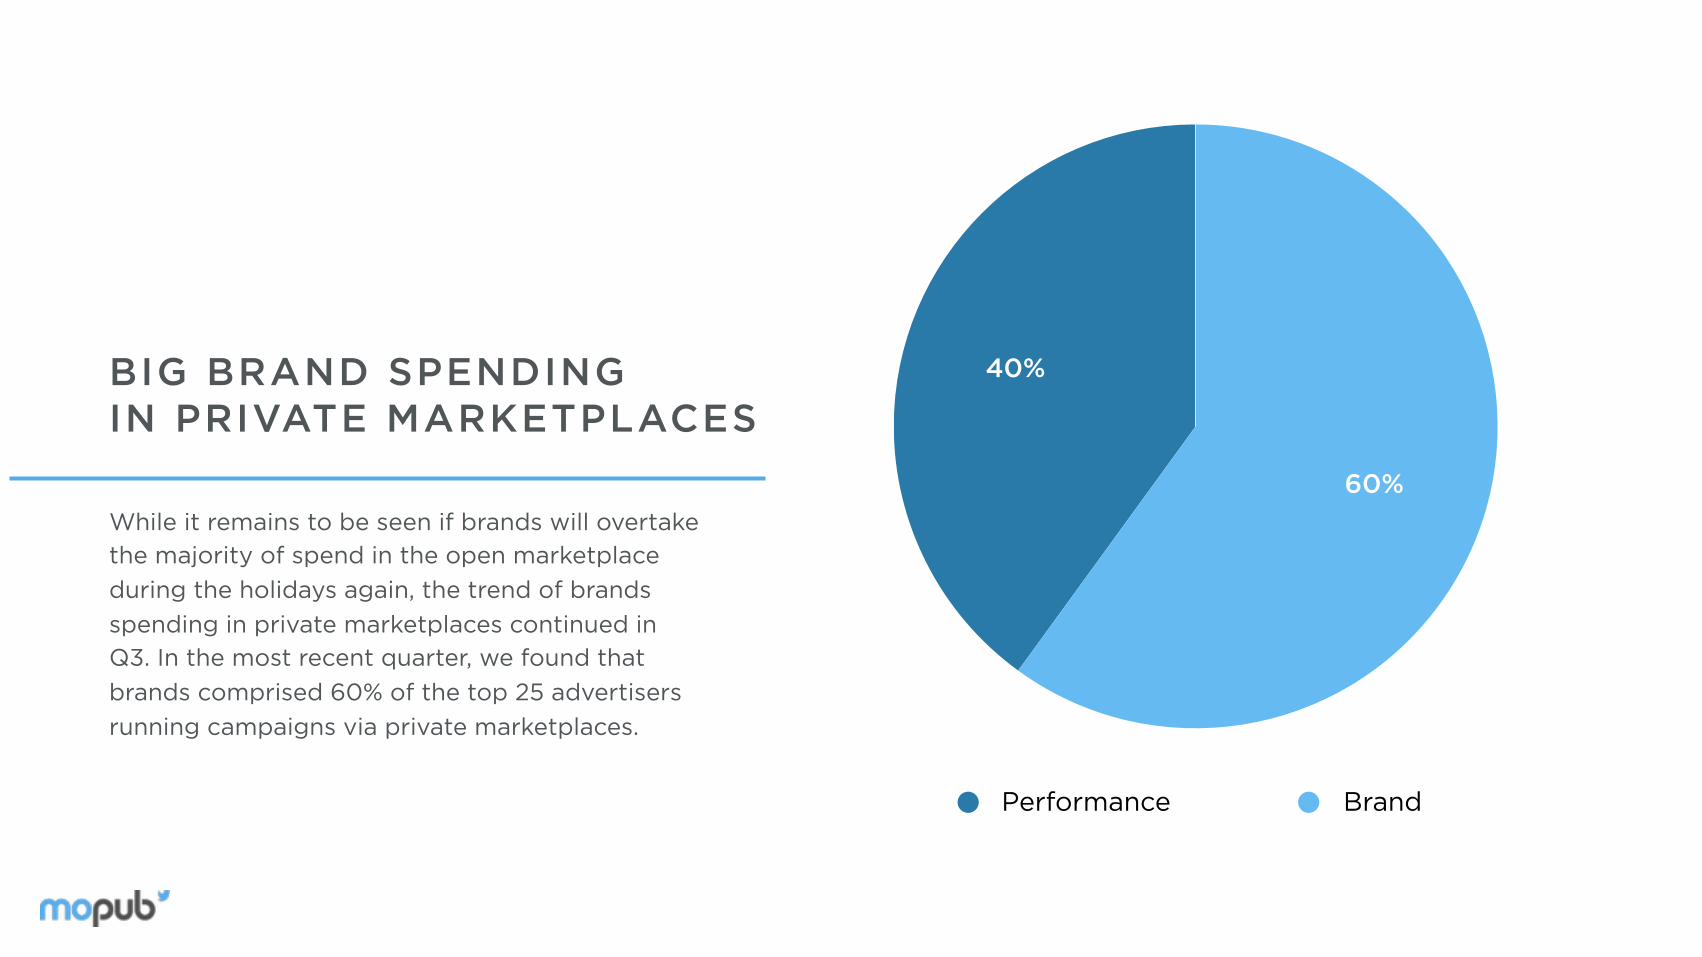
40%
60%While it remains to be seen if brands will overtake the majority of spend in the open marketplace during the holidays again, the trend of brands spending in private marketplaces continued in Q3. In the most recent quarter, we found that brands comprised 60% of the top 25 advertisers running campaigns via private marketplaces.
BIG BRAND SPENDING IN PRIVATE MARKETPLACES
Performance Brand
+25%+9%
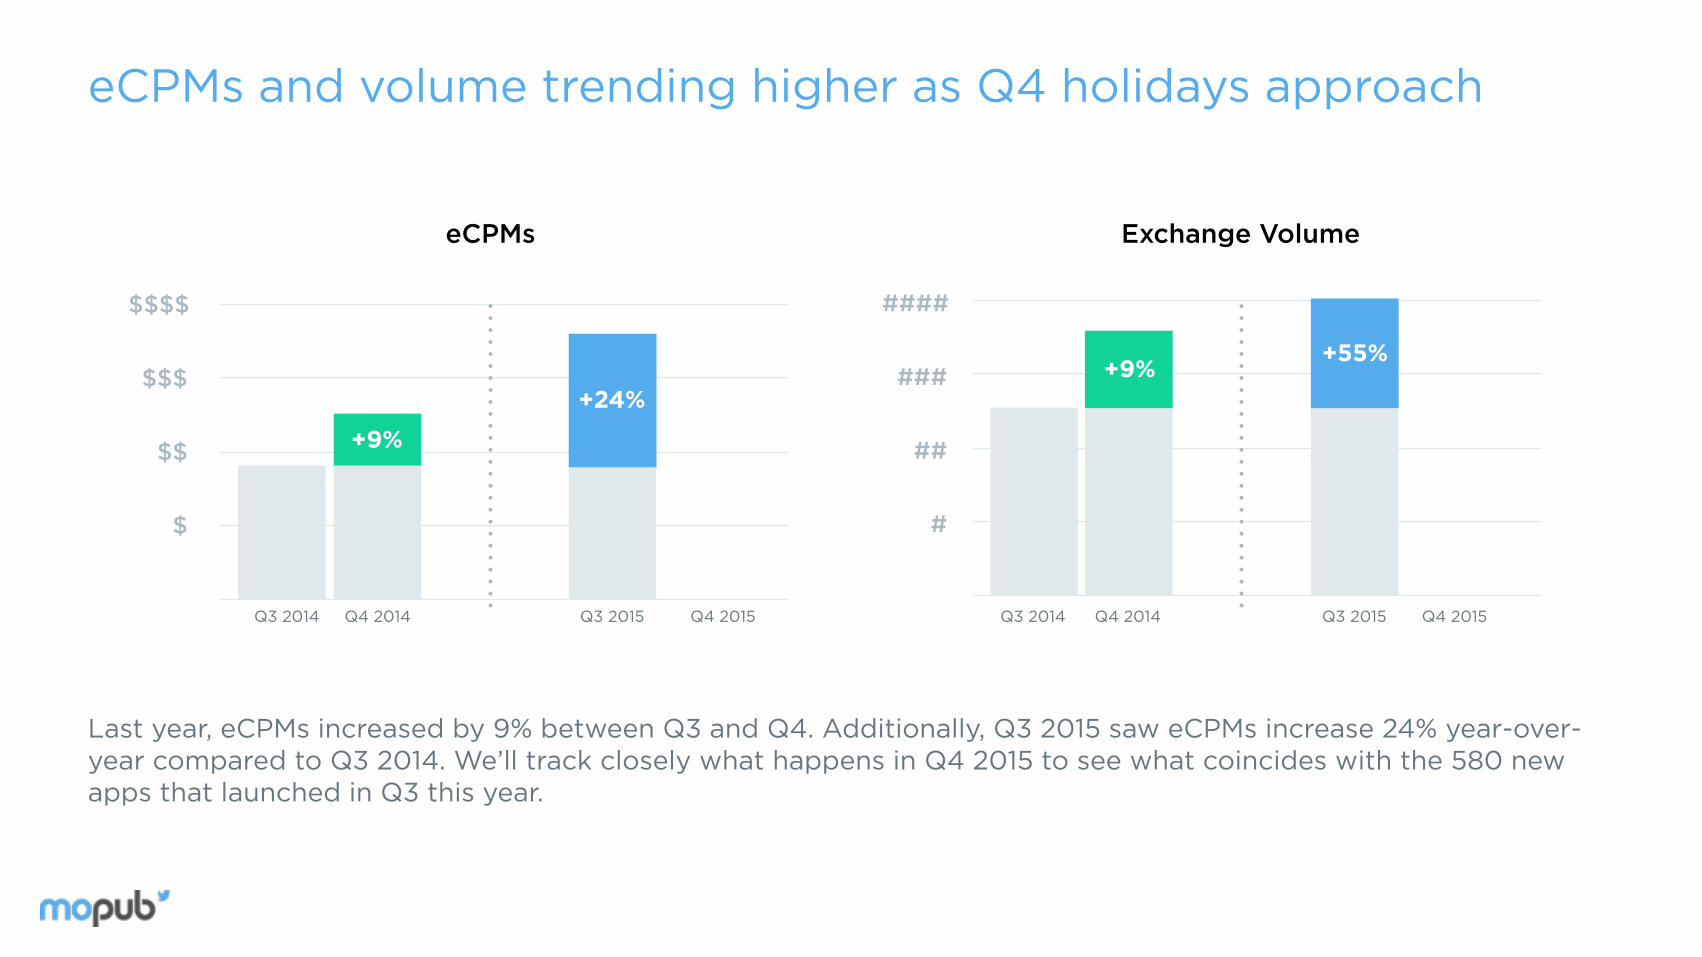
eCPMs Exchange Volume
+36%
+24%+9% +55%
Q3 2014 Q4 2014 Q3 2015 Q4 2015 Q3 2014 Q4 2014 Q3 2015 Q4 2015
eCPMs and volume trending higher as Q4 holidays approach
Last year, eCPMs increased by 9% between Q3 and Q4. Additionally, Q3 2015 saw eCPMs increase 24% year-over-year compared to Q3 2014. We’ll track closely what happens in Q4 2015 to see what coincides with the 580 new apps that launched in Q3 this year.
+9%
$
$$
$$$
$$$$
#
##
###
####

Entering Q4, gaming and entertainment apps still see highest eCPMs across categories
In the Q4 2014 Marketplace Report, we looked at how eCPMs varied for different publisher categories. Gearing up for holiday spend this year, Gaming and Entertainment still lead the pack. Across categories on the exchange, eCPMs increased 24% in Q3 2015 vs. Q3 2014.
Soci
al N
etw
orki
ng
New
s
Life
styl
e
Hea
lth
& F
itne
ss
Uti
litie
s
Spor
ts
Ent
erta
inm
ent
Gam
ing
Hea
lth
&
Fit
ness
New
s
Life
styl
e
Soci
al N
etw
orki
ng
Uti
litie
s
Spor
ts
Ent
erta
inm
ent
Gam
ing
eCPM by Publisher Category Q4 2014 eCPM by Publisher Category Q3 2015
$
$$
$$$
$$$$
$
$$
$$$
$$$$

CTR by Publisher Category Q3 2015
Highest CTRs found in gaming and entertainment apps, coinciding with high eCPMs
CTR by Publisher Category Q4 2014
In the Q4 2014 Marketplace Report, we also looked at how CTRs varied for different publisher categories. As we gear up for holiday ad campaigns, Gaming and Entertainment again showed the highest click-through rates in Q3 2015. Perhaps unsurprisingly, publisher categories ranked in the same order for both highest click-through rates and highest eCPMs.
%
%
%
%
%
%
%
%
Hea
lth
&
Fit
ness
New
s Life
styl
e
Soci
al
Net
wor
king
Uti
litie
s
Spor
ts
Ent
erta
inm
ent
Gam
ing
Hea
lth
&
Fit
ness
New
s
Life
styl
e
Soci
al
Net
wor
king
Uti
litie
s
Spor
ts
Ent
erta
inm
ent
Gam
ing
Banner Interstitial
+25%+9%
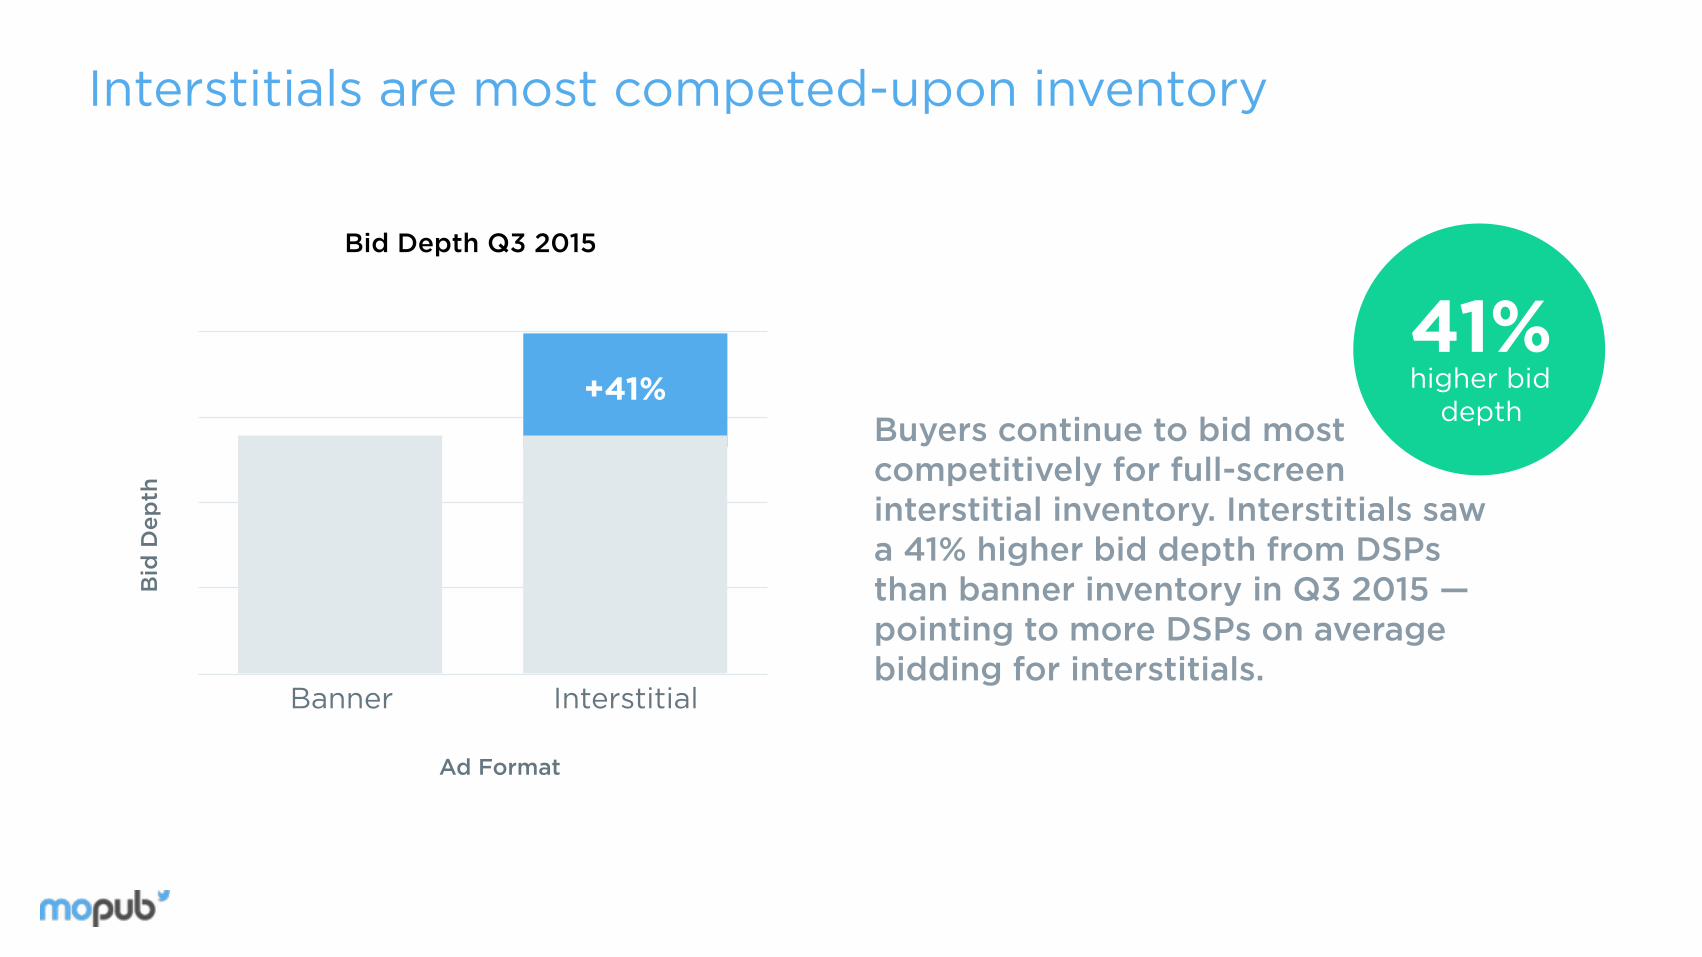
Bid Depth Q3 2015
Bid
Dep
th
Ad Format
Interstitials are most competed-upon inventory
+41%Buyers continue to bid most competitively for full-screen interstitial inventory. Interstitials saw a 41% higher bid depth from DSPs than banner inventory in Q3 2015 — pointing to more DSPs on average bidding for interstitials.
higher bid depth
41%

+25%
Banner Quarterly Revenue Native Quarterly Revenue Video Quarterly Revenue
+36%+92%
+42%+97%
+54%
165%
Q3 2014 Q4 2014 Q3 2015 Q4 2015 Q3 2014 Q4 2014 Q3 2015 Q4 2015 Q3 2014 Q4 2014 Q3 2015 Q4 2015
Ad formats have seen continual growth since Q3 2014 as we approach the holidays in 2015
Last year, we saw revenue increase between 36% - 54% for publishers across banner, video, and native ad formats between Q3 and Q4. We also saw Q3 year-over-year revenue growth for each ad format between 92% - 165%. Will Q4 2015 reward publishers with major revenue growth again?
MOMENTS CONTINUE TO MATTER FOR MOBILE ADVERTISERS
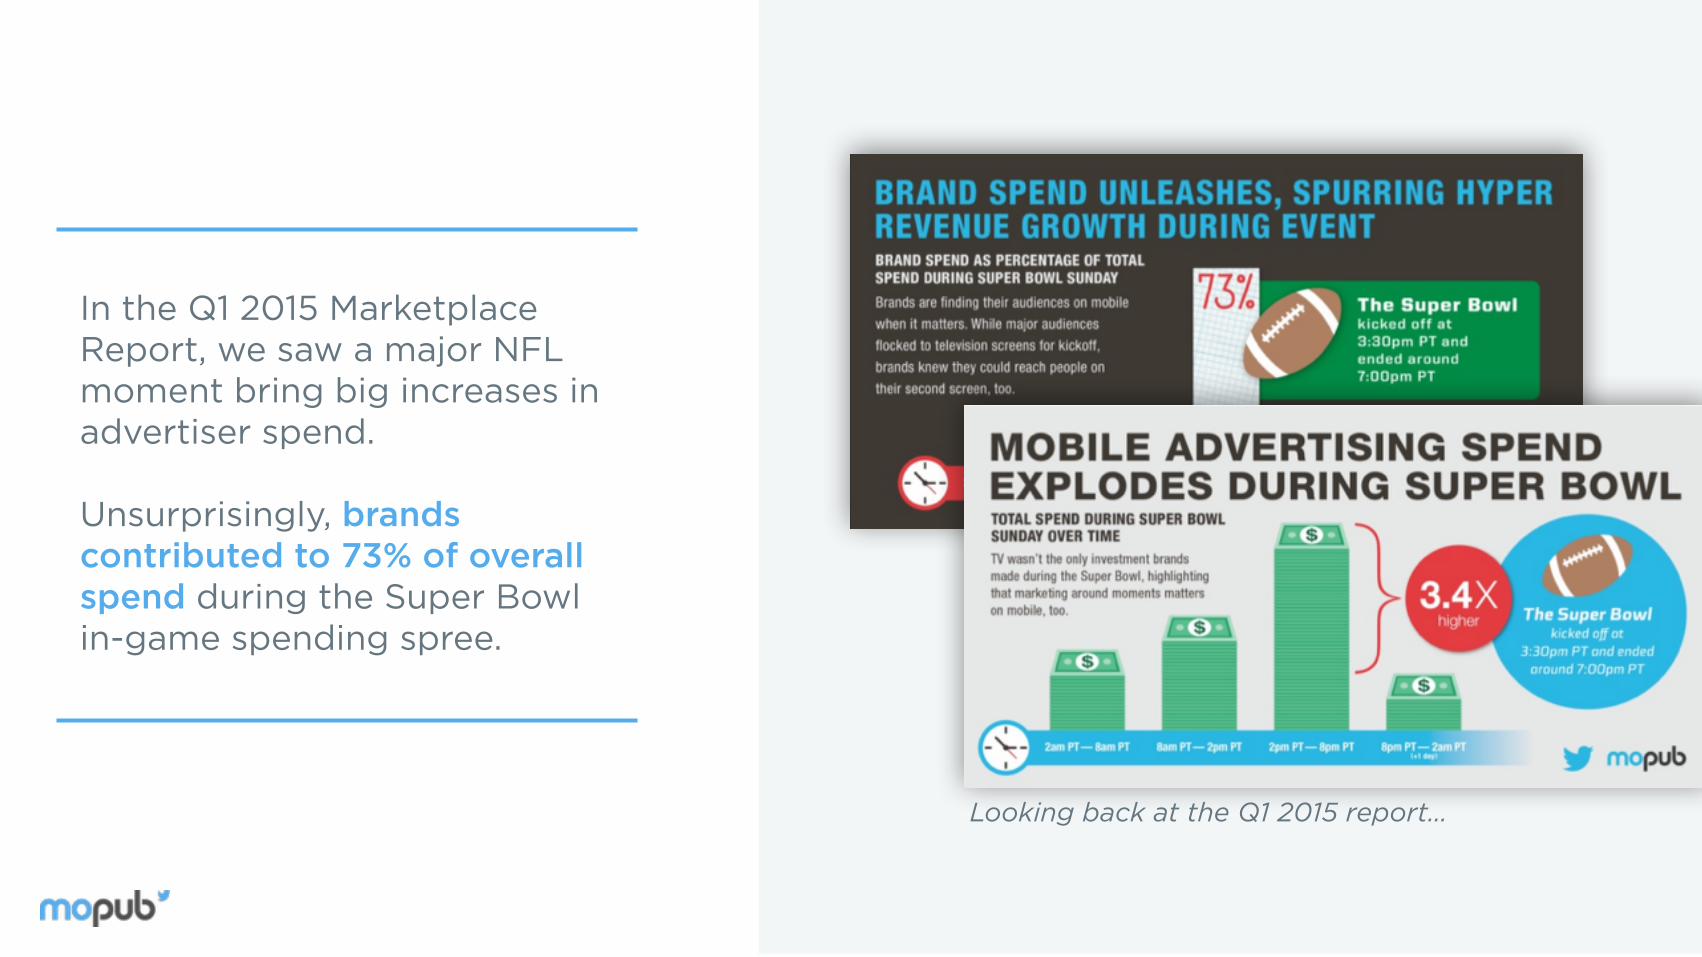
In the Q1 2015 Marketplace Report, we saw a major NFL moment bring big increases in advertiser spend. Unsurprisingly, brands contributed to 73% of overall spend during the Super Bowl in-game spending spree.
Looking back at the Q1 2015 report…
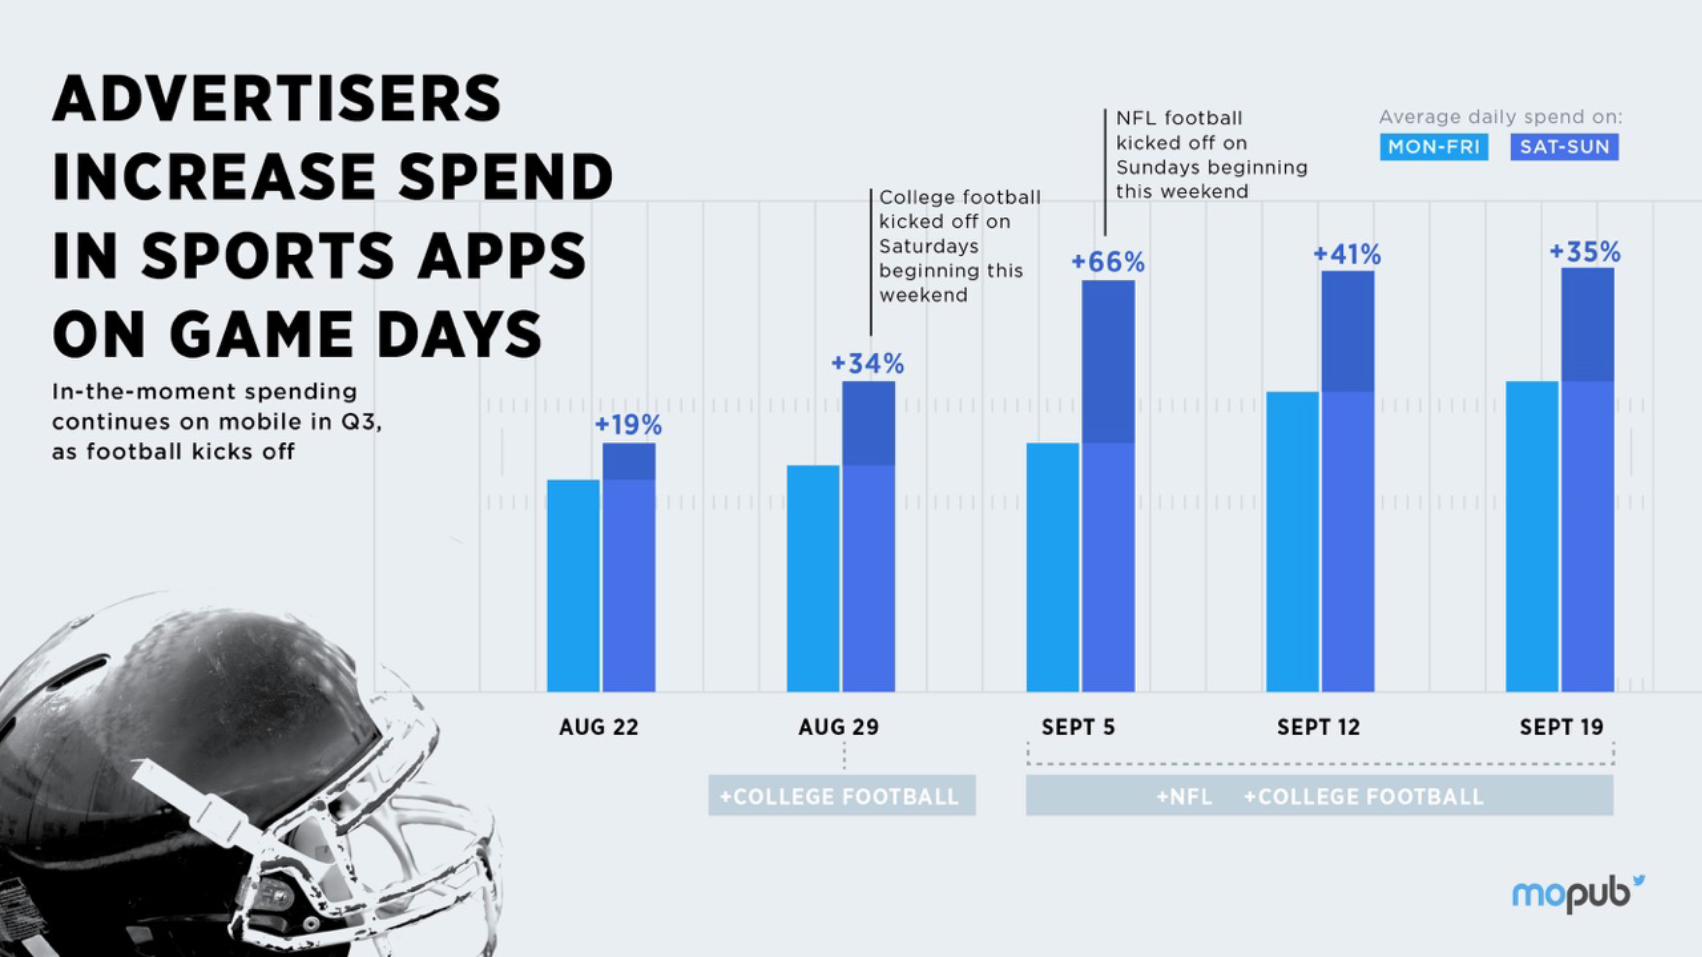

Continuing the trend from Q1, advertisers picked up spend in sports apps once NFL and NCAA football seasons began. Average daily spend on the weekends was 66% higher than on weekdays once NCAA football (Saturdays) and NFL football (Sundays) kicked off.

SUMMARY
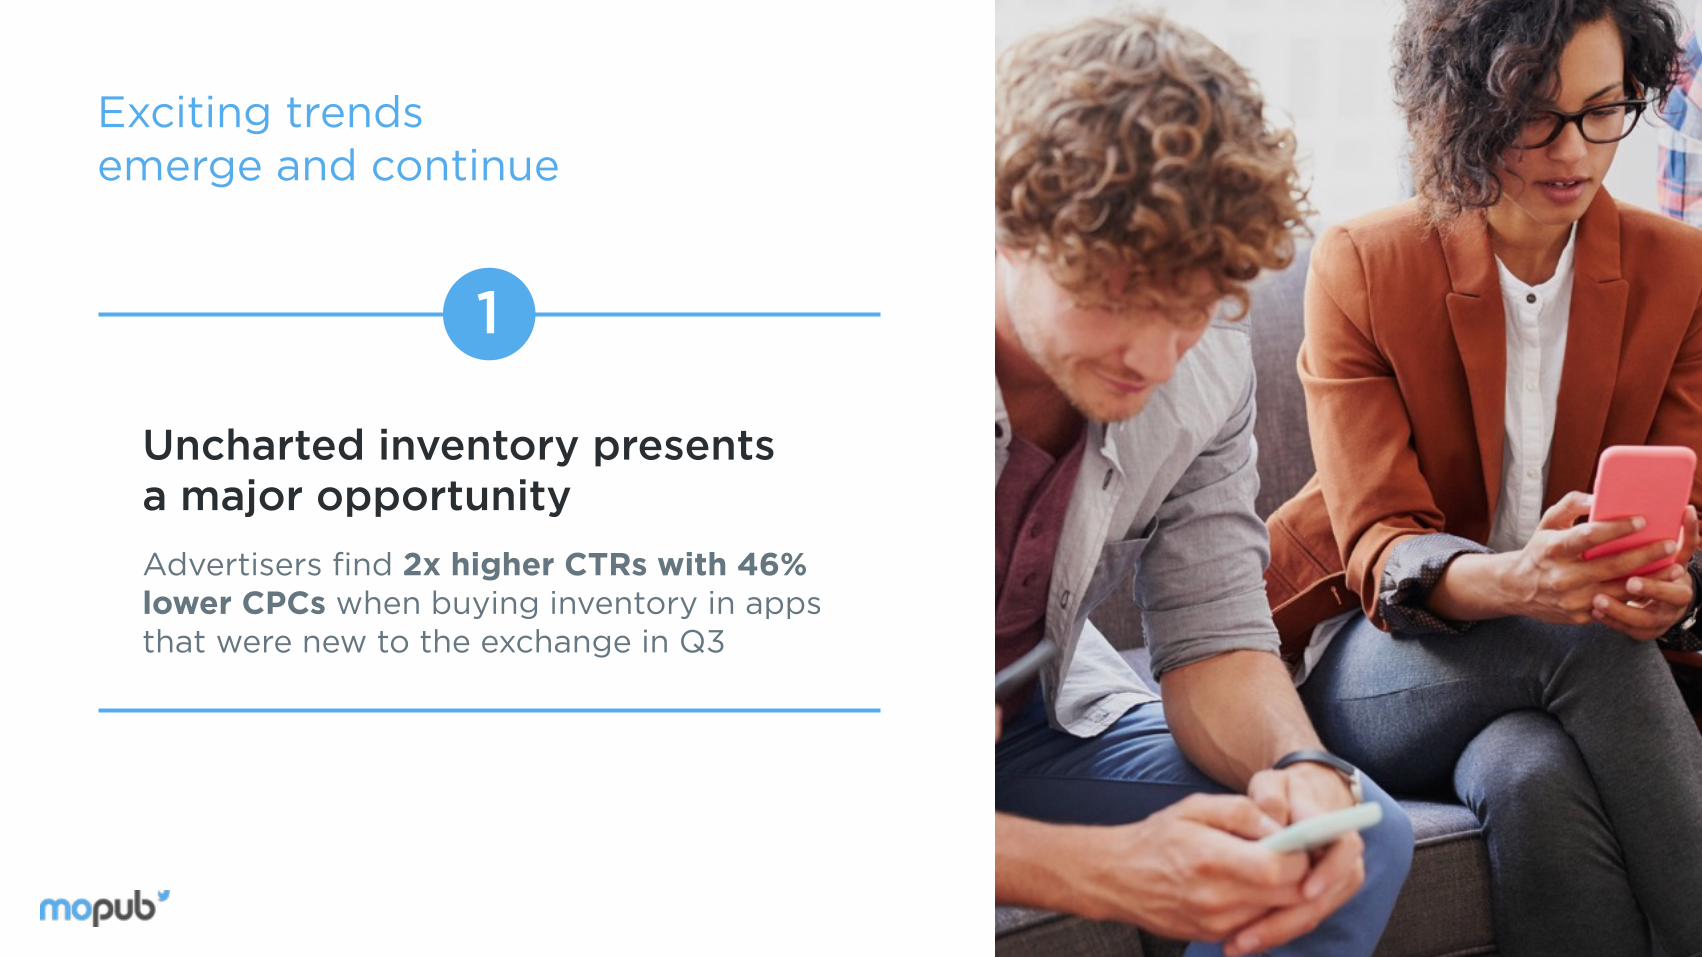
Exciting trends emerge and continue
Advertisers find 2x higher CTRs with 46% lower CPCs when buying inventory in apps that were new to the exchange in Q3
1
Uncharted inventory presents a major opportunity
Exciting trends emerge and continue
Publishers found the highest eCPMs and advertisers enjoyed the highest CTRs in gaming and entertainment apps
Gaming and entertainment apps continue to perform well
2
Exciting trends emerge and continue
Average daily spend increased by 64% in sports apps on NFL and NCAA football game days — coinciding with NFL and NCAA football season kick-offs
Moments continue to matter
3
MoPub Marketplace: The MoPub Marketplace is a real-time bidding exchange for mobile ads, where advertisers, agencies and their trading desks, and demand side platforms can bid on ad inventory from thousands of mobile application publishers in an efficient, real-time market.
Private Marketplace: A private marketplace is a programmatic trading environment in which a publisher makes available a segment of inventory to an advertiser or group of advertisers at a defined price.
eCPM: Effective cost per thousand advertising impressions, or eCPM, is the most common way to refer to prices in mobile programmatic advertising.
CTR: Click-through rate, or CTR, is the number of clicks that an ad receives divided by the number of times the ad is shown. This is a common metric to measure consumer engagement with an ad.
eCPC: Effective cost per click, or eCPC, is a metric used by marketers to gauge the effectiveness of their campaigns. (Sometimes it is referred to as estimated cost per click.) It is calculated by the price paid for ad impressions divided by the number of clicks generated from that ad campaign.
Clear Rate: Clear rate refers to the rate at which a purchased ad impression renders and displays in a publisher’s mobile app. It is an important metric for demand-side partners that helps them measure their buying efficiency. DSPs are never charged for ads that do not clear, render, and display.
Bid Depth: Bid depth is a metric that measures how many demand-side partners bid for an available ad impression in any given auction.
GLOSSARY
DSP: Demand-side platforms are technology companies who build software used to purchase advertising in an automated fashion. DSPs are most often used by advertisers and agencies to help them buy display, video, mobile and search ads.
Banner ad: Banner ads in this report refer to mobile in-app ads, which are typically anchored to the bottom of the screen and measure in dimensions of 320x50 or 728x90.
Interstitial ad: Interstitial ads in this report refer to fullscreen mobile in-app ads that measure in dimensions of 320x480, 480x320, 768x1024, or 1024x768. This type of advertisement can be a static image or a video, depending on publisher preferences.
Native ad: Native ads in this report refer to mobile in-app ads that match the form and function of the app in which it appears. Typically, they appear in content feeds of apps. Native ads are comprised of up to 5 separate components from advertisers, which can render in many different ways to match the look and feel of a publisher’s application.
Video ad: Video ads in this report refer to mobile in-app video ads. Video ads typically play in a full screen interstitial setting and are either 15 or 30 seconds in length.
GLOSSARY
© MoPub, Inc. 2015. All Rights Reserved. Twitter, Inc., MoPub, Inc, the Twitter logo and MoPub logo are trademarks or registered trademarks of Twitter, Inc. and MoPub, Inc. respectively. All other trademarks and logos are the property of their respective owners. This data is provided for information purposes only and while efforts are made to ensure accuracy, errors may arise.
MoPub’s Mobile Programmatic Trends Marketplace Report provides market data from real-time bidded auctions for mobile ad impressions, aggregated from mobile applications, advertisers, and demand side platforms on MoPub Marketplace, one of the world’s leading advertising exchanges for mobile apps.
MoPub Marketplace is a real-time bidding exchange for mobile ads, where advertisers, agencies and their trading desks, and demand side platforms can bid on ad inventory from thousands of mobile application publishers in an efficient, real-time market. MoPub Marketplace data is representative of over 31,000 active mobile apps, more than 335 billion monthly ad requests, more than 1 billion unique devices, and 175+ demand-side platforms.
The data reflected here is solely representative of exchange-traded media on MoPub Marketplace and does not include any ad network or ad network mediation data.
The information contained herein is based on internal data and data from a third-party that we do not control, and could be subject to errors and omissions.
Questions, comments, or data inquiries about this report can be sent to [email protected]
ABOUT THE REPORT
© MoPub, Inc. 2015. All Rights Reserved. Twitter, Inc., MoPub, Inc, the Twitter logo and MoPub logo are trademarks or registered trademarks of Twitter, Inc. and MoPub, Inc. respectively. All other trademarks and logos are the property of their respective owners. This data is provided for information purposes only and while efforts are made to ensure accuracy, errors may arise.
MoPub is one of the world’s leading ad servers for mobile application publishers, designed to drive more ad revenue through a single solution. We offer a sophisticated, full-featured monetization platform for mobile app publishers that combines real-time bidding, ad serving, cross-promotional capabilities and ad network mediation into one, easy-to-use platform. Our real-time bidding exchange, MoPub Marketplace, gives app publishers the power and flexibility to customize their monetization strategy for their business goals.
MoPub was acquired by Twitter, Inc. in 2013.
For more information, please visit mopub.com and follow MoPub on Twitter at twitter.com/mopub.
For specific data inquiries, email [email protected].
ABOUT MOPUB


