THE POTENTIAL OF MOBILITY AS A SERVICE BUNDLES AS A MOBILITY MANAGEMENT TOOL Melinda Matyas, Corresponding Author University College London, MaaSLab 14 Upper Woburn Place, WC1H 0NN, London, UK Tel: (44) 020-3108-5969 Email: [email protected]Maria Kamargianni University College London, MaaSLab 14 Upper Woburn Place, WC1H 0NN, London, UK Tel: (44) 020-3108-5969 Email: [email protected]To cite this paper: Matyas, M. and Kamargianni, M. (2018). The Potential of Mobility as a Service Bundles as a Mobility Management Tool. Paper presented at the Transportation Research Board 97 th Annual Meeting, Washington D.C., January 7-11.
Transcript
THE POTENTIAL OF MOBILITY AS A SERVICE BUNDLES AS A MOBILITY MANAGEMENT TOOL
Melinda Matyas, Corresponding Author University College London, MaaSLab
To cite this paper: Matyas, M. and Kamargianni, M. (2018). The Potential of Mobility as a Service Bundles as a Mobility Management Tool. Paper presented at the Transportation Research Board 97th Annual Meeting, Washington D.C., January 7-11.
Matyas and Kamargianni
2
ABSTRACT The Mobility as a Service (MaaS) concept has recently taken the transport industry by storm. However, as applications and research on it are limited, there is still little evidence on what this new phenomenon could bring to the transport sector. This paper aims to provide initial insights into whether MaaS product bundles (monthly subscription plans) can be used as a mobility management tool to promote shared modes. Data from an original survey, specifically designed to study MaaS plans, was used with Greater London as a case study area. The results show, that even though respondents do not prefer shared modes in their MaaS plans, a significant number of them are willing to subscribe to plans that include these modes. Once they have subscribed, over 60% of them indicated that they would be willing to try transportation modes that they previously did not use if their MaaS plans included them. These initial results show evidence that MaaS bundles can indeed be used as a mobility management tool to introduce more travelers to shared modes. Keywords: Mobility as a Service, Mobility Management, Demand Management, MaaS Subscription Plans, Bundling, Choice Modelling
Matyas and Kamargianni
3
1. INTRODUCTION The past decade has brought about a significant shift in the way goods and services
are provided. As millennials are approaching their prime spending years, their progressive attitudes towards ownership have supported the evolution of the sharing economy and the emergence of services such as Airbnb and Zipcar. Capitalizing on this and technological development, the ‘as-a-service’ era has started to render traditional business models obsolete. Keeping up with this trend, the transport sector is evolving towards the ‘Mobility as a Service’ (MaaS) concept. MaaS aims to restructure the mobility distribution chain, by creating mobility operators who integrate all the offerings of providers and supply them to users as a single service. A digital platform creates and manages trips for which users can pay for via a single account. A core part of MaaS is giving users the option to purchase MaaS products, such as monthly subscription plans, which best fit their needs (Hietenan 2016). These subscriptions include a certain amount of each transportation service (e.g. public transport, bike sharing, car sharing, taxi) and are similar to other service bundles, such as mobile phone plans, where the user pays a price for the combination of a variety of service elements.
Bundling products is not a new concept and is a frequently used method to increase consumer acceptance and aid diffusion of currently underutilized products and services. In a similar way, MaaS products could bundle less popular modes, such as bike sharing and car sharing together with public transport, with the hope that this will result in increased uptake of these modes. As such, MaaS can be viewed as a soft mobility management tool, which aims to ‘repackage’ the way travel services are presented to users thus alter the way they are perceived by individuals (Headicar 2009).
If MaaS could aid an increase in the uptake of shared modes, it could have a number of positive impacts. Many studies have shown evidence that both bike and car sharing significantly reduce private vehicle use and VMT (Vehicle Miles Travelled; Fishman et al. 2014; Martin et al. 2010). In many cases, when individuals who own a private vehicle start using shared services end up selling their vehicles (Fishman et al. 2014; Shaheen et al. 2009). An even more important, long-term impact is that, if younger generations who do not currently own a vehicle are able to solve all their door to door journeys without one (for example, with a combination of public transport and car sharing), they may delay or abandon purchasing a vehicle in the long run. As a result, shared services lead to a significant reduction in GHG emissions (Martin et al. 2010; Chen and Kockelman 2016) and bike sharing in particular, to a number of health benefits (Woodcock et al. 2014).
However, as the current MaaS applications are limited, there is little evidence, that MaaS could actually be used as a mobility management tool to influence people’s uptake of shared modes. The most advanced applications to date, where MaaS ‘product bundles’ are used, are the Ubigo field trial, and Whim, the product of MaaS Global. The first MaaS pilot, the Ubigo project carried out a MaaS field trial in Goethenburg, Sweden (Sochor et al. 2016). In this project, personalized combinations and amounts of public transport, car sharing, bike sharing and car rentals were offered in prepaid tailored monthly plans. During the trial, users did show an increase in both bike and car sharing during and a decrease in private vehicle use (Sochor et al. 2016). The first commercial MaaS product is Whim, that is offered by MaaS Global. Whim is now fully operational in Helsinki, is expanding to the West Midlands (UK) and Amsterdam (Netherlands). They have been proposing various approaches for bundling mobility services into a MaaS product. For example, some of their publications indicate that they are in favor of plans that are tailored to the different socio-demographic groups (families, students etc.) (Hietenan 2016). However, there is no study about how these could impact potential uptake of new modes. This minimal evidence leaves space for further research into MaaS bundle’s role in aiding the uptake of shared services.
Matyas and Kamargianni
4
Against this background, this paper aims to present initial research into the possible role MaaS could have as a mobility management tool to promote currently underutilized modes. The method used is based on survey data analysis, as such can be completed in areas where there are currently no MaaS applications. This allows researchers and the industry to gain insights into this up and coming phenomenon, prior to large-scale applications.
In order to do this, we use data from an original survey, specifically designed to study individual preferences of- and the effect that- MaaS bundles can have. Using this information, first a MaaS bundle choice model is developed to identify which modes the individuals in our sample would and would not prefer in their MaaS plans. This will help us understand, among others, preferences for the different shared modes. Next, a second bundle choice model is developed with solely those individuals who indicated that they would be interested in actually purchasing their chosen MaaS plan (not just indicating their preference among the options). By comparing the results of the two models, we can investigate whether the preferences found in the initial model remain consistent for those who would actually purchase their bundle. Finally, we examine whether those individuals who would purchase their MaaS plan would start using shared modes as a result of their MaaS plans and how this would affect the overall use of shared modes.
The paper is structured as follows. Section 2 provides a literature review of mobility management and bundling to set the context of the paper. Section 3 describes the survey and data used for the paper, while section 4 gives a brief overview of the methods used for the bundle choice models. Section 5 provides the analysis and section 6 concludes and outlines next steps and further research.
2. LITERATURE
2.1. Mobility Management
Mobility management or demand management, which is commonly referred to as soft measures, aim to alter the way people perceive travel alternatives as opposed to physically altering the options themselves (Headicar 2009). While hard measures modify the objective environment, such as infrastructure improvements or prohibiting the use of cars of certain streets, soft measures seek to change people’s perceptions of the available choices (Bamberg et al. 2010). As stated by Borg (2004), whether travelers are ‘able’ to take a certain transport mode is determined by availability and individual constraints; while whether they ‘want’ to take a certain mode is determined by information, perception and subjective preference. This means that there is potential to influence people’s behavior without physically changing the objective conditions. Some examples include information campaigns, travel awareness campaigns, discounted travel passes, travel plans and travel feedback mechanisms (Bamberg et al. 2010; Tornbald et al. 2014; Cairns et al. 2004). Mobility management works best with carrot and stick measures, which is why they are usually seen in combination (Meyer 1999).
One important aim of soft measures is to promote sustainable travel however, they are also used for other reasons such as reinforcing measures which form part of transport policy. Focusing on sustainability, mobility management campaigns need to focus on social motivation and making sustainable transport behavior the norm (Hisleus and Rosquuist 2016). For those who use their private vehicles, it endeavors to make alternative options more appealing. For example, a review of 19 studies by Sheepers et al. (2014) concluded that soft measures have positive results in shifting people from cars to active modes in nearly all studies. However, once travelers have discovered the convenience of car driving it is difficult to alter this behavior (Headicar 2009). As a result, these measures play a key role in keeping people who have not developed private car dependence from doing so. Although some argue that soft measures on their own may not be enough to significantly reduce private vehicle
Matyas and Kamargianni
5
use, and as a result, CO2 emissions (Moser and Bamberg 2008; Santos et al. 2010), others provide strong evidence of the opposite. Studies have shown that mobility management can result in 5-15% reduction in car trips sustained over time (Brog et al. 2010). For example, in an application of personalized travel planning in Perth, vehicle kilometers decreased by 17% (Brog 2002).
Ticketing schemes, that is when passengers can buy bulk tickets, passes or cards for public transport or in some cases across modes, are also a mobility management tools (Cairns et al.; Kamargianni et al 2016). These, together with smart cards, have proven to have a significant impact on the use of public transport modes. When the new inter-modal Travelcard season ticket was introduced in London, car use decreased by 9% while bus and underground trips were up by 7% (White 1984). This suggests a shift from car to the public transport modes. Similar trends were observed in other areas, for example, Paris’ Carte Orange increased overall ridership by 33% (NEA 2003). Scott and Axhausen (Scott and Axhausen 2006) found that as the number of season tickets increased, car ownership decreased in Germany. This means, that there is a strong substitution between these two mobility tools. Further, introducing smart cards has also had very positive effects on public transport patronage by easing the transitions at stations as well as the payments (Blythe and Holm 2002; Prakasam 2009).
The presented literature shows how several aspects of mobility management have already been studied. There are several characteristics of the Mobility as a Service concept that make it fall under the mobility management umbrella term. For example, the personalized multimodal journey planner can provide information about the available options to users; and the integration of all modes can provide a viable and attractive alternative to private vehicles (without actually altering the physical system or adding any new modes; Kamargianni and Matyas 2017). In this paper, we focus on the MaaS subscription plans, which by bundling various modes together, can alter users’ perceptions about what is available to them. To our knowledge, this has not yet been address in the literature.
2.2. Bundling
Bundling is a marketing method by which products and/or services are sold together as a single product at a special price (Guiltinan 1987). It is a very common method used to support diffusion of new or underutilized products and services. The shared services discussed in the context of MaaS fall under this second category; despite the fact that they have been around for a while, awareness of them and their usage is still not wide scale. For example, even though the case study city of this paper, London, is a very open to innovative ideas, 42% of our sample is not aware of what car sharing is. As such, methods to support their further adoption would be beneficial to the industry.
Countless studies have shown that bundling products and services increases consumers’ acceptance and willingness to pay for the elements of the bundles (Eppen et al. 1991, Stremersch and Tellis 2002). In many industries, from telecommunications to medical devices, bundles are often created with complementary products, which as a whole offer add-value to consumers. These ‘solution bundles’ can be more competitive than the standalone products (Cusumano et al. 2015). However, this has not been studied yet in the case of MaaS product bundles. Looking at the MaaS case, skeptics can argue that the transportation modes being bundled are substitutes, thus it is not a ‘solution bundle’. When we look at a single leg of a trip, this may be true as you could, for example, either take the train from station A to B or a taxi. When we look at overall mobility, in fact, quite the opposite is true. Public transport may provide solutions in some situations, while taxi in other situations. These can even be in a single trip from origin to destination. We argue that all the modes offered via MaaS together can be substitutes for private vehicles.
Matyas and Kamargianni
6
When it comes to unknown products and services, offering them together with ones that are familiar to the customer results in consumers evaluating the new product more favorably (Reinders et al. 2010). Also, by bundling lesser known and trusted products together with ones that are already part of consumers’ usage patterns, user’s perception of risk associated with the new product decreases. For example, Sarin and Sego (2003) show, that bundling high-tech products decreases consumers’ perception of risk, which in turn result in increased acceptance of the products. Even though shared services are gaining wider acceptance, their use could be accelerated by bundling them together with more popular modes such as public transport and taxi. Further, people who would most likely not be willing to ‘go out of their way’ to try shared services, could be introduced to them in a simple manner.
3. SURVEY DESIGN AND DATA The data used for this paper was collected as part of a wider transport study on new
mobility services and concepts (such as MaaS and MaaS products-subscription plans). The study is made up of two data collection waves, where both completed a self-administered web-based survey about Mobility as a Service. The overall survey is referred to as the London Mobility Survey (LMS). LMS was also created with the aim to gather novel insights into preferences for MaaS plans and overall attitudes and perceptions towards MaaS (for detailed information about the survey, please see: Matyas and Kamargianni 2017; Kamargianni and Dimakopoulos, 2018). An overview of the survey sections is as follows:
• Section 1 is the individual questionnaire, which includes questions about the socio-demographic characteristics, current use and ownership of mobility tools (e.g. license and vehicle ownership), use of app-based mobility services and attitudes and perceptions towards these. • Section 2 presents respondents with stated preference (SP) scenarios about MaaS plans. • Section 3 gathers information about the expected impact MaaS would have on mode choices, as well as respondents’ attitudes and perceptions towards the service.
This paper uses data from all three sections, although not every element therein. Taking a closer look at the stated preference experiment used for this paper,
respondents were presented with a short description of MaaS described as a subscription service offering access to several transport modes via a single interface. The SP scenarios were designed to test the importance of different elements within MaaS plans. For the sake of this paper, the choice set includes 3 MaaS plans from which the individuals could choose from (C3 = {PlanA, PlanB, PlanC}; see Fig. 1).
To choose the attributes and levels of the plans, two main resources were drawn upon. First, MaaS developments, such as the ones mentioned in the introduction, were reviewed to understand what potential elements could be included in the plans. Second, an assumption was made that only existing transport services would be included in the plans, as such, the currently available transport services in the case study city were collected. Some transport modes were excluded from the study, including ride sharing, peer to peer car sharing and demand responsive transport, as their business models proved too complicated to include in this SP. The attributes in the SP can be grouped into transport mode specific and non-mode specific attributes. The main transport mode attributes, which are the focus of this paper, are the transport modes included in each plan: public transport, bike sharing, car sharing and taxi. These modes were selected due to their prevalence and user awareness in the London market as well as space/cognitive load restrictions. The levels are presented in Table 1. The levels for public transport and bike sharing match up with those currently offered in the city. For taxi
Matyas and Kamargianni
7
and car sharing, a pivot design was used in order to create tailored levels which will result in improved information gained through the SP. The levels were pivoted around current travel behavior, that is, how much of these modes respondents currently use. This information was available from earlier parts of the survey and the pivoting was done in real time as the respondent progressed throughout the questions. Other mode-specific attributes were special features for some transport modes, however, analysis on these are not included in this paper.
Table 1 Transport Mode Attributes and Levels Public transport
None Unlimited bus (bus pass) Unlimited public transport in your zones (travelcard, with access to bus, tube, tram, overground, rail)
Bike sharing
None Unlimited access + 30 min use
Taxi If current taxi usage >10 miles: None, current taxi usage*0.8, 1, 1.1, 1.3, 1.5 If current taxi usage < 10 miles: None, 5, 8, 10, 12, 15 miles
Car sharing
If current car sharing time > 0: None, current car sharing time*0.8, 1, 1.1, 1.3, 1.5 If current car sharing time = 0: None, 1 hour, 2 hours, 4 hours, 6 hours, 1 day, 2 days, 3 days + 2 hours
The most important non-mode specific attribute is the cost of the plan. We opted for showing only the total cost of the plan (rather than a price for each element) for respondents to evaluate their willingness to pay for the bundle as a whole, rather than compare each individual unit price. The price was based on the sum of actual service prices, and various discount levels were the levels (as is a common feature of most product bundles). An example of the plans can be seen in Figure 1.
Fig. 1 MaaS SP Example
The reader may notice that there are some ‘additional features’ such as “only luxury cabs” presented in Figure 1. In this paper, we do not take these into account during our modelling efforts as we only focus on the transport modes. Also resulting from the objectives of the wider study, in the data used for this paper, has anywhere between 1- 4 choice observations from each respondent. In the full data collection, some alternative choice situations were also presented to some of the respondents, however, these are not included in this paper.
Multiple focus group waves, as well as discussions with experts in the field, were conducted to ensure that the design is both relevant for MaaS plan research and relatively well understood by respondents. The scenarios were designed by randomly choosing one
Matyas and Kamargianni
8
level from each of the attributes, with the prerequisite that only 2 “none” levels were allowed. Studies have revealed, that the random design performs as well as any other design (Walker, 2015; Lusk and Norwood, 2005). Similar to all designs, it performs even better if it is cleaned to remove choice tasks where one alternative clearly completely dominates the others (leading to no real tradeoff for the respondents). As such, a condition was imposed on the scenarios such that each has to be internally consistent while making sense with regards to the research topic. In the design of the levels for the costs of the plans, the costs were varied around the sum of the real prices of these services in the market. The condition to ensure no dominating alternatives is as follows: if the sum of the base prices of Plan A is greater than the sum or the base prices in Plan B, then in the presented alternatives this also has to be true. This method helps minimise the chance of having strictly dominating alternatives, which would be problematic as they may lead to substantially biased estimates (Bliemer et al. 2014). These conditions could easily be implemented instantaneously by the algorithm we wrote for the SP (the SP developed on Ruby on Rails programming language), while the respondent was completing the survey.
Once the respondent chose their preferred plan in each SP task, they were asked about their likeliness to subscribe to their chosen plan. Four answer options were presented: 1. definitely subscribe, 2. consider subscribing, 3. use MaaS but as pay-as-you-go, and 4. no MaaS. We opted for this two-step process, rather than adding the pay-as-you-go and no-buy options in the SP, in order to gain more insights into user preferences. This is important as there is such little evidence about user preferences for MaaS plans.
Data was collected between November 2016 and March 2017 using consumer panels (from Research Now and Exterion Media marketing firms). The two waves received slightly different incentives; the first were entered into a lottery for vouchers and the second received points for completion that could be cashed in for vouchers. The different incentives and the different companies used are as a result of the aims of the wider study (deeper discussion on this is out of the scope of this paper; for more information see Matyas and Kamargianni 2017). For the purpose of this study, a sample of 1068 people was used (3769 SP observations). We opted for a web-based survey with a panel of respondents as these can be carried out with only limited resources. However, it is important to acknowledge some disadvantages of this type of data collection. First, as this is an online survey, those who are computer illiterate will not be represented in the sample. Although, this is a failry low fraction of the London population, as 92% of residents are internet users (ONS 2015). Second, it is frequently mentioned in literature, that online panel surveys may lead to biases due to coverage, selection, non-response and respondent motivation (Spijkerman et al. 2009; Mullinix et al. 2015). Third, results from online SPs, especially those using recruited panels, need to be viewed with caution as there is a panel attrition effect where respondents are more likely to run through the survey without truly contemplating the information (Olsen 2009; Campbell, Morbak and Olsen 2013).
The study area was defined as Greater London (within M25 corridor) to capture also those who commute to the city from outer London. Only those over the age of 18 were eligible to participate. The sample characteristics can be seen in Table 2 alongside their 2011 Census, or if this was unavailable, their 2014 London Travel Demand Survey (LTDS) equivalent (ONS 2011; TfL 2014). Please note, that the Census and LTDS percentages were adjusted to exclude under 18s. Regarding age and gender, the sample is representative of the wider population. When looking at employment status, students and self-employed are slightly under-represented, while full-time employed and retired people are over-represented in the LMS sample. There are significant differences in the household income characteristics of the sample compared to that in LTDS however, this could be explained by the very high percentage of respondents who did not respond to this question in LTDS. Regarding
Matyas and Kamargianni
9
household vehicle ownership and licenses, the sample is over-representative of those with licenses and those who own household vehicles compared to LTDS. Finally, looking at awareness and use of shared modes, those who have used London’s bike sharing scheme before are overrepresented, while car sharing awareness cannot be compared as it is not in the dataset.
Table 2 Characteristics of Sample
Variable Percentage of sample
(N. obs. = 1068)
Census 2011
LTDS 2014
Age 18-29 22% 24% 30-39 24% 24% 40-49 18% 19% 50-59 15% 14% 60-69 14% 10% <70 7% 11% Gender Female 53% 51% Male 47% 49% Employment status Full time paid employment (30+ hours a week) 50% 40% Part-time paid employment (less than 30 hours a week) 10% 11% Self employed 7% 12% Student 6% 12% Retired 17% 8% Other 10% 17% Household income <£19,999 20% 20% £20,000 - £34,999 22% 12% £35,000 - £49,999 17% 9% £50,000 - £74,999 16% 10% £75,000 - £99,000 9% 5% £100,000 or more 7% 6% Prefer not to answer/Don't Know 9% 38% Household vehicle ownership Household owns vehicle 72% 66% Household does not own vehicle 28% 34% Driving license Individual has driving license 87% 67% Individual does not have driving license 13% 33% Car sharing awareness Individual previously aware of car sharing 50% N/A Individual previously not aware of car sharing 50% N/A Bike sharing Individual has previously used London bike sharing 19% 4.1% Individual has previously not used London bike sharing 81% 95.9%
Matyas and Kamargianni
10
4. METHODOLOGY FOR BUNDLE CHOICE MODELS The empirical analysis of bundle choice in this paper applies the random utility
framework (Manski 1977). In these models, the utility is decomposed into two additively separable parts, a deterministic component which is a function of measured attributes and a stochastic error component representing unobserved attributes affecting choice (Manski 1977). The most commonly used family of models is the logit (MNL) model, which due to its IID properties assumes constant variances and zero covariances. However, the restrictive characteristics of this model do not take into account the repeated nature of SP data that result in each respondent being recorded in multiple-choice situations. This means, that there are unobserved effects which remain constant within an individual between replications leading to correlations among these observations (Hensher 1994; Train2009; Ortuzar and Wilumsen 2011; Kamargianni 2015). To account for this panel/agent effect we follow a Mixed MNL model with random coefficients specification that allows tastes to be constant across replications for the same respondent (intra-respondent taste homogeneity) but with variation in tastes across respondents (inter-respondent taste heterogeneity; Hess and Rose 2007, Kamargianni et al. 2014). The resulting utility, 𝑈"#$ , that decision-maker n receives from alternative i in choice situation t is assumed to be: 𝑈"#$ = 𝑉"#$ +𝛼"# + 𝜀"#$, 𝑖 ∈ 𝐶#$ Where the term𝛼"# corresponds to an additional additive common error term, which represents random taste variation across individuals. We assume 𝛼"# is normally distributed with a zero mean and 𝜎01#23 standard deviation. 𝜎01#23 becomes an additional parameter to be estimated. Following the MMNL framework, the systematic utility functions for modeling MaaS plan choice are now defined as:
where 𝛽7 are vectors of unknown parameters and 𝑋"# are vectors of observed
attributes of each plan, which in our model are the modes included in the plans. The individual-specific error terms were added to only two alternatives as we need to normalize one. 5. MODEL ESTIMATION RESULTS AND DISCUSSION
In the following section, we present the results of two bundle choice models. The first model is estimated using the whole sample, to identify which modes the individuals in our sample would and would not prefer in their MaaS plans. This model also helps us understand the socio-demographic, and current mobility habits that influence preferences for MaaS plans. The second model is estimated with only those individuals who indicated that they would be interested in actually purchasing their chosen MaaS plan. We follow this two-step approach to be able to compare the results and investigate whether the preferences found in the initial model remain consistent for those who would actually purchase their bundle.
5.1. Whole Sample MaaS Plan Choice Model
To start our analysis, a bundle preference model is created with the whole sample (3769 SP observations). The core variables in the model are the transport modes that are included in the plans. Bike sharing is entered into the model as a dummy variable (1 = included, 0 = not included), as this transport mode attribute takes only these two levels in our
Matyas and Kamargianni
11
SP. The public transport mode attribute is split into two dummy variables: 1. bus pass (unlimited access to busses), and 2. travelcard (London’s public transport pass that allows unlimited travel on all modes). Car sharing is split into two continuous variables: 1. car sharing hours, and 2. car sharing days. This is done because car sharing services in London charge by the hour and day. Also, people perceive these two durations differently (car sharing hours is for short trips, while days is more like the traditional car rental for longer trips). In addition, a dummy variable for car sharing is also included, to help understand the overall preference for car sharing. The last transport mode, taxi, is entered into the model as a continuous variable (distance based). The coefficients for the modes are generic as there are no significant differences between respondent preferences if entered into each alternative separately. This was tested by running models with alternative specific constants and examining the sign and significance of the coefficients. This is what we would expect as the plan names themselves do not carry any meaning.
In addition, systematic taste variations are included via interactions between the attributes of the MaaS plans and socio-demographic variables. A number of individual characteristics were tested including age, gender, employment status (e.g. full time employed, student) education level, household composition (e.g. children in the household) and current mobility patterns (mobility tool ownership and use); however, only a few proved significant.
The results of the MMNL choice model are presented in Table 3 and were estimated in Pythonbiogeme v2.6 (Bierlaire 2016).
Table 3 MaaS Plan Choice Model: Full Sample Results
Name Coefficient t-test
Plan cost -0.411 -9.15
Bike sharing (dummy) -0.388 -6.11
Bus pass (dummy) 0.532 6.51
Travelcard (dummy) 0.532 8.12
Car sharing – days (continuous) -0.437 -13.04
Car sharing – hours (continuous) -0.022 -1.95
Car sharing (dummy) -0.517 -6.61
Taxi (continuous) -0.069 -12.18
Household cycle ownership interacted with bike sharing in plan 0.253 2.34
Santander cycles use interacted with bike sharing plan 0.321 2.71
Travelcard ownership interacted with travelcard in plan 0.273 2.36
‘Frequent taxi user’ interacted with taxi (continuous) in plan 0.056 5.47
Household income under £25,000 interacted with bus pass in plan 0.402 2.74
Over 65 interacted with bike sharing in plan -0.266 -2.00
Over 65 interacted with taxi (dummy) in plan -0.299 -1.70
SIGMA 0.758 9.46
Sample size: 3769
Init. log likelihood: -4140.67 Final log likelihood: -3384.36
Likelihood ratio test for the init. model: 1512.61 Rho-square for the init. model: 0.183
Matyas and Kamargianni
12
Firstly, we obtain a highly significant coefficient for the standard deviation of the random panel effect σpanel, which means that this model allows for capturing intrinsic correlations among observations of the same individual.
Turning to the plan characteristics, as presumed, the cost coefficient is negative and statistically significant at the 99% confidence level. This means that as plans become more expensive, people prefer them less. Regarding the transport modes in the plans, all of them are statistically significant. This shows that the type- and amount of transport modes in the plans are important to users and should be carefully considered in the design of plans. Only the public transport options (bus pass and travelcard) have positive coefficients, meaning that people prefer plans when one of these are included (in the SP design, these were mutually exclusive). This result shows two things. First, it demonstrates the importance of public transport as the backbone of MaaS. Second, it supports the fact that the public transport system in London has very good coverage and is very popular among the city’s residents.
Looking at the other modes, all of the remaining coefficients are negative. For the dummy variables bike sharing and car sharing, this means, that when these modes are included, people tend to prefer them less. For the continuous variables car sharing day, car sharing hour and taxi, this means that the more that is included of these modes, the fewer people will prefer them. The fact, that only the public transport options are preferred, may seem alarming at first to those questioning MaaS plans. However, this result is not unexpected, in a city where 54% of overall journeys are conducted with public transport (excluding walking; Transport for London 2015). It is well known that travel is a habitual behavior and it has been shown many times that much of travel behavior is driven by pure repetition and habit rather than by conscious deliberation (Schlich and Axhausen 2003; Klöckner and Matthies 2004; Friedrichsmeier et al. 2013). This same idea can also be seen if we look at the interaction terms between the respondent’s current mobility patterns and the modes in the plans. For example, the interaction term between travelcard ownership and travelcard in the plan is positive and significant. This means, that those respondents who currently own travelcards prefer to have these in their plans more than those respondents who currently do not own one. Along the same lines, a variable about the frequency of taxi use is interacted with taxi. A frequent taxi user was defined as someone who uses taxi at least once a week. The interaction term is positive and significant at 99% confidence level, that is, people who use taxi frequently prefer to have more taxi in their plans compared to those who use taxi less. In addition, two variables were interacted with bike sharing. When household cycle ownership is interacted with bike sharing, the coefficient is positive and significant. This means that those people who have bikes in their households prefer to have bike sharing in their plans more than those people who do not own bicycles. The same positive and significant coefficient can be seen when the variable ‘previous use of Santander Cycles’ is interacted with bike sharing in the plans. This indicates that those who have previously used Santander Cycles (London’s bike sharing scheme) prefer to have bike sharing in their plans more than those who have not used this service before.
Finally, out of all the tested socio-demographic characteristics, only three proved to create significant differences between preferences for modes included in the MaaS plans. The variable ‘household income under £25,000’ is interacted with bus pass, and its coefficient is positive and significant. This means, that people with lower household incomes prefer to have bus passes more than those with higher incomes. The explanation for this is that bus passes are much less expensive than the other public transport option, travelcards, but at the same time have similar coverage. Individuals with lower household incomes have a lower willingness to pay for transport and a higher willingness to accept increased travel time that comes with using busses. Next, the ‘over 65’ variable is interacted with both bike sharing and taxi and both are significant and negative (although the latter only at 90% confidence). This
Matyas and Kamargianni
13
indicates, that people over 65 gain less utility from both bike sharing and taxi in their plans compared to younger people.
5.2. MaaS Plan Subscriber Choice Model
Next, the same model was estimated with only those people who indicated that they would subscribe or consider subscribing to their chosen plan. These people were identified via a follow-up question after each SP task, asking whether they would subscribe to their chosen plan. In total, 403 respondents (in 834 choice tasks) indicated that they would definitely purchase or consider purchasing their chosen MaaS. By focusing solely on this subsample, we can identify whether the preferences outlined above for the whole sample persist or change when we only look at those who declared that they would purchase (or consider purchasing) these plans. The model results are presented in Table 4.
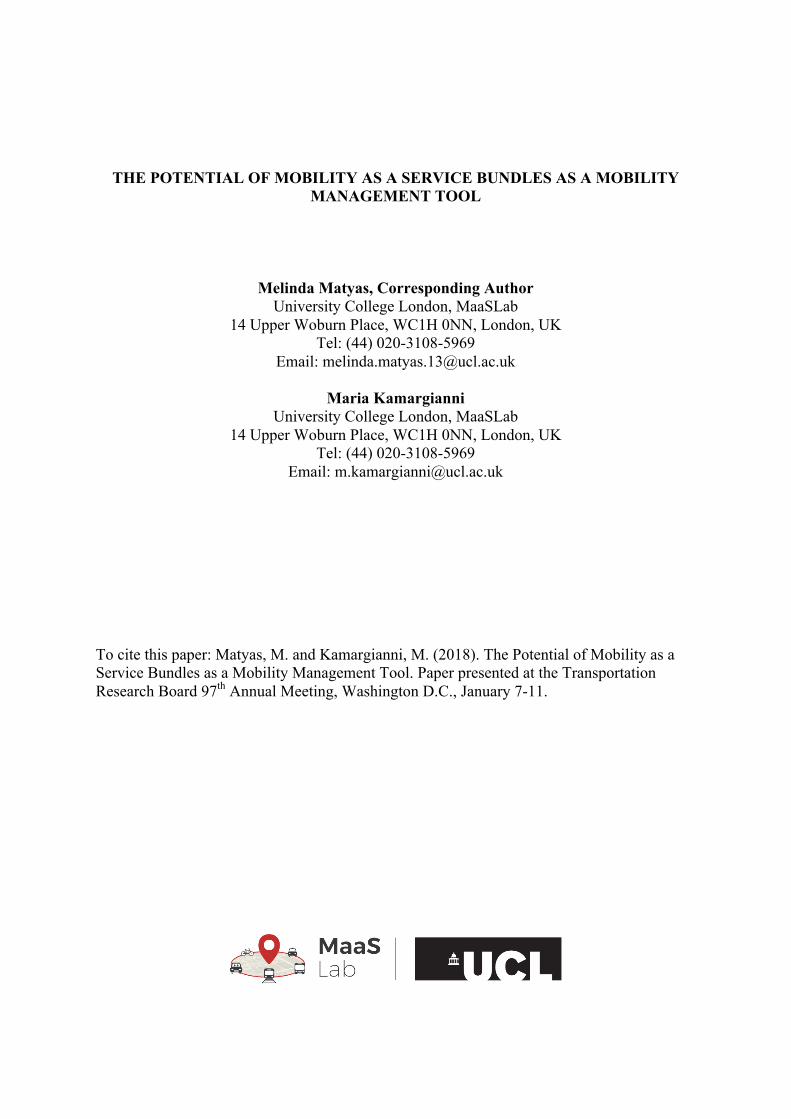
Table 4 MaaS Plan Choice Model: Full Sample and Subscriber-Only Model Results
Full Sample-
Model Subscriber Only-
Model Variable Value t-test Value t-test
Plan cost -0.411 -9.15 -0.310 -3.81 Bike sharing (dummy) -0.388 -6.11 -0.491 -3.59 Bus pass (dummy) 0.532 6.51 0.459 2.64
Travelcard (dummy) 0.532 8.12 0.066 4.66
Car sharing – days (continuous) -0.437 -13.04 -0.335 -5.35 Car sharing – hours (continuous) -0.022 -1.95 0.001 0.06
Car sharing (dummy) -0.517 -6.61 -0.689 -4.12 Taxi (continuous) -0.069 -12.18 -0.068 -5.77 Household bicycle ownership interacted with bike sharing in plan 0.253 2.34 0.342 1.57 Santander cycles use interacted with bike sharing plan 0.321 2.71 0.519 2.43 Travelcard ownership interacted with travelcard in plan 0.273 2.36 0.664 4.66 ‘Frequent taxi user’ interacted with taxi (continuous) in plan 0.056 5.47 0.054 2.97 Household income under 25 interacted with bus pass in plan 0.402 2.74 0.605 2.10 Over 65 interacted with bike sharing in plan -0.266 -2.00 -0.234 -0.58 Over 65 interacted with taxi (dummy) in plan -0.299 -1.70 -0.292 -0.44 SIGMA 0.758 9.46 -0.605 -2.74
Sample size: 3769 834 Initial log likelihood: -4140.67 -916.243 Final log likelihood: -3384.36 -772.005 Likelihood ratio test: 1512.61 288.475
Rho square: 0.183 0.157
Comparing the model results alongside each other, we can see that almost all the coefficients remain the same sign when looking at the subsample who would subscribe. The only one where this does not hold is the car sharing hours, but this coefficient has also become insignificant. In fact, all the transport mode related coefficient t-test values drop, which could at least partially be a result of the smaller sample. This shows, that the fact that
Matyas and Kamargianni
14
individuals do not prefer certain modes in their plans, does not necessarily mean they will not buy them. In 22% of the cases (834 out of 3769), the MaaS product, which includes the bundling, discounts and other aspects of MaaS, provided enough added value to respondents that they would actually buy or at least consider buying these. Even though detailed analysis on how much each of these elements individually sways people is out of the scope of this paper, the overall finding still has important implications for MaaS developments.
Next, we take a closer look at the presence of shared modes in the plans that respondents would subscribe to. Overall, 83.5% of the chosen plans include car sharing (either day or hour) while 46% had bike sharing in them. Dissecting the car sharing into days and hours, car sharing hours is the more popular choice with 68% of people choosing a plan with this in it, while car sharing days was only chosen by 28.1% of respondents. 15.3% chose plans with only car sharing days in them, while 55.4% chose plans with only car sharing hours in them. This shows that car sharing hours seems to be more attractive to potential MaaS users. The reasons behind this may include: (1) having more need for a car only for a couple of hours at a time rather than a whole day; and (2) the increased cost from hiring a car for a full day or days increase the cost of the plans too much. Only 8.6% of chosen plans did not have bike or car sharing in them.
Comparing the results to the prior behavior of these respondents (please note, that at this point we are only talking about those who would definitely subscribe or consider subscribing to their chosen plan) as little as 8.9% of them had car sharing memberships and only 57% were even aware of car sharing before. Looking at bike sharing, 30.4% of these respondents had used Santander cycles before (this includes those who have only used it a couple of times) and 5.4% had a yearly pass to it. This means, that many people who previously did not use car sharing and bike sharing would be willing to purchase MaaS plans with these modes in them. These results are summarized in Table 5. Table 5 Percentage of chosen MaaS plans where shared modes were included and prior behavior of respondents towards shared services
Modes Percentage in chosen plans Bike sharing 46.0% Car sharing (either days or hours) 83.5% Car sharing – days 28.1% Car sharing - hours 68.1% Car sharing – days (only) 15.3% Car sharing – hours (only) 55.4% Both car sharing days and hour 12.7%
Prior behaviour Percentage of respondents Have car sharing membership 8.9% Aware of car sharing 57% Have used Santander Cycles before 30.4% Have Santander Cycles yearly pass 5.4%
This so far is promising, but a further question needs to be addressed: will these
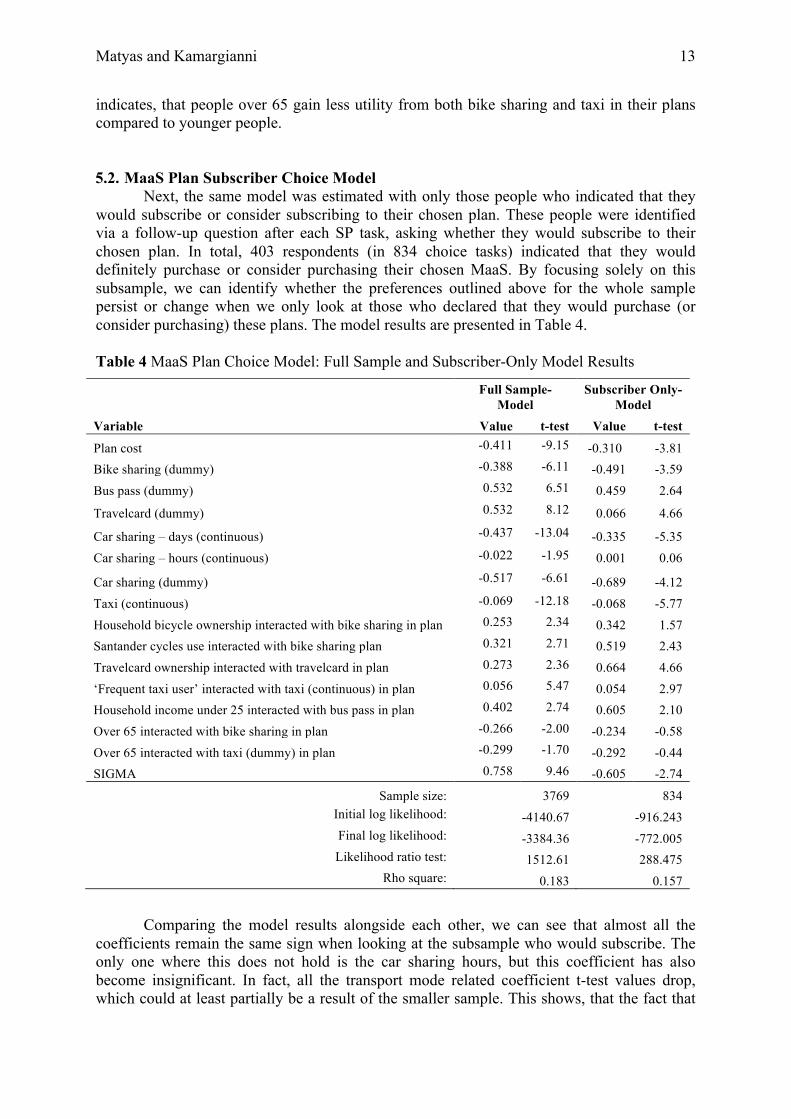
people actually start using these modes or just purchase access to them and not use them? To help answer this, an attitudinal statement was added after the SP experiments, to gain an insight into the overall outlook of respondents to trying new modes. Out of the 403 respondents who, in at least one SP task, indicated that they would subscribe or consider subscribing to their chosen plan, 64% responded positively to the statement “I would be willing to try transport modes I previously didn’t use if my MaaS plan included them”. 12 % strongly agreed, while only 4% strongly disagreed. The breakdown of responses can be seen in Figure 2.
Matyas and Kamargianni
15
Fig. 2 Attitudes towards Trying New Modes Included in MaaS Plans
The results provide some encouraging insights into the potential role that MaaS plans (bundles) can have as mobility management tools to help expose more travelers to shared modes. However, the results do need to be interpreted with caution as these are responses to a survey, rather than an actual application. Survey bias, which results from the hypothetical nature of questionnaires, tends to skew results. In this case, for example, some respondents may get overly excited about MaaS and say they would purchase their chosen plan, but in reality, if they would actually need to pay, they may hesitate. 6. CONCLUSIONS
This paper presented initial evidence to support that MaaS subscription bundles can be used as a mobility management tool to promote the use of shared modes. We used data from an original data collection effort in London, which includes specifically designed questions and a stated preference experiment about MaaS plans. Using the collected data, a bundle choice model was created to help us understand individuals’ preferences towards transportation modes in the plans. The model results based on the whole sample show, that in general, people prefer the public transport options in their plans, while they prefer plans less when bike sharing, car sharing and taxi are included. These results were not unexpected, due to the habitual behavior of travelers. Further, they indicate that public transport should be the backbone of MaaS.
In order to examine whether the preferences are alike for those who would purchase or consider purchasing their chosen MaaS plan, we ran a second bundle choice model. The results from this are also used to test whether people would be willing to purchase plans that include modes they may not necessarily prefer in their plans. The results from this second model align very closely with those from the full sample model: respondents who would actually buy their plans still had similar preferences. This shows, that even though individuals do not prefer certain modes (including the shared modes), the MaaS product, can in fact, provide enough added value to respondents that they would buy or at least consider buying these. Upon deeper analysis of the chosen plans that respondents would subscribe to, we found that a high percentage of them include car and bike sharing, which are modes that are overall beneficial for society and the transportation system. Finally, responses to an attitudinal statement indicated, over 60% of respondents would be willing to try transportation modes they previously did not use if their MaaS plans included them.
Overall, these results are promising and show the potential of MaaS bundles as a mobility management tool to introduce more travelers to shared modes. The outcomes are especially important to raise awareness about the decoupling between mode preferences in bundles and people’s willingness to purchase these in a number of cases. We foresee that these, albeit initial, results can be of value to the industry and transport operators as well as academia.
12% 19% 33% 18% 9% 5% 4%
0% 10% 20% 30% 40% 50% 60% 70% 80% 90% 100%
1
"I would be willing to try transport modes I previously didn’t use if my MaaS plan included them"
Strongly agree 6 5 Neutral 3 2 Strongly disagree
Matyas and Kamargianni
16
To further this paper, one of the next steps is to increase the details of the modes that are presented in this paper. Here, we were just interested in individuals’ preferences of the modes in the plans. However, there is room for further analysis about the discount level and other features of the plans and their influence on plan preferences will be conducted. As this paper is part of the initial stages of a wider research effort into MaaS plans, there are other tangential analyses planned and under progress. For example, besides the above-mentioned plan characteristics, other – potentially latent – factors are examined that can influence people’s willingness to subscribe. In general, MaaS development, as well as research, are still in their preliminary stages, and there is still much to learn about this continuously evolving concept.
ACKNOWLEDGEMENTS This research is supported by the RCUK Centre of Energy Epidemiology and the EPSRC. The authors of this paper would like to thank Sridhar Raman for assisting in the development of the survey tool. REFERENCES Bamberg, S., Fujii, S., Friman, M., Gärling, T.: Behaviour theory and soft transport policy measures. Transport Policy. 18 (1), 228–235 (2010)
Bierlaire, M.: PythonBiogeme: a short introduction. Report TRANSP-OR 160706, Series on Biogeme. Transport and Mobility Laboratory, School of Architecture, Civil and Environmental Engineering, Ecole Polytechnique Fédérale de Lausanne, Switzerland, (2016)
Bliemer, M.C., Rose, J.M. and Chorus, C.: Dominancy in stated choice surveys and its impact on scale in discrete choice models. 10th International Conference on Transport Survey Methods, Leura, Australia (2014)
Blythe, P. T., Holm C.: ADEPT III: Piloting Combi-cards for Public Transport Ticketing in Finland. Traffic Engineering and Control. 43 (1), 16–20 (2002)
Borg, W.: Reducing Car Use? Just Do It! Focus Vol 1, Issue 1, Article 8, 13-16 (2004)
Brög W.: The Perth Experience. Reducing the use of cars – the homeopathic way. Paper presented at a seminar of the London Assembly, Reducing Traffic Congestion in London: policy options other than road pricing, (2002)
Brog, W., Erl, E., Ker, I., Wall, R.: Evolution of Voluntary Travel Behaviour Change: Experiences from Three Continents. Transport Policy, Vol. 16, No. 6, 281-292 (2009)
Campbell, D., M. R. Morkbak, and S. D. Olsen.: How quick can you click? The role of response time in online stated choice experiments. Bioecon conference. (2013)
Cairns, S., Sloman, L. Newson, C., Anabele, J., Kirkbride, A., Goodwin, P.: Smarter Choices – Changing the Way We Travel. Department for Transport, London, (2004)
Chen, T. D., Kockelman, K. M.: Carsharing’s Life-Cycle Impacts on Energy Use and Greenhouse Gas Emissions. Transportation Research Part D: Transport and Environment 47, 276-284 (2016)
Cusumano, M. A., Kahl, S. J., SuarezF. F.: Services, Industry Evolution, and the Competitive Strategies of Product Firms. Strategic Management Journal, Vol. 3, No 4, 559-575 (2015)
Eppen, G.D., Hanson, W. A., Martin, R. K.: Bundling – New Products, New Markets, Low Risk. Sloan Management Review, Vol. 32, No. 4, 7–14 (1991)
Fishman, E., Washington S., Haworth, N.: Bike Share’s Impact on Car Use: Evidence from the United States, Great Britain, and Australia. Transportation Research Part D: Transport and Environment, 31, 13-20 (2014)
Matyas and Kamargianni
17
Friedrichsmeier, T., Matthies E., Klöckner, C. A.: Explaining stability in travel mode choice: An empirical comparison of two concepts of habit. Transportation Research Part F: Traffic Psychology and Behaviour, Vol. 16. 1-13 (2013)
Gilbert, C. L., Jalilian, H.: The Demand for Travel and for Travelcards on London Regional Transport. Journal of Transport Economics and Policy, 3-29 (1991)
Guiltinan, J.P.: The Price Bundling of Services: A normative framework. The Journal of Marketing, 74-85 (1987)
Headicar, P.: Transport Policy and Planning in Great Britain. Routledge, Abingdon, Great Britain, (2009)
Hensher, D. A.: Stated Preference Analysis of Travel Choices: the State of Practice." Transportation Vol. 21, No. 2, 107-133 (1994)
Hess, S., Rose, J. M.: Intra-Respondent Taste Heterogeneity in Instantaneous Panel Surveys, (2007)
Hietanen, S.: ‘Mobility as a Service’ – the New Transport Model? Eurotransport, Vol 12, Issue 2 ITS & Transport Management Supplement, 2-4 (2016)
Hiselius, L. W. and Rosqvist, L. S. Mobility Management campaigns as part of the transition towards changing social norms on sustainable travel behavior. Journal of Cleaner Production. Vol 123, 34-41 (2016) Kamargianni, M.: Investigating Next Generation's Cycling Ridership to Promote Sustainable Mobility in Different Types of Cities. Research in Transportation Economics, 53, 45-55 (2015)
Kamargianni, M., Ben-Akiva, M. and Polydoropoulou, A.: Incorporating Social Interaction into Hybrid Choice Models. Transportation, Volt. 41, No. 6, 1263-1285 (2014)
Kamargianni, M., Li, W. Matyas, M., Schäfer. A.: A Critical Review of New Mobility Services for Urban Transport. Transportation Research Procedia Vol. 14, 3294-3303 (2016)
Kamargianni, M., Matyas, M.: The Business Ecosystem of Mobility as a Service. 96th Transportation Research Board (TRB) Annual Meeting, Washington DC, 8-12 January (2017)
Klockner, C. A., Matthies, E.: How Habits Interfere with Norm-Directed Behaviour: A Normative Decision- Making Model for Travel Mode Choice. Journal of Environmental Psychology, Vol. 24, No. 3, 319–327 (2004)
Lusk, Jayson L., and Norwood, F., B.: Effect of Experimental Design on Choice-based Conjoint Valuation Estimates. American Journal of Agricultural Economics Vol 87, No. 3, 771–785. (2005).
Manski, C.: The Structure of Random Utility Models. Theory of Decisions Vol. 8, 229-254 (1977)
Matyas, M., Kamargianni, M.: Stated Preference Design for Exploring Demand for “Mobility as a Service” Plans. Paper presented at the International Choice Modelling Conference, Cape Town, April 3-5, 2017.
Martin E., Shaheen, S. A.: Greenhouse Gas Emission Impacts of Carsharing in North America. IEEE Transactions on Intelligent Transportation Systems 12, Vol. 4, 1074–1086 (2011)
Martin E, Shaheen. S. A, Lidicker, J.: Impact of Carsharing on Household Vehicle Holdings: Results from North American Shared-Use Vehicle Survey. Transportation Research Record: Journal of Transportation Research Board, No. 2143, 150–158 (2010)
Meyer, M. D.: Demand management as an element of transportation policy: using carrots and sticks to influence travel behavior. Transportation Research Part A: Policy and Practice, 33(7), 575-599 (1999)
Möser, G., Bamberg, S.: The effectiveness of soft transport policy measures: A critical assessment and meta-analysis of empirical evidence. Journal of Environmental Psychology Vol. 28, No. 1, 10-26 (2008)
Mullinix, K. J., Leeper, T. J., Druckman, J. N. and Freese, J.: The Generalizability of Survey Experiments. Journal of Experimental Political Science, Vol 2, No 2, 109-138. (2015).
NEA.: Integration and Regulatory Structures in Public Transport. Final Report of NEA Transport Research and Training to the European Commission, October, 2003.
Olsen, S. B.: Choosing Between Internet and Mail Survey Modes for Choice Experiment 655 Surveys Considering Non-Market Goods. Environmental and Resource Economics, Vol 44, No 4, 591– 656 610 (2009)
Office for National Statistics.: Census: Digitised Boundary Data (England and Wales) [computer file]. UK Data Service Census Support. Downloaded from: https://borders.ukdataservice.ac.uk/ (2011)
Matyas and Kamargianni
18
Office for National Statistics.: Internet Use by Borough, and Population Sub-Groups [computer file]. UK Data Service Census Support. Downloaded from: https://borders.ukdataservice.ac.uk/ (2015)
Ortuzar, J. D., Willumsen L.G.: Modelling Transport. John Wiley & Sons (2011)
Prakasam, S.: Evolution of E-payments in Public Transport – Singapore’s Experience. JOURNEYS, Issue 3, 53–61 (2009)
Reinders, M. J., Frambach, R. T., Schoormans, J.: Using Product Bundling to Facilitate the Adoption Process of Radical Innovations. Journal of Product Innovation Management, Vol. 27, No. 7, 1127-1140 (2010)
Santos, G., Behrendt, H., Teytelboym, A.: Part II: Policy Instruments for Sustainable Road Transport. Research in Transportation Economics, Vol. 28, 46-91 (2010)
Sarin, S., Sego, T.: Strategic Use of Bundling for Reducing Consumers’ Perceived Risk Associated with the Purchase of New High-Tech Products. Journal of Marketing Theory and Practice, Vol. 11, No. 3, 71–83 (2003)
Scheepers, C. E., Wendel-Vos, G. C. W., Den Broeder, J. M., Van Kempen, E. E. M. M., Van Wesemael, P. J. V. and Schuit, A. J.: Shifting from car to active transport: a systematic review of the effectiveness of interventions. Transportation Research Part A: Policy and Practice, Vol, 70, 264-280 (2014).
Schlich, R., Axhausen, K. W.: Habitual travel behaviour: evidence from a six-week travel diary. Transportation, Vol. 30, No. 1, 13-36 (2004)
Scott, D.M., Axhausen, K. W.: Household Mobility Tool Ownership: Modeling Interactions Between Cars and Season Tickets. Transportation, Vol. 33, No. 4, 311-328 (2006)
Shaheen S. A., Cohen, A. P., Chung, M.: North American Carsharing: 10-Year Retrospective. Transportation Research Record: Journal of Transportation Research Board, No. 2110, 35–44 (2009)
Stremersch, S., Tellis. G.: Strategic Bundling of Products and prices: a New Synthesis of Marketing. Journal of Marketing, Vol. 66, No. 1, 55–72 (2002)
Sochor, J., Karlsson, IC., M., Strömberg, H.: Trying Out Mobility as a Service: Experiences from a Field Trial and Implications for Understanding Demand. Transportation Research Record: Journal of the Transportation Research Board, No. 2542, 57-64 (2016)
Spijkerman, R., Knibbe, R., Knoops, K., Van De Mheen, D., & Van Den Eijnden, R.: The Utility of Online Panel Surveys Versus Computer-Assisted Interviews in Obtaining Substance-Use Prevalence Estimates in the Netherlands. Addiction, No 104, Vol 10, 1641-1645 (2009)
Tornblad, S. H., Kallbekken, S, Korneliussen, K., Mideksa, T., K.: Using Mobility Management to Reduce Private Car Use: Results from a Natural Field Experiment in Norway. Transport Policy 32, 9-15 (2014)
Transport for London: London Travel Demand Survey. (2014)
Transport for London: Travel in London, Report 8. (2015)
Walker, J., Wang, Y., Thorhauge, M. and Ben-Akiva, M.: D-Efficient of Deficient? A Robustness Analysis of Experimental Design in a VOT Estimation, in ‘Transportation Research Board 94th Annual Meeting’ (2015)
White, P. R.: Development of the ‘Travelcard’Concept in Urban Public Transport. The Service Industries Journal, Vol 4, No. 3, 133-150. (1984) Woodcock, J., Tainio, M., Cheshire, J., O’Brien, O., Goodman, A.: Health Effects of the London Bicycle Sharing System: Health Impact Modelling Study. Bmj, 348, 425 (2014)