November 2009 NASA/CR-2009-215947 Model for the Effect of Fiber Bridging on the Fracture Resistance of Reinforced-Carbon-Carbon Kwai S. Chan, Yi-Der Lee, and Stephen J. Hudak, Jr. Southwest Research Institute, San Antonio, Texas
Transcript
November 2009
NASA/CR-2009-215947
Model for the Effect of Fiber Bridging on the Fracture Resistance of Reinforced-Carbon-Carbon Kwai S. Chan, Yi-Der Lee, and Stephen J. Hudak, Jr. Southwest Research Institute, San Antonio, Texas
NASA STI Program . . . in Profile
Since its founding, NASA has been dedicated to the advancement of aeronautics and space science. The NASA scientific and technical information (STI) program plays a key part in helping NASA maintain this important role.
The NASA STI program operates under the auspices of the Agency Chief Information Officer. It collects, organizes, provides for archiving, and disseminates NASA’s STI. The NASA STI program provides access to the NASA Aeronautics and Space Database and its public interface, the NASA Technical Report Server, thus providing one of the largest collections of aeronautical and space science STI in the world. Results are published in both non-NASA channels and by NASA in the NASA STI Report Series, which includes the following report types:
TECHNICAL PUBLICATION. Reports of
completed research or a major significant phase of research that present the results of NASA programs and include extensive data or theoretical analysis. Includes compilations of significant scientific and technical data and information deemed to be of continuing reference value. NASA counterpart of peer-reviewed formal professional papers, but having less stringent limitations on manuscript length and extent of graphic presentations.
TECHNICAL MEMORANDUM. Scientific and technical findings that are preliminary or of specialized interest, e.g., quick release reports, working papers, and bibliographies that contain minimal annotation. Does not contain extensive analysis.
CONTRACTOR REPORT. Scientific and technical findings by NASA-sponsored contractors and grantees.
CONFERENCE PUBLICATION. Collected
papers from scientific and technical conferences, symposia, seminars, or other meetings sponsored or co-sponsored by NASA.
SPECIAL PUBLICATION. Scientific, technical, or historical information from NASA programs, projects, and missions, often concerned with subjects having substantial public interest.
TECHNICAL TRANSLATION. English-language translations of foreign scientific and technical material pertinent to NASA’s mission.
Specialized services also include creating custom thesauri, building customized databases, and organizing and publishing research results. For more information about the NASA STI program, see the following: Access the NASA STI program home page at
Fax your question to the NASA STI Help Desk at 443-757-5803
Phone the NASA STI Help Desk at 443-757-5802
Write to: NASA STI Help Desk NASA Center for AeroSpace Information 7115 Standard Drive Hanover, MD 21076-1320
National Aeronautics and Space Administration Langley Research Center Prepared for Langley Research Center Hampton, Virginia 23681-2199 under Contract NNL07AA00B
November 2009
NASA/CR-2009-215947
Model for the Effect of Fiber Bridging on the Fracture Resistance of Reinforced-Carbon-Carbon Kwai S. Chan, Yi-Der Lee, and Stephen J. Hudak, Jr. Southwest Research Institute, San Antonio, Texas
Available from:
NASA Center for AeroSpace Information 7115 Standard Drive
Hanover, MD 21076-1320 443-757-5802
The use of trademarks or names of manufacturers in the report is for accurate reporting and does not constitute an official endorsement, either expressed or implied, of such products or manufacturers by the National Aeronautics and Space Administration.
iii
Table of Contents
Acronyms ..................................................................................................................................................... iv
DCB Double Cantilever Beam LaRC Langley Research Center NDE Nondestructive Evaluation NESC NASA Engineering and Safety Center RCC Reinforced Carbon-Carbon SCB Single Cantilever Bend SEB Single-Edge Bend SEM Scanning Electron Microscope SiC Silicon Carbide
1
Abstract
A micromechanical methodology has been developed for analyzing fiber bridging and resistance-curve behavior in reinforced-carbon-carbon (RCC) panels with a three-dimensional (3D) composite architecture and a silicon carbide (SiC) surface coating. The methodology involves treating fiber bridging traction on the crack surfaces in terms of a weight function approach and a bridging law that relates the bridging stress to the crack opening displacement. A procedure has been developed to deduce material constants in the bridging law from the linear portion of the K-resistance curve. This approach has been applied to analyzing R-curves of RCC generated using double cantilever beam (DCB) and single cantilever bend (SCB) specimens to establish a bridging law for RCC. The bridging law has been implemented into a micromechanical code for computing the fracture response of a bridged crack in a structural analysis. The crack geometries considered in the structural analysis include the penetration of a craze crack in SiC into the RCC as a single-edge crack under bending and the deflection of a craze crack in SiC along the SiC/RCC interface as a T-shaped crack under bending. The proposed methodology has been validated by comparing the computed R-curves against experimental measurements. The analyses revealed substantial variations of the bridging stress and the R-curve response for RCC. Furthermore, the R-curve response is predicted to depend on crack geometry. Thus, the initiation toughness at the onset of crack growth is recommended as a conservative estimate of the fracture resistance in RCC. If this bounding structural integrity analysis gives unacceptably conservative predictions, it would be possible to employ the current fiber bridging model to take credit for extra fracture resistance in the RCC. However, due to the large scatter observed in the R-curves and inferred bridging stress in RCC, such an implementation would need to be probabilistically based.
Introduction
Reinforced Carbon-Carbon (RCC) panels are used in the thermal protection system and form the leading edge of the airfoil structure of the Space Shuttle [1]. RCC is a carbon-carbon composite with a three-dimensional architecture processed to form a silicon carbide (SiC) surface coating that resists oxidation during the orbiter’s reentry into the Earth’s atmosphere. The SiC coating is painted with a glassy compound that becomes viscous when heated during reentry. The glassy fluid is expected to fill craze cracks that may be present in the SiC coating and form a protective seal against RCC oxidation [1]. Post-flight examinations of the RCC leading edges on the wings of the orbiters have revealed SiC spallation from the joggle regions [1]. In addition, a thermographic imaging technique has detected the presence of internal separation between the SiC surface coating and certain regions of the RCC [2, 3]. Characterization of the anomalous areas in the joggle regions by Scanning Electron Microscope (SEM) confirmed delamination at, or near, the SiC/RCC interface. In particular, craze cracks were observed in the SiC surface layer, as shown in Figure 1 [1]. Some of the craze cracks deflected and appeared to propagate along the SiC/RCC interface and link with voids that formed during RCC processing. The delamination was very tight – that is, very little separation or opening of the interface cracks was
2
detected [1]. Furthermore, carbon fiber separation was observed at certain local regions, indicating the lack of oxidation during the fiber separation or delamination process [1].
Spallation of the SiC coating from the leading edge can potentially expose the RCC panels to excessively high temperatures, which could lead to catastrophic events such as rapid oxidation, burning-through of one or more RCC panels along the leading edge, and the loss of an orbiter. To assure the integrity and safety of orbiters, NASA’s Engineering and Safety Center (NESC) was asked by the Orbiter Program Office to assemble a multidisciplinary team to investigate the cause, and assess the risk, of SiC spallation from the RCC leading edge during reentry. The investigation involved detailed characterization of the craze cracks and the interface cracks in SiC/RCC [1], oxidation studies of the SiC/RCC panels [1], development of a thermography-based nondestructive evaluation (NDE) technique to monitor and detect the growth of SiC separation from RCC [2, 3], mechanical characterization of the fracture resistance of SiC/RCC [4, 5], thermal and structural analyses of the orthotropic properties [6] and thermo-mechanical loading on the SiC/RCC leading edge during reentry [7], as well as a quantitative assessment of the cracking mechanisms in SiC-coated RCC.
The focus of this study was to develop a micromechanical methodology to assess quantitatively the various cracking mechanisms and the corresponding fracture response observed in SiC-coated RCC. In particular, a micromechanical approach was developed to model fiber-bridging and to predict the fracture resistance, or R-curve behavior, of RCC. The objective of this report is to summarize the development of the micromechanical model and the results of this modeling effort. Since the modeling effort relies on experimental data of fracture mechanics characterization performed on RCC by team members [4, 5], a review of the experimental procedure and specimen geometry, which included double cantilever beam (DCB) and single cantilever bend (SCB) specimens, utilized to generate the R-curves for RCC is briefly presented first. The modeling approach and the development of a bridging law using the weight functions for the DCB and SCB specimens is presented next along with the corresponding results. The validity of the bridging law to other crack configurations pertinent to the RCC wing structure is then evaluated. The bridging mechanism in the RCC is identified and discussed, followed by conclusions and recommendations.
Review of RCC Fracture Characterization
Fracture toughness measurements on RCC were performed at NASA Langley Research Center (LaRC) using two crack specimen geometries: DCB [4], and SCB [5]. The DCB specimen is shown in Figure 2(a). The DCB specimens were 2.85 inches in length, 0.5 inch in width, and 0.24 inch in height. A sharp crack was initiated in the RCC test specimens using a razor blade [4]. The initial crack length was about 1.5 inches and resided in the RCC. The specimen was loaded through two piano hinges attached to the upper and lower faces on one end of the DCB specimen. Load-line displacement was measured as a function of the applied load. A compliance calibration method was used to obtain the energy release rate, G, as a function of the crack length. Typical results of DCB testing of RCC are presented in Figure 2(b) [4], which shows the energy release rate, G, as a function of crack length for four specimens.
The SCB specimen and experimental setup, shown in Figure 3(a) [5], is intended to measure the RCC/SiC interface toughness. As illustrated in Figure 3(a), an RCC substrate with SiC coatings
3
was glued to an aluminum plate. The dimensions of the RCC test specimen were 4.5 inches in length, 0.5 inch in width, and 0.24 inch in height. Load was applied through a piano hinge, which was glued to the top face of the test specimens, as shown in Figure 3(a). A precrack was introduced near the SiC/RCC interface by cutting using a 10-mil diameter wire with 400 grit SiC slurry first, and then followed with a 5-mil diameter wire with 600 grit SiC slurry for the portion near the tip of the final precrack [5]. Figure 3(b) illustrates the machined precrack [5], which lies close to the SiC/RCC interface, but resides in the RCC. Like the DCB tests, load-line displacement was measured as a function of the applied load. A compliance calibration method was used to generate the energy release rate as a function of crack length. Typical results of the load-displacement curve and the R-curve obtained using the SCB technique are presented in Figures 4(a) and (b), respectively [5].
Modeling Approach
Fracture experiments at LaRC revealed the presence of an R-curve behavior in RCC test specimens with the DCB and SCB crack geometry. The R-curve behavior was apparently caused by fiber bridging in the crack wake. However, the fibers in the RCC are arranged in a three-dimensional (3D) weave network, and the bridging fibers are usually not aligned normal to the crack plane. For example, the fibers in the DCB band SCB specimens were aligned at an angle to the machined precrack and the actual crack plane, as shown in Figures 2(a) and 3(b). Thus, fiber bridging in the RCC is expected to be different from those in unidirectional fiber-reinforced composites where the fibers are aligned normal to the crack plane [8]. As a result, bridging laws reported in the literature [9-11] for fiber bridging in unidirectional polymer composites and ceramic composites may not be applicable to RCC. Furthermore, it is also uncertain how the R-curve behaviors and the corresponding bridging laws deduced from laboratory specimens can be utilized to predict structural response because of different crack geometries.
The modeling approach adopted in this study is summarized in Figure 5. First, the fiber bridging stresses were deduced for the DCB specimens. These bridging stresses were utilized to establish a bridging law for RCC. The bridging law was then applied to analyze the R-curve behaviors observed in the SCB specimens. The crack geometries expected in the structure are either in the form of a T-shaped crack, in the case of crack growth along the SiC/RCC interface, or an edge crack under bending, in the case of crack penetration into the RCC. The bridging law was incorporated into these two crack geometries to assess the fracture response of RCC in these crack configurations.
1. Fiber Bridging Stresses
A schematic of the DCB specimen is shown in Figure 6, which depicts that the wake of a crack of length, a, is bridged by fibers with a crack opening of 2. For a crack with this configuration, the stress intensity factor of the bridged crack, Kbr, is related to the fiber bridging stress, br, by the relation given by [11]
dxaxhK bra
abro
, (1)
4
where h(x, a) is the weight function, x is distance from the front face of the specimen, a is the current crack length, and ao is the initial crack length. For DCB specimens, the weight function has been derived by Fett et al. [11] and is given by
H
xa
xaH
xa
Haxh
12exp
268.0
12,
(2)
where 2H is the height of the DCB specimen. Taking the derivative of Kbr with respect to x leads to
dx
dK
axhbr
br ),
1 (3)
which can be utilized to deduce the bridging stresses in the RCC.
Experimental data of energy release rate, G, versus crack length were first converted to K versus crack extension, a, using elastic properties for RCC (E = 2.69 E+6 psi for Young’s modulus; = 0.067 for the Poisson’s Ratio) reported by Sullivan [6]. A plot of K versus a shows a linear relation with a constant slope of c, as shown in Figure 7. The increase in K with a can be attributed to increasing bridging with crack extension; thus, substituting c = dKbr/dx into Eq. (1), leads to [11]
axh
cbr ,
(4)
with h(x,a) given in Eq. (2). Eq. (4) was applied to the K-resistance (KR) curves generated for RCC using DCB specimens to deduce the bridging stresses as a function of the distance behind crack tip. These results for the bridging stresses in RCC are presented in Figure 8.
The linear relation between K and a also allows one to compute the load-line crack opening displacement of a bridged crack in terms of the weight function. For a DCB specimen loaded by a pair of concentrated forces at x = 0, the crack profile may be expressed as
''
,'
','
,0
',0',
'
1 '
00 dadxaxh
axhc
ah
ahKaxh
Ex
a
x
a
(5)
where E = E for plane stress and E = E/(1-2) for plane strain conditions (E = Young’s modulus, = Poisson’s ratio), and h(0,a) is the weight function at x = 0. In Eq. (5), the first term inside the square brackets corresponds to the stress intensity factor or initial toughness, K0, due to the applied load at ∆a = 0, and the second term within the brackets corresponds to the bridging stress intensity factor. This relation contains only the weight function for the DCB specimens and K0 and c data that characterize the linear portion of the R-curve. Using Eqs. (4) and (5) in conjunction with experimental data of K0 and c, the bridging stress in RCC was computed as a function of the crack opening displacement for individual DCB specimens. Figure 9 presents the results of the bridging stress versus crack opening displacement for individual DCB specimens
5
of RCC with different bridging behaviors. Figures 8 and 9 show that Specimen RCC 6 exhibits the highest bridging stresses while Specimen RCC 3 exhibits essentially no bridging stresses in the crack wake.
2. Bridging Law
A bridging law is a description of the relation between the fiber bridging stress and the load-line crack opening displacement. A number of bridging laws have been proposed in the literature for metallic and ceramic materials [9-11], but none for carbon-carbon composites such as RCC. The bridging law proposed by Foote et al [9] has the form given by
n
oobr
1 (6)
where o and o are the limiting stress and the limiting crack opening displacement, respectively, and n is a constant. Cox [10] proposed a bridging law that contains both a power-law term and an exponential term, as given by
1
1
2
12/1
1exp
nn
ooobr
(7)
which leads to a peak stress at a critical crack opening displacement. For ceramic materials, Fett et al. [11] proposed a bridging law that is given by
ooobr
exptanh (8)
where is a constant.
These three bridging laws are compared with the bridging stress for RCC in Figure 10, which shows that none of the bridging laws fit the RCC data well. In particular, large discrepancies are observed at crack opening displacements beyond the stress at critical crack opening displacement. To obtain better agreement, the bridging law due to Fett et al. [11] has been modified to give
2/1
21 exptanhoo
obr
(9)
where 1 and 2 are constants. The four material constants were fitted to the bridging stress results for individual specimens. The values of o, o, 1, and 2 are presented in Table 1 for the DCB specimens. The o value shows the largest variations, while the values for o, 1, and 2
6
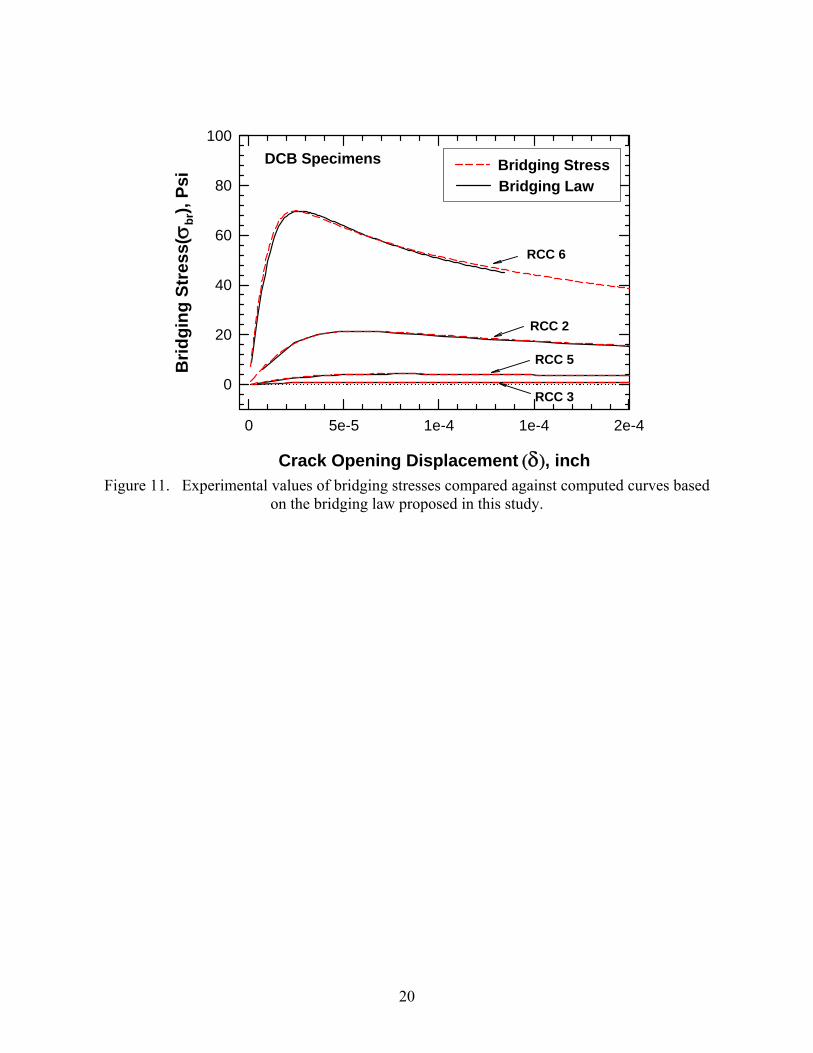
are relatively constant, as shown in Table 1. Eq. (9) fits the RCC bridging stresses considerably better, particularly for large crack opening displacements beyond the peak stress, as shown in Figure 10. Eq. (9) was applied to fit all the RCC data and the results are presented in Figure 11, which shows good agreement over the entire range of crack opening displacements for all DCB specimens.
Model Application to SCB Specimens
The micromechanical model and the analysis procedure developed for treating fiber bridging in DCB specimens were applied to SCB specimens by substituting the appropriate weight function. First, the weight function for SCB specimens was derived from its basic definition given by [12]
a
axV
K
Eaxh
),(
, (10)
where V(x, a) is the load-line displacement. Because of similarities in crack geometries, the stress intensity factors and the load-line displacements of SCB and DCB are related according to the expressions given by
SCBDCB KK 2 (11)
axVaxV SCBDCB ,2,
(12)
which can be combined with Eq. (10) to give
axhaxh DCBSCB ,2
1, (13)
with axhDCB , given by Eq. (2). Using the pertinent weight function, Eqs. (4) and (5) were
utilized to deduce the bridging stresses for RCC specimens with the SCB crack geometry. Figures 12(a) and (b) present the bridging stresses as a function of distance behind the crack tip and crack opening displacement, respectively, for one set of RCC specimens. The bridging stress results for a second set of RCC specimens with the SCB geometry are presented in Figures 13(a) and (b). The same bridging law shown in Eq. (9) was used successfully to describe the bridging stresses in the SCB specimens, as shown in Figures 12(b) and 13(b). A summary of the material constants in the bridging law for the DCB and SCB specimens is presented in Table 1. The results in Table 1 indicate that the limiting stress, o, in the bridging law shows the largest variations among the DCB and SCB specimens, while o, 1, and 2 are relatively constant. Using this observation as a guide, the bridging stress was normalized by o in Figure 14, which shows identical spatial distribution of normal stress for all specimens, indicating that bridging stress variation is reflected mainly through the large scatter in the limiting stress parameter, o. Consequently, o can be viewed as a scaling factor on the bridging stress and the large variation in this parameter is simply a manifestation of the large scatter in the R-curves of the RCC material.
7
Micromechanical Code for Structural Analysis
Once the bridging law, Eq. (9), was established, a micromechanical code was developed to predict the R-curve of a bridged crack using the bridging law as the governing equation for crack opening in the crack wake. The load-line crack opening of a bridged crack subjected to an applied load and a bridging stress br is given by
dadxxahaKaxhE
a
x
abrappl
'
0'',''',
'
1 (14)
where Kappl is the stress intensity factor due to the remotely applied load. Equating the load-line displacement to the bridging law given by Eq. (9), which represents the materials resistance to crack opening in the bridging zone, leads one to
o
bro
a
x
abrappl fdadxxahaKaxh
E
1'
0'',''',
'
1 (15)
in which the function f -1 is the inverse function of Eq. (9). In Eq. (10), both 'aKappl and the
weight function ', axh are functions of the crack geometry. Four different crack geometries including double cantilever beam, single cantilever bend, single-edge bend (SEB), and T-crack geometries were included in the micromechanical code. The DCB and SCB geometries correspond to those used in the laboratory data, while the SEB and T-crack geometries, which are shown in Figure 15(a) and (b), correspond to those expected in the structure. In particular, the SEB crack geometry corresponds to the penetration of a craze crack into the RCC, and a T-crack occurs when a craze crack in the SiC coating deflects to propagate along, or parallel to, the SiC/RCC interface. The weight function for SEB was taken from the paper by Fett and Munez [13], while the weight function for the T-crack was treated as a SCB crack with a fixed end [14]. The integral equation was solved by utilizing the polynomial expansion approach described by Mekky and Nicholson [15] and by Fett et al. [16].
The micromechanical code was verified by executing the code to predict the R-curve behaviors of RCC with the DCB and SCB crack geometries. Both KR and GR curves were obtained and compared against experimental data. KR curves computed via the micromechanical code for SCB specimens are presented in Figures 16(a) and (b). A comparison of the computed and measured GR curve for a DCB specimen is presented in Figure 17. Since the DCB and SCB data were utilized to deduce the bridging stresses to which the bridging law was fitted, the good agreement shown in Figures 16 and 17 indicates that the mathematical equations were solved correctly in the micromechanical code.
After verification, the micromechanical code was utilized to predict the fracture response of RCC for crack geometries that are expected in the structure. These computations included a T-shaped crack to approximate the deflection of a craze crack in the SiC coating to propagate along the SiC/RCC interface (Figure 15(b)) and an edge crack under bending to approximate the penetration of a craze crack into the RCC (Figure 15(a)). These computations are true model predictions since none of the experimental data were utilized to obtain these fracture resistance
8
curves. The GR curve predicted for the T-crack is compared against that of a DCB crack in Figure 18, while the predicted GR curve for an edge crack is compared against that of a SCB crack in Figure 19. It is important to note that the GR curve of the T-crack is comparable to that of the DCB crack, while the GR curve of the edge crack exhibits a shallower slope compared to that of the SCB crack, even though the same bridging law was utilized for all four crack geometries. The physical significance of this result is that the predicted R-curve is geometry dependent as both the weight function and the bridging stresses are sensitive to the constraint of the crack geometry.
Discussion
Some of the significant results of this investigation include the extraction of the bridging stresses and the development of a bridging law for describing the fracture response of RCC for several crack geometries. The R-curve response of RCC appears to be geometry dependent, but the bridging law derived from DCB and SCB specimens appears to be an inherent material property of the bridging ligaments in the crack wake, at least for the crack geometries considered. Through the use of pertinent weight functions, the micromechanical model allows a bridged crack of various crack geometries to be treated using the same bridging law, thereby enabling the transfer of R-curve data generated via laboratory specimens for use in structural analyses involving different crack geometries.
The analyses performed in the present study indicate that the limiting stress in the bridging law varies significantly among DCB and SCB specimens and represents the largest scatter in the RCC parameters in the bridging law. The composite strength, f, of RCC under tension has a value of about 813 psi [16], which is considerably higher than the o value deduced for RCC. The discrepancy can be explained on the basis that only a small number of bridging ligaments exist in the bridging zone in the crack wake of RCC. Figure 20 illustrates the typical bridging ligaments observed in an RCC test specimen. These ligaments are formed as the result of the formation of delamination microcracks ahead of the main crack, but on slightly offset planes that are parallel to the main crack, as illustrated in the schematic shown in Figure 20. The width and the number of these delamination ligaments appear to be quite small. An estimate of the volume fraction, Vbl, of the ligaments in the bridging zone can be obtained via a force balance given by
l
dx
Vf
l
br
bl
0 (16)
where l is the length of the bridging zone. The Vbl values for individual RCC specimens have been computed and the results are tabulated in Table 1. As shown in Table 1, the value of Vbl ranges from 0.0008 to 0.0713. The small Vbl value indicates that less than 8 percent of the bridging zone is covered with bridging ligaments. In some cases, bridging ligaments may even be absent. Consequently, the limiting stress is low and shows a large scatter, as shown in Table 1.
9
The bridging ligaments in the RCC behave differently and are governed by a bridging law different from those for unidirectional fiber composites. Because of a relatively large variation in the bridging stress parameter such as the limiting stress σo, the R-curve behavior of RCC may not be accurately predicted with a high degree of confidence. Furthermore, computation using the micromechanical code revealed that the R-curve behavior may be absent when a craze crack penetrates into the RCC as an edge crack under bending stresses. On the other hand, the initiation toughness, Ko, or the minimum point of the R-curve at a = 0 shows less scatter compared to the limiting stress parameter σo or the slope c of the linear KR curve (see Ko values in Table 1). A conservative measure of the fracture behavior for RCC may be defined in terms of a minimum value of Ko or Go with a zero slope – that is the absence of an R-curve response A safety factor may also be applied to Ko or Go, if deemed necessary. It might also be necessary to increase the number of fracture mechanics tests using DCB or SCB specimens to better define the minimum Ko or Go value and the corresponding confidence limits.
In the event that additional testing were to result in a larger portion of the samples exhibiting a significant R-curve response, it may be useful to factor this into the structural assessment of spallation in RCC. However, in view of the scatter observed in the results obtained to date, this assessment would need to consider the uncertainty in measured R-curve response and require a probabilistic analysis that considered the influence of this uncertainty in light of the other key uncertainties in the problem (e.g., structural loading).
10
Conclusions
The conclusions reached as the result of this investigation are as follows:
1. A micromechanical methodology has been successfully developed and implemented for analyzing fiber bridging and resistance-curve behavior in RCC panels with a 3D composite architecture and a SiC surface coating.
2. Fiber bridging in RCC can be treated using a weight function approach to describe the bridging stresses.
3. A procedure has been developed to deduce material constants in the bridging law from the linear portion of measured K-resistance curves generated using DCB and SCB specimens.
4. Bridging stresses in RCC cannot be described in terms of existing bridging laws in the literature.
5. A new bridging law is required and has been developed for RCC.
6. A micromechanical code has also been developed with the new bridging law for computing the fracture response of RCC with a bridged crack in a structural analysis with crack geometries which include the penetration of a craze crack in SiC into the RCC as a single-edge crack under bending, and the deflection of a craze crack in SiC along the SiC/RCC interface as a T-shaped crack under bending.
7. The proposed methodology has been validated by comparing the computed and measured R-curves.
8. Substantial variations of bridging stress and the R-curve exist for the RCC, based on the limited data reported to date.
9. The R-curve response of RCC is predicted to depend on the crack geometry and is absent for an edge crack under bending which corresponds to a craze crack that penetrates from SiC into RCC.
10. A conservative estimate of fracture resistance of RCC on the basis of the initiation toughness at the onset of crack growth is recommended in view of the significant scatter in measurements and limited amount of available data.
11. Should further testing reveal the presence of more significant R-curve effects for a larger proportion of the results, the methodology developed here could be used to provide a less conservative assessment of the structural integrity of spallation in RCC. However, this assessment would need to quantify the uncertainty in R-curve measurements and would require a full probabilistic analysis to consider this measurement uncertainty in light of other key uncertainties in the assessment, such as the applied loading.
11
References
1. E. Opila, “RCC SiC Anomaly,” Presentation at NESC Materials TDT Face-to-Face Meeting, Palo Alto, CA, November 7, 2007.
2. W. L. Vaughn, W. P. Winfree, C. Deemer, and F. I. Hurwitz, “Evaluation of RCC Carbon-Carbon in Simulation Flight Environments,” 29th Annual Conference on Composites, Materials and Structures, Cocoa Beach/Cape Canaveral, FL, January 24-28, 2005.
3. R. Piascik, “SiC Coating Integrity Testing and Correlation with IR Thermography Line Scan Data,” NESC, NASA, 2007.
4. J. Reeder, “Delamination Fracture Toughness Measurement,” NASA Langley Research Center, VA, April 2004.
5. T. K. O’Brien, “RCC/SiC Interface Fracture Toughness Characterization Study,” NASA Langley, 2008.
6. B. J. Sullivan, “3-D Orthotropic Properties for C-C Substrate and Pack-SiC Coating of Space Shuttle Reinforced C-C (RCC),” Materials Research & Designs, Inc., Wayne, PA, January 2008.
7. I. S. Raju and D. R.Philips, “Fracture Mechanics Analysis-Life-Off and Ascent,” NESC-LaRC, February 2008.
8. K. S. Chan and D. L. Davidson, “Fatigue Crack Growth in Fiber-Reinforced Metal-Matrix Composites,” Fatigue of Advanced Materials, edited by R. O Ritchie, R. H. Dauskardt, and B. N. Cox, Materials and Component Engineering Publications, Birmingham, UK., 1991, pp. 325-342.
9. R. Foote, Y.-W. Mai, and B. Cotterell, “Crack Growth Resistance Curves in Strain Softening Materials,” Journal of Mechanics and Physics Solids, Vol. 34, 1986, pp. 593-607.
10. B. N. Cox, “Extrinsic Factors in the Mechanics of Bridged Cracks,” Acta Metall. Mater., Vol. 39, 1991, pp. 1189-1201.
11. T. Fett, D. Munz, X. Dai, and K. W. White, “Bridging Stress Relation from a Combined Evaluation of the R-Curve and Post-Fracture Tensile Tests,” Int. Journal of Fracture, Vol. 104, 2000, pp. 375-385.
12. J. R. Rice, Int. J Solids & Structures, Vol. 8, 1972, pp. 751-758. 13. T. Fett and D. Munz, “Stress Intensity Factors and Weight Functions,” Computational
Mechanics Publications, Southampton, UK, 1997. 14. J. W. Hutchinson and Z. Suo, “Mixed Mode Cracking in Layered Materials,” Advances in
Applied Mechanics, Vol. 29, 1992, pp. 63-191. 15. W. Mekky and P. S. Nicholson, “R-curve Modeling for Ni/Al2O3 Laminates,”
Composites: Part B 38, 2007, pp. 35-43. 16. T. Fett, D. Munz, J. Seidel, M. Stech and J. Rodel, “Correlation between Long and Short
Crack R-curves in Alumina Using the Crack Opening Displacement and Fracture Mechanical Weight Function Approach,” J. Am. Ceram. Soc., Vol. 79, No. 5, 1996, pp. 1189-96.
12
Table 1. Summary of the initiation toughness (Ko), the slope (c) of the linear portion of the KR curve, the limiting stress (o), the limiting crack opening displacement (o), the materials constants 1 and 2
in the bridging law, and the volume fraction (vbl) of bridging ligaments for RCC.
Specimen Type K0, ksi(in.)1/2 c, ksi(in.)1/2/in. o, psi o, in. 1 2 vbl RCC 6 DCB 1.615 0.6855 103 2.60E-05 2 0.125 0.0513
Figure 1. Craze cracks in SiC coating and delamination cracks along SiC/RCC interface detected in the RCC leading edges of the wings of an orbiter.
From Opila [1].
14
(a) DCB specimens.
(b) Energy release rate.
Figure 2. Specimen geometry and measured R-curves in RCC: DCB specimens, and energy release rate, G, as a function of crack length. From Reeder [4].
15
(a) Test setup.
(b) Closed-up view.
Figure 3. Experimental setup for performing interface fracture toughness testing of SiC/RCC using SCB specimens: test setup, and closed-up view SCB specimen with a machined crack near
the SiC/RCC interface. From O’Brien [5].
16
(a) Typical load-displacement curve.
Crack Extension, inch0.0 0.2 0.4 0.6 0.8 1.0
G, l
b-in
/in2
0.0
0.2
0.4
0.6
0.8
1.0
1.2
RCC 6L-1
RCC 6L-2
RCC 6L-4
RCC 6L-7
SCB Specimen
(b) Energy release rate.
Figure 4. Typical load-displacement curve, and energy release rate, G, versus crack length for RCC generated using SCB specimens. From O’Brien [5].
17
Figure 5. Flow diagram of the micromechanical approach utilized to develop a fiber bridging
model for RCC using DCB data.
2a
x
2H
Figure 6. Schematic of a DCB specimen with bridged crack surfaces.
18
Crack Extension (a), inch
0.0 0.2 0.4 0.6 0.8 1.0 1.2
K, k
si (i
n)1/
2
1.0
1.2
1.4
1.6
1.8
2.0
2.2
2.4
DCB Specimen
RCC 6
RCC 5
RCC 3
RCC 2
RCC
Figure 7. KR-curves in RCC showing linear relationship between K and a.
Figure 14. Bridging stress normalized by the limiting stress, o, as a function of distance behind the crack tip: RCC 6L series, and RCC 2b series.
24
Thermo-mechanical
Loads RCC
SiC SiC
RCC
FiberBridgingZone
RCC
(a) An edge crack penetrating into the RCC.
Thermo-mechanical
Loads RCC
SiC SiC
SiC
RCC
FiberBridgingZone
(b) A T-shaped crack deflecting along the SiC/RCC interface.
Figure 15. Schematics of an edge crack and a T-shaped crack subjected to combined bending and tension: an edge crack penetrating into the RCC, and a T-shaped crack deflecting along the
SiC/RCC interface.
25
Crack Extension, inch0.0 0.2 0.4 0.6 0.8 1.0 1.2
K, k
si(in
)1/2
0.0
0.5
1.0
1.5
2.0
SCB Specimen
Data Model
RCC 2b-7
RCC 2b-3
RCC 2b-2
RCC 2b-4
Specimen
(a) RCC 2b series.
Crack Extension, inch0.0 0.2 0.4 0.6 0.8 1.0
K, k
si(in
)1/2
0.0
0.5
1.0
1.5
2.0
SCB Specimen
Data Model
RCC 6L-1
RCC 6L-2
RCC 6L-4
RCC 6L-7
Specimen
(b) RCC 6L series.
Figure 16. Computed KR-curves compared against experimental data of RCC measured using SCB specimens: RCC 2b series, and RCC 6L series.
26
Crack Extension (a), inch
0.0 0.2 0.4 0.6 0.8 1.0 1.2
G, l
b-in
/in2
0.0
0.5
1.0
1.5
2.0
DCB SpecimenRCC 6
RCC 5
RCC 3
RCC 2
Symbol: Experimental DataLine: Bridging Model
Figure 17. Computed GR-curves compared against experimental data for RCC measured using DCB specimens.
Crack Extension, inch0.0 0.1 0.2 0.3 0.4 0.5 0.6
G, l
b-in
/in2
0.0
0.5
1.0
1.5
2.0
RCC Specimen 2 Structural Model
T-CrackDCB
Figure 18. Comparison of computed GR curves for DCB and T-shaped cracks in RCC.
27
Crack Extension, inch0.0 0.2 0.4 0.6 0.8 1.0 1.2
G, l
b-in
/in2
0.0
0.2
0.4
0.6
0.8
RCC SCB 2b-3 Structural Model
Edge-CrackSCB
Figure 19. Comparison of computed GR curves for SCB and edge cracks in RCC under bending.
28
Bridge
l
wi
Crack
(a) Schematic.
(b) Actual bridging zone with bridging ligaments observed in RCC fracture mechanics specimens.
Figure 20. Schematic and actual bridging zone with bridging ligaments observed in RCC fracture mechanics specimens [5].
REPORT DOCUMENTATION PAGE Form ApprovedOMB No. 0704-0188
2. REPORT TYPE Contractor Report
4. TITLE AND SUBTITLEModel for the Effect of Fiber Bridging on the Fracture Resistance of Reinforced-Carbon-Carbon
5a. CONTRACT NUMBER
NNL07AA00B
6. AUTHOR(S)
Chan, Kwai S.; Lee, Yi-Der; Hudak, Stephen J., Jr.
7. PERFORMING ORGANIZATION NAME(S) AND ADDRESS(ES)NASA Langley Research CenterHampton, VA 23681-2199
9. SPONSORING/MONITORING AGENCY NAME(S) AND ADDRESS(ES)National Aeronautics and Space AdministrationWashington, DC 20546-0001
8. PERFORMING ORGANIZATION REPORT NUMBER
10. SPONSOR/MONITOR'S ACRONYM(S)
NASA
13. SUPPLEMENTARY NOTESPrepared for ATK Space Systems, Inc., Beltsville, Maryland NASA LaRC Technical Monitor: Ivatury S. Raju
12. DISTRIBUTION/AVAILABILITY STATEMENTUnclassified - UnlimitedSubject Category - 16 Space Transportation and SafetyAvailability: NASA CASI (443) 757-5802
A micromechanical methodology has been developed for analyzing fiber bridging and resistance-curve behavior in reinforced-carbon-carbon (RCC) panels with a three-dimensional (3D) composite architecture and a silicon carbide (SiC) surface coating. The methodology involves treating fiber bridging traction on the crack surfaces in terms of a weight function approach and a bridging law that relates the bridging stress to the crack opening displacement. A procedure has been developed to deduce material constants in the bridging law from the linear portion of the K-resistance curve. This report contains information on the application of procedures and outcomes.
15. SUBJECT TERMSCraze Crack; Double Cantilever Beam; Nondestructive Evaluation; Reinforced Carbon-Carbon; Single Cantilever Bend
18. NUMBER OF PAGES
35
19b. TELEPHONE NUMBER (Include area code)
(443) 757-5802
a. REPORT
U
c. THIS PAGE
U
b. ABSTRACT
U
17. LIMITATION OF ABSTRACT
UU
Prescribed by ANSI Std. Z39.18Standard Form 298 (Rev. 8-98)
3. DATES COVERED (From - To)
5b. GRANT NUMBER
5c. PROGRAM ELEMENT NUMBER
5d. PROJECT NUMBER
5e. TASK NUMBER
5f. WORK UNIT NUMBER
869021.05.07.04.99
11. SPONSOR/MONITOR'S REPORT NUMBER(S)
NASA/CR-2009-215947
16. SECURITY CLASSIFICATION OF:
The public reporting burden for this collection of information is estimated to average 1 hour per response, including the time for reviewing instructions, searching existing data sources, gathering and maintaining the data needed, and completing and reviewing the collection of information. Send comments regarding this burden estimate or any other aspect of this collection of information, including suggestions for reducing this burden, to Department of Defense, Washington Headquarters Services, Directorate for Information Operations and Reports (0704-0188), 1215 Jefferson Davis Highway, Suite 1204, Arlington, VA 22202-4302. Respondents should be aware that notwithstanding any other provision of law, no person shall be subject to any penalty for failing to comply with a collection of information if it does not display a currently valid OMB control number.PLEASE DO NOT RETURN YOUR FORM TO THE ABOVE ADDRESS.