Modeling and Mitigating Spatial Disorientation in Low G Environments: Year 2 Report Submitted to NASA’s National Space Biomedical Research Institute (NSBRI) Under NASA Cooperative Agreement NCC 9-58 Subagreement NCC 9-58-511 NSBRI Project Number SA 01302 By Ronald L. Small; John W. Keller; Christopher D. Wickens, PhD; Charles M. Oman, PhD; Michael Newman; Laurence R. Young, ScD; Thomas D. Jones, PhD; Mark Brehon February 2010 Alion Science and Technology Corp. and Massachusetts Institute of Technology 4949 Pearl East Circle, Suite 200 Man Vehicle Laboratory, Room 37-219 Boulder, Colorado 80301 77 Mass. Ave., Cambridge, MA 02139 303.442.6947 617.253.7508
Transcript
Modeling and Mitigating Spatial Disorientation in Low G Environments: Year 2 Report
Submitted to NASA’s National Space Biomedical Research Institute (NSBRI) Under NASA Cooperative Agreement NCC 9-58 Subagreement NCC 9-58-511 NSBRI Project Number SA 01302
By Ronald L. Small; John W. Keller; Christopher D. Wickens, PhD; Charles M. Oman, PhD; Michael Newman; Laurence R. Young, ScD; Thomas D. Jones, PhD; Mark Brehon
February 2010
Alion Science and Technology Corp. and Massachusetts Institute of Technology 4949 Pearl East Circle, Suite 200 Man Vehicle Laboratory, Room 37-219 Boulder, Colorado 80301 77 Mass. Ave., Cambridge, MA 02139 303.442.6947 617.253.7508
Modeling and mitigating spatial disorientation in low g environments NCC 9-58-511
FORT Progress................................................................................................................................12
Model Operation ...................................................................................................................................... 13
Model Computational Penalties ............................................................................................................. 14
Current Limitations ................................................................................................................................ 17
Model Exercises ....................................................................................................................................... 17
FORT Conclusion .................................................................................................................................... 21
Space Operations Scenarios for SD research ...............................................................................21
Appendix A. Shuttle Survey ..........................................................................................................28
Appendix B. Acronyms ..................................................................................................................29
Modeling and mitigating spatial disorientation in low g environments NCC 9-58-511
3 of 30
Acknowledgements The authors were supported by NASA-NSBRI funding under NCC 9-58-511. We are indebted to the anonymous Shuttle crewmembers who responded to our survey about spatial disorientation.
Modeling and mitigating spatial disorientation in low g environments NCC 9-58-511
4 of 30
Executive Summary This report describes the goals and progress of the project entitled Modeling and mitigating spatial disorientation in low g environments for NASA’s National Space Biomedical Research Institute (NSBRI) by the team of Alion Science and Technology Corp., and the Massachusetts Institute of Technology’s (MIT’s) Man Vehicle Laboratory. The report captures the team’s second year accomplishments during this four-year project and articulates the team’s Year 3 plans. The goal of this collaborative industry-university research and technology development project is to extend Alion’s spatial disorientation mitigation software – originally developed for aviation – to NASA’s space applications, including the Space Shuttle, Crew Exploration Vehicle, International Space Station, Altair lunar lander, and in near-Earth object and Mars exploration missions. Extensions to Alion’s software include adapting and adopting algorithms from MIT’s spatial orientation models, as well as Frame-of-Reference Transformation (FORT) theory concepts. The four overall specific aims of the project, and second year progress on each, are as follows: 1. Extend Alion’s Spatial Disorientation Analysis Tool (SDAT) by incorporating an enhanced MIT
Observer model into SDAT. Validate enhancements with existing and new flight data sets.
• Progress: Observer has been significantly enhanced with visual inputs for perception calculations, and a stand-alone version has been compiled to incorporate into SDAT. We have obtained several new data sets (Shuttle, Altair simulator, helicopter, helicopter simulator, VMS), but were unable to obtain Apollo data; according to our sources, those data sets were not archived.
2. Extend SDAT assessments to include typical space vehicle illusions: Inversion, Visual Reorientation,
Tilt Gain, and Otolith Tilt-Translation Reinterpretation (OTTR). Validation will include assessment of Shuttle landing data, and Altair simulator data.
• Progress: See above. Observer has been used to mimic astronaut post-flight Tilt-Gain and OTTR illusions (Newman, 2009). Additional experimental data on the dynamics of the illusions will eventually be needed for full validation. We assessed Space Shuttle SD frequency by surveying commanders and pilots for reports of spatial disorientation episodes during Shuttle entry and landing. Our questionnaire has been returned by more than two dozen Shuttle commanders and pilots. Their SD reports are recorded in a searchable database. Such SD frequency information can help our team design and target effective spacecraft cockpit countermeasures.
3. Further extend SDAT by examining alternative visual reference frames. FORT is used to predict the
cognitive cost of transitioning between reference frames. Validation of Aims 1-3 for SDAT may include parabolic flight experiments.
• Progress: We designed and prototyped a FORT tool to help designers calculate the cognitive costs of FORT. It is a stand-alone tool, not included in either SDAT or Observer. FORT costs include the increased potential for control errors, response time delays, and increased cognitive workload. We have begun to plan flight and simulator experiments to validate all enhancements to SDAT, although parabolic flight experiments may not be included.
4. To further enhance SDAT assessor performance, pilot multi-sensory workload is considered in coun-
termeasure selection. Validation experiments are not detailed, but will involve evaluations in ground-based simulators.
• Progress: Once we have verified and validated our models, we will assess the efficacy of various countermeasures triggered by SDAT during Year 4.
Modeling and mitigating spatial disorientation in low g environments NCC 9-58-511
5 of 30
Introduction This report describes the goals and progress of the project entitled Modeling and mitigating spatial disorientation in low g environments for NASA’s National Space Biomedical Research Institute (NSBRI) by the team of Alion Science and Technology Corp., and the Massachusetts Institute of Technology’s (MIT’s) Man Vehicle Laboratory. The report captures the team’s second year accomplishments during this four-year project and articulates the team’s Year 3 plans. Interested readers are encouraged to review our Year 1 report (Small et al., 2008) for details about the project’s overall goals and for descriptions of SDAT, Observer, and FORT theory, as this document is a progress report only. We first list the project’s original four goals, and summarize the progress on each. The following sections of this report will elaborate on the progress made. 1. Extend Alion’s Spatial Disorientation Analysis Tool (SDAT) by incorporating an enhanced
MIT Observer model into SDAT. Validate enhancements with existing and new flight data sets.
• Progress: Observer has been significantly enhanced with visual inputs for perception
calculations, and a stand-alone version has been compiled to incorporate into SDAT. We have obtained several new data sets (Shuttle, Altair simulator, helicopter, helicopter simulator, VMS), but were unable to obtain Apollo data; according to our sources, those data sets were not archived.
2. Extend SDAT assessments to include typical space vehicle illusions: Inversion, Visual
Reorientation, Tilt Gain, and Otolith Tilt-Translation Reinterpretation (OTTR). Validation will include assessment of Shuttle landing data, and Altair simulator data. • Progress: See above. Observer has been used to mimic astronaut post-flight Tilt-Gain and
OTTR illusions (Newman, 2009). Additional experimental data on the dynamics of the illusions will eventually be needed for full validation. We assessed Space Shuttle SD frequency by surveying commanders and pilots for reports of spatial disorientation episodes during Shuttle entry and landing. Our questionnaire has been returned by more than two dozen Shuttle commanders and pilots. Their SD reports are recorded in a searchable database. Such SD frequency information can help our team design and target effective spacecraft cockpit countermeasures.
3. Further extend SDAT by examining alternative visual reference frames. FORT is used to pre-
dict the cognitive cost of transitioning between reference frames. Validation of Aims 1-3 for SDAT may include parabolic flight experiments.
• Progress: We designed and prototyped a FORT tool to help designers calculate the cogni-
tive costs of FORT. It is a stand-alone tool, not included in either SDAT or Observer. FORT costs include the increased potential for control errors, response time delays, and increased cognitive workload. We have begun to plan flight and simulator experiments to
Modeling and mitigating spatial disorientation in low g environments NCC 9-58-511
6 of 30
validate all enhancements to SDAT, although parabolic flight experiments may not be included.
4. To further enhance SDAT assessor performance, pilot multi-sensory workload is considered in
countermeasure selection. Validation experiments are not detailed, but will involve evalu-ations in ground-based simulators.
• Progress: Once we have verified and validated our models, we will assess the efficacy of
various countermeasures triggered by SOAS (Alion’s spatial orientation aiding system; the real-time cockpit complement to SDAT) during Year 4.
The specific aims of Year 2 of the project were to: 1. Plan for incorporating MIT models into SDAT, with the plan to be executed as soon as
feasible. 2. Design a frame-of-reference transformation (FORT) model and plan for its incorporation into
SDAT, and perhaps into Observer, as well. 3. Understand micro-gravity and g-transition illusions sufficiently to model them in new SDAT
heuristics. 4. Plan how to verify and validate all models in the project’s next 2 years. The Alion-MIT team achieved the following on the above specific aims.
Merging SDAT & Observer Alion modified SDAT to be able to replace SDAT’s vestibular attitude calculator (VAC) algo-rithms with Observer algorithms. Together with MIT, we decided upon the input data set, the parameters to be passed between SDAT and Observer, and the outputs from Observer that SDAT will process with illusion heuristics. MIT focused on how to compile Observer into a stand-alone module to be incorporated into SDAT. An obstacle arose in that Observer is developed in MatLab with a Simulink GUI (graphical user interface). Deciding how to separate Observer from its GUI, and then compiling Observer, proved to be challenging. MIT developed a version of Observer that outputs perception data from an input motion data set into a tab-delimited text file. Alion modified SDAT to read the Observer output file so that the more detailed perception values of Observer could be used in SDAT. The goal is to develop illu-sion heuristics within SDAT that take advantage of the richer perception data from Observer than what SDAT previously calculated. An important advance for the team was in understanding the different values coming from Observer, and the changes needed to SDAT for it to use Observer’s outputs.
Observer Enhancements Quantitative observer models for spatial orientation and eye movements have been developed based on 1-g data from humans and animals (e.g., Oman, 1982, 1991; Merfeld et al., 1993;
Modeling and mitigating spatial disorientation in low g environments NCC 9-58-511
7 of 30
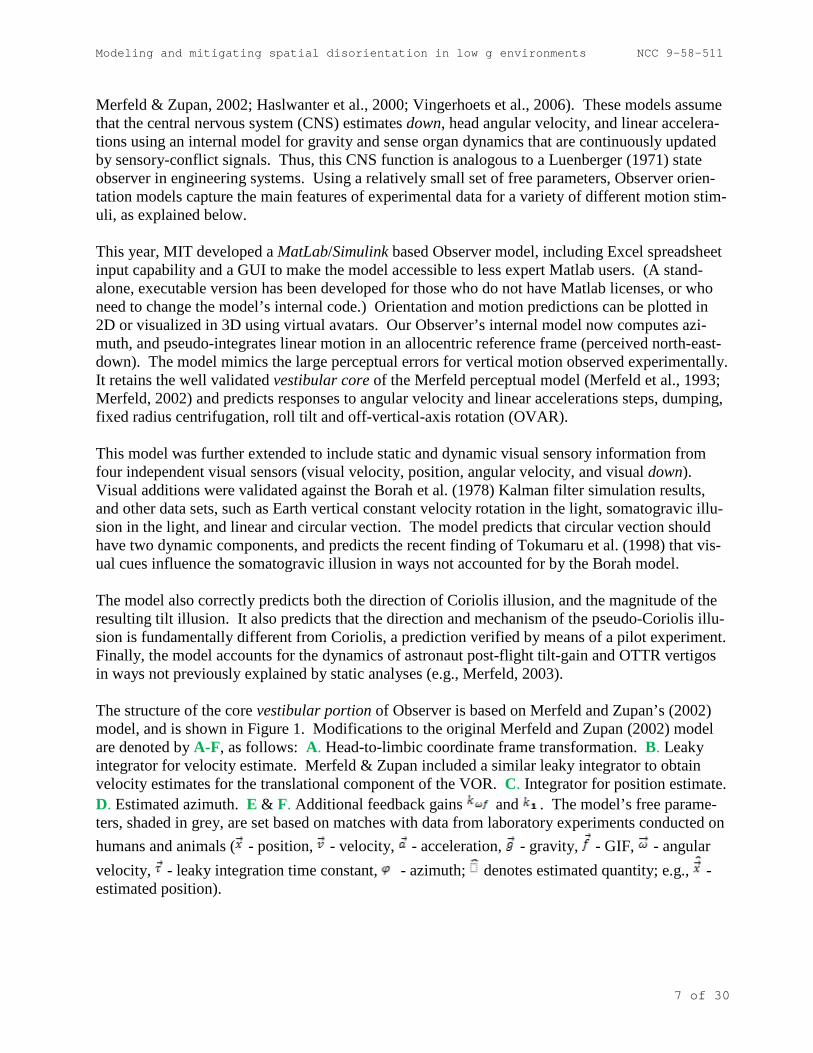
Merfeld & Zupan, 2002; Haslwanter et al., 2000; Vingerhoets et al., 2006). These models assume that the central nervous system (CNS) estimates down, head angular velocity, and linear accelera-tions using an internal model for gravity and sense organ dynamics that are continuously updated by sensory-conflict signals. Thus, this CNS function is analogous to a Luenberger (1971) state observer in engineering systems. Using a relatively small set of free parameters, Observer orien-tation models capture the main features of experimental data for a variety of different motion stim-uli, as explained below. This year, MIT developed a MatLab/Simulink based Observer model, including Excel spreadsheet input capability and a GUI to make the model accessible to less expert Matlab users. (A stand-alone, executable version has been developed for those who do not have Matlab licenses, or who need to change the model’s internal code.) Orientation and motion predictions can be plotted in 2D or visualized in 3D using virtual avatars. Our Observer’s internal model now computes azi-muth, and pseudo-integrates linear motion in an allocentric reference frame (perceived north-east-down). The model mimics the large perceptual errors for vertical motion observed experimentally. It retains the well validated vestibular core of the Merfeld perceptual model (Merfeld et al., 1993; Merfeld, 2002) and predicts responses to angular velocity and linear accelerations steps, dumping, fixed radius centrifugation, roll tilt and off-vertical-axis rotation (OVAR). This model was further extended to include static and dynamic visual sensory information from four independent visual sensors (visual velocity, position, angular velocity, and visual down). Visual additions were validated against the Borah et al. (1978) Kalman filter simulation results, and other data sets, such as Earth vertical constant velocity rotation in the light, somatogravic illu-sion in the light, and linear and circular vection. The model predicts that circular vection should have two dynamic components, and predicts the recent finding of Tokumaru et al. (1998) that vis-ual cues influence the somatogravic illusion in ways not accounted for by the Borah model. The model also correctly predicts both the direction of Coriolis illusion, and the magnitude of the resulting tilt illusion. It also predicts that the direction and mechanism of the pseudo-Coriolis illu-sion is fundamentally different from Coriolis, a prediction verified by means of a pilot experiment. Finally, the model accounts for the dynamics of astronaut post-flight tilt-gain and OTTR vertigos in ways not previously explained by static analyses (e.g., Merfeld, 2003). The structure of the core vestibular portion of Observer is based on Merfeld and Zupan’s (2002) model, and is shown in Figure 1. Modifications to the original Merfeld and Zupan (2002) model are denoted by A-F, as follows: A. Head-to-limbic coordinate frame transformation. B. Leaky integrator for velocity estimate. Merfeld & Zupan included a similar leaky integrator to obtain velocity estimates for the translational component of the VOR. C. Integrator for position estimate. D. Estimated azimuth. E & F. Additional feedback gains and . The model’s free parame-ters, shaded in grey, are set based on matches with data from laboratory experiments conducted on humans and animals ( - position, - velocity, - acceleration, - gravity, - GIF, - angular velocity, - leaky integration time constant, - azimuth; denotes estimated quantity; e.g., - estimated position).
Modeling and mitigating spatial disorientation in low g environments NCC 9-58-511
8 of 30
Figure 1. Core vestibular portion of Observer.
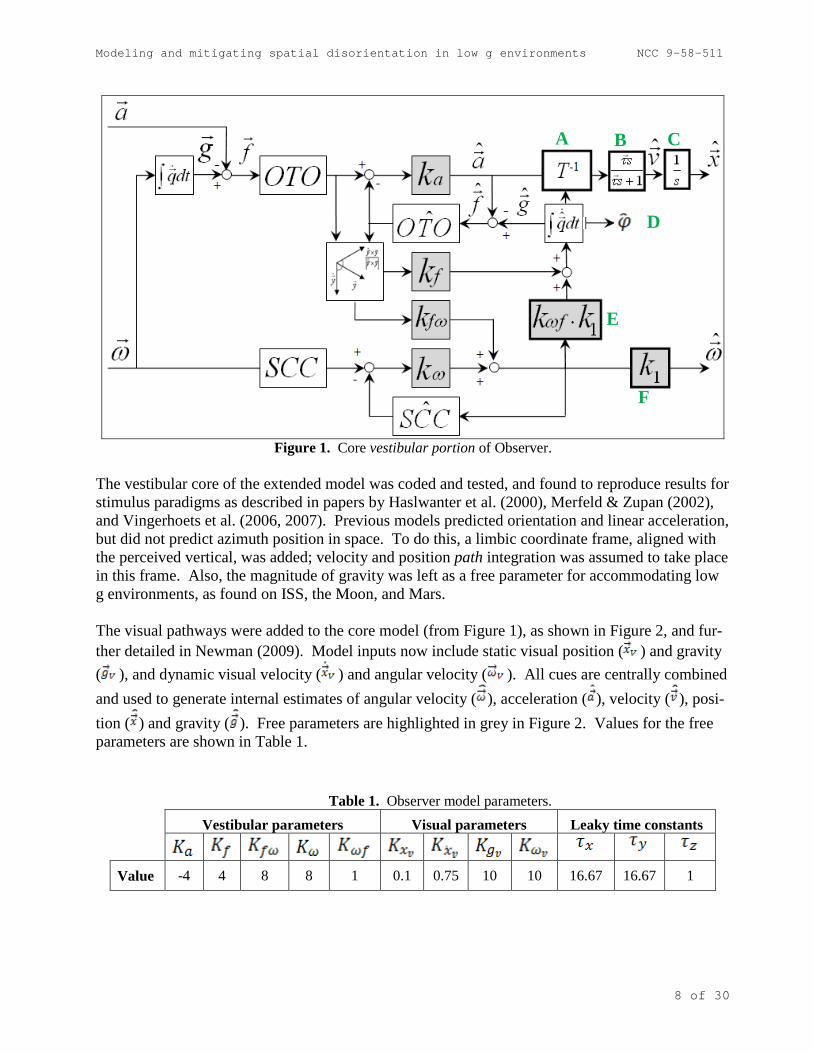
The vestibular core of the extended model was coded and tested, and found to reproduce results for stimulus paradigms as described in papers by Haslwanter et al. (2000), Merfeld & Zupan (2002), and Vingerhoets et al. (2006, 2007). Previous models predicted orientation and linear acceleration, but did not predict azimuth position in space. To do this, a limbic coordinate frame, aligned with the perceived vertical, was added; velocity and position path integration was assumed to take place in this frame. Also, the magnitude of gravity was left as a free parameter for accommodating low g environments, as found on ISS, the Moon, and Mars. The visual pathways were added to the core model (from Figure 1), as shown in Figure 2, and fur-ther detailed in Newman (2009). Model inputs now include static visual position ( ) and gravity ( ), and dynamic visual velocity ( ) and angular velocity ( ). All cues are centrally combined and used to generate internal estimates of angular velocity ( ), acceleration ( ), velocity ( ), posi-tion ( ) and gravity ( ). Free parameters are highlighted in grey in Figure 2. Values for the free parameters are shown in Table 1.
Table 1. Observer model parameters. Vestibular parameters Visual parameters Leaky time constants
Value -4 4 8 8 1 0.1 0.75 10 10 16.67 16.67 1
F
E
A C B
D
Modeling and mitigating spatial disorientation in low g environments NCC 9-58-511
9 of 30
Visual parameters for the Observer model were determined by simulating the same 1-g laboratory visual-vestibular interaction stimulus paradigms considered by Borah et al. (1979; i.e., linear vec-tion, circular vection, rotation in the light, and acceleration in the light), and determining parameter values such that results matched those of Borah, et al.’s (1979) Kalman filter predictions. Ob-server was then used to predict and compare subjective responses to vestibular Coriolis and visual pseudo-Coriolis stimuli. Most previous 3D, 6-DOF visual-vestibular interaction models (e.g., the Kalman filter model of Borah, et al. (1979)) made small angle assumptions, so that actual or per-ceived head orientation remained near upright. Like the Merfeld model, Observer’s real or per-ceived head tilt can undergo unlimited rotation from the vertical.
Figure 2. Observer model with static and dynamic visual inputs.
This enhanced version of Observer was partially validated by comparison to prior experiments and models, as noted above, and is being used by a related NSBRI project (Sensorimotor displays and controls for lunar landing; LR Young, PI) to model disorientation during lunar landing.
Modeling and mitigating spatial disorientation in low g environments NCC 9-58-511
10 of 30
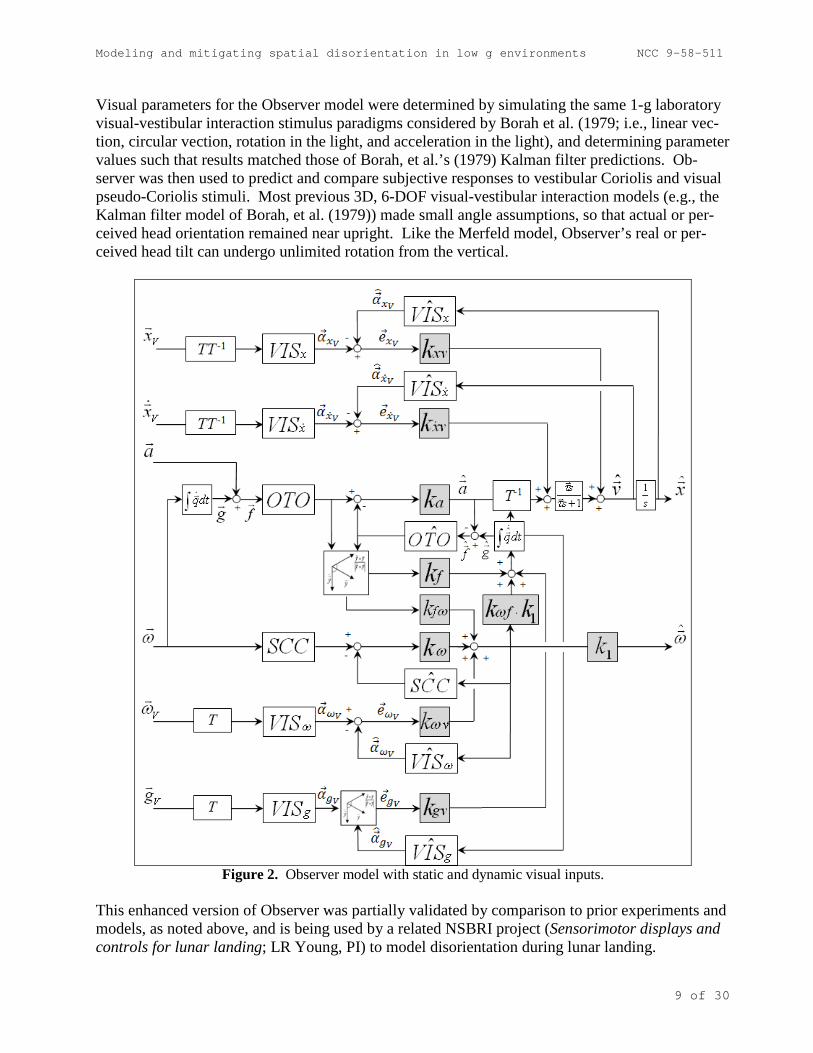
Observer User Interface Observer now includes a graphical user interface, shown in Figure 3 that the user can employ to select input data files, tune model parameters, and visualize model responses.
Figure 3. Observer graphical user interface.
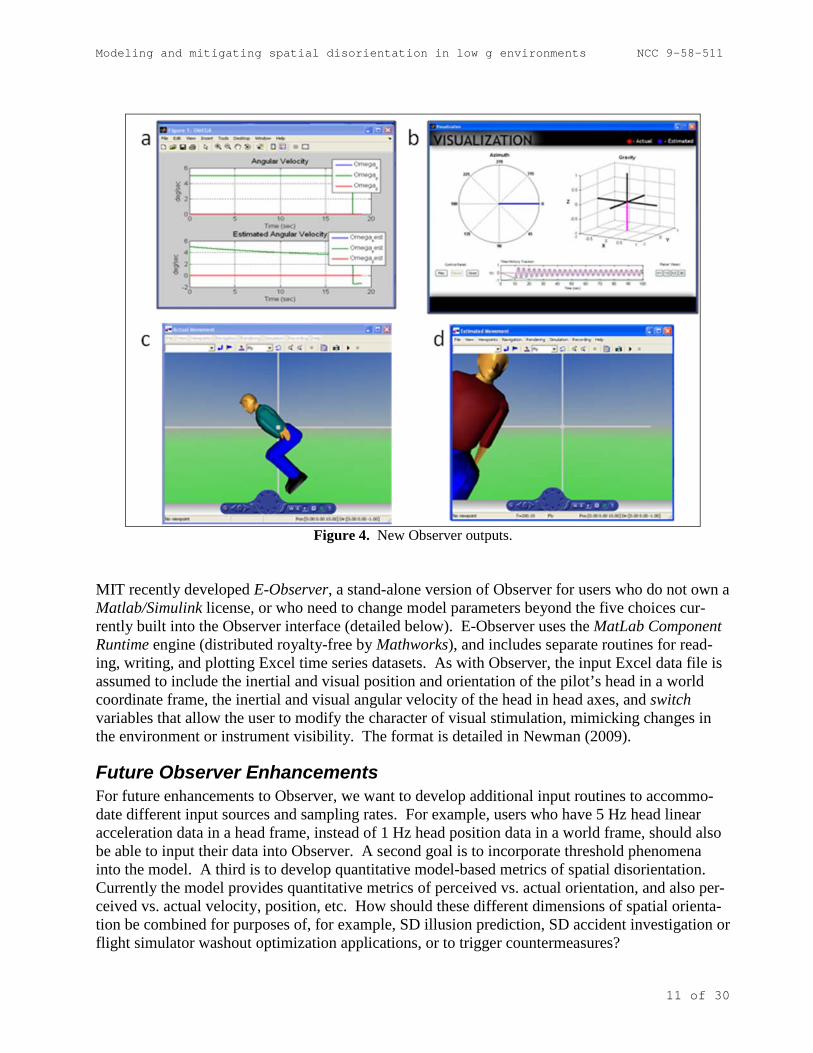
New Observer outputs are those illustrated in Figure 4. They include:
(a) An output data plot window where plots display the actual and estimated response for each individual vector component of a particular model output. Observer provides nine default plots: gravity, GIF, linear acceleration, linear velocity, position, angular velocity, tilt/subjective visual vertical (SVV), Euler angles, and stimulus cues.
(b) A 3D animated vector plot of the actual and perceived direction of gravity. Users can view the vector plot in the standard 3D isometric view and also with respect to each of the head axis planes. An animated progression of actual and predicted azimuth is also presented.
(c) and (d) Virtual reality (VR) simulation of the actual and estimated motion response. The VR simulation allows for a side-by-side comparison of the rotational (c) and translational (d) response of the subject in a true world-fixed coordinate frame.
Modeling and mitigating spatial disorientation in low g environments NCC 9-58-511
11 of 30
Figure 4. New Observer outputs.
MIT recently developed E-Observer, a stand-alone version of Observer for users who do not own a Matlab/Simulink license, or who need to change model parameters beyond the five choices cur-rently built into the Observer interface (detailed below). E-Observer uses the MatLab Component Runtime engine (distributed royalty-free by Mathworks), and includes separate routines for read-ing, writing, and plotting Excel time series datasets. As with Observer, the input Excel data file is assumed to include the inertial and visual position and orientation of the pilot’s head in a world coordinate frame, the inertial and visual angular velocity of the head in head axes, and switch variables that allow the user to modify the character of visual stimulation, mimicking changes in the environment or instrument visibility. The format is detailed in Newman (2009).
Future Observer Enhancements For future enhancements to Observer, we want to develop additional input routines to accommo-date different input sources and sampling rates. For example, users who have 5 Hz head linear acceleration data in a head frame, instead of 1 Hz head position data in a world frame, should also be able to input their data into Observer. A second goal is to incorporate threshold phenomena into the model. A third is to develop quantitative model-based metrics of spatial disorientation. Currently the model provides quantitative metrics of perceived vs. actual orientation, and also per-ceived vs. actual velocity, position, etc. How should these different dimensions of spatial orienta-tion be combined for purposes of, for example, SD illusion prediction, SD accident investigation or flight simulator washout optimization applications, or to trigger countermeasures?
Modeling and mitigating spatial disorientation in low g environments NCC 9-58-511
12 of 30
FORT Progress Because it is still undetermined whether, or how to, incorporate FORT into SDAT and/or Observer, we focused on developing a stand-alone FORT tool. The tool is intended for system designers who wish to compare the costs of various display-control orientations, illustrated in the following example. Consider a space station docking task: During final approach of the spacecraft, the astronaut is carefully aligning the spacecraft with the docking station, while viewing the error of alignment at an off angle, because the error display is positioned 90 degrees from the axis of control (and of approach). At the last second, just before contact, the astronaut moves the control in the wrong direction from that intended. The docking ring misalignment at contact causes slight damage to both the spacecraft and space station, resulting in expensive repairs. It is quite likely that such a hypothetical, but plausible, error could have been the result of a spatial disorientation error, resulting because the axis of control did not correspond to the axis along which the error was perceived. That is, there was a required frame of reference transformation (FORT). FORT theory is designed to understand the nature and cause of such errors. Below, we describe the theory and our efforts to translate this into a usable computational model. FORT theory is designed to predict the response time or speed, the error likelihood (including both discrete and continuous errors), and the mental workload imposed for any circumstance in which the astronaut or any human needs to translate from one frame of reference to another. A review of the literature indicates that there are two major sources of incompatibility between controls and displays that require frame of reference transformations. One of these relates to how the movement of a control yields displayed object motions along the six degrees of freedom defined by three axes of translation (X, Y, Z) and by three axes of rotation (pitch, roll & yaw). The second relates to where the display is positioned relative to the user’s trunk orientation. We refer to these two sources as FOR transformations of display-control motion, and transformations of display location, respectively. In the 2008 annual progress report (Small et al., 2008), we described in detail the literature that identified these costs. From this literature, we derived and presented estimates of the non-linear cost functions, relating angle of mis-alignment (i.e., degree of FOR transformation required), to measures of performance and mental workload (e.g., the classic mental rotation effect; Shepard & Hurwitz, 1984; Wickens et al., 2005). As an example, heading south with a vertically oriented north-up paper map requires a 180-degree yaw transformation and a 90-degree forward pitch trans-formation, to associate what is seen in the forward view with the map representation. The first of these transformations would be eliminated if the map were rotated 180 degrees (so that the text is now inverted, but “left” on the map now corresponds to “left” in the world). The second transfor-mation would be eliminated if the map were held horizontally. During the current year, we have transformed this description of costs into a FORT computational tool, in which the user specifies the design parameters of the workspace (displays, controls, their position, movement relationships and orientation), and the model computes an overall cost func-tion for the design.
Modeling and mitigating spatial disorientation in low g environments NCC 9-58-511
13 of 30
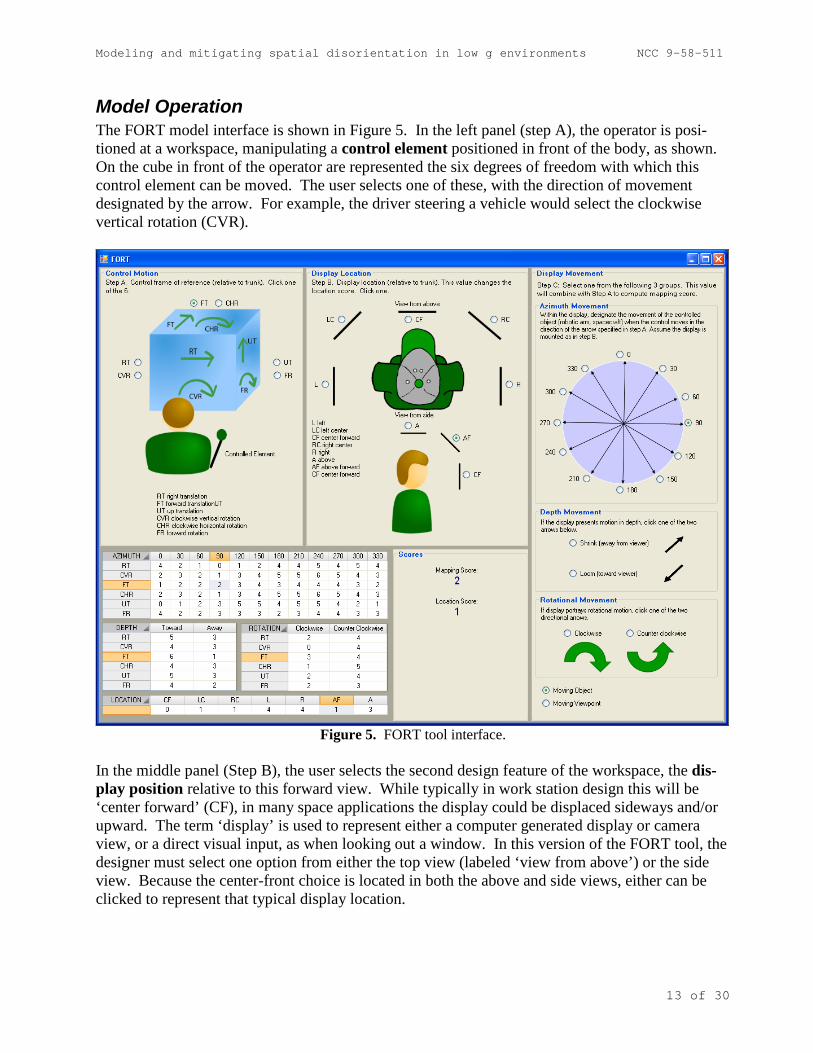
Model Operation The FORT model interface is shown in Figure 5. In the left panel (step A), the operator is posi-tioned at a workspace, manipulating a control element positioned in front of the body, as shown. On the cube in front of the operator are represented the six degrees of freedom with which this control element can be moved. The user selects one of these, with the direction of movement designated by the arrow. For example, the driver steering a vehicle would select the clockwise vertical rotation (CVR).
Figure 5. FORT tool interface.
In the middle panel (Step B), the user selects the second design feature of the workspace, the dis-play position relative to this forward view. While typically in work station design this will be ‘center forward’ (CF), in many space applications the display could be displaced sideways and/or upward. The term ‘display’ is used to represent either a computer generated display or camera view, or a direct visual input, as when looking out a window. In this version of the FORT tool, the designer must select one option from either the top view (labeled ‘view from above’) or the side view. Because the center-front choice is located in both the above and side views, either can be clicked to represent that typical display location.
Modeling and mitigating spatial disorientation in low g environments NCC 9-58-511
14 of 30
In the right panel (Step C), the operator designates the motion of the moving element on the dis-play when the control moves in the direction and orientation specified in Step A. If the displayed element translates linearly parallel to the display’s surface, a direction of movement is selected from the top panel of azimuth movement or compass headings. If the moving element translates in depth toward (looming) or away (shrinking) from the operator, one of the two arrows in the middle panel is selected. If the moving element on the display rotates (e.g., the horizon line on an aircraft attitude indicator), one of the two direction-of-rotation options in the bottom panel is selected. Only one of the three movement panels (azimuth, depth, rotation) can be selected for each control motion and display movement situation. Finally, the user specifies whether the control movement affects an object location (movement) against a stable background (or display frame), or controls the viewpoint with which the user sees the display. An example of the first case is if a camera were mounted to the vehicle in which an operator was controlling a robotic arm. Here the operator would see the arm receding, as the arm approached the target object at some distance from the vehicle. An example in the second case would be the image conveyed by a camera mounted to the robotic arm. If the arm moved forward, the display viewer would see the target getting closer (looming). In every case where there is direct viewing of the outside world through a viewport of a controlled vehicle (e.g., looking through the cockpit windscreen), the motion FOR is a controlled viewpoint; corresponding to what researchers in aviation have termed an “inside-out” display (Roscoe, 1968). Once the user completes these steps, the model automatically computes two penalty scores, one for the control and display movement relationship as specified by panels A and C, and one for display positioning (panel B). These penalties are shown in the bottom panel. For a multi-axis control or for multiple display locations, the designer will run the model repeatedly, once for each combina-tion of control axis, display location, and display movement. The score is based upon the matrix shown in the bottom left of the tool interface (Figure 5); Table 2, below, shows the penalty matrix in isolation. The penalties for mapping within each cell are derived from consideration of the collective empirical data reviewed in Small et al. (2008) and are imposed by linearly combining different components of a control-display mapping as described in the following section.
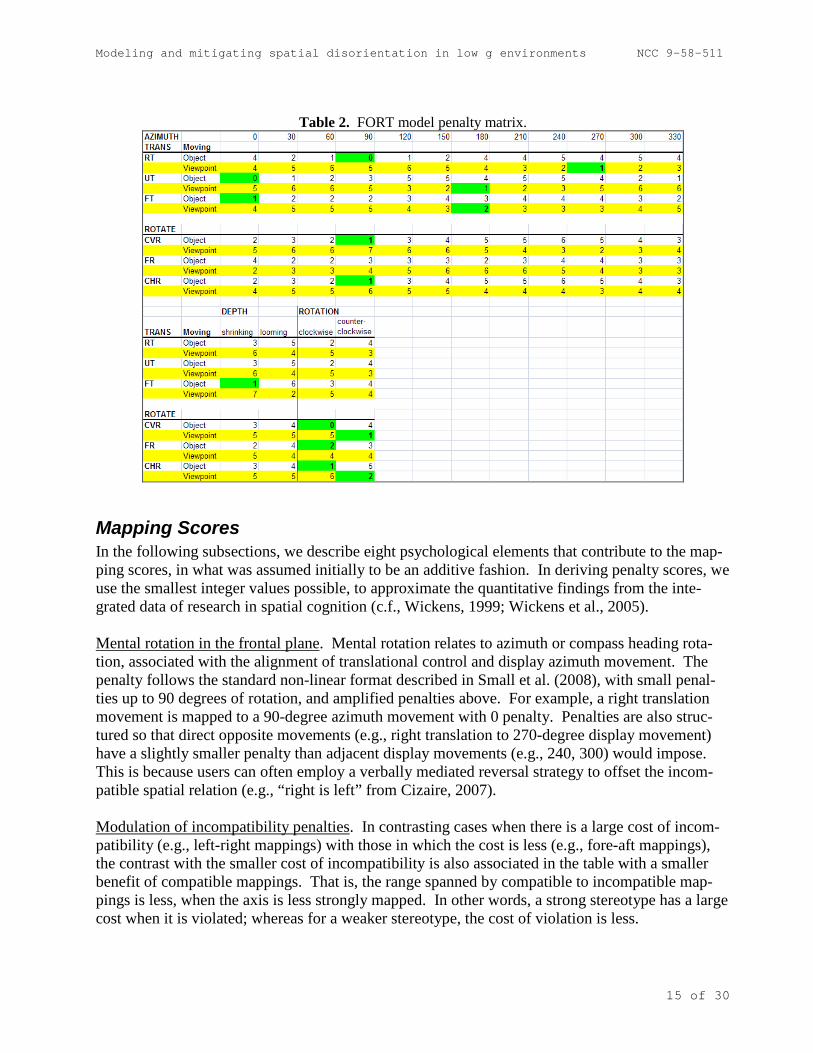
Model Computational Penalties Table 2 shows the current matrix with the full set of relative penalty values associated with each possible combination of control input, display location, and display movement. The penalty values were derived by considering the effects of various psychological factors identified via research in spatial cognition, as described in the following section. Values shown in white rows and labeled with the specific control motion refer to display movement while controlling an object. Those in yellow rows (light shading) refer to controlled viewpoint, as when movement of the control changes the viewpoint of the image generator (e.g., a camera view). Green cells (dark shading) indicate the most compatible control and display motion mapping combination within a given row.
Modeling and mitigating spatial disorientation in low g environments NCC 9-58-511
15 of 30
Table 2. FORT model penalty matrix.
Mapping Scores In the following subsections, we describe eight psychological elements that contribute to the map-ping scores, in what was assumed initially to be an additive fashion. In deriving penalty scores, we use the smallest integer values possible, to approximate the quantitative findings from the inte-grated data of research in spatial cognition (c.f., Wickens, 1999; Wickens et al., 2005). Mental rotation in the frontal plane. Mental rotation relates to azimuth or compass heading rota-tion, associated with the alignment of translational control and display azimuth movement. The penalty follows the standard non-linear format described in Small et al. (2008), with small penal-ties up to 90 degrees of rotation, and amplified penalties above. For example, a right translation movement is mapped to a 90-degree azimuth movement with 0 penalty. Penalties are also struc-tured so that direct opposite movements (e.g., right translation to 270-degree display movement) have a slightly smaller penalty than adjacent display movements (e.g., 240, 300) would impose. This is because users can often employ a verbally mediated reversal strategy to offset the incom-patible spatial relation (e.g., “right is left” from Cizaire, 2007). Modulation of incompatibility penalties. In contrasting cases when there is a large cost of incom-patibility (e.g., left-right mappings) with those in which the cost is less (e.g., fore-aft mappings), the contrast with the smaller cost of incompatibility is also associated in the table with a smaller benefit of compatible mappings. That is, the range spanned by compatible to incompatible map-pings is less, when the axis is less strongly mapped. In other words, a strong stereotype has a large cost when it is violated; whereas for a weaker stereotype, the cost of violation is less.
Modeling and mitigating spatial disorientation in low g environments NCC 9-58-511
16 of 30
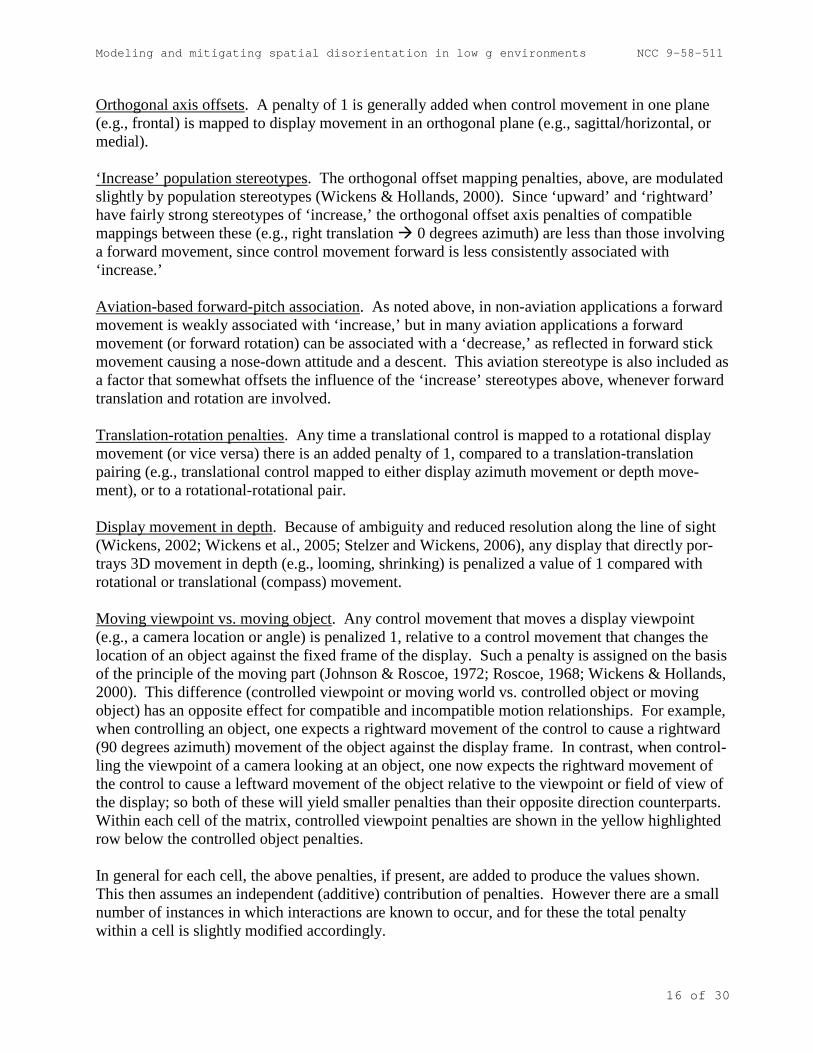
Orthogonal axis offsets. A penalty of 1 is generally added when control movement in one plane (e.g., frontal) is mapped to display movement in an orthogonal plane (e.g., sagittal/horizontal, or medial). ‘Increase’ population stereotypes. The orthogonal offset mapping penalties, above, are modulated slightly by population stereotypes (Wickens & Hollands, 2000). Since ‘upward’ and ‘rightward’ have fairly strong stereotypes of ‘increase,’ the orthogonal offset axis penalties of compatible mappings between these (e.g., right translation 0 degrees azimuth) are less than those involving a forward movement, since control movement forward is less consistently associated with ‘increase.’ Aviation-based forward-pitch association. As noted above, in non-aviation applications a forward movement is weakly associated with ‘increase,’ but in many aviation applications a forward movement (or forward rotation) can be associated with a ‘decrease,’ as reflected in forward stick movement causing a nose-down attitude and a descent. This aviation stereotype is also included as a factor that somewhat offsets the influence of the ‘increase’ stereotypes above, whenever forward translation and rotation are involved. Translation-rotation penalties. Any time a translational control is mapped to a rotational display movement (or vice versa) there is an added penalty of 1, compared to a translation-translation pairing (e.g., translational control mapped to either display azimuth movement or depth move-ment), or to a rotational-rotational pair. Display movement in depth. Because of ambiguity and reduced resolution along the line of sight (Wickens, 2002; Wickens et al., 2005; Stelzer and Wickens, 2006), any display that directly por-trays 3D movement in depth (e.g., looming, shrinking) is penalized a value of 1 compared with rotational or translational (compass) movement. Moving viewpoint vs. moving object. Any control movement that moves a display viewpoint (e.g., a camera location or angle) is penalized 1, relative to a control movement that changes the location of an object against the fixed frame of the display. Such a penalty is assigned on the basis of the principle of the moving part (Johnson & Roscoe, 1972; Roscoe, 1968; Wickens & Hollands, 2000). This difference (controlled viewpoint or moving world vs. controlled object or moving object) has an opposite effect for compatible and incompatible motion relationships. For example, when controlling an object, one expects a rightward movement of the control to cause a rightward (90 degrees azimuth) movement of the object against the display frame. In contrast, when control-ling the viewpoint of a camera looking at an object, one now expects the rightward movement of the control to cause a leftward movement of the object relative to the viewpoint or field of view of the display; so both of these will yield smaller penalties than their opposite direction counterparts. Within each cell of the matrix, controlled viewpoint penalties are shown in the yellow highlighted row below the controlled object penalties. In general for each cell, the above penalties, if present, are added to produce the values shown. This then assumes an independent (additive) contribution of penalties. However there are a small number of instances in which interactions are known to occur, and for these the total penalty within a cell is slightly modified accordingly.
Modeling and mitigating spatial disorientation in low g environments NCC 9-58-511
17 of 30
Multi-Axis Control If there is multi-axis control, the model is run for each separate axis, and penalties can be added.
Display Location Score Finally, we note that the ‘location scores’ are based on some fairly straightforward heuristics supported by research: (1) Locations that preserve left-right compatibility receive small penalties. (2) Orthogonal mappings have larger penalties. (3) The orthogonal mapping that destroys left-right congruence between control and display movement receives the largest mapping penalty.
Current Limitations As noted above, the model only computes one axis at a time, so for a multi-axis controller, sepa-rate sequencing of the tool’s three steps must be undertaken. Currently there is no explicit model-ing of how different axes combine (e.g., greater penalties for separate vs. multi-axis joysticks), so it is assumed that the total penalty of a set of axes is the sum of penalties over all single axes. The model also does not compute penalties if the position of the control is moved to the side. That is, an outward (away from body) movement of a control positioned to the right side, would have identical computation to the rightward movement of the control positioned as in panel A.
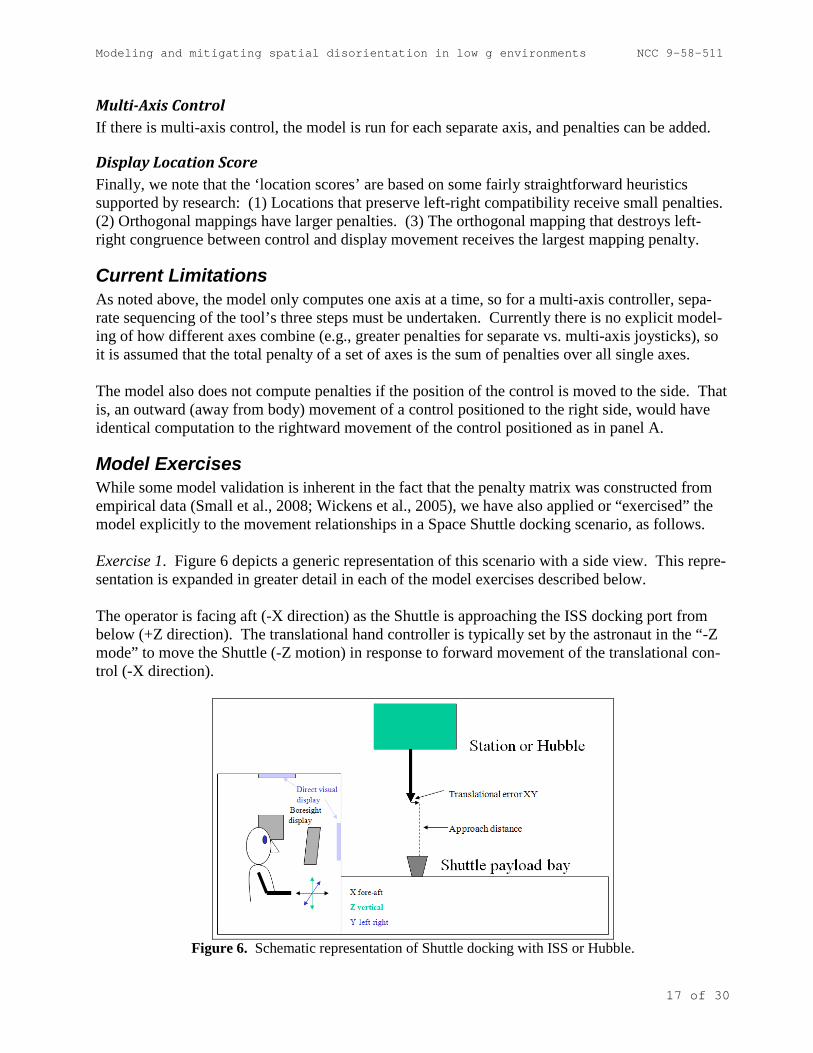
Model Exercises While some model validation is inherent in the fact that the penalty matrix was constructed from empirical data (Small et al., 2008; Wickens et al., 2005), we have also applied or “exercised” the model explicitly to the movement relationships in a Space Shuttle docking scenario, as follows. Exercise 1. Figure 6 depicts a generic representation of this scenario with a side view. This repre-sentation is expanded in greater detail in each of the model exercises described below. The operator is facing aft (-X direction) as the Shuttle is approaching the ISS docking port from below (+Z direction). The translational hand controller is typically set by the astronaut in the “-Z mode” to move the Shuttle (-Z motion) in response to forward movement of the translational con-trol (-X direction).
Figure 6. Schematic representation of Shuttle docking with ISS or Hubble.
Modeling and mitigating spatial disorientation in low g environments NCC 9-58-511
18 of 30
In the following exercises, the Shuttle rendezvous is with the Hubble telescope, rather than the ISS. Initial Hubble Rendezvous Exercise 2. Figure 7 shows the relative position of the Shuttle bay and Hubble space telescope during a rendezvous. In this case, the Shuttle itself is the controlled element (outlined in orange). The Hubble is represented by the green cylinder. The robotic arm (not used during initial rendezvous) is the black bar. The operator (Shuttle commander in this case) is positioned at the aft flight deck control station (left in the graphic) and facing aft (rightwards in the figure).
Figure 7. Shuttle-Hubble initial rendezvous schematic. XYZ refers to the translational mode control axes;
PRY (pitch, roll, yaw) refers to the rotational control axes. The commander is flying the Shuttle from the aft control panel with the controls in the -Z mode. Based on observations of actual rendezvous video, the sequence involved mostly translational alignments but one big yaw rotation was performed. A number of displays (or viewports) could be used by the commander including direct viewing through the ceiling window and the aft window, and a display showing any of the three Shuttle bay cameras. The model was run multiple times for each of three display/viewports represented in the three matrices below. Within each of these, the different model runs represent the different axes of control. Within each matrix is the control-dis-play mapping, and, in the right column, the mapping score for each axis. In each exercise descrip-tion, we specify whether there is a moving viewpoint or a moving object. Exercise 2.1. Ceiling window looking up at Hubble or mid-bay camera mounted in -Z, viewed in display screen (CF):
Control Sequence Control Motion Display Movement Mapping Score FT Lift FT Depth – looming 2 RT Y RT 270 deg 1 UT X UT 180 deg 1 CHR Yaw CHR Rotation –
counterclockwise 2
Mean score 1.5
Modeling and mitigating spatial disorientation in low g environments NCC 9-58-511
19 of 30
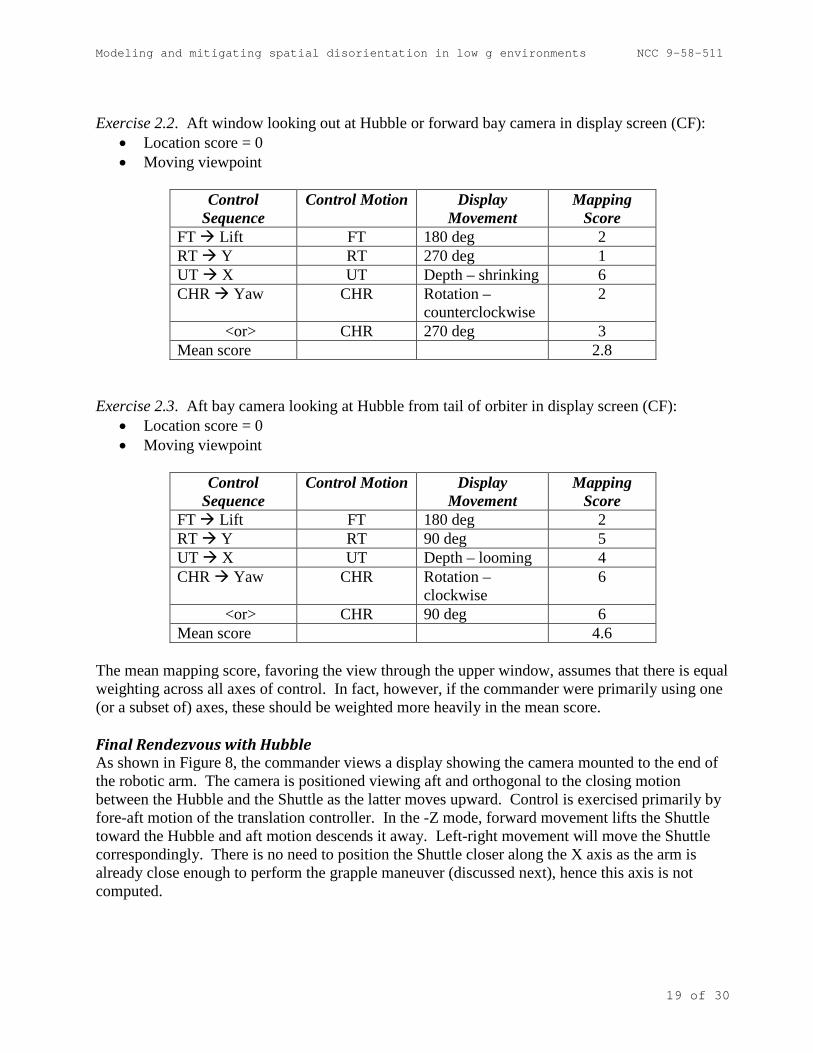
Exercise 2.2. Aft window looking out at Hubble or forward bay camera in display screen (CF):
• Location score = 0 • Moving viewpoint
Control
Sequence Control Motion Display
Movement Mapping
Score FT Lift FT 180 deg 2 RT Y RT 270 deg 1 UT X UT Depth – shrinking 6 CHR Yaw CHR Rotation –
counterclockwise 2
<or> CHR 270 deg 3 Mean score 2.8
Exercise 2.3. Aft bay camera looking at Hubble from tail of orbiter in display screen (CF):
• Location score = 0 • Moving viewpoint
Control
Sequence Control Motion Display
Movement Mapping
Score FT Lift FT 180 deg 2 RT Y RT 90 deg 5 UT X UT Depth – looming 4 CHR Yaw CHR Rotation –
clockwise 6
<or> CHR 90 deg 6 Mean score 4.6
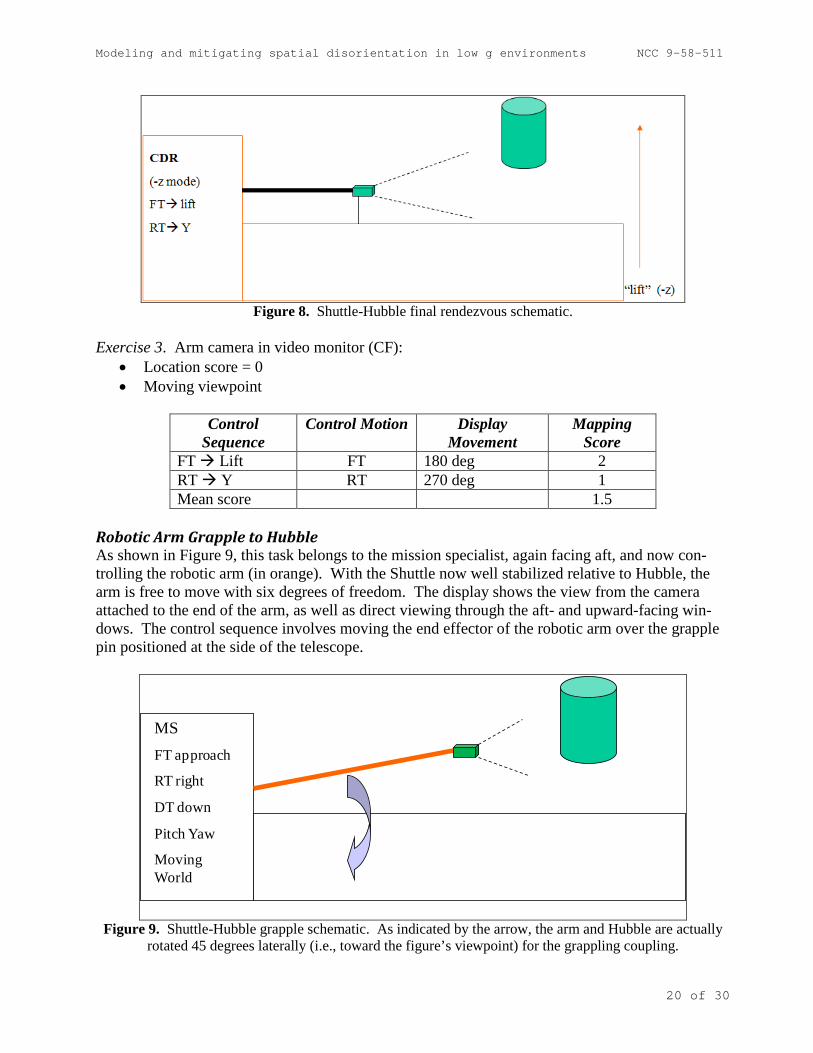
The mean mapping score, favoring the view through the upper window, assumes that there is equal weighting across all axes of control. In fact, however, if the commander were primarily using one (or a subset of) axes, these should be weighted more heavily in the mean score. Final Rendezvous with Hubble As shown in Figure 8, the commander views a display showing the camera mounted to the end of the robotic arm. The camera is positioned viewing aft and orthogonal to the closing motion between the Hubble and the Shuttle as the latter moves upward. Control is exercised primarily by fore-aft motion of the translation controller. In the -Z mode, forward movement lifts the Shuttle toward the Hubble and aft motion descends it away. Left-right movement will move the Shuttle correspondingly. There is no need to position the Shuttle closer along the X axis as the arm is already close enough to perform the grapple maneuver (discussed next), hence this axis is not computed.
Modeling and mitigating spatial disorientation in low g environments NCC 9-58-511
20 of 30
Figure 8. Shuttle-Hubble final rendezvous schematic.
Exercise 3. Arm camera in video monitor (CF):
• Location score = 0 • Moving viewpoint
Control
Sequence Control Motion Display
Movement Mapping
Score FT Lift FT 180 deg 2 RT Y RT 270 deg 1 Mean score 1.5
Robotic Arm Grapple to Hubble As shown in Figure 9, this task belongs to the mission specialist, again facing aft, and now con-trolling the robotic arm (in orange). With the Shuttle now well stabilized relative to Hubble, the arm is free to move with six degrees of freedom. The display shows the view from the camera attached to the end of the arm, as well as direct viewing through the aft- and upward-facing win-dows. The control sequence involves moving the end effector of the robotic arm over the grapple pin positioned at the side of the telescope.
MSFT approach
RT right
DT down
Pitch Yaw
Moving World
Figure 9. Shuttle-Hubble grapple schematic. As indicated by the arrow, the arm and Hubble are actually
rotated 45 degrees laterally (i.e., toward the figure’s viewpoint) for the grappling coupling.
Modeling and mitigating spatial disorientation in low g environments NCC 9-58-511
21 of 30
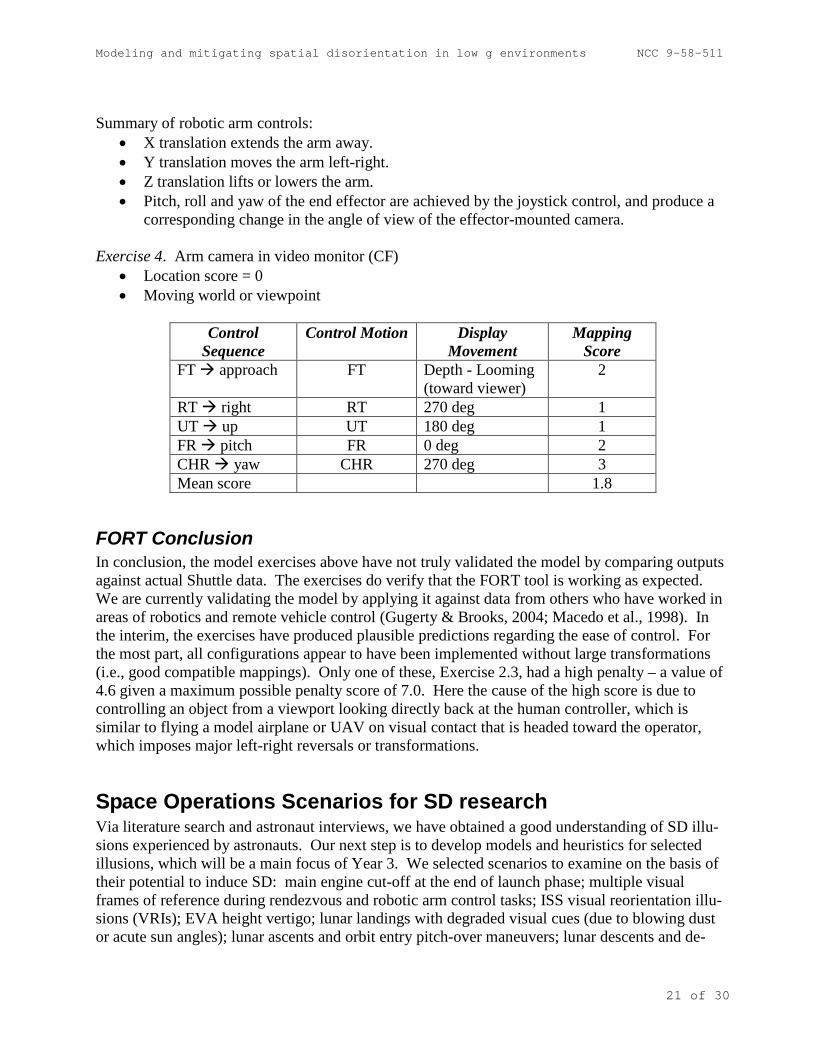
Summary of robotic arm controls:
• X translation extends the arm away. • Y translation moves the arm left-right. • Z translation lifts or lowers the arm. • Pitch, roll and yaw of the end effector are achieved by the joystick control, and produce a
corresponding change in the angle of view of the effector-mounted camera. Exercise 4. Arm camera in video monitor (CF)
• Location score = 0 • Moving world or viewpoint
Control
Sequence Control Motion Display
Movement Mapping
Score FT approach FT Depth - Looming
(toward viewer) 2
RT right RT 270 deg 1 UT up UT 180 deg 1 FR pitch FR 0 deg 2 CHR yaw CHR 270 deg 3 Mean score 1.8
FORT Conclusion In conclusion, the model exercises above have not truly validated the model by comparing outputs against actual Shuttle data. The exercises do verify that the FORT tool is working as expected. We are currently validating the model by applying it against data from others who have worked in areas of robotics and remote vehicle control (Gugerty & Brooks, 2004; Macedo et al., 1998). In the interim, the exercises have produced plausible predictions regarding the ease of control. For the most part, all configurations appear to have been implemented without large transformations (i.e., good compatible mappings). Only one of these, Exercise 2.3, had a high penalty – a value of 4.6 given a maximum possible penalty score of 7.0. Here the cause of the high score is due to controlling an object from a viewport looking directly back at the human controller, which is similar to flying a model airplane or UAV on visual contact that is headed toward the operator, which imposes major left-right reversals or transformations.
Space Operations Scenarios for SD research Via literature search and astronaut interviews, we have obtained a good understanding of SD illu-sions experienced by astronauts. Our next step is to develop models and heuristics for selected illusions, which will be a main focus of Year 3. We selected scenarios to examine on the basis of their potential to induce SD: main engine cut-off at the end of launch phase; multiple visual frames of reference during rendezvous and robotic arm control tasks; ISS visual reorientation illu-sions (VRIs); EVA height vertigo; lunar landings with degraded visual cues (due to blowing dust or acute sun angles); lunar ascents and orbit entry pitch-over maneuvers; lunar descents and de-
Modeling and mitigating spatial disorientation in low g environments NCC 9-58-511
22 of 30
orbit pitch-overs; Shuttle entries and landings; NEO landing tasks; adaptation to micro-gravity; and, adaptation from micro-gravity to lunar g or 1g. We will pare this list to a manageable number for in-depth countermeasure research in Years 3 and 4. The MIT Observer model incorporates gravity as a parameter. As detailed in Oman and Newman (2009) and Newman (2009), Observer offers a new interpretation for the dynamics of astronaut post-flight tilt-gain and otolith tilt translation reinterpretation (OTTR) vertigos in ways not explained by previous static analyses (e.g., Merfeld, 2003). The main obstacle in the modeling work is the lack of detailed descriptions of the OTTR and tilt-gain illusions in the literature. To date, 25 Shuttle commanders and pilots, who have flown the Shuttle manually during entry, have responded to the first version of our SD survey (Appendix A). Responses have been entered into a searchable database (spreadsheet) detailing responses to each of the ten questions. We have consulted two independent SD experts and added several questions to the survey to elicit responses on post-flight SD symptoms, as one example. Shuttle crewmembers have reported only a few instances of SD effects during their entry flying experiences. The few instances reported, how-ever, have been marked; the pilots report that their training enabled them to overcome the illusions and retain vehicle control. These reports and those we hope to gather in Year 3, will help to assess the need for display improvements and countermeasures in future spacecraft cockpits.
Verification & Validation After we integrate Observer into SDAT, we will check that current data inputs produce the expected outputs. Then, we will analyze new data sets and design simulator experiments to validate the selected models and heuristics. The MIT Observer model development suggested that additional data are needed on human per-ception of large amplitude motion in a gravitationally vertical direction. Such data will be of great importance in the design of lunar landing and helicopter simulators. Available data indicate that humans perform poorly when required to estimate the magnitude and phase of motions in a vertical direction. The open scientific question is whether this depends on the orientation of the subject with respect to the acceleration. The threshold to detection of linear acceleration depends upon the duration of the applied accele-ration, much as it does for angular motion. The adequate stimulus is approximated by the effective velocity of head motion, rather than by the acceleration (Melvill Jones & Young, 1978). The thre-shold level depends on both the head axis of the stimulus and the orientation of this axis relative to the gravitational vertical. Measurements by Young et al. (1966) showed that the effective thre-shold velocity was approximately 22 cm/sec for vertical as well as horizontal motion. Benson et al. (1986) showed a threshold for z-axis motion to be nearly 3 times higher than for lateral or fore-aft motion. Kingma (2005) found lower thresholds (i.e., anterior-posterior x-axis, threshold of 8.5 cm/s2 and lateral-axis threshold of 6.5 cm/s2) when repeated periodic stimuli were employed. Apparently the effective velocity threshold is elevated, by about a factor of 1.5 to 3, when the motion is parallel to the gravitational vertical, rather than horizontal. Furthermore, for vertical motion, parallel to gravity, subjects are often unable to correctly identify the direction of their motion (Malcolm & Melvill Jones, 1974; Young & Meiry, 1968). But, all existing experimental
Modeling and mitigating spatial disorientation in low g environments NCC 9-58-511
23 of 30
data are along the subject’s longitudinal axis. Experiments on large amplitude motion devices (e.g., NASA-Ames’ vertical motion simulator (VMS)), with subjects in varying orientations, may be appropriate. Another practical use of our models is to help the NASA-Ames VMS engineers fine-tune their “washout” algorithms for simulated operations in less than 1 g. Presently, it is suspected that the VMS washout algorithms are properly tuned for 1 g, but not for lunar g operations. (Washout refers to a simulator’s sub-threshold motions to return to a neutral attitude in preparation for future maneuvers. Sub-threshold refers to motions not perceived by the human vestibular system.) Helping VMS engineers fine-tune their washout algorithms is a practical application of SDAT-Observer and begins a collaborative relationship for future simulator validation experiments of SDAT-Observer algorithms in the VMS. Collaboration was begun in Year 2 and will continue through Year 3 and probably into Year 4.
Year 2 Key Accomplishments During the project’s second year, we focused on: understanding the separate Alion & MIT perception models; figuring out how to combine them; obtaining vehicle data sets for verification and validation tests; and, prototyping a visual frame of reference transformation (FORT) tool. We have access to Shuttle, VMS (vertical motion simulator), Altair simulator data sets, and helicopter simulator data sets. Apollo data sets are unavailable. We also began to understand VMS washout algorithms with the goal being to assist the VMS engineers fine-tune those algorithms to better account for lunar gravity. MIT’s Observer has been enhanced with visual inputs and calculations to account for the impact of visual cues on a human's perception of attitude. SDAT/SOAS is being enhanced with micro-gravity illusions heuristics. Using the new FORT tool, we established the general optimality of all but one Shuttle work-station configuration employed in docking.
Impact of Key Accomplishments on Original Aims The most important impact on our original aims from Year 2 is that we now have a FORT tool that helps designers calculate the costs of various cognitive display-control transformations. However, it is not clear whether or how we should integrate the FORT tool with either SDAT or Observer; that is something to ponder in Year 3.
Proposed Research Plan for Year 3 In the third year of this NSBRI sensorimotor adaptation project, the Alion-MIT team will:
Modeling and mitigating spatial disorientation in low g environments NCC 9-58-511
24 of 30
1. Continue enhancing and merging SDAT and Observer, and continue comparing analytical results of common data sets. We will figure out why there are differences in our respective results and what, if anything, to do about them. Observer will: • incorporate perceptual thresholds, • add static and dynamic visual cues for perception calculations, • focus on scenarios involving human perception of vertical and horizontal motions (as
would be experienced during lunar landing and take-off scenarios), and • evaluate the impact of motion cues on perception in hovering lunar landers with the
pilot’s head located near the center of gravity (as in a training vehicle) vs. offset 8-12 feet above (as in Altair).
SDAT will add more SD illusion sequence heuristics and may use Observer as a compiled module within SDAT to calculate perceived attitudes, angular and linear velocities, and displacements for comparison with actual vehicle values to assess the likelihood of SD.
2. Validate enhancements with previous flight data sets and new data sets (from actual vehicles and from simulators). Included may be Shuttle landing data outlier analyses (compared to non-outliers), and data sets from Altair and ALHAT simulators. Particular emphasis will be on data sets with lateral and vertical motions to test new functionality within SDAT.
3. Expand FORT to additional axes and higher derivatives (velocity and acceleration). Incorpo-
rate the FORT model’s cost function into an enhanced SDAT, if practical. 4. Plan the details of validation experiments in Years 3 and 4. Flight experiments will likely
focus on obtaining subjective perception data in low g environments. Simulation experi-ments will likely focus on countermeasure efficacy. Some suitable simulators (e.g., Ames’ VMS) might be used for both purposes.
The main focus of our research is to understand astronaut SD events and to apply appropriate countermeasures to help future astronauts who may experience SD to avoid its adverse conse-quences. In Year 3 we will focus more attention on verification and validation (V&V) with data sets, and designing validation experiments. If we do parabolic flight experiments, we will borrow ideas from Borah and colleagues’ TIFS experiments in the 1980s, which measured in-flight per-ception of both translatory motions and which way is “down” (Borah & Young, 1982; 1983). Simulator experiments (e.g., in the VMS) will have similar goals.
Plan how to verify and validate all models in the project’s next two years Originally, we proposed parabolic flight experiments to verify and validate our models. Our cur-rent thinking is that we will use a combination of flight, vertical motion simulator (VMS), or pos-sibly other simulator resources for validation. Our goals are to test our SDAT and Observer per-ception and illusion sequence algorithms, and the efficacy of our real-time countermeasures, as well as our FORT model. Experimental testing of SDAT/SOAS should be done in two stages: the first to fine-tune our SD detection algorithms, the second to test our multi-sensory countermea-
Modeling and mitigating spatial disorientation in low g environments NCC 9-58-511
25 of 30
sures once SD is detected. Clearly, for Earth-based simulators, we will be unable to validate algo-rithms that predict 0-g adaptation illusions, such as OTTR and tilt-gain. During the first two years we have identified several potential facilities for conducting motion experiments of different levels of fidelity. In each case, the goal is to stimulate human subjects with precisely controlled angular and linear accelerations, and to measure the subjects’ dynamic perceptions of orientation and motion sensations. The SDAT and Observer models will be programmed to accept the motion inputs and to produce predictions of the subject reactions. We are considering cooperative research with several laboratories, in the US and abroad, to achieve these goals.
Conclusion We have made decent progress in Year 2 and expect to accelerate our accomplishments in Year 3, now that we have a version of Observer that can be integrated into SDAT.
References Benson, A.J., Spencer, M.B., & J.R. Stott (1986). Thresholds for the detection of the direction of
whole-body, linear movement in the horizontal plane. Aviation, Space and Environmental Medicine, 57(11), 1088-96.
Borah, J., & L.R. Young (1983). Spatial orientation and motion cue environment study in the total in-flight simulator (AFHRL-TP-82-28 under contract F33615-78-C-0062). Williams AFB, AZ: AFHRL.
Borah, J., & L.R. Young (1982). Orientation perception during aircraft coordinated turns. In Proceedings of the AIAA 20th Aerospace Sciences Meeting (AIAA-82-0258). NY: AIAA.
Borah, J., Young, L.R., & R.E. Curry (1988). Optimal estimator model for human spatial orientation. Annals of the New York Academy of Sciences, 545, 1-73.
Borah, J., Young, L.R., & R.E. Curry (1979). Optimal estimator model for human spatial orientation. IEEE Transactions on Systems, Man and Cybernetics, 800-805.
Cizaire, C. (2007). Effect of 2 module docked spacecraft configurations on spatial orientation (Master’s thesis). Cambridge, MA: MIT.
Gugerty, L., & J. Brooks (2004). Reference frame misalignment and cardinal direction judgments: Group differences and strategies. Journal of Experimental Psychology: Applied, 10, 75-88.
Haslwanter, T., Jaeger, R., Mayr, S., & M. Fetter (2000). Three-dimensional eye-movement responses to off-vertical axis rotations in humans. Experimental Brain Research, 134, 96-106.
Johnson, S., & S. Roscoe (1972). What moves? The airplane or the world. Human Factors, 14, 107-129.
Kingma, H. (2005, Jun 22). Thresholds for perception of direction of linear acceleration as a possible evaluation of the otolith function. BMC Ear Nose Throat Disorders, 5(1), 5.
Luenberger, D.G. (1971). An introduction to observers. IEEE Transactions on Automatic Control, 16, 596-602.
Macedo, J., Kaber, D., Endsley, M., Powanusorn, P., & S. Myung (1998). The effect of automated compensation for incongruent axes on teleoperator performance. Human Factors, 40, 541-553.
Modeling and mitigating spatial disorientation in low g environments NCC 9-58-511
26 of 30
Malcolm, R., & G. Melvill Jones (1974). Erroneous perception of vertical motion by humans seated in the upright position. Acta Otolaryngol. 77, 274-283.
Melvill Jones, G., & L.R. Young (1978). Subjective detection of vertical acceleration: a velocity-dependent response? Acta Otolaryngol. 85, 45-53.
Merfeld, D.M. (2003). Rotation otolith tilt-translation reinterpretation (ROTTR) hypothesis: A new hypothesis to explain neurovestibular spaceflight adaptation. Journal of Vestibular Research, 13, 309-320.
Merfeld, D.M., Young, L.R., Oman, C.M., & M.J. Shelhamer (1993). A multidimensional model of the effects of gravity on the spatial orientation of the monkey. Journal of Neurophysiology, 3, 141-161.
Merfeld, D.M., & L.H. Zupan (2002). Neural processing of gravitoinertial cues in humans. III Modeling tilt and translation responses. Journal of Neurophysiology, 87, 819-833.
Newman, M.C. (2009). A multisensory Observer model for human spatial orientation perception (SM thesis). Cambridge, MA: Department of Aeronautics and Astronautics, Massachusetts Institute of Technology.
Oman, C.M. (1991). Sensory conflict in motion sickness: An Observer theory approach. In S. Ellis (Ed.), Pictorial communication in real and virtual environments. London: Taylor and Francis, 362-367.
Oman, C.M. (1982). A heuristic mathematical model for dynamics of sensory conflict and motion sickness. Acta Otolaryngologica (Stockholm), 392 (Supplement), 1-44.
Oman, C.M., & M.C. Newman (2009). Observer model for spatial orientation research and accident investigation. Aviation, Space and Environmental Medicine, 80(3), 208. (Also, paper 41 at 80th Annual Scientific Meeting of the Aerospace Medical Association, Los Angeles, CA.)
Roscoe, S. (1968). Airborne displays for flight navigation. Human Factors, 10, 321-332. Shepard, R., & S. Hurwitz (1984). Upward direction, mental rotation and discrimination of left
and right turns in maps. Cognition, 18, 161-193. Small, R.L., C.D. Wickens, J.W. Keller, C.M. Oman, L.R. Young, T.D. Jones, M. Newman, & M.
Brehon (2008). Modeling and mitigating spatial disorientation in low g environments: Year 1 report (under NASA contract NCC 9-58-511, NSBRI project # SA01302, Alion project # 4658). Boulder, CO: Alion Science & Technology Corp. [Available from the first author at [email protected].]
Stelzer, E.M., & C.D. Wickens (2006). Pilots strategically compensate for display enlargements in surveillance and flight control tasks. Human Factors, 48(1), 166-181.
Tokumaru, O., Kaida, K., Ashida, H., Mizumoto, C., & J. Tatsuno (1998). Visual influence on the magnitude of somatogravic illusion evoked on advanced spatial disorientation demonstrator. Aviation, Space and Environmental Medicine, 69, 111-116.
Vingerhoets, R.A.A., Medendorp, W.P., & J.A.M. Van Ginsbergen (2006). Time course and magnitude of illusory translation perception during off-vertical axis rotation. Journal of Neurophysiology, 95, 1571-1587.
Vingerhoets, R.A.A., J.A.M. Van Ginsbergen, & W.P. Medendorp (2007). Verticality perception during off-vertical axis rotation. Journal of Neurophysiology, 97, 3256-3268.
Wickens, C.D. (2002). Spatial awareness biases (Technical Report ARL-02-6/NASA-02-4). Savoy, IL: University of Illinois, Aviation Research Laboratory.
Wickens, C.D. (1999). Frames of reference for navigation. In D. Gopher & A. Koriat (Eds.), Attention and performance, Vol. 17: Cognitive regulation for performance: Interaction of theory and application. Cambridge, MA: Bradford Book, 113-144.
Modeling and mitigating spatial disorientation in low g environments NCC 9-58-511
27 of 30
Wickens, C.D. & J. Hollands (2000). Engineering Psychology and Human Performance. Prentice Hall.
Wickens, C.D., Vincow, M., & M. Yeh (2005). Design applications of visual spatial thinking: The importance of frame of reference. In A. Miyaki & P. Shah (Eds.), Handbook of visual spatial thinking. Oxford, UK: Oxford University Press.
Young, L.R., Meiry, J.L., & Y.T. Li (1966, Jan 25-27). Control engineering approaches to human dynamic spatial orientation. 2nd Symposium on the Vestibular Organs in Space Exploration (NASA SP-115). Sunnyvale, CA: NASA Ames Research Center, 217-227.
Modeling and mitigating spatial disorientation in low g environments NCC 9-58-511
28 of 30
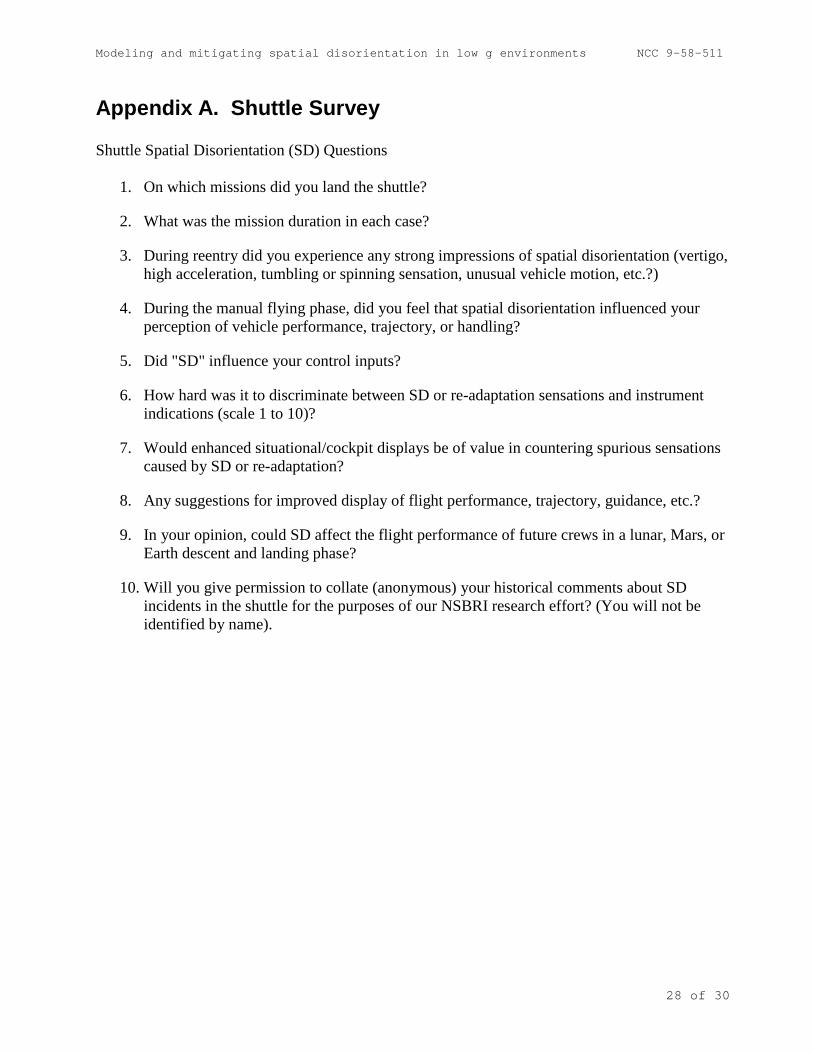
Appendix A. Shuttle Survey Shuttle Spatial Disorientation (SD) Questions
1. On which missions did you land the shuttle?
2. What was the mission duration in each case?
3. During reentry did you experience any strong impressions of spatial disorientation (vertigo, high acceleration, tumbling or spinning sensation, unusual vehicle motion, etc.?)
4. During the manual flying phase, did you feel that spatial disorientation influenced your perception of vehicle performance, trajectory, or handling?
5. Did "SD" influence your control inputs?
6. How hard was it to discriminate between SD or re-adaptation sensations and instrument indications (scale 1 to 10)?
7. Would enhanced situational/cockpit displays be of value in countering spurious sensations caused by SD or re-adaptation?
8. Any suggestions for improved display of flight performance, trajectory, guidance, etc.?
9. In your opinion, could SD affect the flight performance of future crews in a lunar, Mars, or Earth descent and landing phase?
10. Will you give permission to collate (anonymous) your historical comments about SD incidents in the shuttle for the purposes of our NSBRI research effort? (You will not be identified by name).
Modeling and mitigating spatial disorientation in low g environments NCC 9-58-511
29 of 30
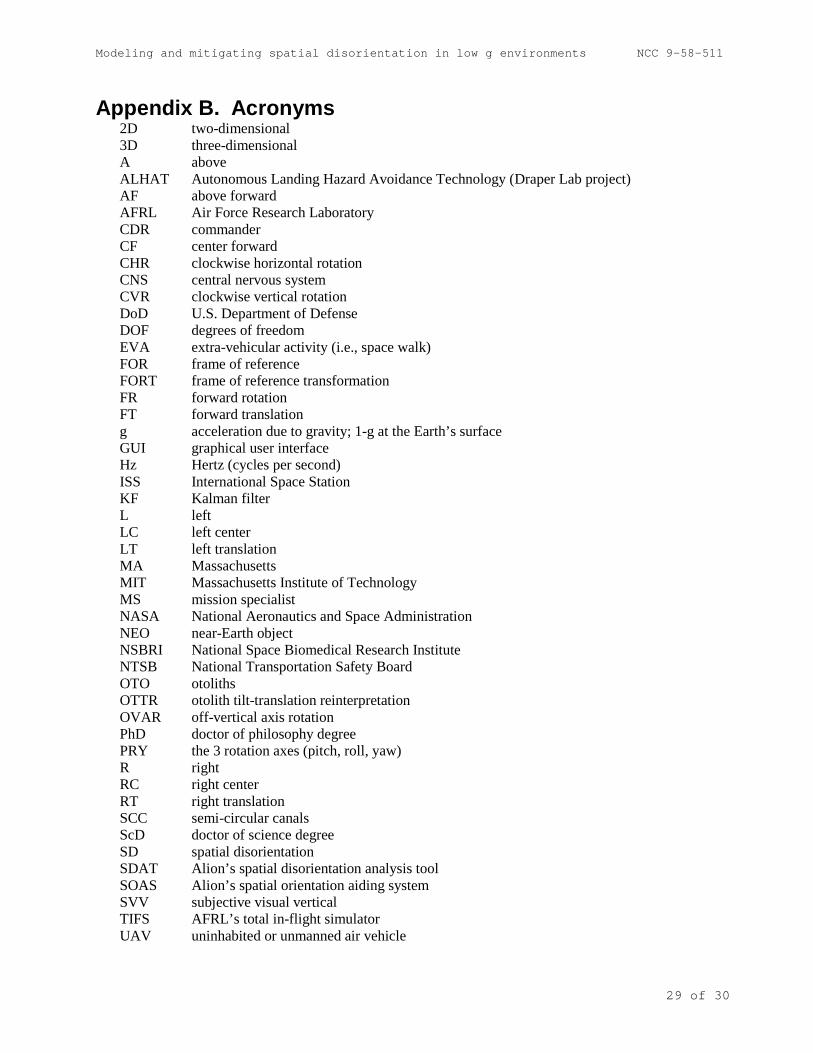
Appendix B. Acronyms 2D two-dimensional 3D three-dimensional A above ALHAT Autonomous Landing Hazard Avoidance Technology (Draper Lab project) AF above forward AFRL Air Force Research Laboratory CDR commander CF center forward CHR clockwise horizontal rotation CNS central nervous system CVR clockwise vertical rotation DoD U.S. Department of Defense DOF degrees of freedom EVA extra-vehicular activity (i.e., space walk) FOR frame of reference FORT frame of reference transformation FR forward rotation FT forward translation g acceleration due to gravity; 1-g at the Earth’s surface GUI graphical user interface Hz Hertz (cycles per second) ISS International Space Station KF Kalman filter L left LC left center LT left translation MA Massachusetts MIT Massachusetts Institute of Technology MS mission specialist NASA National Aeronautics and Space Administration NEO near-Earth object NSBRI National Space Biomedical Research Institute NTSB National Transportation Safety Board OTO otoliths OTTR otolith tilt-translation reinterpretation OVAR off-vertical axis rotation PhD doctor of philosophy degree PRY the 3 rotation axes (pitch, roll, yaw) R right RC right center RT right translation SCC semi-circular canals ScD doctor of science degree SD spatial disorientation SDAT Alion’s spatial disorientation analysis tool SOAS Alion’s spatial orientation aiding system SVV subjective visual vertical TIFS AFRL’s total in-flight simulator UAV uninhabited or unmanned air vehicle
Modeling and mitigating spatial disorientation in low g environments NCC 9-58-511
30 of 30
UT up translation V&V verification and validation VAC SDAT’s vestibular attitude calculator VIS visual VMS NASA Ames’ vertical motion simulator VOR vestibular-ocular reflex VR virtual reality VRI visual reorientation illusion XYZ the 3 translation axes