+ All Categories
Home > Documents > Modeling and Optimizing Emergency Department Workflow

Modeling and Optimizing Emergency Department Workflow

Date post: 11-Feb-2022
Category:
Upload: others
View: 2 times
Download: 0 times
Share this document with a friend
35
Modeling and Optimizing Emergency Department Workflow Hany Y Atallah, MD Chief of Emergency Medicine, Grady Health Systems Assistant Professor, Emory University Department - Emergency Medicine Eva K Lee, PhD Director, Center for Operations Research in Medicine and Healthcare Co-Director, NSF I/UCRC Center for Health Organization Transformation Distinguished Scholar, Health System Institute, Emory / Georgia Tech Professor, School of Industrial and Systems Engineering, Georgia Tech
Transcript

Modeling and Optimizing

Emergency Department

Workflow

Hany Y Atallah, MD

Chief of Emergency Medicine, Grady Health Systems

Assistant Professor, Emory University Department - Emergency Medicine

Eva K Lee, PhD Director, Center for Operations Research in Medicine and Healthcare

Co-Director, NSF I/UCRC Center for Health Organization Transformation

Distinguished Scholar, Health System Institute, Emory / Georgia Tech

Professor, School of Industrial and Systems Engineering, Georgia Tech

Emergency Department (ED)

Challenges

• Overcrowding, growing volume

• Unnecessarily long length-of-stay, long wait times

• Presence of patients with non-urgent medical conditions (~40%)

• Return after 72 hours (5%), 30 days (20%)

• Decreased quality of care and patient satisfaction

• Shrinking rates of reimbursement (Medicare, Medicaid, Commercial)

• Federal and State Regulations (COBRA, HCFA, etc)

Grady’s ED Challenges

• Premier Level I Trauma Center for the region

• Internationally recognized teaching Hospital (Emory,

Morehouse)

• 120,000 ED patients per year – Approximately 3500 acute trauma patient admissions

– Approximately 350 patients daily

• Safety net

• Only 8% privately insured, 36% Medicaid/Medicare, 55% self-

pay

– Nationally 50% insured

• Growing ED demand

• Limited healthcare access for the un/underinsured

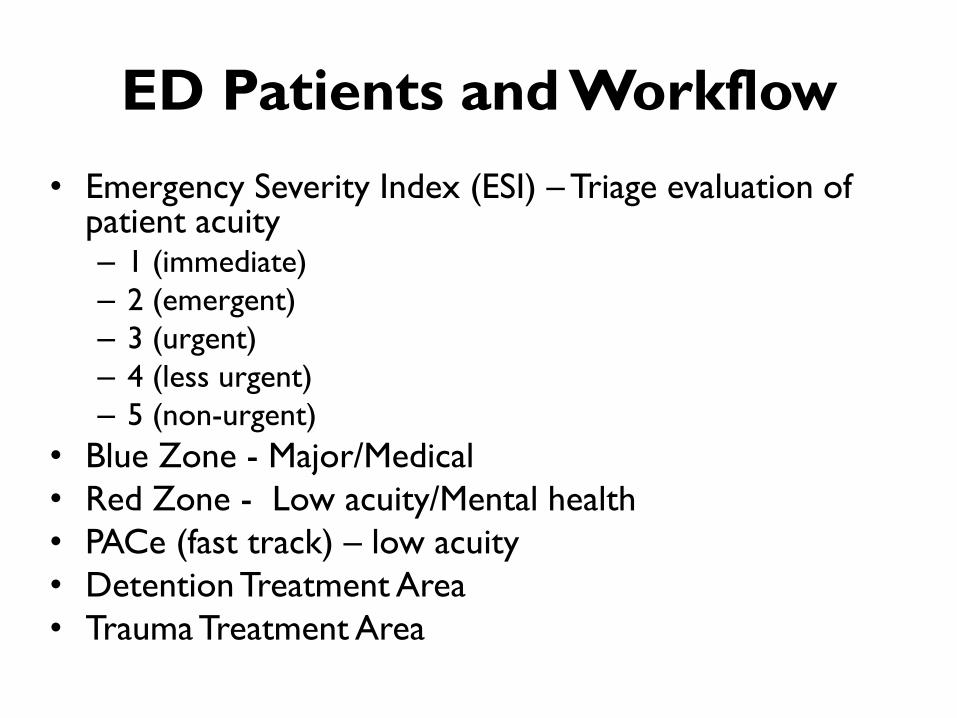
ED Patients and Workflow

• Emergency Severity Index (ESI) – Triage evaluation of patient acuity – 1 (immediate)

– 2 (emergent)

– 3 (urgent)

– 4 (less urgent)

– 5 (non-urgent)

• Blue Zone - Major/Medical

• Red Zone - Low acuity/Mental health

• PACe (fast track) – low acuity

• Detention Treatment Area

• Trauma Treatment Area

Some Definitions

• Length of Stay (LOS): the time when a patient arrives to the ED to the time s/he departs from the ED

• Avoidable Revisit: revisit resulting from an adverse event that occurred during the initial visit or from inappropriate care coordination following discharge – Major burden to US health system

– Over $20 billion in Medicare spending (2005)

• LWBS: Left without being seen – Patient arrived in the ED but left before being seen by

a qualified medical provider

• Region’s Largest Level I Trauma Center

• Nation’s Largest Hospital Based 911 Ambulance Service

• Regional Coordinating Hospital for All Disasters (natural or man-made)

• One of the Nation’s Busiest ERs

• Georgia’s Only Poison Center

• One of the Nation’s Largest Burn Units (only two in the state)

• Georgia Cancer Center for Excellence

• Regional Perinatal Center & Neonatal ICU

• One of the Nation’s Top Infectious Disease Programs

• World Renowned Diabetes & Comprehensive Sickle Cell Centers

• Certified Primary Stroke Center

• Largest Nursing Home in Georgia

• 9 Neighborhood Health Centers

Remarkable Scope of Services

What Sets Grady Apart?

• Bridge collapse at the Atlanta Botanical Gardens

• Olympic Park bombing

• Fulton County courthouse shooting

• Bluffton baseball team bus crash

• International TB scare

• ASA plane crash

• Designated hospital for visiting dignitaries,

including the president of the U.S.

Safety Net Role

Other = 15% Supplies/Drugs .05% Contract labor 1.32% Insurance 2.27% Depreciation/ Amortization 7.00% Additional 4.36%

Grady Annual Revenue &

Expenses 2

2.4

6

21

.96

21

.96

22

.76

21

.46

22

.39

21

.43

21

.13

21

.13

22

.65

21

.53

21

.68

83

.35

83

.51

10

4.8

8

10

5.1

9

82

.63

81

.76

82

.04

78

.58

72

.84

73

.55

75

.26

83

.12

82

.54

76

.82

10

5.2

8

10

2.8

9

10

3.1

7

10

0.0

1

95

.23

95

.01

98

.02

97

.76

97

.69

99

.28

$703$681$666$658

$594$566

$520

$470$474$449

$416$397

$0

$100

$200

$300

$400

$500

$600

1995 1996 1997 1998 1999 2000 2001 2002 2003 2004 2005 2006 Bud

$0

$100

$200

$300

$400

$500

$600

$700

$800

DeKalb Fulton Total Contributions Expenses

• Positive Economic Impact of $1.5 Billion

– $252 million in direct expenditures

– $46 million in local/state tax revenues

– 5,000+ employees

– $238 million in wages and salaries

– 12,435 area jobs created/sustained

Grady’s Annual Economic Impact

Georgia Tech – Grady

Collaboration

• Long history of partnership – Georgia Tech team and Grady leaders have long been working on quality improvement

• In 2008 – Grady signs on to become a leader of the NSF Center for Health Organization Transformation

– Rapid development and test of change

– Patients demand change

– Economy demands change

– US Healthcare behind industry in terms of process improvement and change management

Grady-Georgia Tech

Collaboration Healthcare Delivery Transformation

• Improve ED patient flow

• Reduce LOS – 14 hrs – 2005

– 10.6 hrs – 2008

– 6.97 hrs – 2012

– 7.3 hrs – 2013 (May)

• Reduce LWBS (increase throughput)

• Reduce non-value added activities (reduce waste)

• Reduce/re-direct non-urgent patients

• Analyze/Predict revisit patterns and intervene to improve care

• Reduce revisits (by 25%)

• Improve quality of care and patient satisfaction

Quality, Efficiency, Effectiveness

Benefits to Patients

• Substantial improvements (2008-now):

– reduce LOS -30%

• reduce wait-time -70%

– reduce LWBS -30%

– increase throughput +19%

– reduce non-urgent admissions -32%

• Realized without extra financial investment or labor

• Repurposed existing resource: clinical decision unit

– Reduce revisit -28%

• Helped Grady acquire external sponsorships/donations, permitting

additional ED advances:

– Alternative-care facility opens a new business model

– Expansion of trauma care: 4 beds to 15 beds; increase trauma throughput

(3 fold)

Grady Global ED System

Transformation

0

2

4

6

8

10

12

14

16

Overall Blue Zone Red Zone Trauma Detention PACe Walk-in

Len

gth

of

Serv

ice

Changes in LOS Mar - May 2009

July 2009 - Dec 2010

Jan - Aug 2011

Sep - Dec 2011

2012

Jan - May 2013

0.0%

5.0%

10.0%

15.0%

20.0%

25.0%

1 2 3 4 5

Perc

enta

ge o

f re

visi

ts

Acuity Level

2010 72-hourreturn

2011 72-hourreturn

2012 72-hourreturn

2013 72-hourreturn

2010 30-dayreturn

2011 30-dayreturn

2012 30-dayreturn

2013 30-dayreturn

Blue/Red/Pace: -50%

Trauma: -18%

Detention: -36%

OR Advances

• Optimize within simulation, global system optimization – Non-closed form intractable nonlinear mixed integer program

• Machine learning theory and computation – General N-group classifier, effective for imbalanced data, high-

dimension noise reduction, new complexity theory.

• Integrate machine learning, simulation and optimization into a predictive analytic decision framework

• Big data analytics – Model ED operations and system dynamics

– Model dynamic patient characteristics and treatment patterns

– Model ED revisits: demographics, socio-economic status, clinical information, hospital operations, and disease/ behavioral patterns.

– Model system inter-dependencies (including in-out of ED)

Challenges: Mathematical Theory and Computation

Big

-Da

ta A

naly

tic

Fra

mew

ork

OR-Predictive Analytic

Decision Framework

Methods: Technical Approaches

ED:

Stakeholders’

characteristics

& objectives;

arrival rates;

service pdfs;

workflow;

resources;

decision process;

outside units

Electronic

Medical

Records

Hospital

Historical Data

Machine learning,

predictive

analytics

Establish process

& systems

interdependencies

Procedural and

process

benchmark

Observational

Recommendations

Refine, next

phase

Implement &

document

performance

Simulation-Optimization

Decision Framework

i) Validation

ii) Systems optimization

Synthesize

actionable

recommendations

Prioritize &

Obtain buy-in

Process maps,

Time-motion

Study

Act

ive

En

gage

me

nt

Data Collection and Time-Motion

Study Parameter & Training Data Phase I Aug 2008 – Feb 2009 Phase II Oct 2010 – Dec

2010

Inter-arrival rate poisson (3.48) % by acuity, % by means

of arrival

Service Time

Walk-in registration Triangular (1.13,4.53,14.73) normal (2.332, 3.088)

Walk-in triage 3.55 + 1.18e+003 * beta (1.05, 2.37) 1+expo (4.431)

Ambulance triage normal (6.43, 3.17) 1.12+expo (10.886)

Labs turnaround (hospital data includes

individual service time for labs: CHEM, GAS,

HEME, COAG, UA, Radiology test, Stat X-ray,

Emergent X-ray, CT w/wo Contrast.)

mean: triangular (22.18, 45.23,

136.38)

0.65+expo (71.42)

# of rounds of lab orders

by acuity level

X-ray turnaround mean: uniform (77.29) mean: uniform (61.72)

PA treatment (PACe, Walk-in) 1.4 + expo (6.43) 1.2+exp (6.30)

Zone discharge uniform (3.5, 44.5) normal (8.133, 6.226)

Waiting time for Admittance N/A normal (131.64, 15.72)

Length of stay 10.6 hours 7.59 hours

Percentage of re-visits 5.90%, 20.66% 5.20%, 19.80%

Bed Assignment N/A triangular (4, 7, 10)

Machine Learning for Predicting

Re-visit Patterns (DAMIP) Maximizing total correct classification

Constrain the total percentage of mis-classifications in each group.

• Constrained discriminant rule with a single

reserved judgment region (for multi-stage

analysis)

– First efficient computational model which allows for

classification of any number of groups

– Nonlinear transformation to manage curse-of-

dimensionality

– Allows constraints on misclassification rates

– Provides a reserved judgment region for entities that are

fuzzy

– Allows for objective development of predictive rule (not

over-trained), and continued multi-stage classification

Model Characteristics & Novelty

• Theory

– NP-Complete (for G > 2)

– DAMIP is a universally strongly consistent method for classification

• Solution Characteristics

– The predictive power of a DAMIP rule is independent of sample

size, the proportions of training observations from each group,

and the probability distribution functions of the groups.

– A DAMIP rule is insensitive to the choice of prior probabilities.

– A DAMIP rule is capable of maintaining low misclassification

rates when the number of training observations from each

group varies significantly.

Theoretical Complexity

Quality of Solutions 72-hour return Training Set: 15,000 Blind Prediction Set: 12,534

10-fold Cross Validation

Accuracy Blind Prediction Accuracy

Classification Method Overall Non-

return Return Overall

Non-

return Return

Linear Discriminant

Analysis 96.3% 99.6% 5.5% 96.1% 99.6% 5.3%

Naïve Bayesian 51.6% 50.3% 87.0% 51.7% 50.2% 89.2%

State-of-the-art SVM 96.5% 100.0% 0.0% 96.2% 100.0% 0.0%

Logistic Regression 96.5% 99.8% 5.9% 96.3% 99.8% 8.3%

Classification Tree 96.6% 99.9% 4.4% 96.3% 100.0% 3.0%

Random Forest 96.6% 100.0% 1.5% 96.3% 100.0% 1.9%

Nearest Shrunken

Centroid 62.7% 62.9% 50.0% 48.7% 48.2% 64.7%

DAMIP/PSO 71.1% 71.0% 71.1% 72.2% 72.3% 73.7%

Simulation-Optimization for

Modeling ED Workflow • Large-scale and fast simulator

• Intractable, non-closed form nonlinear mixed integer programming resource allocation

• Fast optimization engine intertwined with simulation

• Incorporate machine learning patient/treatment characteristics

A Simplified ED Model

Tele ICU Floor Isolation Stepdown

Avg 2:56 3:12 2:32 2:12 2:27

Min 0:55 1:20 0:35 1:10 1:00

Max 14:45 7:30 23:15 5:42 10:00

Count 61 34 132 17 36

Du

rati

on

(H

rs)

Admit Type

ED Disposition to Departure (Oct 1-31, 2009)

Systems inter-dependencies

Model Validation

ED Zone

Phase I: Train Aug 2008 – Feb 2009

Validate: Mar – May 2009

Phase II: Train Oct – Dec 2010

Validate: Jan – Mar 2011

Hospital Statistics Simulated Hospital Statistics Simulated

LOS Patient Volume LOS Patient Volume LOS Patient Volume LOS Patient Volume

Overall 10.59 h 8274* 10.49 h 8446 7.97 h 8421 8.02 h 8398

Blue zone 14.54 h 2141 13.90 h 2137 11.40 h 2107 11.78 h 2126

Red zone 12.54 h 2097 11.96 h 2140 8.98 h 2083 8.37 h 2133

Trauma 7.85 h 271 7.98 h 251 6.80 h 268 6.86 h 259

Detention 13.85 h 437 12.93 h 407 10.90 h 441 10.53 h 432

PACe 7.90 h 2037 8.60 h 1983 5.10 h 1920 5.60 h 1983

Walk-in 3.20 h 990 3.30 h 992 2.50 h 950 2.88 h 940

Remainder

patients

*8274-2141-2097-271-437-2037-990 = 301 these patients include those who left before service, transferred to other facility, or no

information provided.

Acuity Level

72-hour return 30-day return

10-fold cross

validation

Blind

prediction

accuracy

10-fold cross

validation

Blind

prediction

accuracy

1: Immediate 0.839 0.827 0.783 0.754

2: Emergent 0.7 0.7 0.797 0.79

3: Urgent 0.701 0.705 0.785 0.785

4: Less urgent 0.711 0.701 0.802 0.8

5: Non-urgent 0.705 0.705 0.77 0.785

None – missing 0.753 0.747 0.898 0.911

Overall 0.71 0.711 0.793 0.787

Payment Type

INSURANCE 0.865 0.859 0.847 0.848

SELF-PAY 0.671 0.673 0.769 0.766

MEDICARE 0.701 0.709 0.775 0.779

MEDICAID 0.661 0.674 0.765 0.767

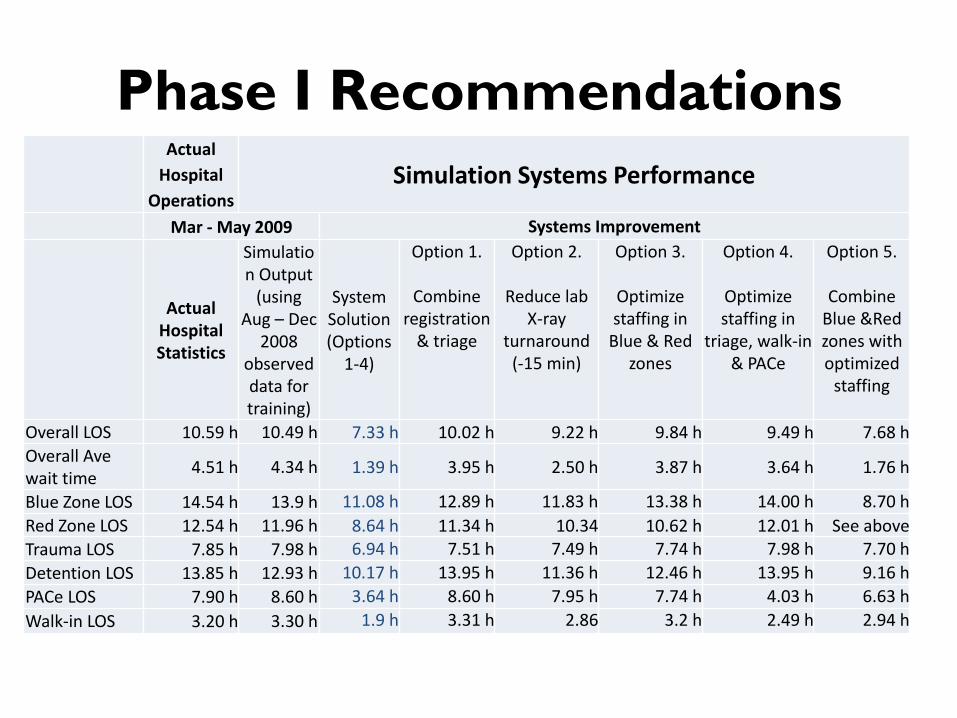
Phase I Recommendations

Actual

Hospital

Operations Simulation Systems Performance

Mar - May 2009 Systems Improvement

Actual Hospital Statistics

Simulation Output

(using Aug – Dec

2008 observed data for training)

System Solution (Options

1-4)

Option 1.

Combine registration

& triage

Option 2.

Reduce lab X-ray

turnaround (-15 min)

Option 3.

Optimize staffing in

Blue & Red zones

Option 4.

Optimize staffing in

triage, walk-in & PACe

Option 5.

Combine Blue &Red zones with optimized

staffing

Overall LOS 10.59 h 10.49 h 7.33 h 10.02 h 9.22 h 9.84 h 9.49 h 7.68 h

Overall Ave wait time

4.51 h 4.34 h 1.39 h 3.95 h 2.50 h 3.87 h 3.64 h 1.76 h

Blue Zone LOS 14.54 h 13.9 h 11.08 h 12.89 h 11.83 h 13.38 h 14.00 h 8.70 h

Red Zone LOS 12.54 h 11.96 h 8.64 h 11.34 h 10.34 10.62 h 12.01 h See above

Trauma LOS 7.85 h 7.98 h 6.94 h 7.51 h 7.49 h 7.74 h 7.98 h 7.70 h

Detention LOS 13.85 h 12.93 h 10.17 h 13.95 h 11.36 h 12.46 h 13.95 h 9.16 h

PACe LOS 7.90 h 8.60 h 3.64 h 8.60 h 7.95 h 7.74 h 4.03 h 6.63 h

Walk-in LOS 3.20 h 3.30 h 1.9 h 3.31 h 2.86 3.2 h 2.49 h 2.94 h

Phase I Implementation Results

* The new trauma center was opened in November, 2011. # A significant number of non-urgent ED patients were redirected to the alternative care facility since August 19, 2011, thus resulting in a significant drop in Walk-in patients.

Option 7: Eliminate batch patients from walk-in to zone or PACe Option 8: Eliminate batch discharges Option 9: Create an observation area clinical decision unit) Option 10: Alternative Care

ED Zone

Phase I: Comparison of ED Performance (Actual Hospital Monthly Statistics)

Original Implementation of Recommendations

Options 1-4, 7, 8 Options 1-4, 7, 8, 9

(clinical decision unit

for observation)

Options 1-4, 7, 8, 9, 10

(redirect non-urgent

visits to alternative

care)

Mar – May 2009 July 2009 – Dec

2010

Jan – Aug 2011 Sep 2011 – Dec 2011

Length of

Stay (l*)

Patient

Volume

Reduct

ion in

LOS

(l – l*)

Patient

Volume

Reduction

in LOS

(l-l*)

Patient

Volume

Reduction

in LOS

(l-l*)

Patient

Volume

Overall 10.59 h 8274 -3.00 h 8315 -2.66 h 8421 -2.29 h 7664

Blue zone 14.54 h 2141 -3.26 h 2525 -3.14 h 2317 -3.22 h 2503

Red zone 12.54 h 2097 -3.78 h 2109 -3.80 h 2230 -3.60 h 2054

Trauma center 7.85 h 271 -1.01 h 252 -1.19 h 283 -1.22 h 402*

Detention 13.85 h 437 -3.12 h 420 -2.95 h 446 -3.01 h 445

PACe 7.90 h 2037 -3.02 h 2104 -3.18 h 2098 -3.60 h 1683

Walk-in 3.20 h 990 -1.0 h 945 -0.85 h 970 -1.2 h 410#

0.0%

5.0%

10.0%

15.0%

20.0%

25.0%

1 2 3 4 5

Pe

rce

nta

ge o

f re

visi

ts

Acuity Level

2010 72-hour return

2011 72-hour return

2010 30-day return

2011 30-day return

Phase II Implementation Results

Actual Hospital

Operations

Aug – Dec 2011

Simulation Systems Performance

Global Strategy:

System

optimization

(resource + layout)

Option 11:

Optimize worker

allocation

Option 12: Combine

Blue and Red zones

Overall 8.30 h 6.79 h (-1.51 h) 7.21 h (-1.09 h) 6.94 h (-1.36 h)

Blue zone 11.32 h 6.24 h (-5.08 h) 6.66 h (-4.66 h) 6.61 h (-4.71 h)

Red zone 8.94 h 6.24 h (-2.70 h) 6.19 h (-2.75 h) 6.61 h (-2.33 h)

Trauma center 6.63 h 6.46 h (-0.17 h) 6.16 h (-0.47 h) 6.47 h (-0.16 h)

ED Zone

Phase II: Comparison of ED Performance (Actual Hospital Monthly Statistics)

Original (from Phase I

improvement) Implementation of Recommendations

Option 11 (optimizing overall ED staffing)

Sep 2011 – Dec 2011 2012 Jan – May 2013

Length of Stay (l**) Reduction in LOS (l - l**) Reduction in LOS (l-l**)

Overall 8.30 h -0.90 h -0.93 h

Blue zone 11.32 h -3.95 h -4.00 h

Red zone 8.94 h -2.70 h -2.52 h

Trauma center 6.64 h -0.35 h -0.20 h

0.0%

5.0%

10.0%

15.0%

20.0%

25.0%

1 2 3 4 5

Pe

rce

nta

ge o

f re

visi

ts

Acuity Level

2011 72-hour return

2012 72-hour return

2011 30-day return

2012 30-day return

Grady Global ED System

Transformation

0

2

4

6

8

10

12

14

16

Overall Blue Zone Red Zone Trauma Detention PACe Walk-in

Len

gth

of

Serv

ice

Changes in LOS Mar - May 2009

July 2009 - Dec 2010

Jan - Aug 2011

Sep - Dec 2011

2012

Jan - May 2013

0.0%

5.0%

10.0%

15.0%

20.0%

25.0%

1 2 3 4 5

Perc

enta

ge o

f re

visi

ts

Acuity Level

2010 72-hourreturn

2011 72-hourreturn

2012 72-hourreturn

2013 72-hourreturn

2010 30-dayreturn

2011 30-dayreturn

2012 30-dayreturn

2013 30-dayreturn

Blue/Red/PACe: -50%

Trauma: -18%

Detention: -36%

Significant Benefits

• Quality of care: – Reduce LOS (-30%), reduce wait-time (-70%)

– Reduce revisits (-28%)

– Reduce LWBS (-30%)

– Timeliness of care: saving lives (trauma/blue patients)

• Efficiency and effectiveness: – Increase ED throughput (+19%)

– Reduce/redirect non-urgent patients (-32%)

• New business for alternative care

• Expand trauma care – Increased throughput

– 90 minute reduction in treatment time (saving lives)

• Sustained improvement

Realized Annual Financial

Implication • Increase throughput

– ~$41.8 million

• Reduce revisits – ~$7.5 million (plus much more from reduced side-effects)

• New business (non-urgent alternative care): – ~$4.6 million

• Expansion in trauma care – ~$9.1 million

• Timeliness of care – Reduction in disability and improved outcomes

• Tens/hundreds of millions of dollars for trauma patients and critical care/stroke patients.

How to Make it Work?

• Challenges – Over 1,100 physicians on active medical staff from Emory &

Morehouse

– Over 800 residents/fellows trained annually

– Over 300 medical students educated at Grady annually

– Very diverse teams of providers and leaders

– “The only constant is change”

• Driving force to change – Safety net – strong desire to improve patient care, regardless of $,

maintain commitment to the underserved

– Survival and needs (hospital and patients)

– Financial hardship – reduced reimbursement, increased penalties

– Premier public hospital in the US

• Culture of change – Continuous change and demand alignment

• Strong appreciation of mathematics, OR and analytics

Continued Challenges • Growing demand (w/o Healthcare Bill)

• Facility layout re-design

• Strategic planning

• Regulatory compliance

• Superutilizers – Top 20 utilizers of the ED on a monthly basis

• Up to 33 visits in a 30 day month

– Case management

– Mental health treatment

0

2000

4000

6000

8000

10000

12000

Jan Feb March April May June July August

2011

2012

2013

OR Advances

• Optimize within simulation, global system optimization – Non-closed form intractable nonlinear mixed integer program

• Machine learning theory and computation – General N-group classifier, effective for imbalanced data, high-

dimension noise reduction, new complexity theory.

• Integrate machine learning, simulation and optimization into a predictive analytic decision framework

• Big data analytics – Model ED operations and system dynamics

– Model dynamic patient characteristics and treatment patterns

– Model ED revisits: demographics, socio-economic status, clinical information, hospital operations, and disease/ behavioral patterns.

– Model system inter-dependencies (including in-out of ED)

Challenges: Mathematical Theory and Computation

Values Added

• Can be used for other hospital units and

environment: ICU, OR, hospital acquired

condition, surgical site infection, etc. All are

active projects now with exciting results!!

• Have been applied to other ED sites with

successes

• Generalizable technology, beyond healthcare

The Team

Grady Health System • Hany Atallah, MD, Chief of Emergency

Medicine

• Leon L. Haley, MD, Executive Associate

Dean, Emory University

• Daniel Wu, MD, CMIO

• Michael Wright, former SVP operations

• Michelle Wallace, Exec Dir ED & Trauma

• Ellie Post, former SVP ED

• Calvin Thomas, former SVP operations

• Deborah Western

• Mr Manuel

• Ms Nadia

• Jill Cuestas

• All the nurses, and providers

Georgia Tech

• Eva K Lee

• Fan Yuan

• Ruilin Zhou

• Saloua Lablou

Time-motion study:

• Colby Allen, Cory Girard, Doug

Meagh, Jeff Phillips, Amanda

Widmaier, Hanzhen Zhang

Thank you


Recommended