An-Najah National University Faculty of Graduate Studies Modeling and Simulation of Lead- Acid Storage Batteries within Photovoltaic Power Systems By Ola Subhi Waheed Al-Qasem Supervisor Prof. Marwan Mahmoud This thesis is submitted in Partial Fulfillment of the Requirements for the Degree of Master in Clean Energy and Energy Conservation Strategy Engineering, Faculty of Graduate Studies, at An-Najah National University, Nablus, Palestine 2012
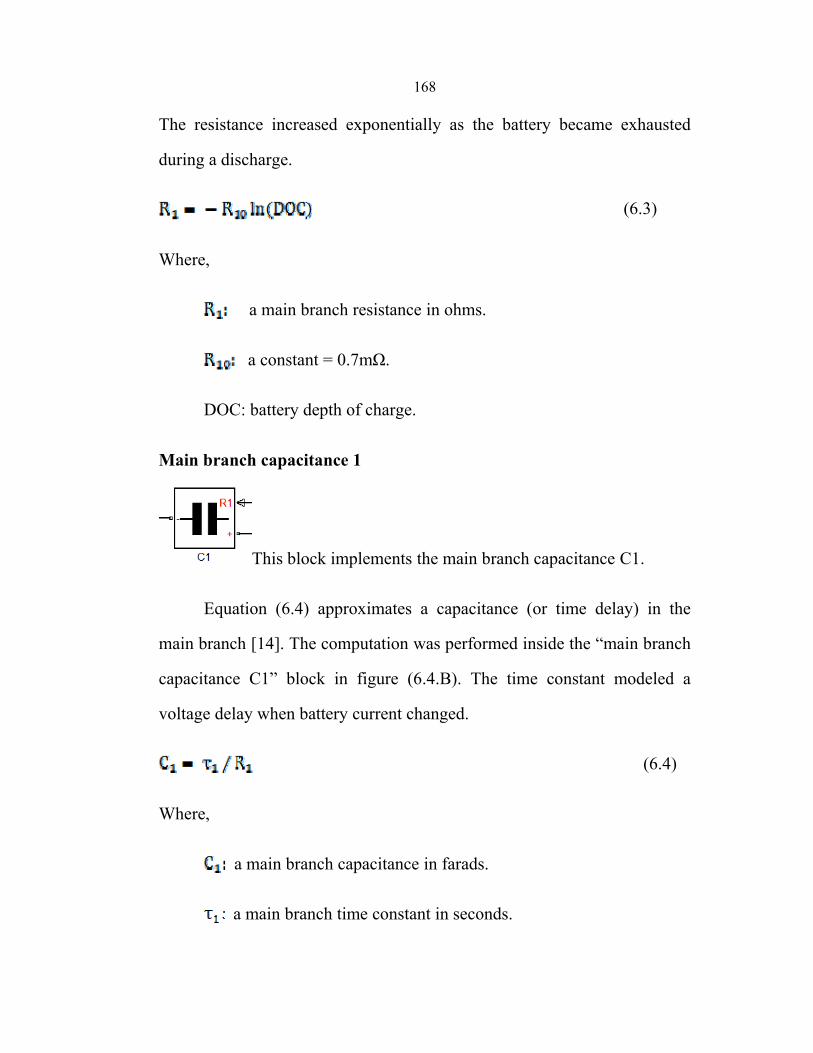
Transcript
An-Najah National University Faculty of Graduate Studies
Modeling and Simulation of Lead-Acid Storage Batteries within Photovoltaic Power Systems
By Ola Subhi Waheed Al-Qasem
Supervisor Prof. Marwan Mahmoud
This thesis is submitted in Partial Fulfillment of the Requirements for the Degree of Master in Clean Energy and Energy Conservation Strategy Engineering, Faculty of Graduate Studies, at An-Najah National University, Nablus, Palestine
2012
iii
Dedication
I would like to dedicate my thesis work to
My father, mother, brothers and sisters……
All friends and colleagues…
Everyone who works in this field……
iv
Acknowledgment
I would like to thank my family for constant love and
support that have always given me.
Thanks go also to all my friends and fellow graduate
Students.
My thanks and appreciations go to the staff of Clean Energy
and Conservation Strategy Engineering Master Program at An-
Najah National University
Finally, and most importantly, my furthermost appreciation
goes to my supervisor, Prof. Dr. Marwan Mahmoud for his
exceptional guidance and insightful comments and observations
throughout the duration of this project.
Ola
v
إلقرارا
:الرسالة التي تحمل العنوان ةأدناه، مقدم ةأنا الموقع
Modeling and Simulation of Lead-Acid Storage Batteries within Photovoltaic Power Systems
الشمسيةالحامض ضمن أنظمة الخاليا –نمذجة ومحاكاة بطاريات الرصاص
تاج جهدي الخاص، باستثناء مـا تمـت أقر بأن ما اشتملت عليه هذه الرسالة إنما هو ن
اإلشارة إليه حيثما ورد، وأن هذه الرسالة كاملة، أو أي جزء منها لم يقدم من قبل لنيل أي درجة
.أو لقب علمي أو بحثي لدى أي مؤسسة تعليمية أو بحثية أخرى
Declaration
The work provided in this thesis, unless otherwise referenced, is the
researcher's own work, and has not been submitted elsewhere for any other
degree or qualification.
:Student's Name :ةاسم الطالب
:Signature :التوقيع
:Date :التاريخ
vi
List of Abbreviations Ah Ampere hour Wh Watt hour C Capacity AhC Ampere hour capacity WhC Watt hour capacity SOC State of charge DOD Depth of discharge VOC Open circuit voltage
Ampere hour efficiency
Watt hour efficiency SLI Starting, Lighting and IgnitionVRLA Valve - Regulation Lead Acid
vii
Table of Contents No. Contents Page
Dedication iii Acknowledgment iv Declaration v List of Abbreviations vi Table of Contents vii List of Tables x List of Figures xi Abstract xvi Chapter One: Introduction and Literature Review 1 1.1 Introduction 2 1.2 Literature Review 3 Chapter Two: Rechargeable battery 21 2.1 Rechargeable Battery Cells 222.2 Battery History 22 2.2.1 Early works 23 2.2.2 Development of Lead Acid batteries 242.2.3 Development of Nickel–Cadmium 26 2.2.4 Recent developments 27 2.3 Types and Characteristics of Secondary Batteries 28 2.3.1 Lead-Acid batteries 29 2.3.2 Alkaline secondary batteries 31
2.4 Why we Need Batteries Getting Unplugged: Portable Energy and Long-Term Energy Storage 35
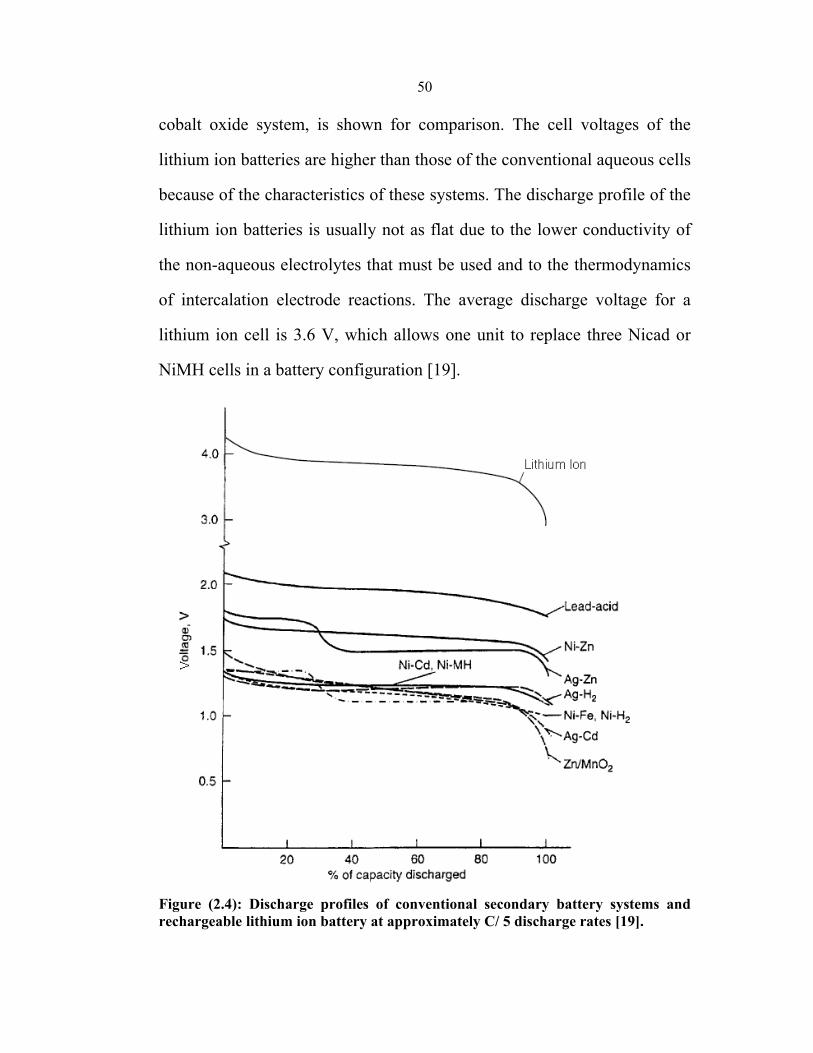
2.5 The Many Uses of Batteries 36 2.6 Battery Performance 39 2.6.1 Potential or voltage 39 2.6.2 Current 40 2.6.3 Resistance 402.6.4 Capacity 41 2.6.5 Power 42 2.6.6 Energy 422.7 General Battery Concepts 43 2.7.1 Batteries cells 43 2.7.2 Cell and battery voltage 44 2.7.3 Cell and battery capacity 44 2.7.4 Connecting cells to form a battery: series or parallel 45 2.7.5 Cell components 46 2.8 Voltage and Discharge Profiles 49 2.9 Effect of Discharge Rate on Performance 51
viiiNo. Contents Page
2.10 Effect of Temperature 52 2.11 Charge Retention (Self-Discharge) 53 2.12 Life 54 2.13 Charge Characteristics 56 2.14 Cost 58
2.15 General Information for Selection of Batteries for Photovoltaic Systems 59
2.16 Key Elements in Battery Selection 60 Chapter Three: Lead Acid Battery 65 3.1 General Characteristics of Electrolyte Lead Acid Battery 66 3.2 Lead Acid Chemistry 68 3.3 Open-Circuit Voltage Characteristics 713.4 Self-Discharge 73 3.5 Discharge Characteristics 74 3.5.1 Discharge types 74 3.5.1.1 High-rate discharges 75 3.5.1.2 Medium-rate discharges 75 3.5.1.3 Low-rate discharges 75 3.6 Measures of Discharge Performance 76 3.7 Battery Voltage – General Overview 77 3.7.1 Mid-point Voltage 78 3.7.2 Battery discharge voltage as a function of discharge rate 79 3.8 Charging and Charging Equipment 803.8.1 General considerations 80 3.8.2 Methods of charging lead-acid batteries 82 3.8.2.1 Constant-current charging 83 3.8.2.2 Constant-potential charging 85 3.8.2.3 Taper charging 87 3.8.2.4 Pulse charging 88 3.8.2.5 Trickle charging 90 3.8.2.6 Float charging 90 3.8.2.7 Rapid charging 90 3.9 Maximum Battery Subsystem Voltage 91 3.10 Selection of Charge Current 92
3.11 Effect of Specific Gravity of Electrolyte and Operating Temperature 93
Chapter Six: Lead Acid Battery Equivalent Circuit Model 161
6.1 Introduction 162 6.2 Battery Model 162 6.2.1 Battery model structure 163 6.3 Battery Simulink 182 Chapter Seven: Conclusions and Recommendations 187 7.1 Conclusions 188 7.2 Recommendations 189 References 190 ب الملخص
x
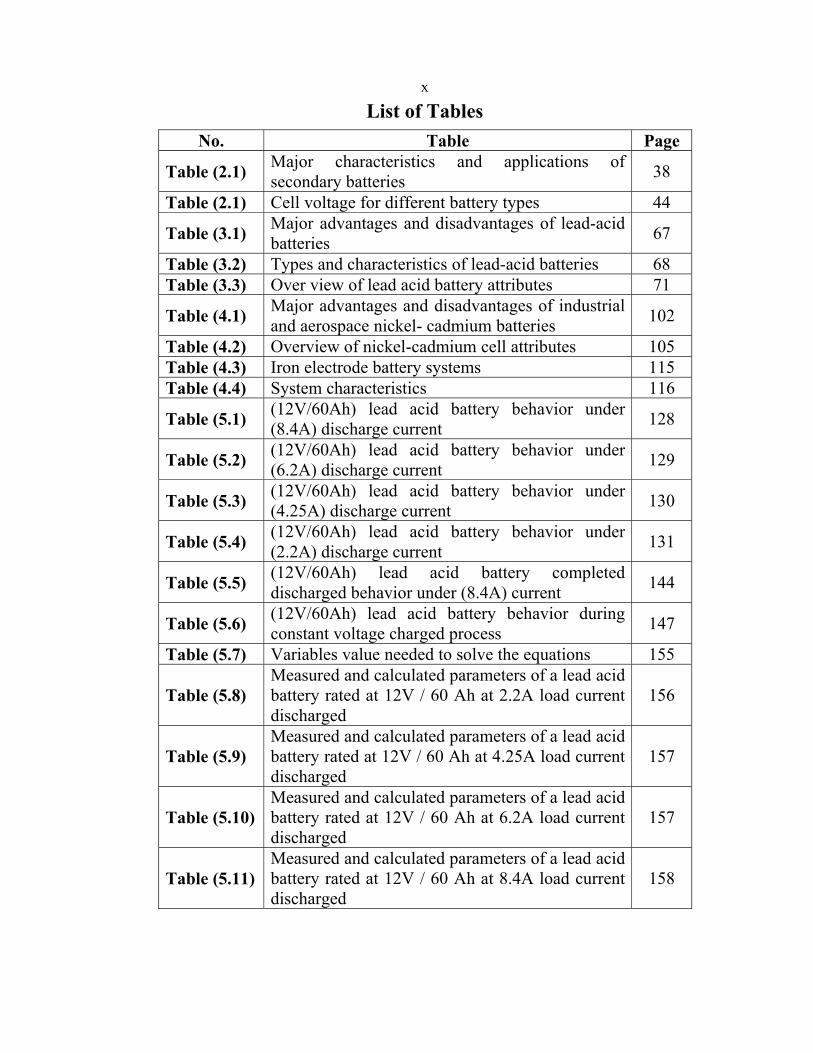
List of Tables No. Table Page
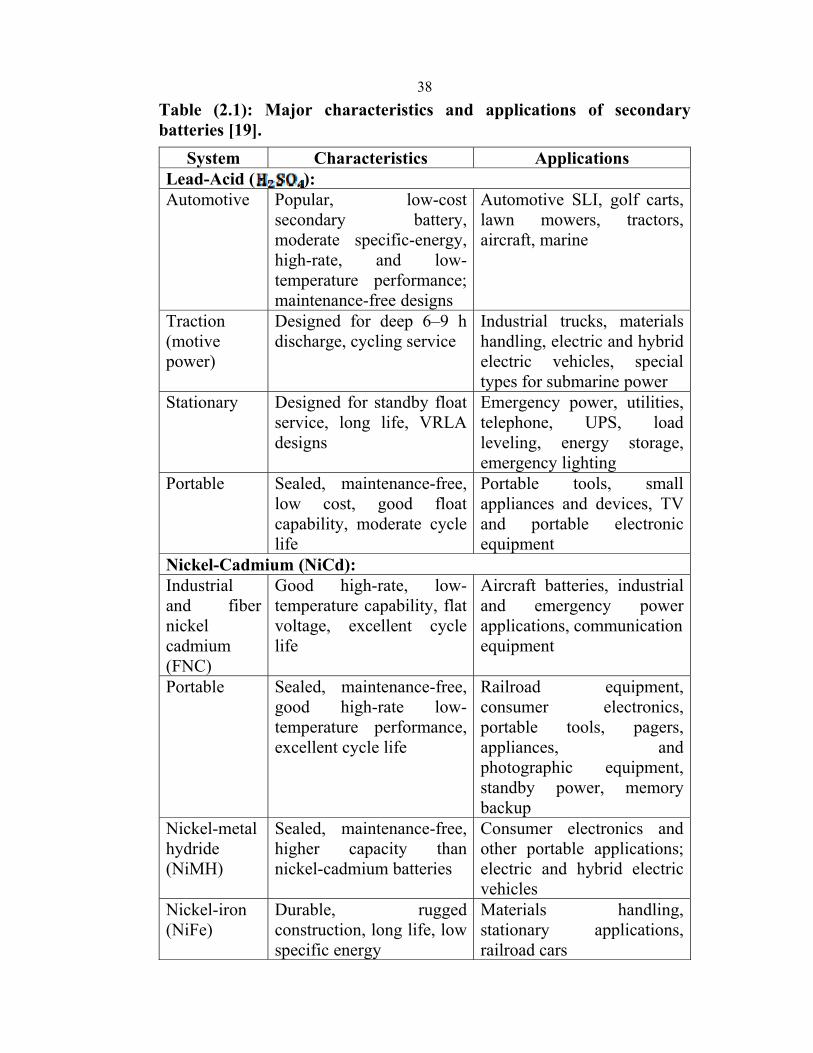
Table (2.1) Major characteristics and applications of secondary batteries 38
Table (2.1) Cell voltage for different battery types 44
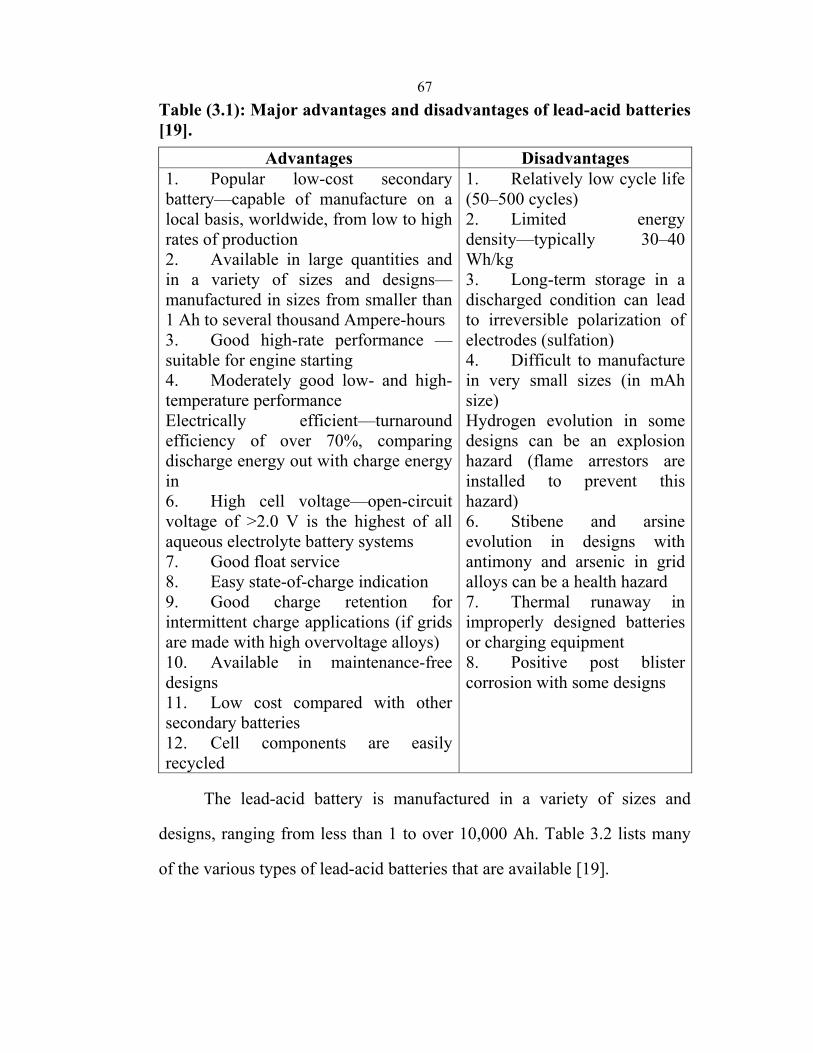
Table (3.1) Major advantages and disadvantages of lead-acid batteries 67
Table (3.2) Types and characteristics of lead-acid batteries 68 Table (3.3) Over view of lead acid battery attributes 71
Table (4.1) Major advantages and disadvantages of industrial and aerospace nickel- cadmium batteries 102
Table (4.2) Overview of nickel-cadmium cell attributes 105 Table (4.3) Iron electrode battery systems 115 Table (4.4) System characteristics 116
Table (5.1) (12V/60Ah) lead acid battery behavior under (8.4A) discharge current 128
Table (5.2) (12V/60Ah) lead acid battery behavior under (6.2A) discharge current 129
Table (5.3) (12V/60Ah) lead acid battery behavior under (4.25A) discharge current 130
Table (5.4) (12V/60Ah) lead acid battery behavior under (2.2A) discharge current 131
Table (5.5) (12V/60Ah) lead acid battery completed discharged behavior under (8.4A) current 144
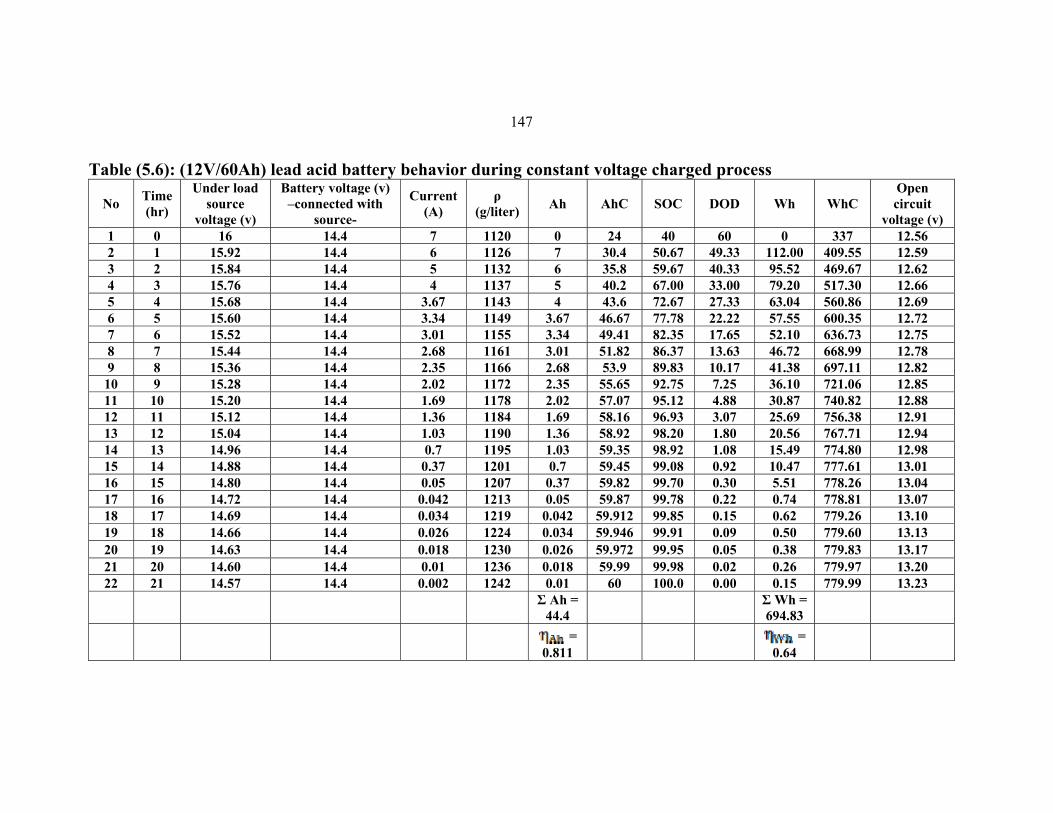
Table (5.6) (12V/60Ah) lead acid battery behavior during constant voltage charged process 147
Table (5.7) Variables value needed to solve the equations 155
Table (5.8) Measured and calculated parameters of a lead acid battery rated at 12V / 60 Ah at 2.2A load current discharged
156
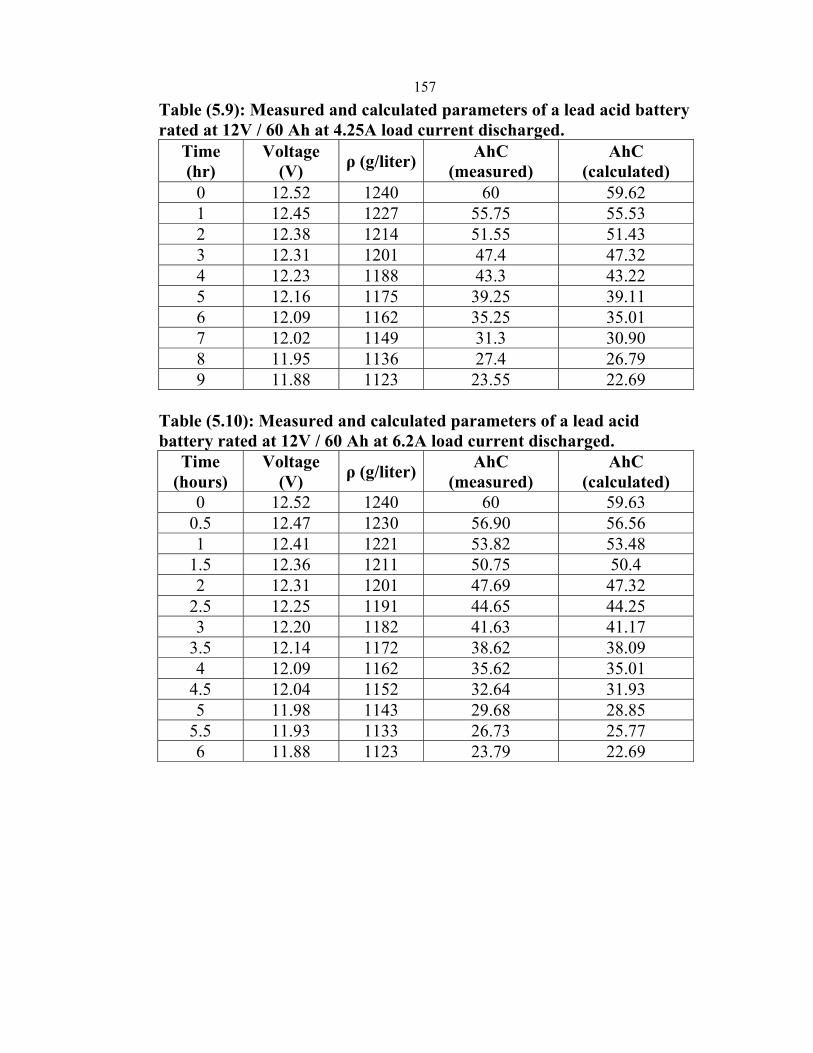
Table (5.9) Measured and calculated parameters of a lead acid battery rated at 12V / 60 Ah at 4.25A load current discharged
157
Table (5.10) Measured and calculated parameters of a lead acid battery rated at 12V / 60 Ah at 6.2A load current discharged
157
Table (5.11) Measured and calculated parameters of a lead acid battery rated at 12V / 60 Ah at 8.4A load current discharged
158
xi
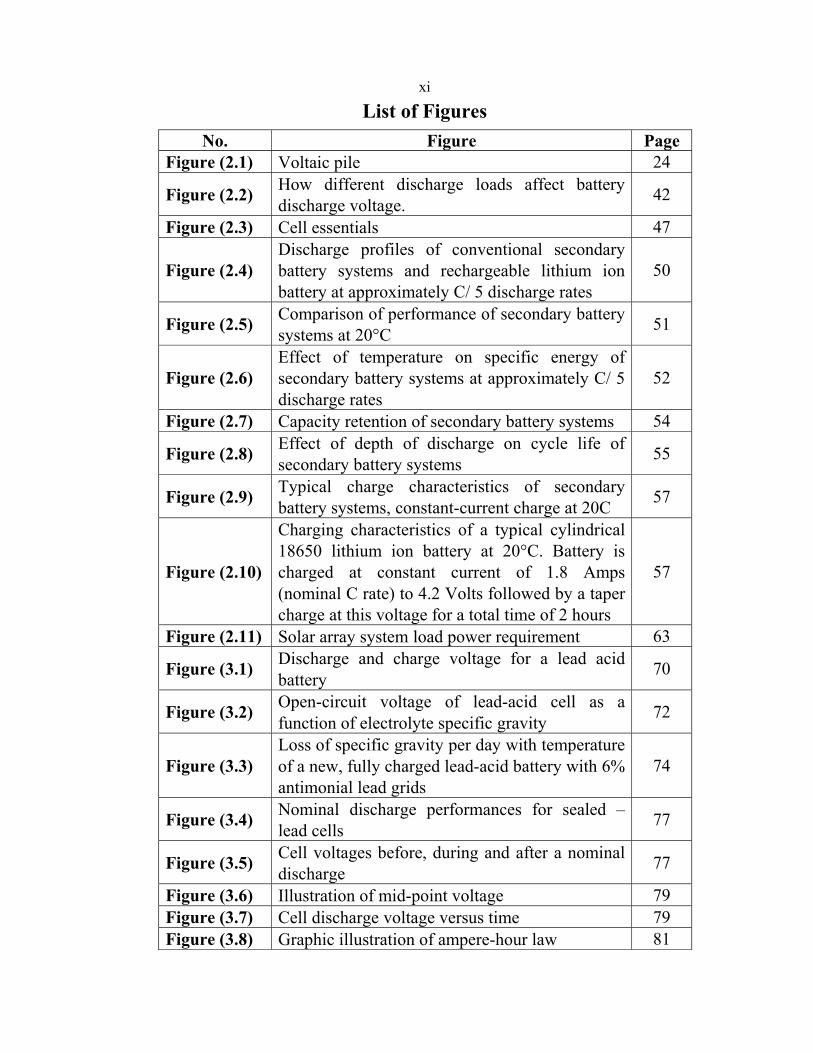
List of Figures No. Figure Page
Figure (2.1) Voltaic pile 24
Figure (2.2) How different discharge loads affect battery discharge voltage. 42
Figure (2.3) Cell essentials 47
Figure (2.4) Discharge profiles of conventional secondary battery systems and rechargeable lithium ion battery at approximately C/ 5 discharge rates
50
Figure (2.5) Comparison of performance of secondary battery systems at 20°C 51
Figure (2.6) Effect of temperature on specific energy of secondary battery systems at approximately C/ 5 discharge rates
52
Figure (2.7) Capacity retention of secondary battery systems 54
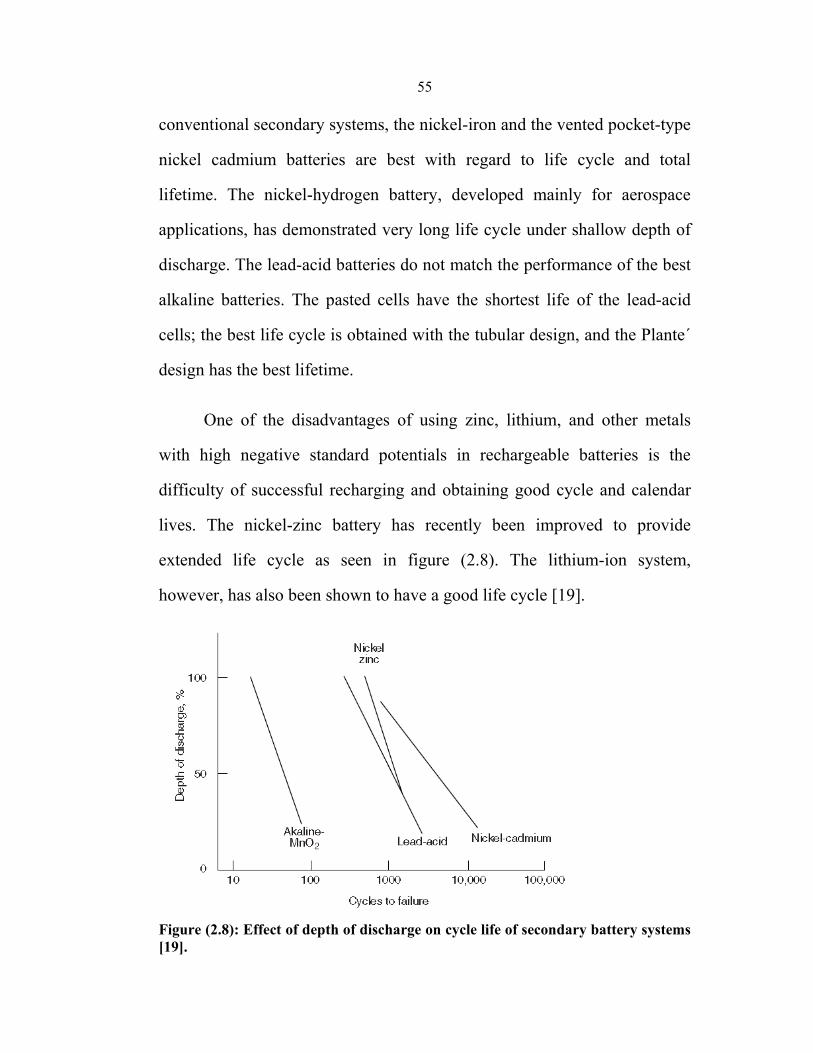
Figure (2.8) Effect of depth of discharge on cycle life of secondary battery systems 55
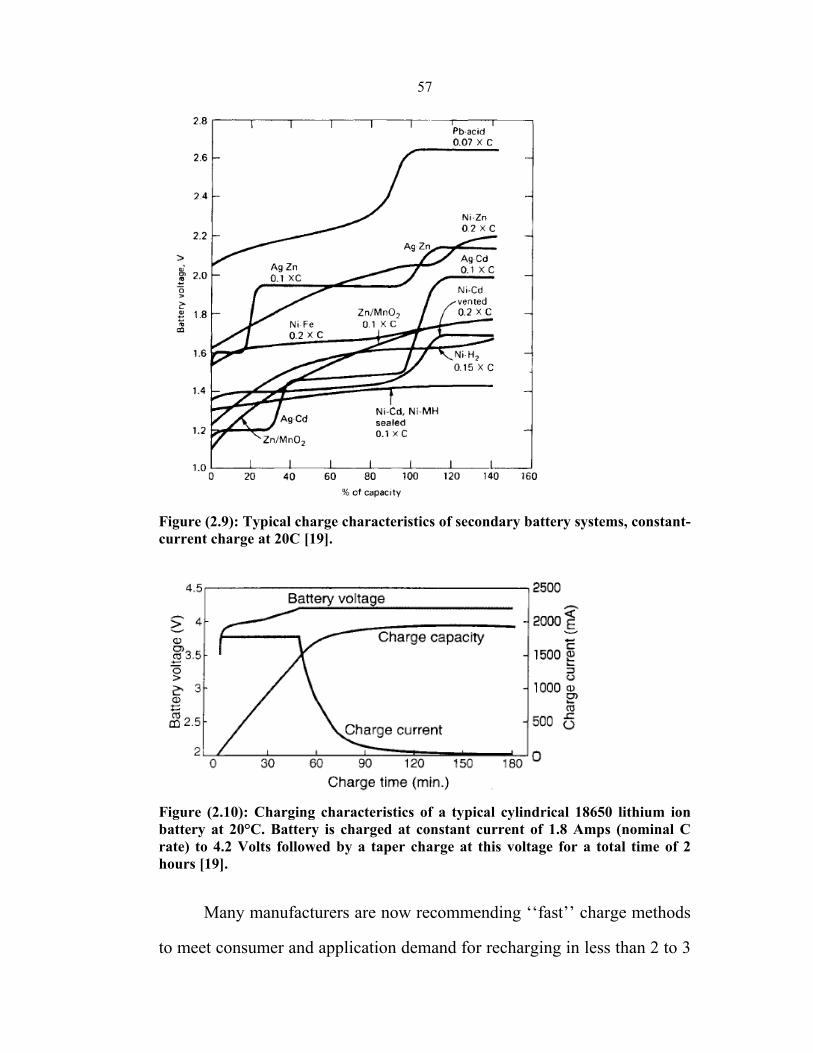
Figure (2.9) Typical charge characteristics of secondary battery systems, constant-current charge at 20C 57
Figure (2.10)
Charging characteristics of a typical cylindrical 18650 lithium ion battery at 20°C. Battery is charged at constant current of 1.8 Amps (nominal C rate) to 4.2 Volts followed by a taper charge at this voltage for a total time of 2 hours
57
Figure (2.11) Solar array system load power requirement 63
Figure (3.1) Discharge and charge voltage for a lead acid battery 70
Figure (3.2) Open-circuit voltage of lead-acid cell as a function of electrolyte specific gravity 72
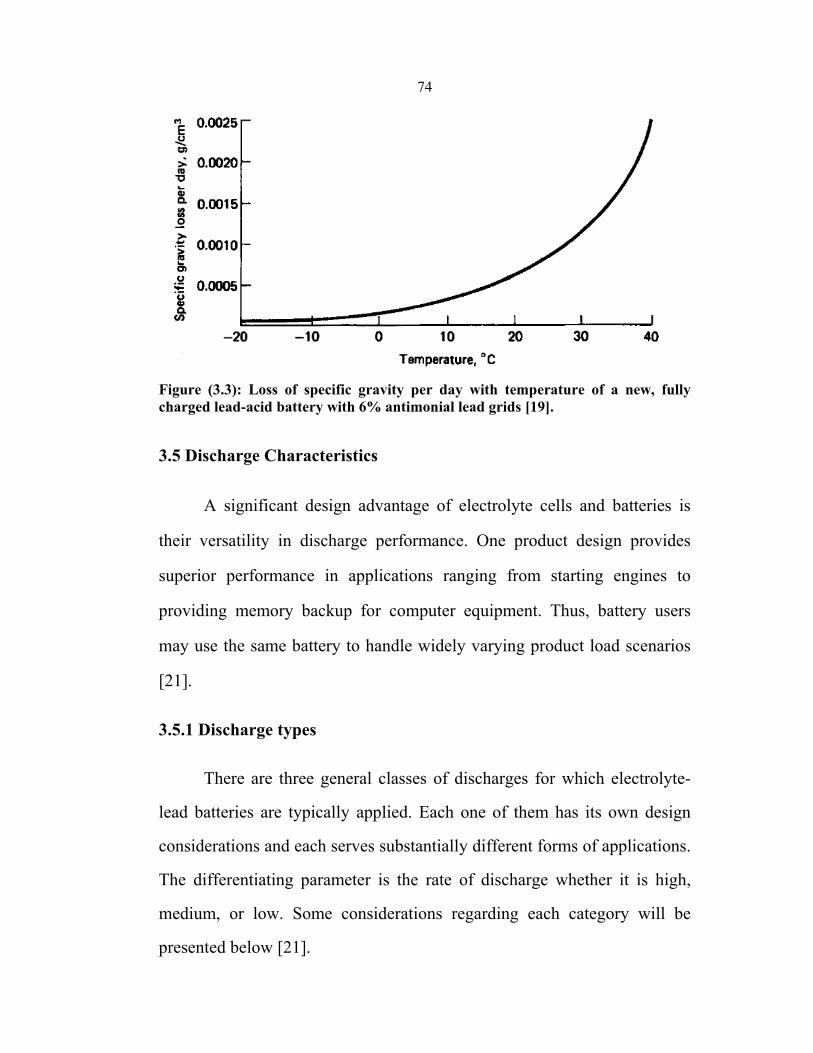
Figure (3.3) Loss of specific gravity per day with temperature of a new, fully charged lead-acid battery with 6% antimonial lead grids
74
Figure (3.4) Nominal discharge performances for sealed – lead cells 77
Figure (3.5) Cell voltages before, during and after a nominal discharge 77
Figure (3.6) Illustration of mid-point voltage 79 Figure (3.7) Cell discharge voltage versus time 79 Figure (3.8) Graphic illustration of ampere-hour law 81
xiiNo. Figure Page
Figure (3.9)
Typical charger and battery characteristics for constant-current charging of lead-acid batteries. (a) Single-step constant-current charging. (b) Two-step constant-current charging
84
Figure (3.10)
Typical charger and battery characteristics for constant-potential charging of lead-acid batteries. (a) Constant-potential charging. (b) Modified constant-potential charging
86
Figure (3.11) Typical charger and battery characteristics for taper charging of lead-acid batteries. (a) Single-step taper charge. (b) Two-step taper charge
88
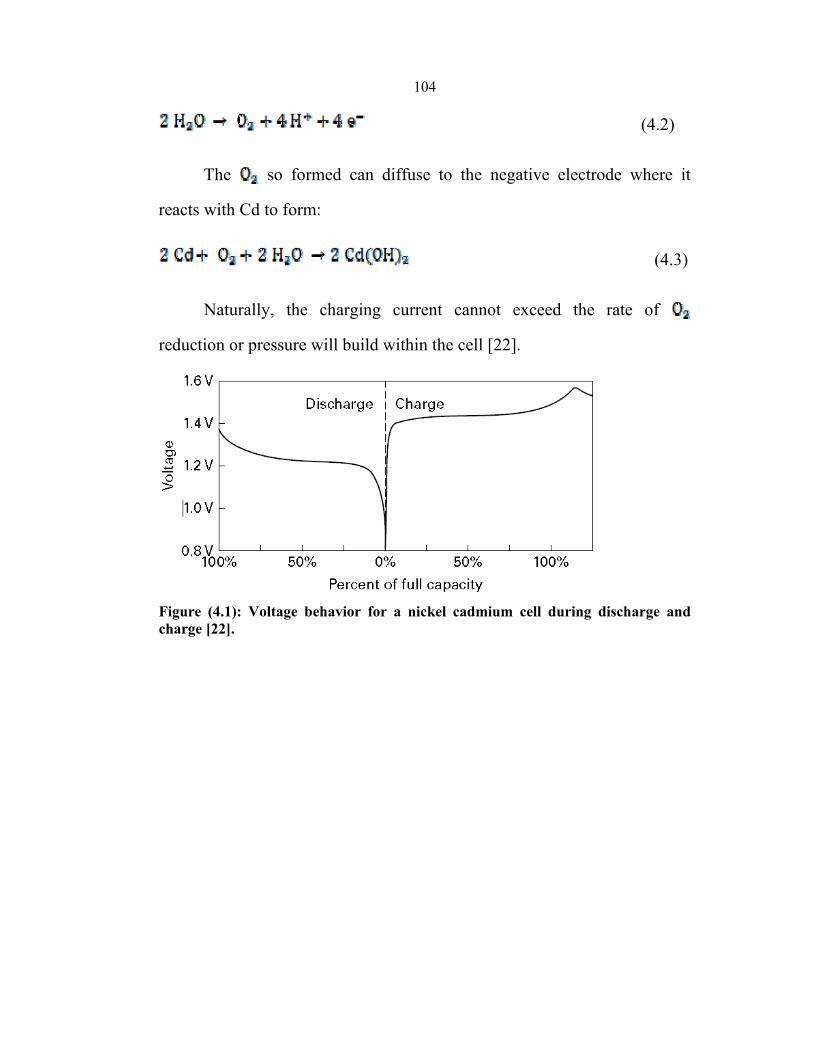
Figure (4.1) Voltage behavior for a nickel cadmium cell during discharge and charge 104
Figure (4.2) Nickel-cadmium cell discharge curve constant current 106
Figure (4.3)
Charge and discharge characteristics of nickel-cadmium batteries at 25ºC. (a) Pocket plate battery, high rate. (b) Plastic-bonded plate battery, high rate
108
Figure (4.4) Charge retention of pocket plate batteries at 25ºC. [19] 109
Figure (4.5) Constant current charge of pocket plate nickel – cadmium cell at 20A/100Ah, 25ºC. 111
Figure (4.6) Charge acceptance of a sealed Cell at 0.1 C and 23ºC 112
Figure (4.7) Discharge-charge curve of an iron electrode 118
Figure (4.8) Typical voltage characteristics during constant-rate discharge and recharge 119
Figure (4.9) Curves of capacity vs. discharge rate at 25ºC; end voltage 1.0 V per cell 120
Figure (4.10) Effect of decreasing rate on battery voltage of nickel-iron cell 120
Figure (4.11) Time-voltage discharge curves of nickel-iron battery; end voltage 1.0 V per cell 121
Figure (4.12) Typical charging voltage for nickel-iron battery at various rates 123
Figure (4.13) Voltage variation with temperature 124
Figure (4.14) Effects of ‘‘regulators’’ with voltage and current regulation 124
xiiiNo. Figure Page
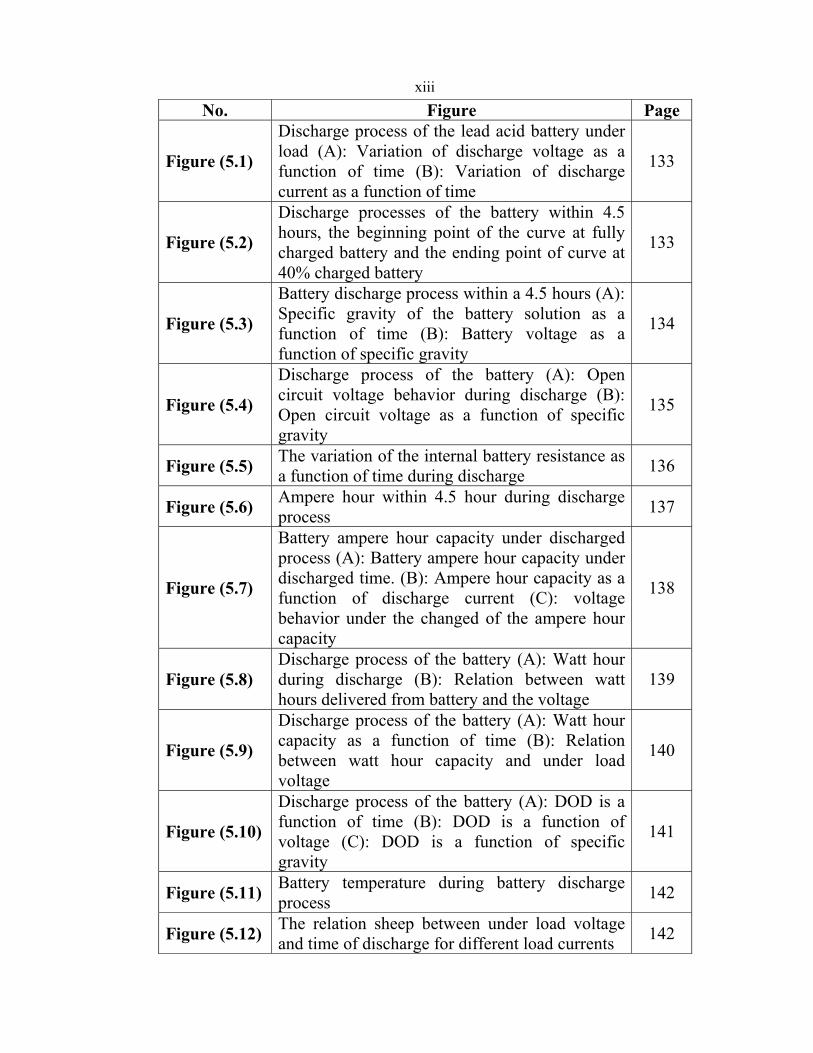
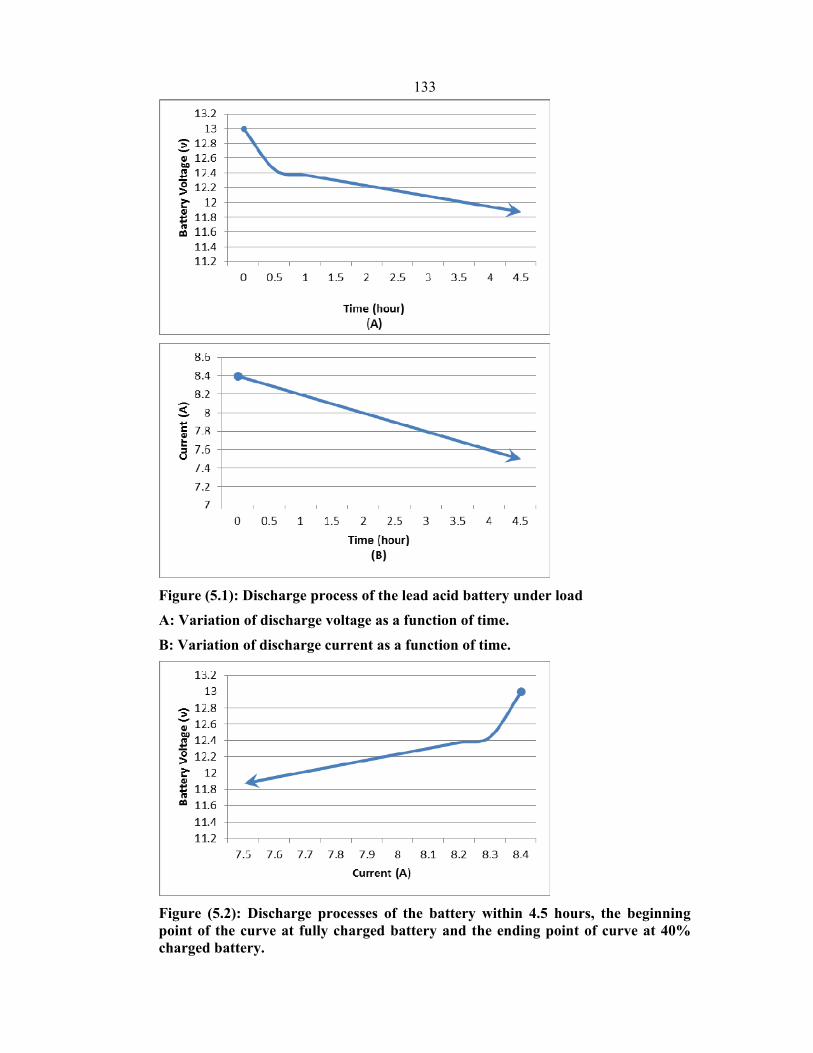
Figure (5.1)
Discharge process of the lead acid battery under load (A): Variation of discharge voltage as a function of time (B): Variation of discharge current as a function of time
133
Figure (5.2)
Discharge processes of the battery within 4.5 hours, the beginning point of the curve at fully charged battery and the ending point of curve at 40% charged battery
133
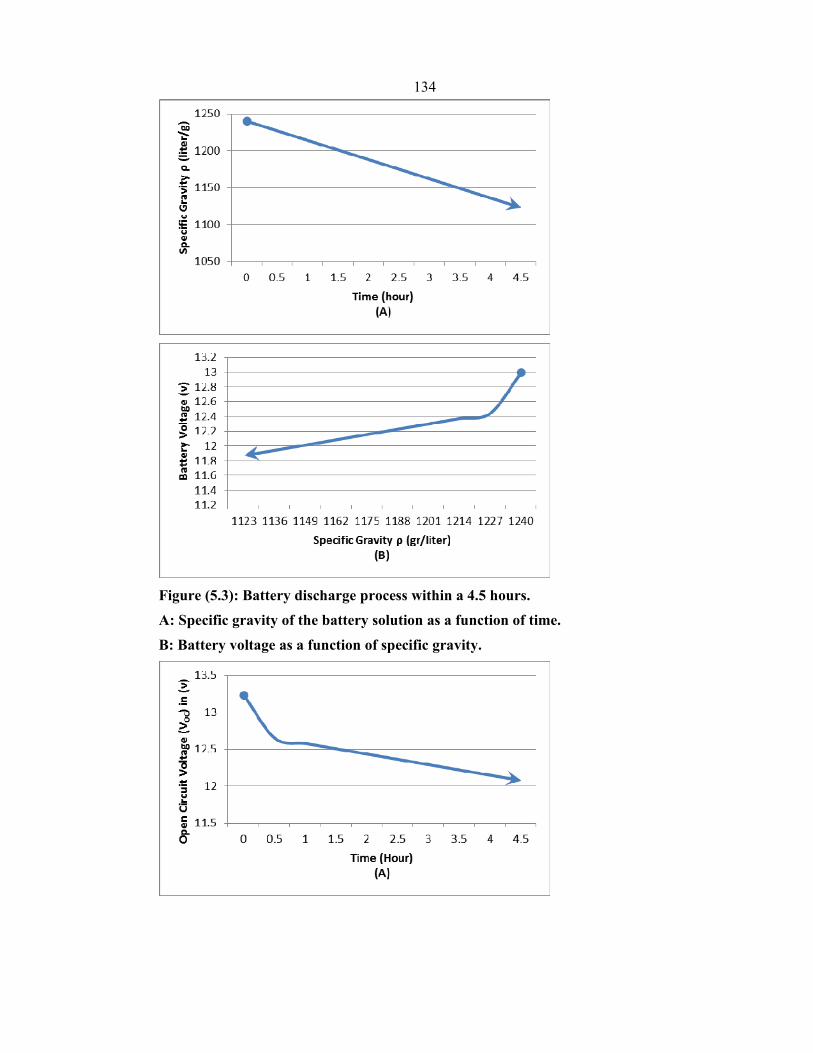
Figure (5.3)
Battery discharge process within a 4.5 hours (A): Specific gravity of the battery solution as a function of time (B): Battery voltage as a function of specific gravity
134
Figure (5.4)
Discharge process of the battery (A): Open circuit voltage behavior during discharge (B): Open circuit voltage as a function of specific gravity
135
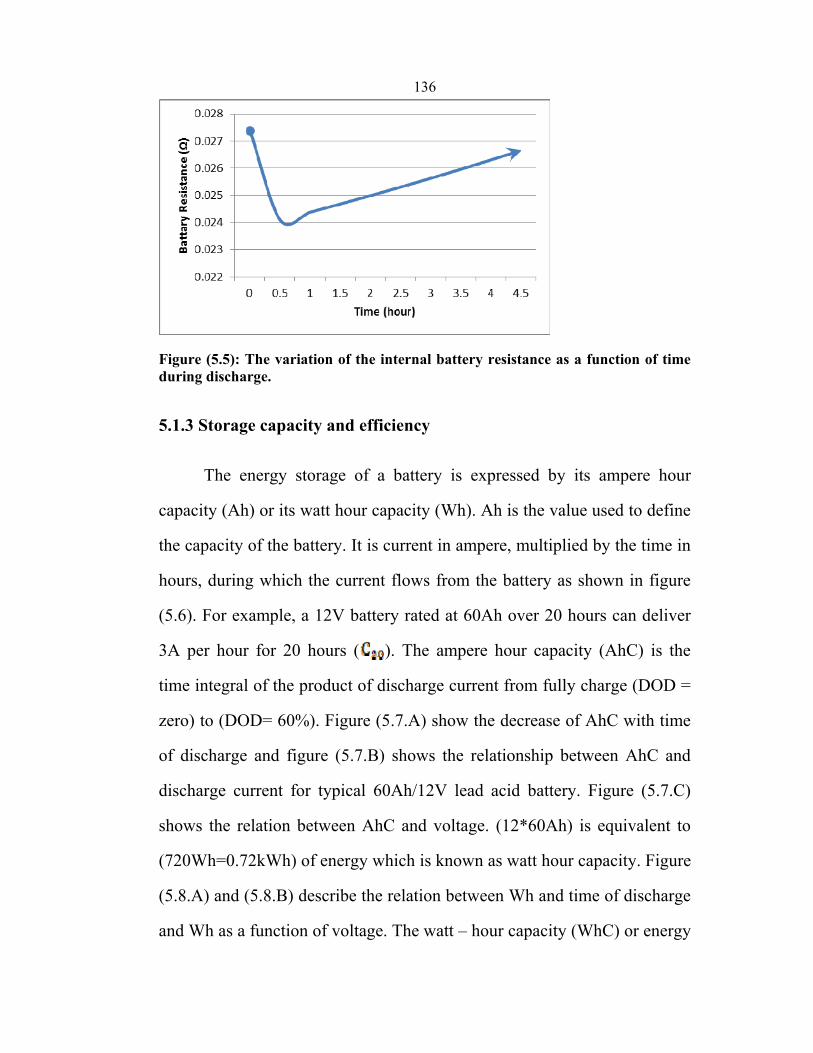
Figure (5.5) The variation of the internal battery resistance as a function of time during discharge 136
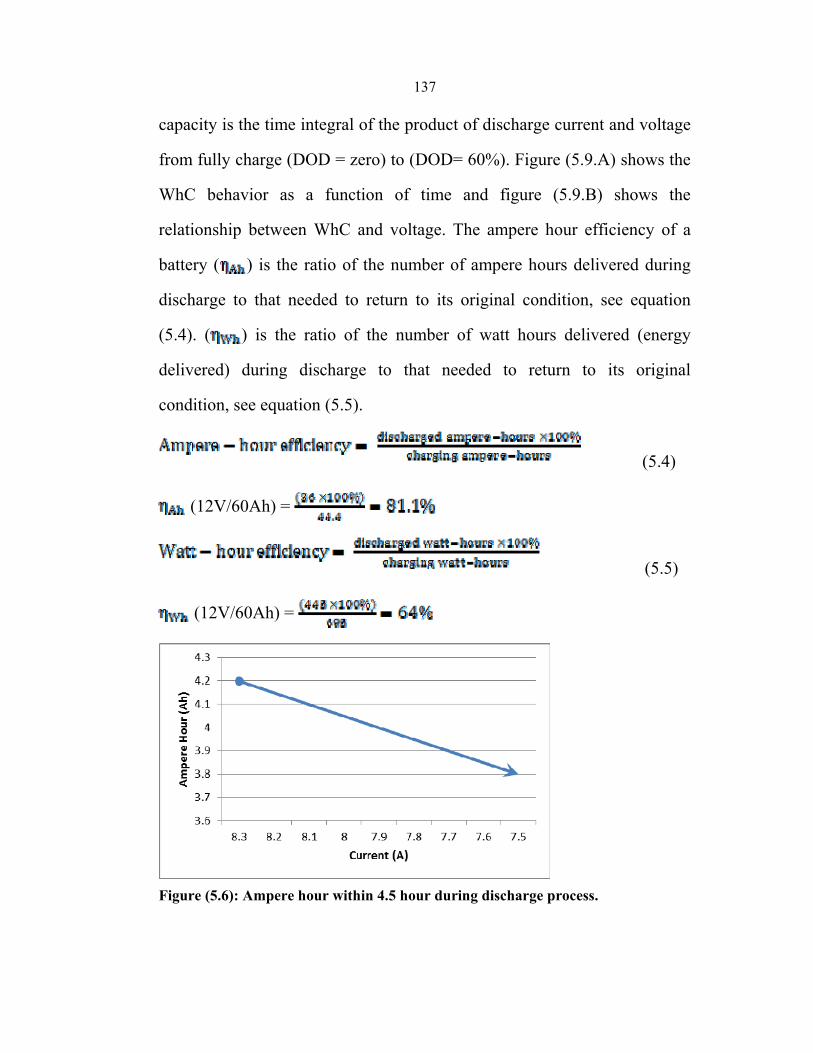
Figure (5.6) Ampere hour within 4.5 hour during discharge process 137
Figure (5.7)
Battery ampere hour capacity under discharged process (A): Battery ampere hour capacity under discharged time. (B): Ampere hour capacity as a function of discharge current (C): voltage behavior under the changed of the ampere hour capacity
138
Figure (5.8) Discharge process of the battery (A): Watt hour during discharge (B): Relation between watt hours delivered from battery and the voltage
139
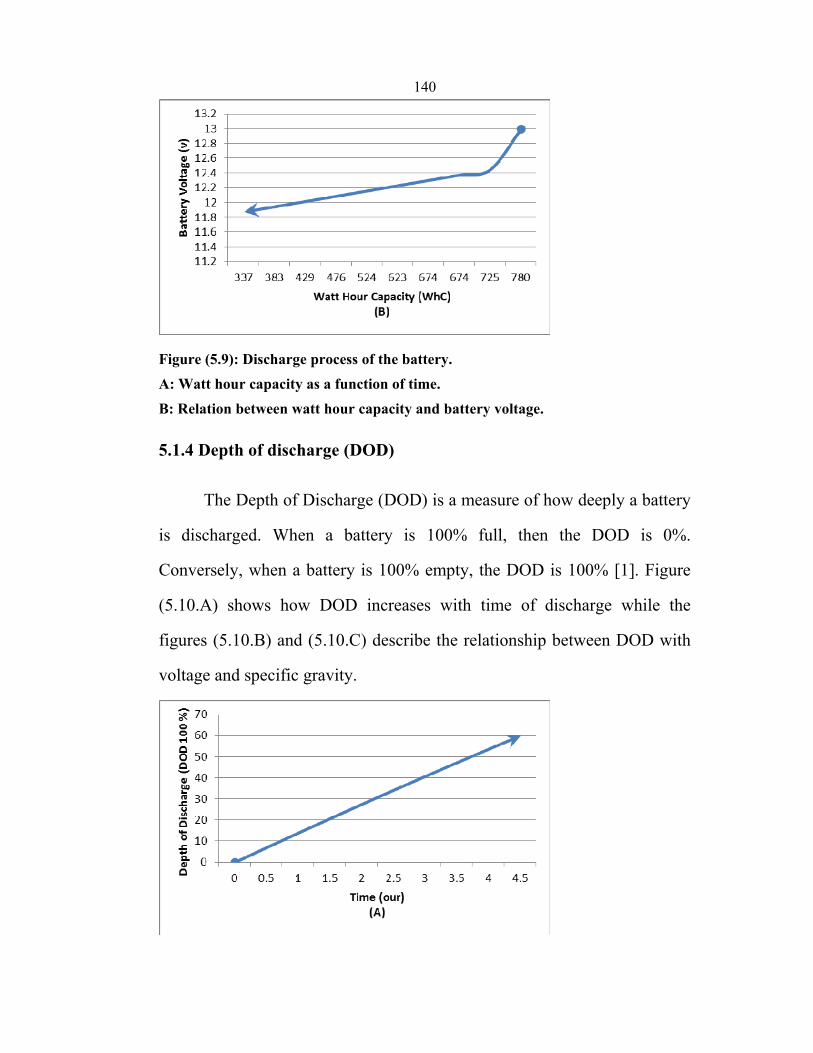
Figure (5.9)
Discharge process of the battery (A): Watt hour capacity as a function of time (B): Relation between watt hour capacity and under load voltage
140
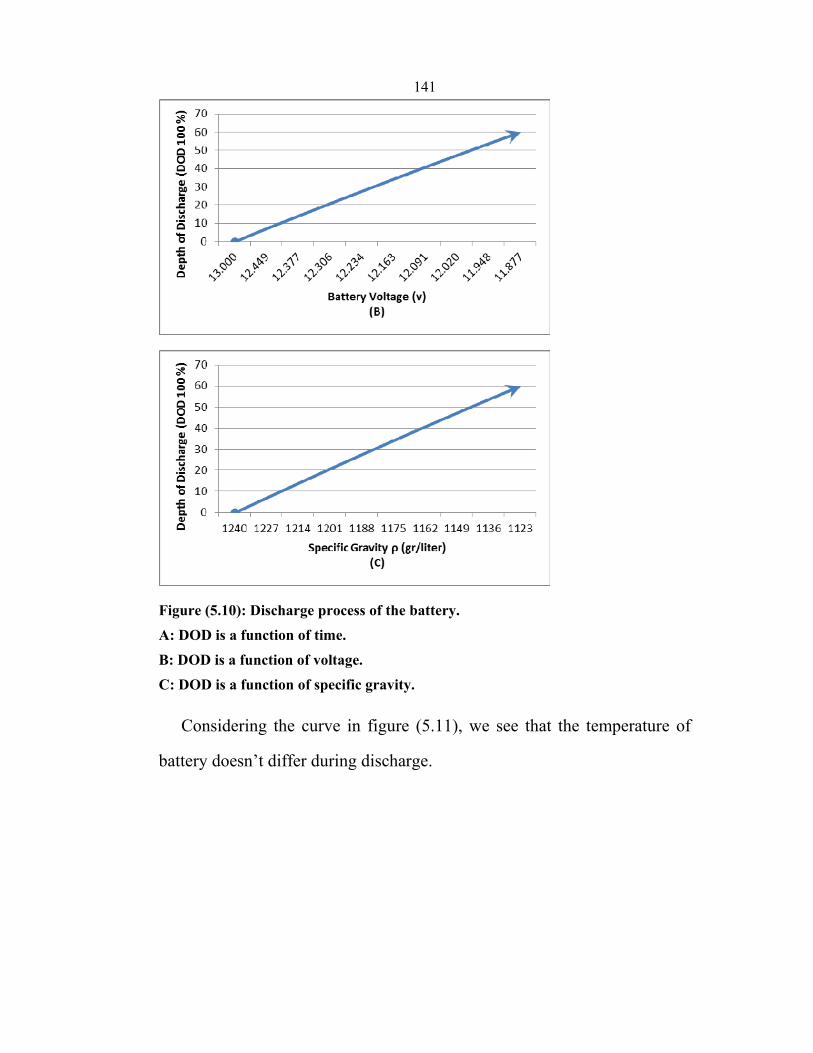
Figure (5.10)
Discharge process of the battery (A): DOD is a function of time (B): DOD is a function of voltage (C): DOD is a function of specific gravity
141
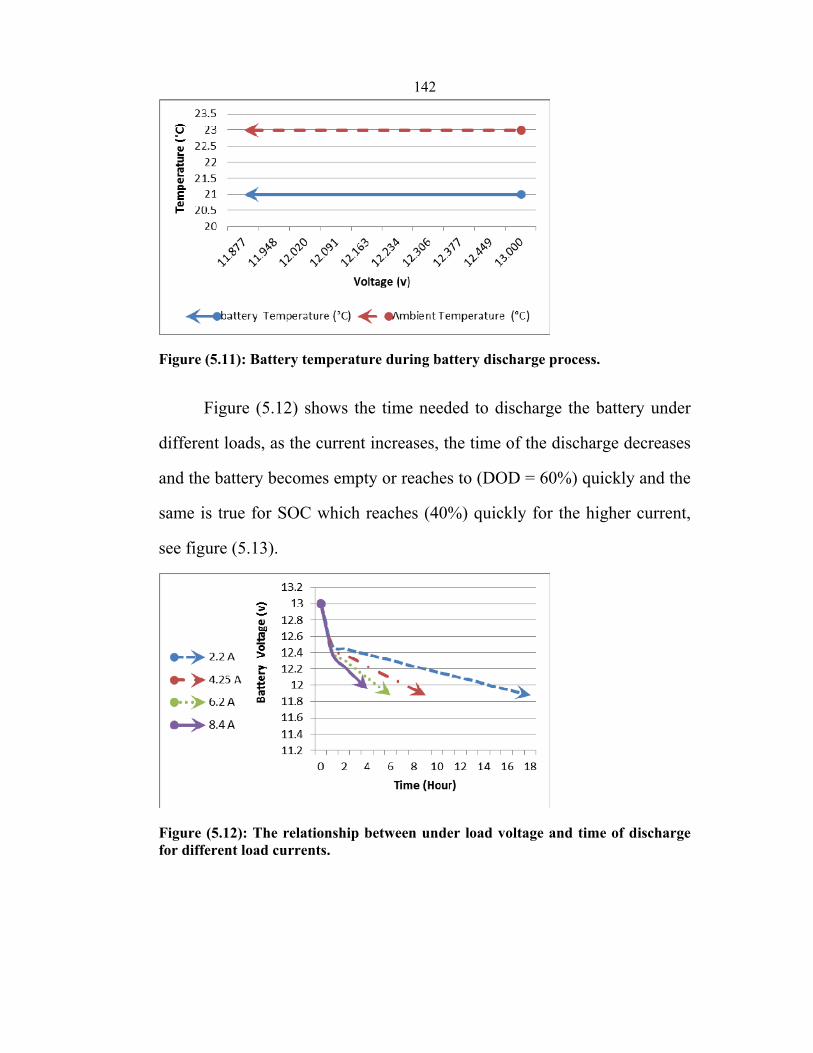
Figure (5.11) Battery temperature during battery discharge process 142
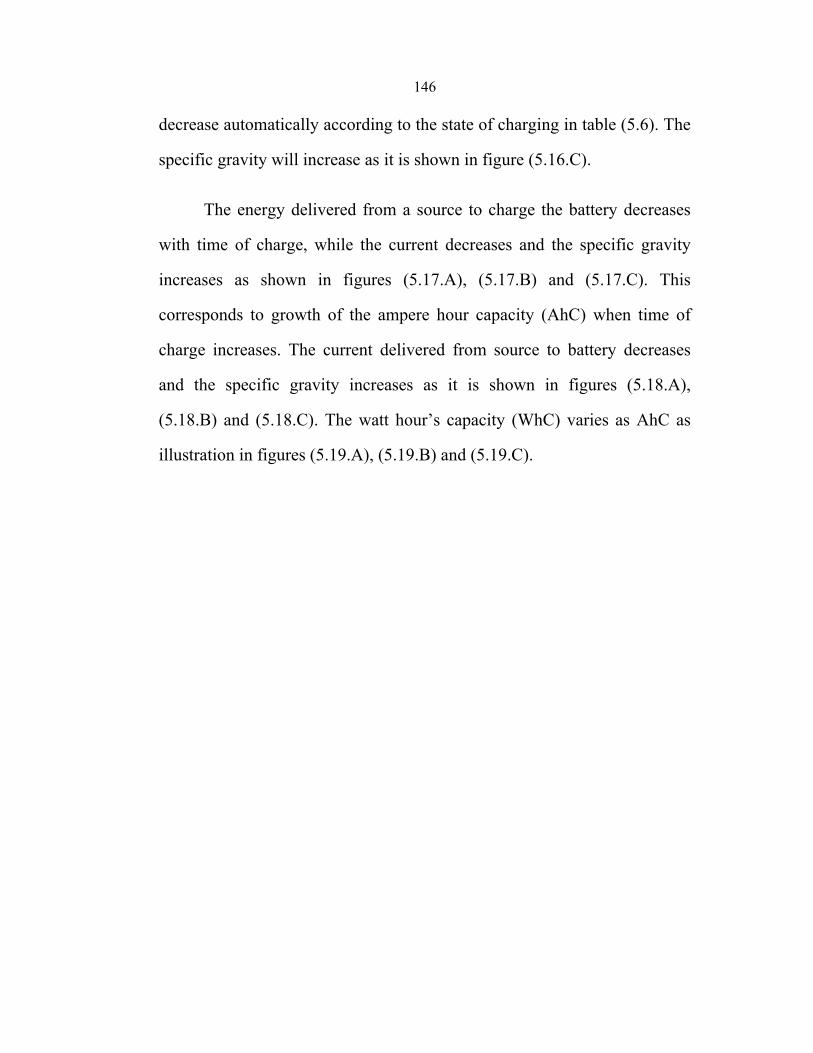
Figure (5.12) The relation sheep between under load voltage and time of discharge for different load currents 142
xivNo. Figure Page
Figure (5.13) The relationship between SOC and time of discharge for different load currents 143
Figure (5.14) The variation of battery voltage in a function of time until it was completely discharged 145
Figure (5.15) Battery voltage in a function of specific gravity until total discharged (DOD = 100%) 145
Figure (5.16)
Constant voltage charge process of lead acid battery (A): The decrease of the source voltage under charging process (B): The current under charging within time (C): The characteristics of electrolyte specific gravity as a function of charging current
1458
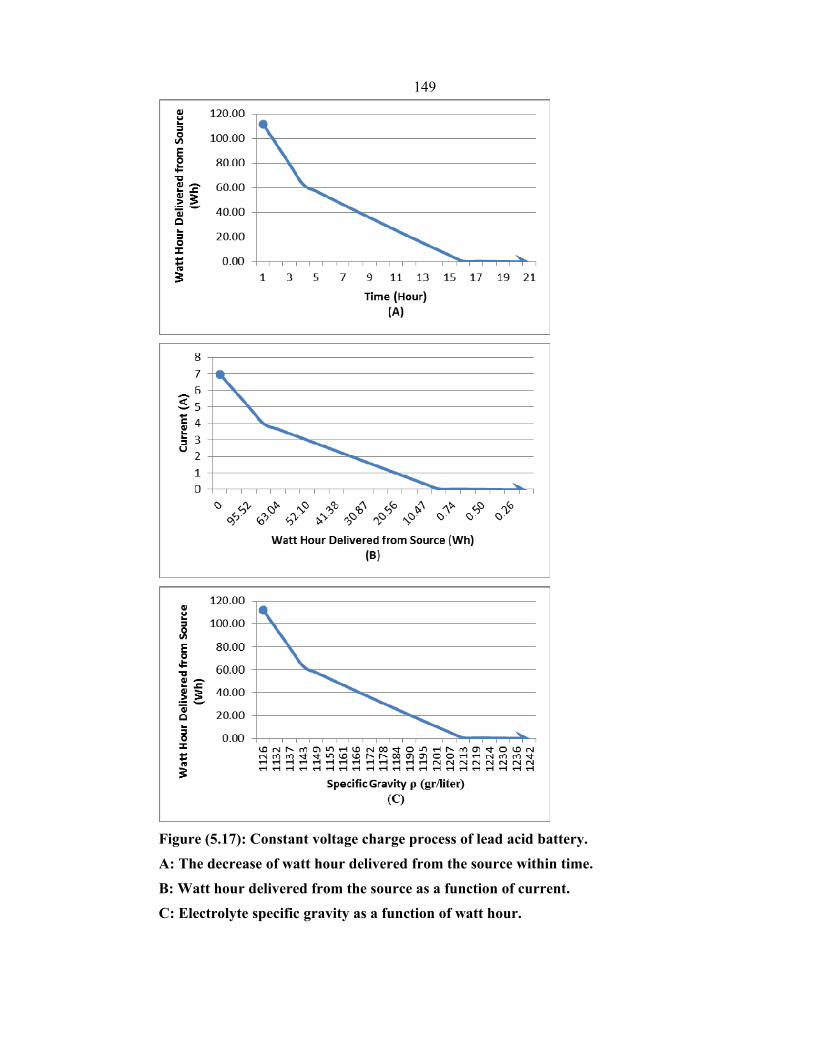
Figure (5.17)
Constant voltage charge process of lead acid battery (A): The decrease of watt hour delivered from the source within time (B): Watt hour delivered from the source as a function of current (C): Electrolyte specific gravity as a function of watt hour
149
Figure (5.18)
Constant potential charge process of lead acid battery (A): Ampere hour capacity during 21 hour (B): Ampere hour capacity as a function of current (C): The relation between ampere hour capacity and electrolyte specific gravity
150
Figure (5.19)
Constant voltage charge process of lead acid battery (A): Watt hour capacity as a function of time (B): Watt hour capacity as a function of charging current (C): Electrolyte specific gravity as a function of watt hour capacity during battery charging
151
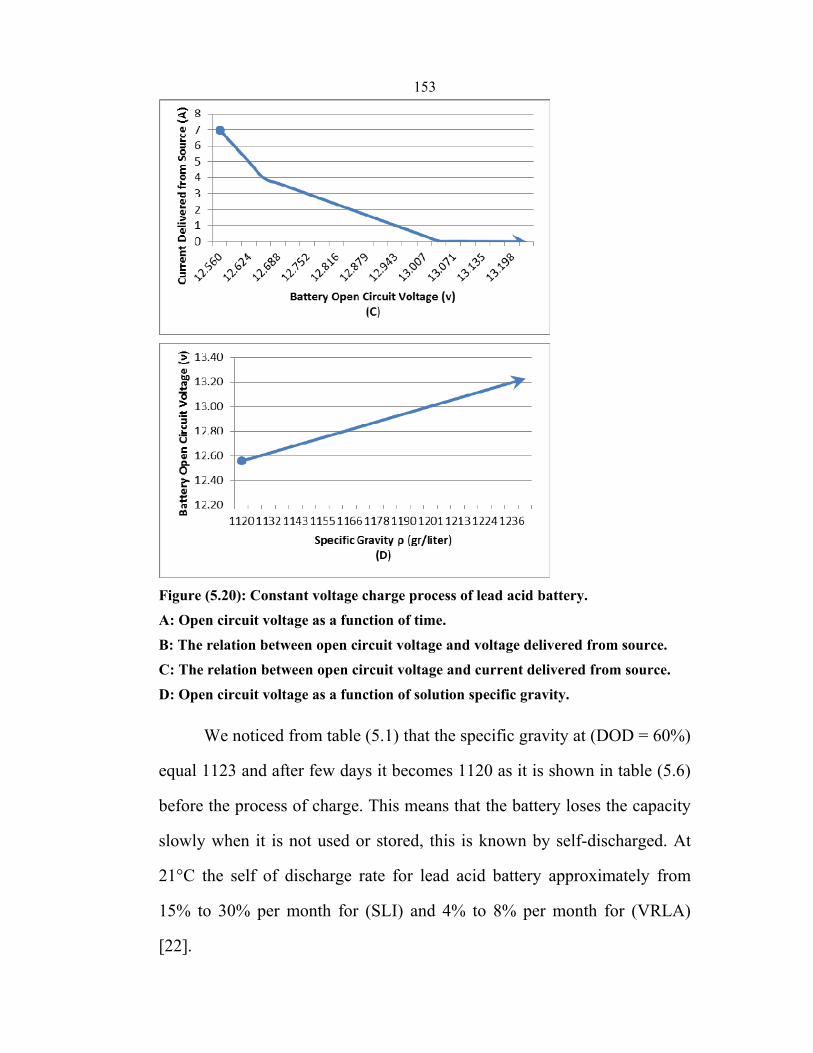
Figure (5.20)
Constant voltage charge process of lead acid battery (A): Open circuit voltage as a function of time (B): The relation between open circuit voltage and voltage delivered from source (C): The relation between open circuit voltage and current delivered from source (D): Open circuit voltage as a function of solution specific gravity
152
Figure (6.1) Battery model 163 Figure (6.2) Overall lead acid battery model structure 163 Figure (6.3) Equivalent circuit 164 Figure (6.4) Equivalent circuit in MATLAB 165Figure (6.5) Thermal model – ambient temperature 172
xvNo. Figure Page
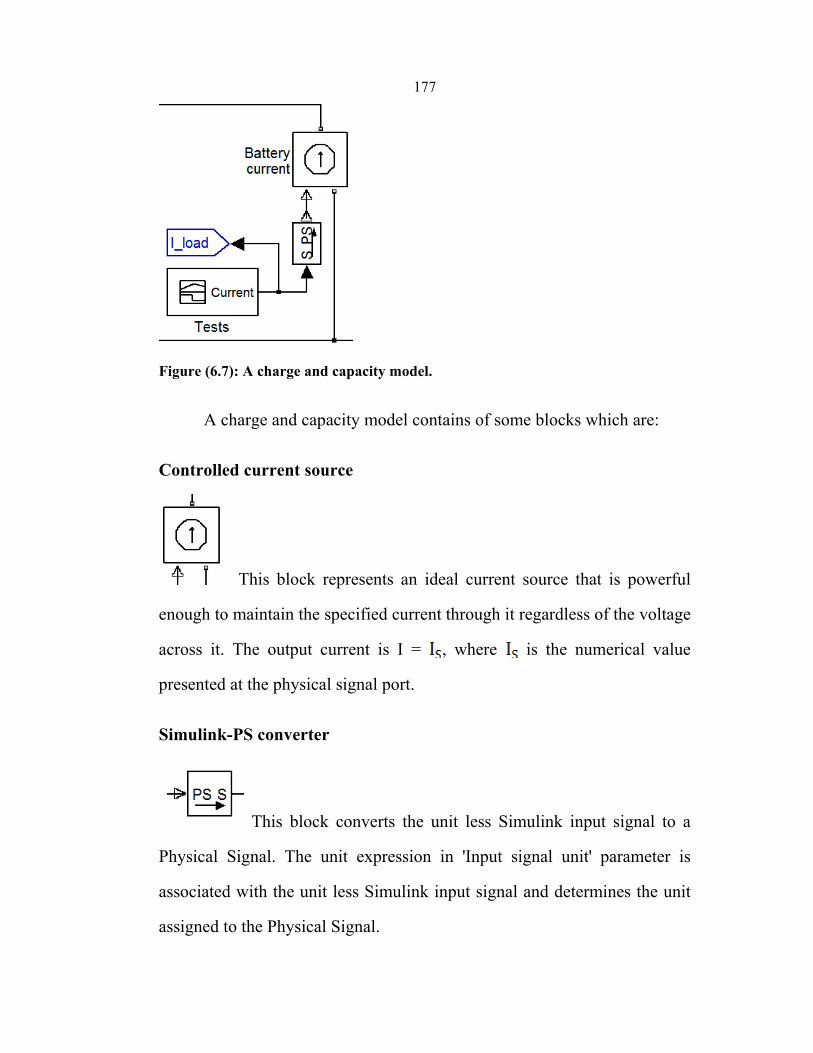
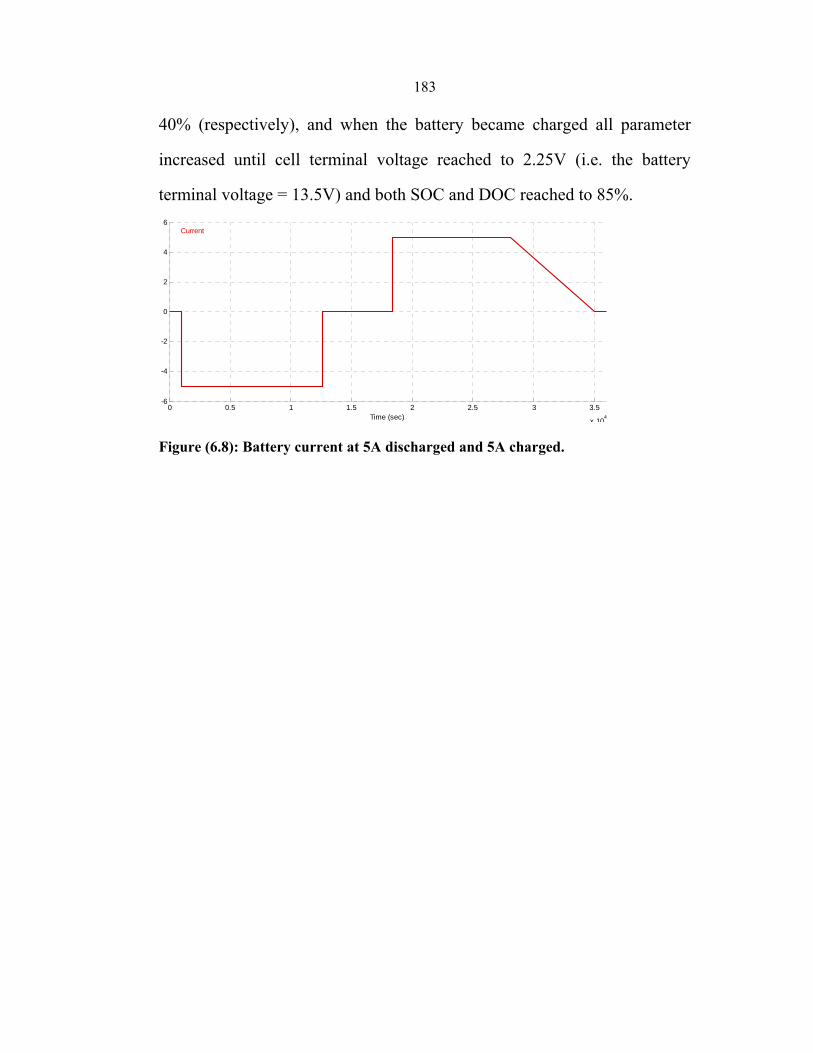
Figure (6.6) Thermal model – electrolyte temperature circuit 174 Figure (6.7) A charge and capacity model 177 Figure (6.8) Battery current at 5A discharged and 5A charged 183 Figure (6.9) Battery discharged and charged at 5A current 184
Figure (6.10) Battery current at 10A discharged and 10A charged 185
Figure (6.11) Battery discharged and charged at 10A current 186
xviModeling and Simulation of Lead-Acid Storage Batteries within
Photovoltaic Power Systems By
Ola Al-Qasem Supervisor
Prof. Dr. Marwan Mahmoud
Abstract
Storage batteries are indispensable in all standalone solar electric
systems (PV power systems). Their efficiency and life time affects
significantly the overall PV system performance and economics. Batteries
specified especially for use in PV systems have to be distinguished with
standing of a very deep discharge rate and high cycling stability. The most
proper types of storage batteries (rechargeable batteries) are discussed, and
the most important characteristics of lead acid batteries necessary for
evaluation of their performance are presented and discussed in this thesis.
Selecting the optimum conditions of lead acid battery to obtain the
maximum efficiency and maximum ampere hour and watt hour capacities
by implemented measurements on a lead acid battery are presented in this
thesis. The internal resistance of the battery is a reliable key for
determination of its state of charge. The value of this resistance increases
almost linearly with increasing of the stored energy. At the same time the
specific gravity of the electrolyte decreases linearly with the degradation of
ampere hour capacity. The experiments have shown that the battery internal
temperature doesn’t change significantly from the ambient temperature
during charge and discharge process. The implemented experimental tests
have proved that a regular battery cell will be not more rechargeable if it is
fully discharged. This issue requires using always a controllable battery
xvii
charger within the PV power systems to protect the storage batteries against
deep discharge and extremely over charge. Such equipment will extend the
life time of the battery and consequently improve the economic feasibility
and reliability of the PV power systems. In addition the tests have shown
that the watt hour efficiency of a battery is considerably less than the
ampere hour efficiency, which advices to depend more on the watt hour
efficiency when designing storage battery systems to secure higher
reliability.
Moreover, depending on an earlier developed algorithm for
determination of the ampere hour capacity of a battery cell, a new similar
algorithm based on specific gravity and cell voltage have been developed
which enables also the determination of the ampere hour capacity from the
implemented tests on the new battery. This algorithm enables the correct
settings of the limits of charge - discharge hysteresis of the battery charger
in order to avoid extremely deep discharge and over charge of the battery.
Moreover, this thesis presents a construction of an equivalent circuit
for lead acid battery using MATLAB program, defines all the components
that the circuits consist of and defines the components equations and the
parameters with their constants that the equivalent circuit depends on. The
final simulation results related to this circuit are also presented. A
simulation of the battery on the MATLAB has shown that a realization of
an equivalent circuit for a battery cell is possible. With respect to battery
characteristic functions, it was found that simulation and practical testing
results are almost similar.
1
Chapter One
Introduction and Literature Review
2
Chapter One Introduction and Literature Review
1.1 Introduction
Renewable energy sources, such as wind energy and photovoltaic
(PV) energy, are widely used as stand-alone power systems supplying
different electrical loads in rural and remote areas. These sources are of
intermittent nature and, therefore, the stand alone power systems should
include storage battery banks. The storage battery banks improve the
reliability of these systems because the excess energy is stored in the
battery bank, and this energy is delivered to the load when the solar or wind
energy is not available or not sufficient.
With respect to reliability and cost of standalone PV power systems,
storage batteries represent main and important components. Even a battery
block represents only 8% of the initial cost of a new PV system; it
represents 23% of the total system cost when considering the replacement
of batteries during the total life time of the system (20 years) [1]. Storage
batteries provide the PV system with advantages such as ability of
providing energy during night time and sunless periods, ability to meet
momentary peak power demands and stabilizing the system voltage.
The first chapter includes introduction and literature review.
Chapter two is established to illustrate the most important
characteristics of storage battery types.
3
Chapter three represents the general lead acid battery characteristics,
types and chemistry. Charging and discharging conditions are discussed. In
addition, it discusses the battery maintenance, safety and operating
features.
Chapter four discusses the nickel cadmium battery and iron electrode
battery regarding its types, characteristics, chemistry, charging and
discharging performance.
Chapter five presents experiments with comprehensive
measurements that were used to determine the ampere hour capacity, watt
hour capacity, depth of discharge and efficiency of lead acid battery.
Selecting the optimum conditions of lead acid battery to obtain the
maximum efficiency and maximum ampere hour and watt hour capacities
in charging and discharging process and a mathematical algorithm of lead
acid battery was developed for determining the battery ampere hour
capacity (CAh) and watt hour capacity (CWh).
Development of an equivalent electrical circuit for a lead acid battery
cell using MATLAB program with the results of this model and their
comparison with the results obtained from the measurements are presented
in chapter six.
1.2 Literature Review
A useful and systematic dynamic model of a battery energy storage
system (BES) is developed for a large-scale power system stability study.
4
The model takes into account converter equivalent circuits, battery
characteristics and internal losses. Both charging mode and discharging
mode are presented. The model is expressed in equivalent transfer function
blocks, and it can be easily used in dynamic stability analysis of a power
system. To examine the dynamic behavior of the model, applications to the
damping of turbo generator torsional oscillations are performed. Active and
reactive power modulation by the BES can be controlled according to
system requirements. Eigen value analysis and dynamic simulations are
performed to demonstrate the damping effect of the BES. A dynamic
model of a BES was presented. The model was expressed in the frequency
domain and can be easily applied in the stability application of a power
system. The control scheme let the BES have the ability of active power
and reactive power modulation according to system requirement. In the
dynamic period, the BES can be thought of as a current sink in the charging
mode or a current source in the discharging mode. To examine the dynamic
behavior of the model, the investigation into the damping of torsional
oscillations was performed. The BES with an auxiliary lead-lag controller
was proposed to enhance the torsional modes damping of the turbo
generator. Eigen values were analyed and dynamic simulations were shown
that the torsional oscillations could be effectively suppressed. The dynamic
performance of the power system was greatly improved. There have been
some commercial applications of the BES in Germany, South Africa and
the USA. However, since there was more and more desire for better load
management and electric power quality, the BES would receive more
5
attention in the future. The investigations of the BES fall into two
categories: modified lead-acid battery and advanced battery researches; and
BES control and operation technology researches. The establishment of the
BES dynamic model can provide a basis for the control method
development and the observation of responses and behavior of batteries [2].
Some of the issues and aspects associated with the use of lead-acid
batteries for energy storage in small PV systems were represented. Battery
performance depends on the PV system design and operation and the type
of battery technology employed. New and emerging energy storage
technologies such as the vanadium redox battery and high-speed flywheel
are considered as possible alternative energy storage systems in PV
applications. Lead-acid battery is the technology of choice for most PV
applications. However, there are performance limitations which result in
excessive replacement costs, work-place Occupational Health and Safety
(OS& H) issues and operational maintenance overheads for many end-
users. The technical shortcoming of the lead acid battery continues to fuel
research and developmental activity for comparative, low cost, alternatives.
Two recent developments - the VRB and the high-speed flywheel - have
progressed sufficiently to be now considered as possible alternatives to the
ubiquitous lead-acid battery in many PV applications [3].
A model of a lead-acid battery with the Advanced Vehicle Simulator
(ADVISOR) package was developed. The integrated model was used to
simulate the performance of a series-hybrid vehicle through 12 successive
6
FUDS cycles. Successful completion of the vehicle simulations
demonstrates the feasibility of using a fundamentally based battery model.
The additional information available from such a model is illustrated by the
ability of the model to predict a change in the local utilization of the
negative electrode as a result of cycling. A fundamentally based lead-acid
battery model has been developed and integrated into the vehicle
simulation package ADVISOR. A key issue related to model integration
was the need to converge the model in response to rapidly changing power
requests that may exceed the capability of the batteries. Another important
issue was the need for parameters suitable for simulation of both charge
and discharge. The integrated model was used successfully to simulate the
performance of a series-hybrid vehicle through 12 successive FUDS cycles,
corresponding to a total distance of approximately 80 miles. The
simulations included the power output from the battery pack, the state-of
charge, and power output from the generator as a function of time. These
simulations demonstrate the feasibility of using a fundamentally based
battery model for the simulation of hybrid vehicle performance [4].
Charge algorithms were developed to improve the life cycle of Valve
Regulated Lead-Acid (VRLA) batteries to 1000 deep discharges for electric
vehicle applications. Hypotheses that VRLA batteries could reach end-of-
life prematurely with the "normal" constant voltage charge because of
insufficient recharge at the negative plate and the "oxygen cycle" or
recombination reactions interfering with recharge of the negative plate.
Zero delta voltage (ZDV) and current interrupt charging algorithms were
7
developed and strategies that improved the cycle life of VRLA modules
from 150-200 deep discharge cycles to 300-350 deep discharge cycles.
Implementing a current interrupt charged algorithm on a 24-module battery
pack that resulted in 700 deep discharge cycles. No correlation between
operating temperature and failure were found when batteries stayed below
the manufacturer's recommended temperature limit of 60°C. However,
warmer modules appear to have longer lives, and so applying a ZDV
technique similar to the one used for NiCd batteries, the cycle life of the
Optima VRLA must be increased by a factor of 2. As VRLA batteries age,
increasingly higher finishing currents are drawn because of the oxygen
cycle; the charge/termination algorithm must be adjustable to respond to
this. A fixed, monotonic algorithm will result in overcharge early in life
and undercharge later in life, and so applying the multi-step constant
current / current interrupt (CC/CI) charge algorithm without battery
management results in excellent pack cycle lifetime for the Optima
product. Insufficient recharge of 12V modules in a large pack appears to be
amplified relative to single-module cycling. Weight losses are very low, on
the order of 100-150 grams, suggesting that "dry-out" is not a failure mode.
The small differences between initial and final open circuit voltages (VOC)
and impedances indicate that negative-plate sulfation is not severe [5].
Models of electrochemical batteries suitable for the use of the
electrical engineer, in particular for the analysis of electrical systems with
batteries were studied. The problem of simulating electrochemical batteries
by means of equivalent electric circuits is defined in a general way; then
8
special attention is devoted to the problem of modeling of Lead–Acid
batteries. For this kind of batteries general model structure is defined from
which specific models can be inferred, having different degrees of
complexity and simulation quality. In particular, the implementation of the
third-order model, that shows a good compromise between complexity and
precision, is developed in detail. The behavior of the proposed models is
compared with results obtained with extensive lab tests on different types
of lead–acid batteries. And so the complex, nonlinear behavior of
electrochemical batteries can be conveniently modeled using equivalent
electric networks. Although these networks contain elements that are
nonlinear and dependent on battery state-of-charge and electrolyte
temperature, they are very useful for the electric engineer, since they allow
them to think in terms of electric quantities, instead of internal battery
electrochemical reactions. The third-order model proposed has accuracy
satisfactory for the majority of uses; for particular situations more
sophisticated models can be derived from the general model structure
which was proposed. The proposed model can be used for several
purposes; the more important fields of application are: computer simulation
of battery behavior under different operating conditions (possibly
containing both charge and discharge processes); management of on-line
systems containing electrochemical batteries: state-of-charge estimation,
battery monitoring and diagnostics; estimate of residual range of electric
vehicles. The use of the proposed models, in particularly, the third order
formulation, is complicated by the fact that the proposed equations contain
9
several parameters that have to be identified. This identification can,
however, be simplified a lot since some of the parameters can be taken as
constant for all the batteries built with the same technology [6].
The problem of lead acid battery state-of-charge (SOC) estimation
for (hybrid) electric vehicles was discussed. The problem is to accurately
estimate the remaining battery capacity for both driver notification and
automated energy management. Simple solution methods, presentation of a
new solution method, and experimental analysis of the performance of that
method were given. A new algorithm was given and its application was
demonstrated on experiment data. The experimental involves battery
discharge only. As additional data sets become available, future research
will also address battery recharge. The results indicated that the method is
very promising. The advantages of the new algorithm are: (1) it accurately
estimates SOC without undesirable increases in SOC when the load current
changes, (2) it provides estimates of the battery internal parameters. These
estimated parameters yield robustness across aging and different batteries
[7].
A Radial Basis Function based learning system method has been
proposed for estimation of State of Charge (SOC) of Lead Acid Battery.
Coulomb metric method is used for SOC estimation with correction factor
computed by Radial Basis Function Method. Radial basis function based
technique is used for learning battery performance variation with time and
other parameters. A new approach has been described to estimate the SOC
10
of lead acid battery using Radial basis function based learning method. The
proposed method considers battery non linearity due to discharge rate, with
temperature and corrects itself for aging and other variations of the battery
characteristics to estimate SOC. Experimental results suggest that the
proposed method gave excellent prediction of SOC assuming that the initial
charging state of battery is known and is able to learn performance
variation. The proposed algorithm can further be extended to include
factors such as incomplete charging and interrupted discharging [8].
The various estimation methods for the SOC of the lead acid battery
have been proposed. However, not any method can accurately predict the
residual capacity. A new estimation method of the SOC on the lead acid
battery is proposed. This method is based on the terminal voltage and the
internal resistance of the battery. This proposed equation can decrease the
estimation error for the little SOC region. Experiments of discharging the
lead acid battery were made and compared the former method with the
proposed new method. A new estimated equation was proposed, in which
the square root about the internal resistance and the terminal voltage are
used and the SOC can be estimated more precisely by the proposed
equation especially when the SOC is very small [9].
Two electrical models of a lead-acid battery, a short-term discharge
model and a long term integrated model, were used to investigate the
system performance of a battery-supported dynamic voltage restorer
(DVR). The short-term model provides a simple but effective description
11
when the DVR compensates voltage sags over a short period. The
integrated model can predict accurately the terminal voltage, state of
charge, battery capacity and gassing current. It gives a good description of
the battery response during both discharge and charge. Parameters of both
models can be determined easily from measured battery output voltages
obtained from load-step tests. Both models were successfully implemented
in EMTDC/PSCAD and interfaced with the digital model. They gave a
very close agreement between extensive experimental data and simulation
results. Application issues such as current harmonics and micro cycles
during charge/discharge are discussed with respect to their impact on loss
of capacity and reduced lifetime of the lead-acid battery. A short-term
discharge model and long-term integrated models are presented to
investigate the system performance of a dynamic voltage restorer (DVR).
The short-term model is based on the Thevenin battery model and provides
a simple but effective representation when the DVR experiences voltage
sags for a short period. The integrated model, which is based on Giglioli’s
fourth-order dynamic-battery model, can predict accurately the terminal
voltage, state of charge, battery capacity, and gassing current. It gives an
excellent description of the battery response during both discharge and
charge. Parameters in both models can easily be extrapolated from
measured battery output voltages obtained from a set of load responses.
Both models were successfully implemented in EMTDC/ PSCAD and
interfaced with the digital model. They gave close agreement between
extensive experimental data and simulation results. Application issues such
12
as harmonic ripple and micro cycle charge/discharge remain a cause for
concern because of their potential negative impacts on loss of capacity and
reduced life lime of the lead-acid battery. The proposed electrical battery
models can not only be used in the DVR system, but can also be applied to
other battery energy storage systems [10].
The most important characteristics of lead acid batteries necessary
for evaluation of their performance were discussed. Moreover, an
experimental procedure is illustrated for developing a mathematical
algorithm for determining the ampere hour capacity of batteries operating
in PV systems. This algorithm enables to determine the state -of-charge of
a battery by measuring its voltage and electrolyte-specific gravity at a
definite temperature. This enables correct settings of the limits of the
charge - discharge hysteresis of the battery charger to avoid extremely deep
discharge and over charge of the battery. The derived algorithm, which has
been verified by data acquisition capacity measurements, is applicable also
to large battery storage systems. Lead - acid storage batteries are usually
used in small and large PV power systems operating in stand-alone mode.
Selection of battery type and capacity are important factors to realize an
efficient PV system. Battery types marketed for use in automobile are
economically not appropriate for utilization in PV systems because their
life time is relatively very short since they cannot stand deep discharge and
high cycling rate. Battery voltage in function of electrolyte temperature,
depth of discharge and specific gravity as well as the battery capacity in
function of discharge current, have to be given special consideration when
13
evaluating or designing storage batteries for PV power systems. Battery
voltage and specific gravity together is the key for determining the ampere
- hour capacity of a battery and the stored energy in it. Measuring them at
the same time and substituting their values in the developed algorithm leads
to determine the capacity of the battery Ah. The algorithm enables to know
the energy storage within a PV power system and to perform accordingly in
setting the battery charger control limits correctly, which consequently
elongate the life time of the battery and enhance the overall PV system
performance and economics [1].
A new estimation method of the SOC on the lead acid battery is
proposed. Using an electric circuit model of the battery, it is shown how the
open circuit voltage (which is directly related to the SOC) can be estimated
based on the terminal voltage and current measurements provided there is
sufficient variation in the battery current. A modified Thevenin equivalent
circuit model given was used to represent the lead-acid battery. Treatment
of nonlinear time varying model to a linear time varying model is done
with an unknown constant parameter. Conditions were found on the battery
current that ensure the observability Gramian of the system is full rank so
that the initial state of the system can be found using the inverse of the
system Gramian [11].
In a bid to perform model-based diagnostics on the electrical
network of an automobile, experimental work and analysis was conducted
to model an automotive lead-acid battery over the domain in which one is
expected to operate. First, a thorough literature review discusses previous
14
attempts at modeling, as well as state and parameter estimation. Also, the
literature on the aging and failure modes of batteries is presented. Next, the
model selected is described, consisting of a locally linear time-invariant
system approximation of a globally nonlinear time-variant battery. To
obtain the best parameters which enable this approximation, a series of
experiments was performed on a battery, the methodologies of which are
detailed. Finally, the details of parameter extraction are also presented,
along with their results. The work here presents a common battery
modeling methodology and the results of its application to modeling
automotive lead-acid batteries over the range of environmental conditions
that it is expected to operate in. The two major portions of the work, and
the biggest contributions, were the experimental methods (excitation
currents used) and parameter estimation. Both of these have appeared
previously, and were applied successfully to the specific task of automotive
battery modeling. This picture was incomplete of the full process of
modeling and fault-diagnosis of these batteries. The modeling was done
separately from fault diagnosis; the fault modes were investigated and
presented as a literature review, but no batteries were aged to validate or
quantify these highly variable processes. The modeling also cannot be
considered complete as it was based only on one battery. A number of
improvements could be made to the experimental methodology and
analysis techniques presented in this work [12].
In stand-alone photovoltaic (PV) systems, charge controllers prevent
excessive battery overcharge by interrupting or limiting the current flow
15
from the PV array to the battery when the battery becomes fully charged.
Charge regulation is most often accomplished by limiting the battery
voltage to a predetermined value or cut-off voltage, higher than the gassing
voltage. These regulation voltages are dependent on the temperature and
battery charge current. An adequate selection of overcharge cut-off voltage
for each battery type and operating conditions would maintain the highest
battery state of charge without causing significant overcharge and thus
improving battery performance and reliability. To perform this, a sample of
nine different lead-acid batteries typically, used in stand-alone PV systems
including vented and sealed batteries with 2V cells and mono block
configurations have been selected. Simple mathematical expressions were
fit to charge characteristic voltages: the gassing voltage (Vg) and the end-of
charge voltage (Vfc) as function of charge current and temperature for the
tested batteries. With these expressions, we have calculated (Vg) and (Vfc)
at different current rates. An analysis of the different values obtained is
presented here focusing on the implication in control strategies of batteries
in standalone PV systems. The Experimental values of both gassing voltage
(Vg) and end-of-charge voltage (Vfc) at different operating conditions of
nine different lead-acid batteries typically used in stand-alone photovoltaic
systems have been obtained. The experimental values of (Vg) and (Vfc)
have been fitted with a good degree of accuracy to simple mathematical
expressions that include the influence of charge current rate and
temperature. From the regression analysis, it can be observed that the
temperature coefficient α does not remain constant during all the charge
16
process. In all cases (except one battery), the temperature coefficient for the
gassing voltage is clearly lower than the temperature coefficient for the
end-of-charge voltage. It indicates that the temperature effect on battery
voltage is more important as the battery SOC increases. The values of
temperature coefficients we have obtained are lower than typical values
ranging from -4 to -6 mV/°C recommended by other authors current rate
also has influence on charge voltages. In the case of Vg no large,
differences have been found among different technologies tested: at the
same current rate the maxima differences of (Vg) values have varied from
0.08Vat C100 to 0.12Vat C5. In the case of (Vfc), large differences have
been found among the batteries with an influence of the battery type
obtaining high, intermediate and low values corresponding to sealed,
vented 2V cells and vented mono block batteries. In consequence, it is
observed that voltage interval (Vfc - Vg) ends to be narrower for slower
current rates, being influenced by the battery type: sealed batteries present
high values, vented 2V cells intermediate values and vented mono block
low values. The dependence of (Vg) and (Vfc) with both current rate,
temperature and battery type, especially in the case of overcharge cut-off
voltage, should be taken into account in the concept of operational strategy
of charge regulators for stand-alone PV systems [13].
A simple, fast, and effective equivalent circuit model structure for
lead-acid batteries was implemented to facilitate the battery model part of
the system model. Tools and processes for estimating the battery
parameters from laboratory data were implemented. After estimating
17
parameters from laboratory data, the parameterized battery model was used
for electrical system simulation. The battery model was capable of
providing accurate simulation results and very fast simulation speed. A
lead-acid battery model was developed, along with tools to parameterize
the model from laboratory data. Construction of an equivalent circuit model
has been described. A semi-automated process was used to estimate
parameters for the battery model from laboratory data. The completed
battery model simulated at approximately 10,000 times real-time. The
accuracy of the simulated battery model voltage was within 3.2% in
comparison to vehicle drive cycle measurements [14].
The storage of energy in batteries is a cause of the failure and loss of
reliability in PV systems. The two general lead acid battery models and
their agreement with experimental data were reviewed. In order to validate
these models, the behavior of different battery cycling currents has been
simulated. The results obtained have been compared to real data. The
CIEMAT model presents a good performance compared to Monegon’s
model. An experimental study was presented for a different type of
batteries. The two models used for comparison with experimental data are
general and can be applied for wide range of lead acid batteries. The
Monegon model was analyzed and found that the equation of charge and
discharge does not reproduce the experimental curves. Probably, the value
of parameters was fitted for to another type of battery and different
operational conditions. The term included in Monegon model for the
overcharge does not reproduce these effects and values of RMSE indicate
18
the deviation. The CIEMAT model presents a good performance to
represent dynamic and complex battery operation. This is, in contrast to
Monegon’s model; which presents significant limitations with respect to
charging process. In this way, other results could be evaluated considering
parameter variations effects in the life of battery. The aging model
describing life time of a battery is useful for an economic analysis [15].
The principle of the lead-acid battery was presented. A simple, fast,
and effective equivalent circuit model structure for lead-acid batteries was
implemented. The identification of the parameters of the proposed lead-
acid battery model is treated. This battery model is validated by simulation
using the Matlab/Simulink Software. Several lead-acid battery models are
conceived, for example, the mathematical model and the parallel branch
model. But the third order model is the simplest one to identify. All
parameters of this model can be identified by laboratory tests or taken from
the manufacturer's data. The third order model of the lead-acid has been
validated by simulation on the software MATLAB/Simulink [16].
An improved and easy-to-use battery dynamic model was presented.
The charge and the discharge dynamics of the battery model are validated
experimentally with four battery types. An interesting feature of this model
is the simplicity to extract the dynamic model parameters from batteries
datasheets. Only three points on the manufacturer’s discharge curve in
steady state are required to obtain the parameters, and the battery model is
included in the Sim Power Systems simulation software and used in a
19
detailed simulation of an electric vehicle based on a hybrid fuel cell-battery
power source. The model could accurately represent the dynamic behavior
of the battery. The new Sim Power Systems battery model allows for an
adequate representation of a battery’s real behavior based on only three
points on the battery manufacturer’s discharge curve. It has been
demonstrated that even if the points are extracted from a constant-current
discharge curve, the dynamic behavior obtained in simulation is close to
the experimental behavior, and the integration of the new battery model in
a multi-domain simulation of an EV based on a fuel cell enables to design
and adequately adjust the energy management system as well as the
battery’s management system. The obtained results are coherent with
reality and the vehicle’s total energy consumption concords with the public
information available on the Honda FCX Clarity [17].
The battery system modeling and user studies, are thus essential for
battery system design and optimization. The investigation detailed was
presented on battery system modeling and user study for emerging PHEVs.
The proposed modeling solution can accurately characterize battery system
run-time charge-cycle efficiency, and long-term cycle life. In particular, it
models battery system capacity variation and fading due to fabrication and
run-time aging effects. An embedded monitoring system is designed and
deployed in a number of HEVs and PHEVs, which can monitor users'
driving behavior and battery usage at real time. The user can employ the
proposed modeling and monitoring solutions to investigate battery system
run-time usage, characterize user driving behavior, and study the impact of
20
user driving patterns on battery system run-time charge-cycle efficiency,
capacity variation and reliability, and life-cycle economy, and these is the
first step in battery system design and optimization for emerging green-
energy CPS transportation applications. User-centric driving pattern and
battery system energy usage analysis are critical for PHEV manufacturers,
drivers and potential consumers. A large-scale battery system model had
been developed for PHEVs, which supports short-term energy usage profile
analysis, long-term thermal distribution and lifetime estimation, based on
heterogeneous real-world user driving behavior. A real time user driving
data acquisition system and conducted a user study on six participants with
diverse driving patterns was developed. Detailed evaluation results have
shown that our battery system model can accurately estimate real-world
battery system energy usage; user driving behavior affects battery system
usage significantly on both short term and long term. Generally, steadier
and smoother driving behaviors are better for electric-drive vehicle lifetime
and cost saving [18].
21
Chapter Two
Rechargeable Battery
22
Chapter Two Rechargeable battery
2.1 Rechargeable Battery Cells
As electrical and electronic devices become increasingly essential
parts of modem society, we are ever more dependent on our sources of
electrical power. Batteries are one of the few practical methods of storing
electrical energy. As such, they are vital components in electrical and
electronic devices ranging from portable electrical shavers to satellites in
space. Recent advances in battery technology, both in new battery types
and in improvements to existing batteries, have fueled a surge in battery
applications. As battery applications become more diverse and more
critical to system operation, it is especially important that system designers
and users understand the fundamentals of battery function [19].
A rechargeable battery or storage battery is a group of one or more
electrochemical cells. They are known as secondary cells because their
electrochemical reactions are electrically reversible. Rechargeable batteries
come in many different shapes and sizes, ranging anything from a button
cell to megawatt systems connected to stabilize an electrical distribution
network. Several different combinations of chemicals are commonly used,
including: lead–acid, nickel cadmium (NiCd), nickel metal hydride
(NiMH), lithium ion (Li-ion) [20].
2.2 Battery History
Batteries of one form or another have existed for nearly 200 years.
From the beginning, researchers have been attempting to improve the
23
energy density and make battery packaging more convenient for the user.
This development work continues today because market opportunities
expand immensely with each significant improvement in battery
performance [21].
2.2.1 Early works
Most historians date the invention of batteries to about 1800 when
experiments by Alessandro Volta resulted in the generation of electrical
current from chemical reactions between dissimilar metals. The original
voltaic pile used zinc and silver disks and a separator consisting of a porous
non conducting material saturated with sea water. When stacked as
sketched in figure (2.1), a voltage could be measured across each silver and
zinc disk. Experiments with different combinations of metals and
electrolytes continued over the next 60 years. Even though large and bulky,
variations of the voltaic pile provided the only practical source of
electricity in the early 19th century.
Johann Ritter first demonstrated a rechargeable battery couple in
1802, but rechargeable batteries remained a laboratory curiosity until the
development, much later in the century, of practical generators to recharge
them [21].
24
Figure (2.1): Voltaic pile [21].
2.2.2 Development of Lead Acid batteries
In 1859, Gaston Plant´ developed a spirally wound lead-acid battery
system. His cell used two thin lead plates separated by rubber sheets. He
rolled the combination up and immersed it in a dilute sulfuric acid solution.
Initial capacity was extremely limited since the positive plate had little
active material available for reaction. As repetitive cycling resulted in an
increased conversion of the lead in the positive plate to lead dioxide, the
capacity increased materially. This formation process remains a significant
aspect of lead-acid battery manufacture today.
About 1881, Faure and others developed batteries using a paste of
lead oxides for the positive-plate active materials. This allowed much
quicker formation and better plate efficiency than the solid Plant´ plate.
This improvement in battery technology occurred just as central-station
electrical generation was becoming practical. One result of these two
events was development of a diversity of commercial uses for lead acid
batteries including such applications as central stations, telephone
exchanges, and train and residential lighting.
25
The next major influence on lead-acid battery development was the
Charles Kettering's invention in 1912 of the first practical self-starter for
automobiles. General Motors subsequent adoption of battery-started cars
provided the key for massive growth in use of lead-acid batteries. The use
of lead-acid batteries in automotive starting, lighting, and ignition (SLI)
service remains their largest market. Although the rudiments of the flooded
lead-acid battery were in place in the 1880's, there has been a continuing
stream of improvements in the materials of construction and the
manufacturing processes. Today, flooded lead-acid batteries exist in a
variety of configurations tailored to the requirements of specific
applications.
The improved manufacturing quality control had eliminated the
present day batteries that made concerns over reliability and performance
that prevailed as recently as twenty years ago. Even recognizing the
improvements in flooded batteries, they still contain liquid sulfuric acid
with attendant safety, handling, and transportation concerns. Investigators
have attempted a variety of approaches to immobilize the electrolyte in
lead-acid batteries. The first effective result was the gelled electrolyte
battery developed in Germany in the 1960's. This used silica gel in the
electrolyte to greatly increase its viscosity. The result was a battery that
substantially reduced concerns about leakage and spillage.
Working from a different approach, Gates Energy Products
developed and was awarded a basic patent (U.S. Patent 3,862,861) on a
26
sealed-lead battery. Using only minimal amounts of electrolyte and
recombining evolved oxygen, the Gates sealed lead battery provided major
improvements in both performance and ease of use over both flooded and
gelled-electrolyte batteries [21].
2.2.3 Development of Nickel–Cadmium
Development of practical rechargeable batteries using alkaline
electrolytes lagged about 50 years behind lead-acid technology. About
1900, Edison began experimenting with a nickel storage battery with the
goal of developing a practical electric automobile.
In 1910 Edison demonstrated a commercial battery that used a nickel
positive electrode, an iron negative electrode, and a potassium hydroxide
electrolyte. Because of its ruggedness and high life cycle with repeated
deep discharges, the Edison battery found commercial success in a variety
of applications in the U.S. As nickel-cadmium batteries have become more
cost competitive, nickel-iron batteries have lost most of their markets. At
about the same time as Edison's work in the U.S., Waldmar Jungner was
working with first the nickel-iron and then the nickel-cadmium couple in
Sweden. The result of his efforts was the pocket-plate nickel-cadmium
battery which found widespread application in Europe, especially in larger
sizes for stationary applications.
During World War II, the Germans developed the sintered-plate
nickel-cadmium battery offering exceptionally high energy densities when
27
compared with other rechargeable batteries. The sintered-plate, vented or
flooded nickel-cadmium battery has found primary use in those
applications such as aircraft engine starting where high performance will
command a price premium.
In the 1950's, European experimenters developed a revolutionary
form of nickel cadmium battery that recombined gases evolved on
overcharge instead of venting them. This closed cycle allowed them to
develop a sealed cell with excellent performance characteristics. Because
of its cleanliness and high energy density, the sealed nickel-cadmium cell
continues to find broad application in electronics and consumer products
[21].
2.2.4 Recent developments
Interest in new and improved batteries remains strong today. The
demand for versatile, clean, high-power energy sources grows as
electronics becomes an increasingly essential part of both consumer and
industrial products. To date, the results of the battery industry's
development efforts have been most evident in the dramatic improvements
in existing battery types. However, three new battery types, using different
materials and technology, are beginning to find application.
Batteries using lithium metal offer the combination of high voltage
and high energy density, although at a premium price. Lithium batteries are
finding increasing application in situations that require the battery to supply
a low drain rate for a long period.
28
A long cycle life combined with a high energy density has been the
goal of the nickel-hydrogen development program which has focused on
spacecraft applications. Here the complex design and attendant high cost
are less important than high performance. Nickel-hydrogen cells are now
viable competitors to nickel-cadmium cells in this very specialized market.
Finally, the system which is currently exhibiting the greatest
application in commercial products is a hybrid of the nickel-hydrogen and
nickel-cadmium technologies called the nickel-metal hydride system. Here
absorption of hydrogen within a metal alloy's structure provides the energy
source which powers the cell [21].
2.3 Types and Characteristics of Secondary Batteries
The important characteristics of secondary or rechargeable batteries
are that the charge and discharge the transformation of electric energy to
chemical energy and back again to electric energy should precede nearly
reversibly, should be energy efficient, and should have minimal physical
changes that can limit cycle life. Chemical action, which may cause
deterioration of the cell’s components, loss of life, or loss of energy, should
be absent, and the cell should possess the usual characteristics desired of a
battery such as high specific energy, low resistance, and good performance
over a wide temperature range. These requirements limit the number of
materials that can be employed successfully in a rechargeable battery
system [19].
29
2.3.1 Lead-Acid batteries
The lead-acid battery system has many of these characteristics. The
charge-discharge process is essentially reversible, the system does not
suffer from deleterious chemical action, and while its energy density and
specific energy are low, the lead-acid battery performs reliably over a wide
temperature range. A key factor for its popularity and dominant position is
its low cost with good performance and cycle-life.
The automotive Starting, Lighting and Ignition (SLI) battery is by far
the most popular and the one in widest use. Most significant of the
advances in SLI battery design are the use of lighter-weight plastic
containers, the improvement in shelf life, the ‘‘dry-charge’’ process, and
the ‘‘maintenance- free’’ design. The latter, using calcium-lead or low-
antimony grids, has greatly reduced water loss during charging
(minimizing the need to add water) and has reduced the self-discharge rate
so that batteries can be shipped or stored in a wet, charged state for
relatively long periods.
The lead-acid industrial storage batteries are generally larger than the
SLI batteries, with a stronger, higher-quality construction. Applications of
the industrial batteries fall in several categories. The motive power traction
types are used in materials-handling trucks, tractors, mining vehicles, and,
to a limited extent, golf carts and personnel carriers, although the majority
in use are automotive-type batteries. A second category is diesel
locomotive engine starting and the rapid-transit batteries, replacing the
nickel-iron battery in the latter application.
30
Significant advances are the use of lighter-weight plastic containers
in place of the hard-rubber containers, better seals, and changes in the
tubular positive-plate designs. Another category is stationary service:
telecommunications systems, electric utilities for operating power
distribution controls, emergency and standby power systems,
uninterruptible power systems (UPS), and in railroads, signaling and car
power systems.
The industrial batteries use three different types of positive plates:
tubular and pasted flat plates for motive power, diesel engine cranking, and
stationary applications, and Plante´ designs, forming the active materials
from pure lead, mainly in the stationary batteries. The flat-plate batteries
use either lead-antimony or lead-calcium grid alloys. A relatively recent
development for the telephone industry has been the ‘‘round cell’’,
designed for trouble-free long-life service. This battery uses plates, conical
in shape with pure lead grids, which are stacked one above the other in a
cylindrical cell container, rather than the normal prismatic structure with
flat, parallel plates.
An important development in lead-acid battery technology is the
Valve-Regulated Lead- Acid battery (VRLA). These batteries operate on
the principle of oxygen recombination, using a ‘‘starved’’ or immobilized
electrolyte. The oxygen generated at the positive electrode during charge
can, in these battery designs, diffuse to the negative electrode, where it can
react, in the presence of sulfuric acid, with the freshly formed lead. The
31
VRLA design reduces gas emission by over 95% as the generation of
hydrogen is also suppressed. Oxygen recombination is facilitated by the use
of a pressure-relief valve, which is closed during normal operation. When
pressure builds up, the valve opens at a predetermined value, venting the
gases. The valve reseals before the cell pressure decreases to atmospheric
pressure. The VRLA battery is now used in about 70% of the
telecommunication batteries and in about 80% of the uninterrupted power
source (UPS) applications.
Lead-acid batteries are also used in other types of applications, such
as in submarine service, reserve power in marine applications, and in areas
where engine-generators cannot be used, such as indoors and in mining
equipment. New applications, to take advantage of the cost effectiveness of
this battery, include load leveling for utilities and solar photovoltaic
systems. These applications will require improvements in the energy and
power density of the lead-acid battery [19].
2.3.2 Alkaline secondary batteries
Most of the other conventional types of secondary batteries use an
aqueous alkaline solution (KOH or NaOH) as the electrolyte. Electrode
materials are less reactive with alkaline electrolytes than with acid
electrolytes. Furthermore, the charge-discharge mechanism in the alkaline
electrolyte involves only the transport of oxygen or hydroxy ions from one
electrode to the other; hence the composition or concentration of the
electrolyte does not change during charge and discharge.
32
Nickel-Cadmium batteries: The nickel-cadmium secondary battery
is the most popular alkaline secondary battery and is available in several
cell designs and in a wide range of sizes. The original cell design used the
pocket-plate construction. The vented pocket-type cells are very rugged
and can withstand both electrical and mechanical abuse. They have very
long lives and require little maintenance beyond occasional topping with
water. This type of battery is used in heavy-duty industrial applications,
such as materials-handling trucks, mining vehicles, railway signaling,
emergency or standby power, and diesel engine starting. The sintered-plate
construction is a more recent development, having higher energy density. It
gives better performance than the pocket-plate type at high discharge rates
and low temperatures but is more expensive. It is used in applications, such
as aircraft engine starting and communications and electronics equipment,
where the lighter weight and superior performance are required. Higher
energy and power densities can be obtained by using nickel foam, nickel
fiber, or plastic-bonded (pressed-plate) electrodes. The sealed cell is a third
design. It uses an oxygen-recombination feature similar to the one used in
electrolyte lead acid batteries to prevent the buildup of pressure caused by
gassing during charge. Electrolyte cells are available in prismatic, button,
and cylindrical configurations and are used in consumer and small
industrial applications.
Nickel-Iron batteries: It was used in materials-handling trucks,
mining and underground vehicles, railroad and rapid-transit cars, and in
stationary applications. The main advantages of the nickel-iron battery,
33
with major cell components of nickel-plated steel, are extremely rugged
construction, long life, and durability. Its limitations, namely, low specific
energy, poor charge retention, and poor low-temperature performance, and
its high cost of manufacture compared with the lead-acid battery led to a
decline in usage.
Silver Oxide batteries: The silver-zinc (zinc / silver oxide) battery
is noted for its high density, low internal resistance desirable for high-rate
discharge, and a flat second discharge plateau. This battery system is useful
in applications where high energy density is a prime requisite, such as
electronic news gathering equipment, submarine and training target
propulsion, and other military and space uses. It is not employed for
general storage battery applications because its cost is high, its cycle life
and activated life are limited, and its performance at low temperatures falls
off more markedly than with other secondary battery systems. The silver-
cadmium (cadmium/ silver oxide) battery has significantly a longer life
cycle and better low-temperature performance than the silver-zinc battery
but is inferior in these characteristics compared with the nickel-cadmium
battery. Its energy density, too, is between that of the nickel-cadmium and
the silver-zinc batteries. The battery is also very expensive, as it uses two
of the most costly electrode materials. As a result, the silver-cadmium
battery was never developed commercially but is used in special
applications, such as nonmagnetic batteries and space applications. Other
silver battery systems, such as silver-hydrogen and silver-metal hydride
34
couples, have been the subject of development activity but have not
reached commercial viability.
Nickel-Zinc batteries: The nickel-zinc (zinc /nickel oxide) battery
has characteristics midway between those of the nickel-cadmium and the
silver-zinc battery systems. Its energy density is about twice that of the
nickel-cadmium battery, but the life cycle, previously, has been limited due
to the tendency of the zinc electrode toward shape change which reduces
capacity and dendrite formations, which cause internal short-circuiting.
Recent development work has extended the life cycle of nickel-zinc
batteries through the use of additives in the negative electrode in
conjunction with the use of a reduced concentration of KOH to repress zinc
solubility in the electrolyte. Both of these modifications have extended the
life cycle of this system so that it is being now marketed for use in electric
bicycles, scooters and trolling motors.
Hydrogen Electrode batteries: Another secondary battery system
uses hydrogen for the active negative material (with a fuel-cell-type
electrode) and a conventional positive electrode, such as nickel oxide.
These batteries are being used exclusively for the aerospace programs
which require long cycle life at low depth of discharge. The high cost of
these batteries is a disadvantage which limits their application.
The advantage of this battery is that its specific energy and energy
density are significantly higher than that of the nickel-cadmium battery.
The sealed nickel-metal hydride batteries, manufactured in small prismatic
35
and cylindrical cells, are being used for portable electronic applications and
are being employed for other applications including hybrid electric
vehicles. Larger sizes are finding use in electric vehicles.
Zinc/Manganese Dioxide batteries: Its major advantage is a higher
capacity than the conventional secondary batteries and a lower initial cost,
but its life cycle and capability rate are limited [19].
2.4 Why we Need Batteries Getting Unplugged: Portable Energy and
Long-Term Energy Storage.
We use electrical energy to power most of the devices, equipment,
appliances, gadgets, and tools we use every day. This means we have two
basic needs with respect to electrical energy: generation and storage.
The electricity in the distribution grid is generated by converting heat
and kinetic energy into electrical energy.
Using the electricity that is distributed through the electrical grid
requires stationary outlets connected to the electrical grid distribution
system. This limits the use of devices and equipment to locations that are
served by the electrical distribution grid. It also limits their portability to
the length of the power cords that convey the electricity from the grid to the
device or equipment.
In cases where connecting to the electric distribution grid through
wall outlets is inconvenient, such as with devices that are intended to be
mobile and not tied down by an electrical cord or not feasible because the
36
location of the equipment is far from the electrical grid, other means of
providing electrical energy become necessary. This is where batteries come
into play.
There are two basic reasons to store energy: (1) the energy generated
needs to be available for use at a later time, or (2) you want to carry energy
with you. Examples of the former include storing energy generated by the
wind or sun for use when the wind is not blowing or the sun is not shining.
Examples of the latter are portable applications, like cell phones,
pacemakers, and electric vehicles [19].
2.5 The Many Uses of Batteries
Secondary or rechargeable batteries are widely used in many
applications. The most familiar are starting, lighting, and ignition (SLI)
automotive applications; industrial truck materials handling equipment; and
emergency and standby power. Small, secondary batteries are also used in
increasing numbers to power portable devices such as tools, toys, lighting,
and photographic, radio, cell phones, laptop computers, MP3 players,
cameras, and calculators and more significantly, consumer electronic
devices (computers, camcorders, cellular phones). More recently,
secondary batteries have received renewed interest as a power source for
electric and hybrid electric vehicles [19].
We can’t list every single application that uses batteries. The
numbers of applications and battery types are just too large. What follows
37
is a brief survey of some of the applications, especially those that require
some specialized batteries:
• Portable consumer devices (mobile power for an unplugged society,
power tools) such as laptop computers, electronic games, battery-
operated toys, and flashlights.
• Medical devices: life-sustaining and life-enhancing medical devices,
including pacemakers, defibrillators, hearing aids, pain management
devices, and drug pumps.
• Electric vehicles, including hybrids vehicles. Rechargeable batteries are
used for automobile starters, portable consumer devices, light vehicles
(such as motorized wheelchairs, golf carts, electric bicycles, and electric
forklifts), tools and uninterruptible power supplies.
• Large-scale energy storage.
• Space Satellites require battery power when they enter the Earth shadow
and their solar panels do not function.
• Military batteries: Like space batteries, military batteries need to be
designed with long life and high reliability in mind. They could also
experience a wide range of environmental conditions [22].
The lead-acid battery is designed in many configurations, as listed in
table (2.1), from small sealed cells to large cells.
38Table (2.1): Major characteristics and applications of secondary batteries [19].
System Characteristics Applications Lead-Acid ( ): Automotive Popular, low-cost
secondary battery, moderate specific-energy, high-rate, and low-temperature performance; maintenance-free designs
High specific energy, extended cycle life and rate capability
Bicycles, scooters, trolling motors
Silver-zinc (AgZn)
Highest specific energy, very good high rate capability, low cycle life, high cost
Lightweight portable electronic and other equipment; training targets, drones, submarines, other military equipment, launch vehicles and space probes
Silver-cadmium (Ag-Cd)
High specific energy, good charge retention, moderate cycle life, high cost
Portable equipment requiring a lightweight, high-capacity battery; space satellites
Nickel-hydrogen (Ni-H2)
Long cycle life under shallow discharge, long life
Primarily for aerospace applications such as LEO and GEO satellites
2.6 Battery Performance
The battery chemistry is often the focus of performance discussions,
and certainly the electrode materials play a dominant role in determining
the battery performance characteristics. Yet, there is more to it than the
reactivity of the electrode materials in the battery. The rate at which energy
is released is modulated by practical factors associated with the battery
design and selection of other materials used in the battery construction,
including the type and amount of electrolyte [22].
2.6.1 Potential or voltage
The electrochemical potential, or voltage (in volts, or V), is the
amount of work or energy (in joules, or J) that can be done by a unit of
electrical charge (in coulombs) [22].
40
2.6.2 Current
The electric current is a flow of electric charge through a medium.
This charge is typically carried by moving electrons in a conductor such as
wire. The SI unit for measuring the rate of flow of electric charge is the
ampere, which is charge flowing through some surface at the rate of one
coulomb per second. The electric current is measured using an ammeter
[22].
2.6.3 Resistance
Electrons or currents traveling through a material experience a
resistance against their movement. The current, that a potential, or voltage,
is capable of producing is limited by the resistance in the circuit according
to Ohm’s law. According to Ohm’s law, the voltage difference between the
two points is directly proportional to the current between those two points
in a conducting medium and inversely proportional to the resistance of the
conductor:
v = i * R (2.1)
Where, i is the current (A), v is the voltage difference (V), and R is
the resistance (ohms). The unit of resistance is the ohm. The unit may be
written as ohm or Ω. A manufactured electrical component with a known
resistance is a resistor [22].
41
2.6.4 Capacity
The quantity of electricity delivered by a battery is its capacity and
measured in units of ampere-hours or amp-hours (Ah). It quantifies how
long a battery will last in hours at some discharge current in amps. This is
an easy calculation to make when a battery is discharged at a constant
current. The discharge current in amperes (A) is multiplied by discharge
time in hours (h) to give capacity in ampere-hours:
Capacity (Ah) = current (A) × time (h) (2.2)
A battery that lasted 10 h when discharged with a constant current of
0.25 A delivered a capacity of 2.5 Ah. Alternatively, if you know the
capacity of the battery and you want to know how long it will last, and then
divide the capacity in Ah by the discharge current in A. For example: A
battery rated at 1.5 Ah when discharged at a constant current of 0.3 A is
expected to provide 5 hours of use (1.5 Ah / 0.3 A = 5 h).
Many applications do not drain batteries using a constant current,
though. How the battery is discharged will affect how long it lasts and the
discharge voltage figure (2.2). The current is probably not constant
throughout discharge for batteries discharged through a resistance or using
a power load, so simply multiplying current by time will yield a wrong
answer.
42
Figure (2.2): How different discharge loads affect battery discharge voltage [22].
The capacity is calculated by integrating the current produced by a
battery over the discharge time [22].
2.6.5 Power
The electrical energy is the amount of work done to move coulombs
of charge through volts potential difference. The electrical power is the
how much energy is delivered per period of time. It can be calculated by
multiplying the potential or voltage by the current:
P = i v [w] (2.3)
Where P is the power with units in watts (W), i is the current in (A)
and v is the potential or voltage in (V). Other ways to write an equation for
electrical power can be done by substituting E from Ohm’s law [22]:
P = i² R or = (2.4)
2.6.6 Energy
The energy delivered by a battery is measured in units of watt-hours
(Wh). It quantifies how long a battery will last in hours at some discharge
43
power load in watts. Just as it is for calculating capacity with the constant
current case just described, the energy delivered by a battery is easy to
calculate when it is discharged with a constant power load. The power in
watts (W) is multiplied by discharge time in hours (h) to give energy in
watt-hours:
Energy (Wh) = power (W) × time (h) (2.5)
Again, if the power load is not constant throughout discharge, the
energy is determined using the following equation [22]:
Energy (Wh) = (2.6)
2.7 General Battery Concepts
This section describes some common terms and definitions that are
often used in describing batteries or in defining battery applications [21].
2.7.1 Batteries cells
In casual usage, a battery is anything that supplies electrical power
through chemical reactions. However, when discussing battery design it is
important to understand the distinction between batteries and cells. Cells
are the basic electrochemical building blocks. Batteries consist of one or
more cells.
44Table (2.2): Cell voltage for different battery types
Battery type Cell voltage Lead-acid 2 Nickel-cadmium 1.3 Iron Electrode 1.2
A battery can be a single cell provided with terminations and
insulation and considered ready for use. More often, a battery is an
assembly of several cells connected in series or parallel and with electrical
output terminals. In many batteries, such as those used in automobiles, all
inter cell connections are made internally. The number of cells within the
battery may not even be apparent from the finished package [21].
2.7.2 Cell and battery voltage
The voltage performance characteristics of a battery scale directly
with the number of cells in the battery. This means that the voltage
obtained on discharge or the voltage required on charge is usually just the
appropriate single cell voltage multiplied by the number of cells in the
battery. If a 2V electrolyte -lead cell requires a charge voltage of 2.4 V, a
6V (3 cells) battery requires a charge voltage of 3 X 2.4 V or 7.2 V, a 12 V
(6 cells) battery will require 14.4 V, etc. In discussions of battery output
and charging, voltages are often presented on a per cell basis. These
normalized values can then be converted to the appropriate voltages for a
specific battery by multiplying by the number of cells in the battery [21].
2.7.3 Cell and battery capacity
While the voltage of a cell is determined by its chemistry, cell
capacity is infinitely variable. The capacity of a cell is essentially the
45
number of electrons that can be obtained from it. Since current is the
number of electrons per unit time, cell capacity is the integration of current
supplied by the cell over time. Cell capacity is normally measured in
ampere-hours.
The capacity of a cell is generally determined by the quantity of
active materials included in it. Individual cells range in capacity from
fractions of an ampere-hour to many thousands of ampere-hours. Cell
capacity is usually directly related to cell volume, i.e. bigger cells usually
mean higher capacities.
Balancing the amounts of positive active material, negative active
material, and electrolyte in a cell is one of the cell designer's tools.
Adjusting the relative quantities of these three items allows the cell to be
tailored for a specific application [21].
2.7.4 Connecting cells to form a battery: series or parallel
Every cell has a positive and a negative terminal. The terminals may
be specific sites such as the positive and negative tabs on the electrolyte -
lead cell or may be more general locations such as the positive cover and
negative can on the electrolyte nickel-cadmium cell. In connecting multiple
cells into batteries, there are two options: the positive from one cell may be
linked to the negative of the succeeding cell (series connection) or the cell
positive terminals may be linked together and the negative terminals may
be linked together (parallel connection).
46
Series connection means that the voltages of the connected cells are
added while the capacity remains constant. So the battery voltage becomes
the cell voltage multiplied by the number of cells and the battery capacity is
the capacity of the individual cell. Thus, to obtain a nominal 12 volt DC
output, a battery might consist of 10 nickel cadmium cells in series or 6
electrolyte lead cells. Series strings are the most common means of
connecting cells.
Batteries employing parallel connections are used when a higher
capacity than that provided by the individual cell is needed. When possible,
it is ordinarily less costly and more reliable to use a cell with a higher
capacity than it is to connect multiple cells in parallel. However, situations
do arise where larger cells are either unavailable or unsuitable, so a battery
consisting of parallel strings of cells is used. In such cases, the battery
voltage is that of the individual cell while the battery capacity is the
individual cell capacity multiplied by the number of cells in the battery.
Parallel connection of nickel-cadmium cells requires special charging
considerations [21].
2.7.5 Cell components
The cell, the basic unit of the battery, has four main components as
sketched in figure (2.3). These are:
47
Figure (2.3): Cell essentials [21].
The negative electrode (the anode during discharge reactions)
supplies electrons to the external circuit when oxidized during discharge.
For the nickel-cadmium battery, the active material for the negative
electrode is metallic cadmium, while metallic lead fills the same function
for lead batteries.
The positive electrode (the cathode during discharge reactions)
accepts the electrons from the external circuit when reduced during
discharge. The active materials for the positive electrode are nickel
oxyhydroxide (NiOOH) and lead dioxide ( ) for the nickel-cadmium
and electrolyte lead batteries respectively. Because of their typical shapes,
the electrodes are commonly referred to as the positive or negative plates.
Both terms, electrode and plate, normally encompass the active material
and any subtracting used for support and for current collection.
The electrolyte completes the circuit internally by furnishing the ions
for conductance between the positive and negative electrodes. The
electrolyte can be either an alkaline solution which supplies negative ions
48
( ) or an acidic solution which provides positive ions ( ) to conduct
current. Charge flows from positive to negative electrode in two manners.
In an alkaline electrolyte, negative ions are created at the positive electrode
and absorbed at the negative. In an acidic electrolyte, positive ions are
created at the negative electrode and absorbed at the positive one. In either
case, the effective flow of the current is the same. The nickel-cadmium
couple uses an alkaline electrolyte a dilute mixture of potassium hydroxide
(KOH) and water. The lead battery uses an acidic electrolyte a dilute
mixture of sulfuric acid ( ) and water. In lead batteries, the sulfuric
acid is consumed as the cell discharges. Thus, the acid concentration is a
measure of the state of charge of the cell. This concentration (or specific
gravity) variation is the operating principle behind the hydrometers used to
indicate state of charge for flooded lead-acid batteries. The electrolyte in
nickel cadmium batteries acts only to convey ions; it does not participate in
the reaction. As a result, monitoring the state of charge through electrolyte
concentration changes is not possible for nickel batteries.
A separator is normally used to electrically isolate the positive and
negative electrodes. If the two electrodes make direct electrical contact,
they form an internal short-circuit, discharging the battery and rendering it
useless. Strictly speaking, the separator is not necessary since physical
isolation can provide electrical isolation. However, all commercial batteries
use a separator to allow closer electrode to space without creating internal
shorts. The type of separator used varies by cell type. Electrolyte nickel-
cadmium cells use a porous plastic separator while advanced versions of
49
the electrolyte lead cell use a porous glass-fiber separator. In these
examples, both nickel cadmium and electrolyte lead, the separator also
absorbs electrolyte, limiting the amount of free electrolyte found in the cell
and keeping the electrolyte next to the electrode.
These components are then housed in a cell jar or can. Depending on
the type of battery, a variety of other components may be used to package
the cell, to support the various components, or to provide for easy electrical
connection. But only the four components listed above are essential to cell
function [21].
2.8 Voltage and Discharge Profiles
The discharge curves of the conventional secondary battery systems,
at the C/5 rate, are compared in figure (2.4). The lead-acid battery has the
highest cell voltage of the aqueous systems. The average voltage of the
alkaline systems ranges from about 1.65 V for the nickel zinc system to
about 1.1 V. At the C/5 discharge rate at 20C there is relatively little
difference in the shape of the discharge curve for the various designs of a
given system. However, at higher discharge rates and at lower
temperatures, these differences could be significant, depending mainly on
the internal resistance of the cell. Most of the conventional rechargeable
battery systems have a flat discharge profile, except for the silver oxide
systems, which show the double plateau due to the two-stage discharge of
the silver oxide electrode, and the rechargeable zinc /manganese dioxide
battery. The discharge curve of a lithium ion battery, the carbon/lithiated
50
cobalt oxide system, is shown for comparison. The cell voltages of the
lithium ion batteries are higher than those of the conventional aqueous cells
because of the characteristics of these systems. The discharge profile of the
lithium ion batteries is usually not as flat due to the lower conductivity of
the non-aqueous electrolytes that must be used and to the thermodynamics
of intercalation electrode reactions. The average discharge voltage for a
lithium ion cell is 3.6 V, which allows one unit to replace three Nicad or
NiMH cells in a battery configuration [19].
Figure (2.4): Discharge profiles of conventional secondary battery systems and rechargeable lithium ion battery at approximately C/ 5 discharge rates [19].
51
2.9 Effect of Discharge Rate on Performance
The effects of the discharge rate on the performance of these
secondary battery systems are compared again in figure (2.5). This figure
shows that hours of service each battery type (unitized to 1-kg battery
weight) will deliver at various power (discharge current * midpoint
voltage) levels. The higher slope is indicative of superior retention of
capacity with increasing discharge load. The specific energy can be
calculated by the following equation [19].
Specific Energy = specific power hours of service or
Wh / kg = W / kg h = (2.7)
Figure (2.5): Comparison of performance of secondary battery systems at 20°C [19].
52
2.10 Effect of Temperature
The performance of the various secondary batteries over a wide
temperature range is shown in figure (2.6) on a gravimetric basis. In this
figure, the specific energy for each battery system is plotted from -40 to
60°C at about the C/5 discharge rate. The lithium ion system has the
highest energy density at -20°C. The sintered-plate nickel-cadmium and
nickel-metal hydride batteries show higher percentage retention. In general
the low-temperature performance of the alkaline batteries is better than the
performance of the lead-acid batteries, again with the exception of the
nickel-iron system. The lead-acid system shows better characteristics at the
higher temperatures. These data are necessarily generalized for the
purposes of comparison and present each system under favorable discharge
conditions. The performance is strongly influenced by the specific
discharge conditions [19].
Figure (2.6): Effect of temperature on specific energy of secondary battery systems at approximately C/ 5 discharge rates [19].
53
2.11 Charge Retention (Self-Discharge)
The charge retention of most of the conventional secondary batteries
is poor. Normally, secondary batteries are recharged on a periodic basis or
maintained on ‘‘float’’ charge if they are to be in a state of readiness. Most
alkaline secondary batteries, especially the nickel oxide batteries, can be
stored for long periods of time even in a discharged state without
permanent damage and can be recharged when required for use. The lead-
acid batteries, however, cannot be stored in a discharged state because
sulfation of the plates, which is detrimental to battery performance, will
occur. Figure (2.7) shows the charge retention properties of several
different secondary battery systems. These data are also generalized for the
purpose of comparison. There are wide variations of performance
depending on design and many other factors, with the variability increasing
with increasing storage temperature. Typically, the rate of loss of capacity
decreases with increasing storage time. The silver secondary batteries, the
Zn/Mn rechargeable battery, and lithium-ion systems have the best
charge retention characteristics of the secondary battery systems with
typical lithium ion batteries; self-discharge is typically 2% per month at
ambient temperature. Low-rate silver cells may lose as little at 10 to 20%
per year, but the loss with high-rate cells with large surface areas could be
5 to 10 times higher. The vented pocket- and sintered plate nickel-cadmium
batteries and the nickel-zinc systems are next; the sealed cells and the
nickel-iron batteries have the poorest charge retention properties of the
alkaline systems.
54
Figure (2.7): Capacity retention of secondary battery systems [19].
The charge retention of the lead-acid batteries is dependent on the
design, electrolyte concentration, and formulation of the grid alloy as well
as other factors. The charge retention of the standard automotive SLI
batteries using the standard antimonial-lead grid is poor and these batteries
have little capacity remaining after six-month’ storage at room temperature.
The low antimonial-lead designs and the maintenance-free batteries have
much better charge retention with losses on the order of 20 to 40% per year
[19].
2.12 Life
The depth of discharge (DOD), for example, as illustrated in figure
(2.7) and the charging regime strongly influences the battery’s life. Of the
55
conventional secondary systems, the nickel-iron and the vented pocket-type
nickel cadmium batteries are best with regard to life cycle and total
lifetime. The nickel-hydrogen battery, developed mainly for aerospace
applications, has demonstrated very long life cycle under shallow depth of
discharge. The lead-acid batteries do not match the performance of the best
alkaline batteries. The pasted cells have the shortest life of the lead-acid
cells; the best life cycle is obtained with the tubular design, and the Plante´
design has the best lifetime.
One of the disadvantages of using zinc, lithium, and other metals
with high negative standard potentials in rechargeable batteries is the
difficulty of successful recharging and obtaining good cycle and calendar
lives. The nickel-zinc battery has recently been improved to provide
extended life cycle as seen in figure (2.8). The lithium-ion system,
however, has also been shown to have a good life cycle [19].
Figure (2.8): Effect of depth of discharge on cycle life of secondary battery systems [19].
56
2.13 Charge Characteristics
The typical charge curves of the various secondary aqueous-systems
at normal constant current charge rates are shown in figure (2.9). Most of
the batteries can be charged under constant-current conditions, which is
usually the preferred method of charging, although, in practice, constant-
voltage or modified constant-voltage methods are used. Some of the sealed
batteries, however, may not be charged by constant-voltage methods
because of the possibility of thermal runaway. Generally, the vented nickel-
cadmium battery has the most favorable charge properties and can be
charged by a number of methods and in a short time.
These batteries can be charged over a wide temperature range and
can be overcharged to some degree without damage. Nickel-iron batteries,
sealed nickel-cadmium batteries, and sealed nickel /metal hydride batteries
have good charge characteristics, but the temperature range is narrower for
these systems. The nickel /metal hydride battery is more sensitive to
overcharge, and charge control to prevent overheating is advisable. The
lead-acid battery also has good charge characteristics, but care must be
considered to prevent excessive overcharging.
The zinc /manganese dioxide and zinc / silver oxide batteries are
most sensitive with regard to charging; overcharging is very detrimental to
battery life. Figure (2.10) shows typical constant current–constant voltage
charging characteristics of an 18650 lithium ion battery.
57
Figure (2.9): Typical charge characteristics of secondary battery systems, constant-current charge at 20C [19].
Figure (2.10): Charging characteristics of a typical cylindrical 18650 lithium ion battery at 20°C. Battery is charged at constant current of 1.8 Amps (nominal C rate) to 4.2 Volts followed by a taper charge at this voltage for a total time of 2 hours [19].
Many manufacturers are now recommending ‘‘fast’’ charge methods
to meet consumer and application demand for recharging in less than 2 to 3
58
h. These methods require control to cut off the charge before an excessive
rise in gassing, pressure, or temperature occurs. These could cause venting
or a more serious safety hazard, or they could result in a deleterious effect
on the battery’s performance or life. Pulse charging is also being employed
with some systems to provide higher charge rates.
In general, control techniques are useful for recharging most
secondary batteries. They can be employed in several ways: to prevent
overcharging, to facilitate ‘‘fast’’ charging, to sense when a potentially
deleterious or unsafe condition may arise and cut off the charge or reduce
the charging rate to safe levels. Similarly, discharge controls are also being
used to maintain cell balance and to prevent over discharge.
Another approach is the ‘‘smart’’ battery. These batteries incorporate
features. Like:
1. To control the charge so that the battery can be charged optimally and
safely.
2. For fuel gauging to indicate the remaining charge left in the battery.
3. Safety devices to alert the user to unsafe or undesirable operation or to
cut off the battery from the circuit when these occur [19].
2.14 Cost
The cost of a secondary battery may be evaluated on several bases,
depending on the mode of operation. The initial cost is one of the bases for
59
consideration. Other factors are the number of charge-discharge cycles that
are available, or the number delivered in an application, during a battery’s
lifetime, or the cost determined on a dollar-per-cycle or dollar-per total-
kilowatt-hour basis. The cost of charging, maintenance, and associated
equipment may also have to be considered in this evaluation. In an
emergency standby service or SLI-type application, the important factors
may be the calendar life of the battery (rather than as cycle life) and the
cost is evaluated on a dollar-per-operating-year basis [19].
2.15 General Information for Selection of Batteries for Photovoltaic
Systems
At night and during continuing overcast days, the energy stored in
the battery subsystem can be depleted. When the battery voltage drops
below a predetermined value, the auxiliary DC power supply cuts in to
carry the load and recharges the battery.
In the simplest stand-alone system, the only components which may
appear to be needed are the solar module, the battery and the DC load. The
battery is sized to accept the highest power output from the solar panel
without overcharge damage.
In most cases, however, insulations are not that predictable, and the
array output varies over such a wide range that charge regulators are
needed and recommended to control charging current. A low voltage
disconnect is also recommended to protect the battery from deep discharge.
60
The battery stores excessive energy generated by the solar array
during bright days of high insulations and discharges this stored energy
back into the load at night or on overcast days. For a continuous power
output capability, the battery is a very essential component. Batteries can
be selected to give a higher peak output than the solar array to provide:
• High peak energy for starting motors or engines.
• For opening and closing circuit breakers.
• For steady power output for long periods of time.
In addition, the battery can repeat these functions through many
charge / discharge cycles within a wide temperature range during its long
life. Correct battery selection and sizing are most important to the success
of the solar photovoltaic system [23].
2.16 Key Elements in Battery Selection
Selection of the proper battery for a solar photoyo1taic system
requires a complete analysis of the battery discharge requirements. The
kilowatt-hours of energy stored in the battery will depend upon the load
requirements, the number of days of storage, the insulations patterns in the
geographical area of the installation and the solar array output.
Factors in sizing the battery are operating temperature variations,
environmental temperature extremes and weekly / daily use age, the
voltage regulator design, and the efficiency of the inverter.
61
The energy required to charge a battery will be the sum of the
previous discharge energy output and the energy expended as work and
excessive heat during the recharge. Longer charge times and lower charge
currents tend to increase charge efficiency.
In lead-acid batteries, turn around energy efficiency can approach 85
percent. Shorter charge times and higher charge currents will sacrifice
energy efficiency and battery life. Charge time and power available from
the solar array must, therefore, be considered in selecting the battery type
and size.
The analysis of the application requirements must include as a
minimum the review of the following performance parameters:
• The minimum and maximum operating voltage of electronic equipment,
battery and components of the load: i.e., the voltage window.
• The power cycle including all sequences of charge and discharge.
• The power output profile of the photovoltaic panel predicted at the site
under the prevailing insulations patterns.
• Seasonal and environmental variations.
• Availability and frequency of maintenance.
A corresponding study of the photovoltaic panel output must
establish the sequential pattern of power output and duration expected on
site for the full period of the system operation for not less than one year.
62
Seasonal (and yearly) variations may show, as in figure (2.11), that
excessive power may be expected during high insulations months but that,
in some months, the power required by the anticipated load can exceed
power available from the solar panel. Unbalance of power requirements of
this kind must be corrected by increasing the panel size, by power
conservation in the load, or by use of an auxiliary power source. From the
analysis above considerations must establish:
• The size of the photovoltaic panel/array required to provide the energy for
the load and for recharging the battery subsystem.
• The recharging time and power available.
• The size of the battery required for energy storage, i.e., number of cells in
series and parallel, the individual cell capacity, the subsystem storage
energy in kilowatt-hours and capacity in ampere-hours.
Battery cell type, plate and separator designs must then be selected in
consultation with the sales engineers representing the battery supplier. Cell
design must match the highest charge and discharge rates and the extremes
in operating temperature predicted for the battery under conditions at each
site. The battery supplier must provide operating voltage data to assure the
system designer that the required capacities are delivered within the
specified acceptable voltage range, over the expected range of
environmental conditions.
63
Figure (2.11): Solar array system load power requirement [23].
For each load period in the duty cycle, the battery supplier can select
from the product line cells with the most desirable number of plates, plate
thickness, active material density, plate grid design, specific gravity and
separator system to control the cell and battery performance.
The battery maintenance must also be considered. Visiting remote
installations for the purpose of the system or battery maintenance can
require a substantial transportation and labor cost. Maintenance-free or
reduced maintenance batteries are attractive in these applications if other
performance attributes are also demonstrated. Replacement of water loss
from overcharge electrolysis of battery electrolyte is the major task of
maintenance in vented batteries, both lead-acid and nickel-cadmium. Other
tasks keep inter cell and inter-row battery connections tight and the battery
clean and dry. Maintenance can be scheduled from knowledge of the
overcharge in the duty cycle and the number of cycles per week.
The battery operating life in the solar PV system is a function of the
operating temperature, the duty cycle, the depth of discharge, the charge
64
control and the cell design. Significantly, the higher average operating
temperature decreases life and the number of available charge-discharge
cycles decreases with increasing depth of discharge.
In general, longer-life batteries have a higher initial cost. Replacing a
battery, especially a very large array of cells, can be a substantial element
in storage battery costs. Economic studies should be made to reflect the
sum of initial battery price, installation costs, operating and maintenance
costs, and the cost of replacement. The overall price of a long-life battery
may be less than the price of two shorter-life batteries when all factors are
considered. The battery manufacturer or supplier can provide an estimate of
the operating life of each battery type on the market when the operating
time-temperature and duty cycles are well known [23].
65
Chapter Three
Lead Acid Battery
66
Chapter Three Lead Acid Battery
3.1 General Characteristics of Electrolyte Lead Acid Battery
The lead-acid battery has been a successful article of commerce for
over a century. Its production and use continue to grow because of new
applications for battery power in energy storage, emergency power, and
electric and hybrid vehicles (including off-road vehicles) and because of
the increased number of vehicles for which it provides the energy for
engine starting, vehicle lighting, and engine ignition (SLI). This battery
system is also used extensively in telephone systems, power tools,
communication devices, emergency lighting systems, and as the power
source for mining and material-handling equipment. The wide use of the
lead-acid battery in many designs, sizes, and system voltages is accounted
for by the low price and the ease of manufacture on a local geographic
basis of this battery system. The lead-acid battery is almost always the least
expensive storage battery for any application, while still providing good
performance and life characteristics.
The overall advantages and disadvantages of the lead-acid battery,
compared with other systems, are listed in table (3.1).
67Table (3.1): Major advantages and disadvantages of lead-acid batteries [19].
Advantages Disadvantages 1. Popular low-cost secondary battery—capable of manufacture on a local basis, worldwide, from low to high rates of production 2. Available in large quantities and in a variety of sizes and designs—manufactured in sizes from smaller than 1 Ah to several thousand Ampere-hours 3. Good high-rate performance —suitable for engine starting 4. Moderately good low- and high-temperature performance Electrically efficient—turnaround efficiency of over 70%, comparing discharge energy out with charge energy in 6. High cell voltage—open-circuit voltage of >2.0 V is the highest of all aqueous electrolyte battery systems 7. Good float service 8. Easy state-of-charge indication 9. Good charge retention for intermittent charge applications (if grids are made with high overvoltage alloys) 10. Available in maintenance-free designs 11. Low cost compared with other secondary batteries 12. Cell components are easily recycled
1. Relatively low cycle life (50–500 cycles) 2. Limited energy density—typically 30–40 Wh/kg 3. Long-term storage in a discharged condition can lead to irreversible polarization of electrodes (sulfation) 4. Difficult to manufacture in very small sizes (in mAh size) Hydrogen evolution in some designs can be an explosion hazard (flame arrestors are installed to prevent this hazard) 6. Stibene and arsine evolution in designs with antimony and arsenic in grid alloys can be a health hazard 7. Thermal runaway in improperly designed batteries or charging equipment 8. Positive post blister corrosion with some designs
The lead-acid battery is manufactured in a variety of sizes and
designs, ranging from less than 1 to over 10,000 Ah. Table 3.2 lists many
of the various types of lead-acid batteries that are available [19].
68Table (3.2): Types and characteristics of lead-acid batteries [19].
Type Construction Typical applications SLI (starting, lighting, ignition)
5. Modified constant potential with constant initial current.
6. Modified constant potential with a constant finish rate.
7. Modified constant potential with a constant start and finish rate.
8. Taper charge.
9. Pulse charging.
10. Trickle charging.
11. Float charging.
12. Rapid charging.
3.8.2.1 Constant-current charging
Constant-current recharging, at one or more current rates, is not
widely used for lead-acid batteries. This is because of the need for current
adjustment unless the charging current is kept at a low level throughout the
charge (Ampere-hour rule), which will result in long charge times of 12 h
or longer. Typical charger and battery characteristics for the constant-
current charge, for single and two-step charging are shown in figure (3.9).
Constant-current charging is used for some small lead-acid batteries.
Constant-current charging is also used at times in the laboratory because of
84
the convenience of calculating Ampere-hour input and because constant-
current charging can be done with simple, inexpensive equipment.
Constant-current charging at half the 20- h rate can be used in the field to
decrease the sulfating in batteries which have been over discharged or
undercharged. This treatment, however, may diminish the battery life and
should be only used with the advice of the battery manufacturer [19].
Figure (3.9): Typical charger and battery characteristics for constant-current charging of lead-acid batteries. (a) Single-step constant-current charging. (b) Two-step constant-current charging [19].
85
3.8.2.2 Constant-potential charging
The characteristics of constant-potential and modified constant-
potential charging are illustrated in figure (3.10). In normal industrial
applications, modified constant-potential charging methods are used
(methods 5, 7, and 8). Modified constant potential charging (method 5) is
used for on-the-road vehicles and utility, telephone, and uninterruptible
power system applications where the charging circuit is tied to the battery.
In this case, the charging circuit has a current limit, and this value is
maintained until a predetermined voltage is reached. Then, the voltage is
maintained constant until the battery is called on to discharge. Decisions
must be made regarding the current limit and the constant - voltage value.
This is influenced by the time interval when the battery is at the constant
voltage and in a 100% state of charge. For this ‘‘float’’-type operation with
the battery always on charge, a low charge current is desirable to minimize
overcharge, grid corrosion associated with overcharge, water loss by
electrolysis of the electrolyte, and maintenance to replace this water.
Achieving a full recharge with a low constant potential requires the proper
selection of the starting current, which is based on the manufacturer’s
specifications.
The modified constant-potential charge, with constant start and
finish rates, is common for deep-cycling batteries which are typically
discharged at the 6-h rate to a depth of 80%; the recharge is normally
completed in an 8-h period. The charger is set for the constant potential of
2.39 V per cell (the gassing voltage), and the starting current is limited to
86
16 to20 A per 100 Ah of the rated 6-h Ampere-hour capacity by means of a
series resistor in the charger circuit. This initial current is maintained
constant until the average cell voltage in the battery reaches 2.39 V. The
current decays at constant voltage to the finishing rate of 4.5 to 5 A per 100
Ah, which is then maintained to the end of the charge. Total charge time is
controlled by a timer. The time of charge is selected to ensure a recharge
input capacity of a predetermined percent of the Ampere-hour output of the
previous discharge, normally 110 to 120%, or 10 to 20% overcharge. The
8-h charging time can be reduced by increasing the initial current limit rate
[19].
Figure (3.10): Typical charger and battery characteristics for constant-potential charging of lead-acid batteries. (a) Constant-potential charging. (b) Modified constant-potential charging [19].
87
3.8.2.3 Taper charging
Taper charging is a variation of the modified constant-potential
method, using less sophisticated controls to reduce equipment cost. The
characteristics of taper charging are illustrated in figure (3.11). The initial
rate is limited, but the taper of voltage and current is such that the 2.39 V
per cell at 25°C is exceeded prior to the 100% return of the discharge
ampere-hours. This method does result in gassing at the critical point of
recharge, and the cell temperature is increased. The degree of gassing and
temperature rise is a variable depending on the charger design, and the
battery life can be degraded from excessive battery temperature and
overcharge gassing.
The end of the charge is often controlled by a fixed voltage rather
than a fixed current. Therefore when a new battery has a high counter-
EMF, this final charge rate is low and the battery often does not receive
sufficient charge within the time period allotted to maintain the optimum
charge state. During the latter part of life when the counter-EMF is low, the
charging rate is higher than the normal finishing rate, and so the battery
receives excessive charge, which degrades life. Thus the taper charge does
degrade the battery life, which must be justified by the use of less
expensive equipment.
88
Figure (3.11): Typical charger and battery characteristics for taper charging of lead-acid batteries. (a) Single-step taper charge. (b) Two-step taper charge [19].
For photovoltaic battery systems and other systems designed for
optimum life, charging control and regulation circuits should produce a
pattern of voltage and current equivalent to the best industrial circuits.
Modified constant-potential charging methods with constant initial current
(methods 5 and 7) are preferred. Optimum control to maximize the life and
energy output from the battery is best achieved when the depth of discharge
and the time for recharge are predetermined and repetitive, a condition
which is not always realized in solar photovoltaic applications [19].
3.8.2.4 Pulse charging
Pulse charging is also used for traction applications, particularly in
Europe. In this case, the charger is periodically isolated from the battery
89
terminals and the open circuit voltage of the battery is automatically
measured (an impedance-free measurement of the battery voltage). If the
open-circuit voltage is above a preset value, depending on a reference
temperature, the charger does not deliver energy. When the open-circuit
voltage decays below that limit, the charger delivers a DC pulse for a fixed
time period. When the battery state of charge is very low, the charging
current is connected almost 100% of the time because the open-circuit
voltage is below the present level or rapidly decays to it. The duration of
the open-circuit and the charge pulses are chosen so that when the battery is
fully charged, the time for the open-circuit voltage to decay is exactly the
same as the pulse duration. When the charger controls sense this condition,
the charger is automatically switched over to the finish rate current and
short charging pulses are delivered periodically to the battery to maintain it
at full charge. In many industrial applications high-voltage batteries may be
used and the difficulty can be encountered in keeping the cells in a
balanced condition. This is particularly true when the cells have long
periods of standby use with different rates of self-decay. In these
applications the batteries are completely discharged and recharged
periodically (usually semiannually) in what is called an equalizing charge,
which brings the whole string of cells back to the complete charge state. On
completion of this process, the liquid levels in the cells must be checked
and water added to depleted cells as required. With the newer types of
maintenance-free cells, which are semi sealed, such equalizing charges and
differential watering of the cells may not be possible, and special
90
precautions are taken in the charger design to keep the cells at an even state
of charge [19].
3.8.2.5 Trickle charging
A trickle charge is a continuous constant-current charge at a low
(about C/100) rate, which is used to maintain the battery in a fully charged
condition, recharging it for losses due to self-discharge as well as to restore
the energy discharged during intermittent use of the battery. This method is
typically used for SLI and similar type batteries when the battery is
removed from the vehicle or its regular source of charging energy for
charging [19].
3.8.2.6 Float charging
Float charging is a low-rate constant-potential charge which is also
used to maintain the battery in a fully charged condition. This method is
used mainly for stationary batteries which can be charged from a DC bus.
The float voltage for a non-antimonial grid battery containing 1.210
specific gravity electrolytes and have an open-circuit voltage of 2.059 V
per cell is 2.17 to 2.25 V per cell [19].
3.8.2.7 Rapid charging
In many applications, it is desirable to be able to rapidly recharge the
battery within an hour or less. As is the case under any charging condition,
it is important to control the charge to maintain the morphology of the
electrode, to prevent a rise in the temperature, particularly to a point where
91
deleterious side reactions (corrosion, conversion to non-conducting oxides,
high solubility of materials, decomposition) take place, and to limit
overcharge and gassing. As these conditions are more prone to occur
during high-rate charging, charge control under these conditions is critical.
The availability of small, low-cost but sophisticated semiconductor
chips has made effective methods of controlling the charging voltage-
current-profile feasible. These devices can be used to terminate the charge,
limit the charge current, or switch between charge regimes when
potentially damaging conditions arise during the charge.
A number of different techniques have been developed for effective
rapid recharge. In one method, referred to as ‘‘reflex’’ charging, a brief
discharge pulse of a fraction of a second, is incorporated into the charging
regime. This technique has been found to be effective in preventing an
excessive rise in temperature during rapid (15-min) high-rate recharging
[19].
3.9 Maximum Battery Subsystem Voltage
Selection of the battery voltage at top-of-charge and the number of
cells in a series string is critical to successful operation and maximum life.
The photovoltaic system has a voltage window, a voltage range from
the lowest to the highest limits acceptable to meet operating requirements.
The number of cells in series in the battery subsystem times the average
cell discharge end voltage must be greater than the lower voltage window
limit.
92
Where this number of cells in series is used to set the upper voltage
limit in the window, the calculation may show the upper voltage limit is not
sufficiently high to charge the battery in the allotted time. A compromise
must then be made [23].
3.10 Selection of Charge Current
Selection of charge currents for the initial high rate and final low rate
charge periods is complicated by the following restraints:
• Completing the charge in the required time.
• Remaining within the voltage limits.
• Charging at rates which restore discharge capacity without excessive
temperature rise.
Initial charge currents allowed range up to 20-25 A per 100 Ah at the
rated 5-h capacity. Final or finishing constant charge current ranges from 3-
5 A per 100 Ah at the rated 5-h capacity. During the last hours of charge at
the finishing rate, cell charge voltage increases with increasing finishing
rate. Finishing rate of 5 A per 100 Ah is end-of charge.
Voltage for newly produced cells can vary from 2.5 to 2.90 volts at
25°C depending upon the cell design and composition of the grids and the
active materials. As battery life progresses the end-of-charge voltage for
pure lead and lead-calcium cells remains essentially constant. For lead-
antimony cells the end-of-charge voltage decays progressively during their
cycle life to values as low as 2.4 volts after 2000 deep cycles.
93
The effect of initial charge rate and charging voltage on charge time
is shown in table (3.7) for the case of a modified constant potential charge
where the end-of-charge current is governed by the preset potential.
Summarizing, to decrease charge time while maintaining a consistent
state-of-charge, the following procedures should be used:
• Increase the initial charge current up to a maximum value of 25 A/100 Ah
rated 5-h cell capacity.
• Use the highest setting of constant potentia1 during the initia1 charge
current period without exceeding the temperature compensated cell
gassing vo1tage.
• Use three step charge with final finishing current controlled at 5A/100 Ah
at the 5-hr rated cell capacity.
• Allow time for a prolonged equalization charge at some regular interval
of accumulated discharge capacity [23].
3.11 Effect of Specific Gravity of Electrolyte and their Operating
Temperature
Another design consideration is the specific gravity of the
electrolyte. Discharge capacity in any single cycle increases with an
increase in specific gravity. The amount of increase will depend upon the
discharge rate, the active material density and the ratio of active material to
acid electrolyte.
94
When specific gravity is increased, the charge stand life and 1ife
cycle will be decreased. Estimates of this loss can be made by the battery
manufacturer for the particular battery under consideration.
The specific gravity increases during recharge and decreases during
discharge. At low operating temperatures, the specific gravity can become
so low that its freezing temperature is reached and thus terminating the
discharge prematurely and interfering with the subsequent charge [23].
3.12 Watering Cells
During normal operation, water is lost from a battery as the result of
evaporation and electrolysis into hydrogen and oxygen which escape into
the atmosphere. Evaporation is a relatively small part of the loss except in
very hot, dry climates. With a fully charged battery, electrolysis consumes
water at a rate of 0.336 cubic capacities (cc) per Ah overcharge. A 500 Ah
cell overcharged 10 percent can thus lose 16.8 cc, or about 0.3% of its
water, each cycle.
Since replacing water can be a major maintenance cost, water loss
can be reduced by controlling the amount of overcharge and by using
hydrogen and oxygen recombining devices in each cell where possible.
Addition of water is best accomplished after recharge and before an
equalization charge.
Add water to reach the high acid level line at top-of-charge. Gassing
during charge will stir the water into the acid uniformly. Do not add water
95
in a very cold weather when it may freeze before mixing. The water added
must be distilled water, dematerialized water, or local water which has been
approved for use in batteries.
Automatic water Labor costs further more. Overfilling must be
avoided as the resultant overflow of acid electrolyte will cause tray
corrosion, ground paths, and loss of cell capacity.
A final check of specific gravity should be made after water is added
to assure correct acid concentration at the top-of-charge. A helpful
approximation given in the literature [23] is given in the equation (3.8):
Specific Gravity = Open Circuit Voltage of the Cell - 0.845 (3.8)
Where, the open circuit voltage is for only one elementary lead acid cell
(i.e. 1.75V – 2.4V) and the obtained specific gravity in kg per liter.
This permits electrical monitoring of specific gravity on an
occasional basis [23].
3.13 Maintenance Safety and Operational Features
It is common for industrial lead-acid batteries to function for periods
of 10 years or longer. Proper maintenance can ensure this extended useful
life. Five basic rules of proper maintenance are:
1. Match the charger to the battery charging requirements.
2. Avoid over discharging the battery.
96
3. Maintain the electrolyte at the proper level (add water as required).
4. Keep the battery clean.
5. Avoid overheating the battery.
In addition to these basic rules, as the battery is made of individual
cells connected in series, the cells must be properly balanced periodically.
The following points are related to operation and maintenance of batteries.
a. Charging practice: Poor charging practice is responsible for short
battery life more than any other cause. Fortunately, the inherent
physical and chemical characteristics of lead-acid batteries make
control of charging quite simple. If the battery is supplied with DC
energy at the proper charging voltage, the battery will draw only the
amount of the current that it can accept efficiently, and this current will
reduce as the battery approaches full charge. Several types of devices
can be used to ensure that the charge will terminate at the proper time.
The specific gravity of the electrolyte should also be checked
periodically for those batteries that have a removable vent and adjusted
to the specified value.
b. Over discharge: Over discharging the battery should be avoided. The
capacity of large batteries, such as those used in industrial trucks, is
generally rated in Ampere-hours at the 6-h discharge rate to a final
voltage of 1.75 V per cell. These batteries can usually deliver more
than rated capacity, but this should be done only in an emergency and
not on a regular basis. Discharging cells below the specified voltage
97
reduces the electrolyte to a low concentration, which has a deleterious
effect on the pore structure of the battery.
c. Electrolyte level: During normal operation, water is lost from a battery
as the result of evaporation and electrolysis into hydrogen and oxygen,
which escape into the atmosphere. Evaporation is a relatively small
part of the loss, except in very hot, dry climates. With a fully charged
battery, electrolysis consumes water at a rate of 0.336 cm3 per Ampere-
hour overcharge. A 500-Ah cell overcharged 10% can thus lose
16.8 , or about 0.3% of its water each cycle. It is important that the
electrolyte does maintained at the proper level in the battery. The
electrolyte not only serves as the conductor of electricity but also is a
major factor in the transfer of heat from the plates. If the electrolyte is
below the plate level, then an area of the plate is not electrochemically
active; this causes a concentration of heat in other parts of the cell.
Periodic checking of water consumption can also serve as a rough
check on charging efficiency and may warn when adjustment of the
charger is required.
d. Cleanliness: Keeping the battery clean will minimize corrosion of cell
post connectors and steel trays and avoid expensive repairs. Batteries
commonly pick up dry dirt, which can be readily blown off or brushed
away. This dirt should be removed before moisture makes it a
conductor of stray currents. One problem is that the top of the battery
can become wet with electrolyte any time a cell is overfilled. The acid
in this electrolyte does not evaporate and should be neutralized by
98
washing the battery with a solution of baking soda and hot water,
approximately 1 kg of baking soda to 4 L of water. After the
application of such a solution, the area should be rinsed thoroughly
with water.
e. High temperature overheating: One of the most detrimental
conditions for a battery is high temperature, particularly above 55°C,
because the rates of corrosion, solubility of metal components, and
self-discharge increase with increasing temperature. High operating
temperature during cycle service requires a higher charge input to
restore discharge capacity and local action (self-discharge) losses.
More of the charge input is consumed by the electrolysis reaction
because of the reduction in the gassing voltage at the higher
temperature. While a 10% overcharge per cycle maintains the state of
charge at 25 to 35°C, 35 to 40% overcharge may be required to
maintain the state of charge at the higher (60 to 70°C) operating
temperatures. On float service, float currents increase at higher
temperatures, resulting in reduced life. Eleven days float at 75°C is
equivalent in life to 365 days at 25°C. Batteries intended for high-
temperature applications should use a lower initial specific gravity
electrolyte than those intended for use at normal temperatures. Other
design features, such as the use of more expander in the negative plate,
are also important to improve operation at high temperatures.
f. Cell balancing: During cycling, a high-voltage battery having many
cells in a series string can become unbalanced, with certain cells
99
limiting charge and discharge. Limiting cells receive more overcharge
than other cells in the string, have greater water consumption, and thus
require more maintenance. The equalization charge has the function of
balancing cells in the string at the top of charge. In an equalization
charge, the normal recharge is extended for 3 to 6 h at the finishing rate
of 5 A per 100 Ah, 5-h rated capacity, allowing the battery voltage to
rise uncontrolled. The equalization charge should be continued until
cell voltages and specific gravities rise to a constant, acceptable value.
Frequency of equalization charge is normally a function of the
accumulative discharge output and will be specified by the
manufacturer for each battery design and application [19].
100
Chapter Four Nickel – Cadmium Battery
101
Chapter Four Nickel – Cadmium Batteries
The vented pocket-plate battery is the oldest and most mature of the
various designs of nickel-cadmium batteries available. It is a very reliable,
sturdy, long-life battery, which can be operated effectively at relatively
high discharge rates and over a wide temperature range. It has very good
charge retention properties, and it can be stored for long periods of time in
any condition without deterioration. The pocket-plate battery can stand
both severe mechanical abuse and electrical maltreatment such as
overcharging, reversal, and short circuiting. Little maintenance is needed
on this battery. The cost is lower than for any other kind of alkaline storage
battery; still, it is higher than that of a lead-acid battery on a per Watt hour
basis. The major advantages and disadvantages of this type of battery are
listed in Table (4.1).
The pocket plate battery is manufactured in a wide capacity range, 5
to more than 1200 Ah, and it is used in a number of applications. Most of
these are of an industrial nature, such as railroad service, switchgear
operation, telecommunications, uninterruptible power supply, and
emergency lighting. The pocket plate battery was also used in military and
space applications.
The pocket plate batteries are available in three plate thicknesses to
suit the variety of applications. The high-rate designs use thin plates for
maximum exposed plate surface per volume of active material. They are
used for the highest-rate discharge. The low-rate designs use thick plates to
102
obtain maximum volume of active material per exposed plate surface.
These types are used for long-term discharge. The medium-rate designs use
plates of middle thickness and are suited for applications between, or
combinations of, high-rate and long term discharge [19].
Table (4.1): Major advantages and disadvantages of industrial and aerospace nickel- cadmium batteries [19].
Advantages Disadvantages 1. Long cycle life. 2.Rugged; can withstand electrical and physical abuse. 3. Reliable; no sudden death contains cadmium. 4. Good charge retention. 5. Excellent long-term storage. 6. Low maintenance.
1. Low energy density. 2. Higher cost than lead-acid batteries. 3. Contains cadmium.
4.1 Chemistry
The basic electrochemistry is the same for the vented pocket plate,
sintered plate, fiber and plastic-bonded plate types as well as for other
variations of the nickel-cadmium system. The reactions of charge and
discharge can be illustrated by the following simplified equation:
(4.1)
On discharge, trivalent nickel oxy-hydroxide is reduced to divalent
nickel hydroxide with consumption of water. Metallic cadmium is oxidized
to form cadmium hydroxide. On charge, the opposite reactions take place.
The electromotive force (EMF) is 1.29 V [19].
The electrodes are assembled in their discharged state and
for the positive and negative electrodes, respectively. NiCd
103
batteries are sometimes categorized by the form of the current collector
used pocket, sintered, fiber, or foam. The pocket plate design comes from
Jungner. The active electrode materials are packed in channels formed from
perforated steel.
Sintered nickel electrodes were subsequently developed to increase
the contact area with the active electrode materials and, so, increase their
power output. Fiber electrodes are a mat of sintered nickel plated fibers.
Nickel metal foams have a very high porosity, about 90 percent open area.
Sintered plate porosities are in the 80 percent to 85 percent range. Greater
porosity means more active material can be loaded into the current
collector electrodes thereby increasing energy density.
The negative electrode is made of cadmium hydroxide , up
to 25 percent iron and small quantities of Ni and graphite. Cobalt oxide is
added to the positive electrode material, which forms an
electrically conductive coating of cobalt oxy hydroxide, Co(O)OH, on the
surface of the particles during cell conditioning.
NiCd electrolytes are aqueous solutions of 20 percent to 32 percent
potassium hydroxide (KOH) with up to 2 percent lithium hydroxide
(LiOH). Button cell sizes are also available. Typical voltage behaviors
during discharge and charge are shown in figure (4.1). An overview of
NiCd characteristics is given in table (4.2).
Oxygen ( ) is formed at the positive electrode, though, by
oxidizing water in the electrolyte solution:
104
(4.2)
The so formed can diffuse to the negative electrode where it
reacts with Cd to form:
(4.3)
Naturally, the charging current cannot exceed the rate of
reduction or pressure will build within the cell [22].
Figure (4.1): Voltage behavior for a nickel cadmium cell during discharge and charge [22].
105Table (4.2): Overview of nickel-cadmium cell attributes [22].
Attribute DescriptionNegative active material
Cadmium (Cd). Contains iron, Ni, and graphite. Negative electrode reaction (discharge left to right, charge right to left):
Positive active material
Nickel oxy hydroxide (Ni(O)OH). Contains CoO and graphite Positive electrode reaction (discharge left to right, charge right to left):
Electrolyte 20 % to 32% potassium hydroxide (KOH) and up to
2% lithium hydroxide (LiOH) in water Battery reactions (discharge left to right, charge right to left)
Nominal cell voltage
1.30 V
Discharge voltage profile
Flat
Self-discharge 5% to 20% per month Energy density 18 to 75 Wh and 30 to 220 Wh Commonly available types
Cylindrical cells in a variety of sizes from AAA to D, as well as fractional sizes Button cells Prismatic, including 9V
4.2 Performance Characteristics
4.2.1 Discharge properties
The discharge parameters of concern are cell (or battery) voltage and
capacity (the integral of current multiplied by time). The values of these
two discharge parameters are functions of a number of application-related
factors. The general shape of the discharge curve, voltage as a function of
capacity (or time if the current is uniform), is shown in Figure (4.2). The
106
discharge voltage of the electrolyte nickel-cadmium cell typically remains
relatively constant until most of its capacity is discharged. It then drops off
rather sharply. The area of relatively constant voltage is called the voltage
plateau. The flatness and the length of this plateau relative to the length of
the discharge are major features of electrolyte nickel-cadmium cells and
batteries [21].
Figure (4.2): Nickel-cadmium cell discharge curve constant current [21].
The nominal voltage of a nickel-cadmium battery is 1.3 V. Although
discharge rate and temperature are of importance for the discharge
characteristics of all electrochemical systems, these parameters have a
much smaller effect on the nickel-cadmium battery than on, for instance,
the lead-acid battery. Thus pocket plate nickel-cadmium batteries can be
effectively discharged at high discharge rates without losing much of the
rated capacity. They can also be operated over a wide temperature range.
107
Typical discharge curves at room temperature for pocket plate and
plastic-bonded plate batteries at various constant discharge rates are shown
in figure (4.3). Even at a discharge current as high as 5C (where C is the
numerical value of the capacity in Ah), a high-rate pocket plate battery can
deliver 60% of the rated capacity and a plastic-bonded battery as much as
80%.
Pocket-plate nickel-cadmium batteries can be used at temperatures
down to (-20°C) with the standard electrolyte. Cells filled with a more
concentrated electrolyte can be used down to (-50°C). Figure (4.3) shows
the effect of temperature on the relative performance of a nickel-cadmium
medium-rate battery with standard electrolyte.
Batteries can also be used at elevated temperatures. Although
occasional operation at very high temperatures is not detrimental, 45 to
50°C is generally considered as the maximum permissible temperature for
extended periods of operation.
Occasional over discharge or reversal of nickel-cadmium batteries is
not detrimental, nor is complete freezing of the cells. After warming up,
they will function normally again [19].
108
Figure (4.3): Charge and discharge characteristics of nickel-cadmium batteries at 25ºC. (a) Pocket plate battery, high rate. (b) Plastic-bonded plate battery, high rate [19].
4.2.2 Internal resistance
Nickel-cadmium batteries generally have a low internal resistance.
Typical DC resistance values are 0.4, 1, and 2 mΩ, respectively, for a
109
charged 100-Ah high, medium, and low rate pocket plate single-cell
battery. The internal resistance is largely inversely proportional to the
battery size in a given series. Decreasing temperature and decreasing state
of charge of a battery will result in an increase of the internal resistance.
The internal resistance of fiber-plate batteries is 0.3 mΩ for a high-rate
design and 0.9 mΩ for a low-rate design. Plastic-bonded plate batteries
have an internal resistance as low as 0.15 mΩ [19].
4.2.3 Charge retention
Charge retention characteristics of vented pocket-plate batteries at
25°C are shown in figure (4.4). Charge retention is temperature-dependent,
the capacity loss at 45°C being about three times higher than at 25°C.
There is virtually no self-discharge at temperatures lower than -20°C.
Charge retention for fiber and plastic-bonded plate batteries has similar
characteristics; their charge retention corresponds to that shown in figure
(4.4) for high-rate batteries.
Figure (4.4): Charge retention of pocket plate batteries at 25ºC. [19].
110
4.2.4 Life
The life of a battery can be given either as the number of charge and
discharge cycles that can be delivered or as the total lifetime in years.
Under normal conditions a nickel-cadmium battery can reach more than
2000 cycles. The total lifetime may vary between 8 and 25 years or more,
depending on the design and application and on the operating conditions.
The batteries for diesel engine cranking normally last about 15 years, the
batteries for train lighting have normal lives of 10 to 15 years, and the
stationary standby batteries have lives of 15 to 25 years [19].
4.3.1 Charging characteristics
Nickel-cadmium cells may be charged by constant current, constant
potential or combinations of these methods. Higher charge rates can be
tolerated by NiCd cells than by lead-acid cells designed for the same
discharge rate, and rates of 25 A per 100 Ah of the 5-hour rated capacity
are commonly used without harmful effects. One method for cycle
application is to recharge at a constant current of 20 A per 100 Ah to an
input 20-40 percent greater than the previous discharge output. During a
typical constant current charge at 20 A per 100 Ah, cell voltage rises from
near 1.40 volts to the gassing voltage (1.45 volts per cell at 25°C) and then
very quickly to 1.68 volts, remaining near this voltage during overcharge
see figure (4.5) [23].
111
Figure (4.5): Constant current charge of pocket plate nickel – cadmium cell at 20A/100Ah, 25ºC [23].
4.3.2 Charging efficiency
When a nickel-cadmium battery is charging, not all of the energy
input is converting the active material to a usable (dischargeable) form.
Charge energy also goes to converting active material into an unusable
form, generating gas, or is lost in parasitic side reactions. The term charge
acceptance, which characterizes charging efficiency, is the ratio of the
dischargeable capacity obtained to the charge input.
The top curve of figure (4.6) shows the dischargeable capacity
(charge output) as a function of the charge input for an electrolyte cell
starting from a completely discharged state. The ideal cell, with no charge
acceptance losses, would be 100 per cent efficient: all the charge delivered
to the cell could be retrieved on discharge. But nickel-cadmium cells
typically accept charge at different levels of efficiency depending upon the
state of charge of the cell, as shown by the bottom curve of figure (4.6).
Four successive types of charging behavior - Zones 1, 2, 3 and 4 in figure
112
(4.6) describe this performance. Each zone reflects a distinct set of
chemical mechanisms responsible for loss of charge input energy.
Figure (4.6): Charge acceptance of an electrolyte Cell at 0.1 C and 23ºC [21].
In Zone 1 a significant portion of the charge input converts some of
the active material mass into a non-usable form, i.e. into charged material
which is not readily accessible during medium or high-rate discharges,
particularly in the first few cycles. In Zone 2, the charging efficiency is
only slightly less than 100 percent; small amounts of internal gassing and
parasitic side reactions are all that prevent the charge from being totally
efficient. Zone 3 is a transition region. As the cell approaches full charge,
the current input shifts from charging positive active material to generating
oxygen gas. In the overcharge region, Zone 4, all of the current coming in
113
to the cell goes to generating gas. In this zone the charging efficiency is
practically zero.
The boundaries between Zones 2, 3, and 4 are indistinct and quite
variable depending upon cell temperature, cell construction, and charge
rate. The level of charge acceptance in Zones 1, 2, and 3 is also influenced
by the cell temperature and charge rate [21].
4.3.3 Overcharge
Overcharge is the normal continued application of charging current
to a battery after the battery has reached its maximum state of charge. It
impacts the steady-state values of pressure, temperature, and voltage. As
discussed earlier, continued charging of fully charged cells causes the
oxygen pressure to stabilize at an elevated level within the cells. The
magnitude of the pressure increase depends primarily on the overcharge
rate. Along with this rise of pressure comes an increase in the cell
temperature. Pressure, temperature, and voltage ultimately reach
equilibrium in overcharge. Since cells are designed to reliably handle
continuous overcharge at their cell specification rate, it is not an adverse
condition. Overcharge is simply a term commonly used to describe the
normal continuation of charge after the cell is fully charged.
Standard-charge cells may overcharge at rates up to 0.1 capacity.
Quick-charge cells, designed to withstand higher overcharge rates for an
extended time, normally charge at rates up to 0.33C. Fast-charge cells,
those that may charge at 1C to 4C rates, require special charger systems
114
that automatically end high-rate charging. No matter which type of cell is
involved, overcharge at rates above the cell specification rate may result in
excessive temperatures and venting, and is therefore abusive to electrolyte
nickel-cadmium cells.
The electrode design of fast-charge and quick-charge cells speeds
recombination of oxygen at the negative electrode decreasing the pressure
in the cell at any given rate. However, fast-charge rates still generate
oxygen too rapidly to continue into overcharge without venting. Therefore,
the charge rate must be reduced when the cell approaches full charge [21].
4.4 Iron Electrode Batteries
Today, the nickel-iron battery is the most common rechargeable
system using iron electrodes. Iron-silver batteries have been tested in
special electronic applications, and iron / air batteries have shown promise
as motive power systems. The characteristics of the iron battery systems
are summarized in tables (4.3) and (4.4).
As designed by Edison, the nickel-iron battery was and is almost
indestructible. It has a very rugged physical structure and can withstand
electrical abuse such as overcharge, over discharge, discharged stand for
extended periods, and short-circuiting. The battery is best applied where
high life cycle at repeated deep discharges is required (such as traction
applications) and as a standby power source with a 10- to 20-year life. Its
limitations are low power density, poor low-temperature performance, poor
115
charge retention, and gas evolution on stand. The cost of the nickel-iron
battery lies between the lower-cost lead-acid and the higher-cost nickel-
cadmium battery in most applications, with the exception of limited use
applications in electric vehicles and mobile industrial equipment.
Most recently, iron electrodes have been considered and tested as
cathodes too. Based upon high valence state iron, Fe (VI), these cathodes
have shown promise in experimental cells when coupled with zinc or metal
hydride anodes for secondary batteries [19].
Table (4.3): Iron electrode battery systems [19]. System Uses Advantages Disadvantages
Iron / nickel oxide (tubular)
Material handling vehicles, underground mining vehicles, miners’ lamps, railway cars and signal systems, emergency lighting
Physically almost indestructible, not damaged by discharged stand, long life, cycling or stand, withstands electrical abuse: overcharge, over discharged, short-circuiting
High self-discharge, hydrogen evolution on charge and discharge, low power density, lower energy density than competitive systems, Poor low temperature performance, damaged by high temperatures, higher cost than lead-acid, low cell voltage
Iron / air Motive power Good energy density, uses readily available materials, low self-discharge
Low efficiency, hydrogen evolution on charge, poor low-temperature performance, low cell voltage
Iron / silver oxide
Electronics High energy density, high cycle life
High cost, hydrogen evolution on charge
116Table (4.4): System characteristics [19].
System
Nominal voltage (V)
Spec
ific
ener
gy
(Wh/
kg)
Ene
rgy
dens
ity
(Wh/
L)
Spec
ific
pow
er
(W/k
g)
Cyc
le L
ife
10
0% D
OD
Open-circuit
Dis- charge
Iron / nickel oxide Tubular 1.4 1.2 30 60 25 4000
Developmental 1.4 1.2 55 110 110 >1200 Iron air 1.2 0.75 80 60 1000 Iron / silver oxide 1.48 1.1 105 160 - >300
4.4.1 Chemistry of Nickel – Iron batteries
The active materials of the nickel-iron battery are metallic iron for
the negative electrode, nickel oxide for the positive, and a potassium
hydroxide solution with lithium hydroxide for the electrolyte. The nickel-
iron battery is unique in many respects. The overall electrode reactions
result in the transfer of oxygen from one electrode to the other. The exact
details of the reaction can be very complex and include many species of
transitory existence. The electrolyte apparently plays no part in the overall
reaction, as noted in the following reactions:
(1st plateau) (4.4)
(2nd plateau) (4.5)
The overall reaction is
(4.6)
117
The electrolyte remains essentially invariant during charge and
discharge. It is not possible to use the specific gravity of the electrolyte to
determine the state of charge as for the lead acid battery. However, the
individual electrode reactions do involve an intimate reaction with the
electrolyte.
A typical charge-discharge curve of an iron electrode is shown in
figure (4.7). The two plateaus on charge correspond to the formation of the
stable +2 and +3 valent states of the iron reaction products. The reaction of
the iron electrode can be written as
(First plateau) (4.7)
And
(4.8)
(Second plateau) (4.9)
Then
(4.10)
Iron dissolved initially as the +2 species in alkaline media. The
divalent iron complexes with the electrolyte to form the
complex of low solubility. The tendency to n supersaturate plays an
important role in the operation of the electrode and accounts for many
important aspects of the electrode performance characteristics. Continued
118
charge forms the +3 valent iron which, in turn, interacts with +2 valent iron
to form [19].
Figure (4.7): Discharge-charge curve of an iron electrode [19].
4.4.2 Performance characteristics of Nickel-Iron battery
Voltage: A typical discharge-charge curve of a commercial iron/nickel
oxide battery is shown in figure (4.8). The battery’s open-circuit voltage is
1.4 V; its nominal voltage is 1.2 V. On charge, at rates most commonly
used, the maximum voltage is 1.7 to 1.8V.
Capacity: The capacity of the nickel-iron battery is limited by the capacity
of the positive electrode and, hence, is determined by the length and
number of positive tubes in each plate. The diameter of the tubes generally
is held constant by each manufacturer. The 5-h discharge rate is commonly
used as the reference for rating its capacity.
The conventional nickel-iron battery has moderate power and energy
density and is designed primarily for moderate to low discharge rates. It is
119
not recommended for high-rate applications such as engine starting. The
high internal resistance of the battery lowers the terminal voltage
significantly when high rates are required. The relationship between
capacity and rate of discharge is shown in figure (4.9).
Figure (4.8): Typical voltage characteristics during constant-rate discharge and recharge [19].
Figure (4.9): Curves of capacity. discharge rate at 25ºC; end voltage 1.0 V per cell [19].
If a battery is discharged at a high rate and then at a lower rate, the
sum of the capacities delivered at the high and low rates nearly equals the
120
capacity that would have been obtained at the single discharge rate. This is
illustrated in figure (4.10) [19].
Figure (4.10): Effect of decreasing rate on battery voltage of nickel-iron cell [19].
4.4.3 Discharge characteristics
The nickel-iron battery may be discharged at any current rate it will
deliver, but the discharge should not be continued beyond the point where
the battery nears exhaustion. It is best adapted to low or moderate rates of
discharge (1- to 8-h rate). Figure (4.11) shows the discharge curves at
different rates of discharge at 25ºC [19].
121
Figure (4.11): Time-voltage discharge curves of nickel-iron battery; end voltage 1.0 V per cell [19].
4.4.4 Self-discharge
The self-discharge rate, charge retention, or stand characteristic of
the nickel-iron battery is poor. At 25ºC a cell will lose 15% of its capacity
in the first 10 days and 20 to 40% in a month. At lower temperatures, the
self-discharge rate is lower. For example, at 0ºC the losses are less than
one-half of those experienced at 25ºC [19].
4.4.5 Internal resistance
To a rough approximation, the internal resistance can be estimated
for tubular Ni-Fe from the equation
(4.11)
Where,
: internal resistance (Ω).
122
C: battery capacity (Ah).
For example, 0.004 Ω for a 100-Ah battery, the value of
remains constant through the first half of the discharge, and then increases
about 50% during the latter half of the discharge [19].
4.4.6 Life
The main advantages of the tubular-type nickel-iron battery are its
extremely long life and rugged construction. Battery life varies with the
type of service but ranges from 8 years for heavy duty to 25 years or more
for standby or float service. With moderate care, 2000 cycles can be
expected; with good care, for example, by limiting temperatures to below
35ºC, cycle life of 3000 to 4000 cycles has been achieved.
The battery is less damaged by repeated deep discharge than any
other battery system. In practice, an operator will drive a battery-operated
vehicle until it stalls, at which point the battery voltage is a fraction of a
volt per cell (some cells may be in reverse). This has a minimal effect on
the nickel-iron battery in comparison with other systems [19].
4.4.7 Charging
Charging of the batteries can be accomplished by a variety of
schemes. As long as the charging current does not produce excessive
gassing (spray out of the vent cap), or temperature rise (above 45ºC), any
current can be used. Excessive gassing will require more frequent addition
of water. If the cell voltage is limited to 1.7 V, these conditions should not
123
be a consideration. Typical charging curves are given in Figure (4.12). The
Ampere hour input should return 25 to 40% excess of the previous
discharge to ensure complete charging. The suggested charge rate is
normally between 15 and 20 A per 100 Ah of battery capacity. This rate
would return the capacity in the 6- to 8-h time frame. The effect of
temperature on charging is shown in figure (4.13).
Figure (4.12): Typical charging voltage for nickel-iron battery at various rates [19].
Constant current and modified constant potential (taper), shown in
figure (4.13), are common recharging techniques. The charging circuit
should contain a current-limiting device to avoid thermal runaway on
charge. Recharging each night after use (cycle charging) is the normal
procedure. The batteries can be trickle-charged to maintain them at full
capacity for emergency use. A trickle charge rate of 0.004 to 0.006 A/Ah of
battery capacity overcomes the internal self-discharge and maintains the
battery at full charge. Following an emergency discharge, a separate
recharge is needed. For applications such as railroad signals, charging at a
124
continuous average current may be the most economic method. Here a
modest drain is required when no trains are passing but quite a heavy drain
when a train passes, yet the total Ampere-hours over a period of 24 h
remains fairly constant. For this situation, a constant current equal to that
required to maintain the battery can be used [19].
Figure (4.13): Voltage variation with temperature [19].
Figure (4.14): Effects of ‘‘regulators’’ with voltage and current regulation [19].
125
Chapter Five
Lead Acid Battery Characteristics
126
Chapter Five Lead Acid Battery Characteristics
5.1 The Discharge Process under 8.4A Current Load
Discharge process (the function of removing current from a cell or
battery) was done by a simple circuit, which consists of lamps with
different power. Each one was connected with battery via a digital ampere
meter, to measure the current delivered from battery. A digital volt meter
was used to measure the battery voltage. A hydrometer was used to
measure the electrolyte density and a thermo meter was used to measure
the electrolyte and the ambient temperatures. The loads at which the battery
was discharged were of the currents (8.4A, 6.2A, 4.25A and 2.2A). For
each load we construct a table of many parameters as it is shown in tables
(5.1), (5.2), (5.3), (5.4) and (5.5).
Hydrometer (Nicholson): Is an instrument used to measure
the specific gravity (or relative density) of liquids; that is, the ratio of the
density of the liquid to the density of water. A hydrometer is usually made
of glass and consists of a cylindrical stem and a bulb weighted
with mercury or lead shot to make it float upright. The liquid to be tested is
poured into a tall container, often a graduated cylinder, and the hydrometer
is gently lowered into the liquid until it floats freely. The point at which the
surface of the liquid touches the stem of the hydrometer is noted.
Hydrometers usually contain a scale inside the stem, so that the specific
gravity can be read directly. A variety of scales exists, and is used
depending on the context [25].
127
In this chapter some curves will show the relations between several
parameters such as specific gravity (ρ), open circuit voltage (VOC), battery
voltage (Vb), battery current (Ib), ampere hour (Ah), watt hour (Wh),
ampere hour capacity (AhC), watt hour capacity (WhC), depth of
discharged (DOD) and state of charged (SOC). The curves from (5.1) to
(5.11) illustrate the different reactions at a battery discharge current
amounting to 2.2A.
128
Table (5.1): (12V/60Ah) lead acid battery behavior under (8.4A) discharge current.
5.1.1 Voltage, specific gravity and state of charge
Lead acid cell nominal voltage is 2V, and the lower and upper limits
of charging and discharging open circuit voltage are 1.75 and 2.4V at 25°C
cell temperature, which is equivalent to 10.5 and 14.4V respectively. As it
is shown in figure (5.1.A) for (12V/60Ah) lead acid battery, figure (5.1.B)
shows the variation of the current as a function of time. Also we can
determine the relationship between current and voltage as it is shown in
figure (5.2). Figure (5.3.A) show the specific gravity as a function of time
and figure (5.3.B) show the voltage behavior as a function of specific
gravity.
Lead - acid battery voltage could be calculated from equation (5.1)
[1].
(5.1)
Where:
: nominal cell voltage in volt.
: electrolyte specific gravity in nominal voltage (gr/liter).
From the previous tables, we see that the under load voltage values
are greater than the values from the formula (5.1). Also the open circuit
voltage (VOC) values are greater than the under load voltage. Figure (5.4.A)
shows VOC as a function of discharged time. Also figure (5.4.B) shows the
relation sheep between VOC and specific gravity.
133
Figure (5.1): Discharge process of the lead acid battery under load
A: Variation of discharge voltage as a function of time.
B: Variation of discharge current as a function of time.
Figure (5.2): Discharge processes of the battery within 4.5 hours, the beginning point of the curve at fully charged battery and the ending point of curve at 40% charged battery.
134
Figure (5.3): Battery discharge process within a 4.5 hours.
A: Specific gravity of the battery solution as a function of time.
B: Battery voltage as a function of specific gravity.
135
Figure (5.4): Discharge process of the battery.
A: Open circuit voltage behavior during discharge.
B: Open circuit voltage as a function of specific gravity.
5.1.2 The battery internal resistance
The internal resistance of a battery, which creates a voltage, drops in
proportion to current is illustrated in figure (5.5). The battery resistance
value can be calculated from equation (5.2) or (5.3) [24].
(5.2)
Or
(5.3)
Where,
- : internal resistance of the battery.
- VOC: open circuit voltage.
- V: battery voltage under load.
- : total resistance of the load.
- I: the current supplied by the battery.
136
Figure (5.5): The variation of the internal battery resistance as a function of time during discharge.
5.1.3 Storage capacity and efficiency
The energy storage of a battery is expressed by its ampere hour
capacity (Ah) or its watt hour capacity (Wh). Ah is the value used to define
the capacity of the battery. It is current in ampere, multiplied by the time in
hours, during which the current flows from the battery as shown in figure
(5.6). For example, a 12V battery rated at 60Ah over 20 hours can deliver
3A per hour for 20 hours ( ). The ampere hour capacity (AhC) is the
time integral of the product of discharge current from fully charge (DOD =
zero) to (DOD= 60%). Figure (5.7.A) show the decrease of AhC with time
of discharge and figure (5.7.B) shows the relationship between AhC and
discharge current for typical 60Ah/12V lead acid battery. Figure (5.7.C)
shows the relation between AhC and voltage. (12*60Ah) is equivalent to
(720Wh=0.72kWh) of energy which is known as watt hour capacity. Figure
(5.8.A) and (5.8.B) describe the relation between Wh and time of discharge
and Wh as a function of voltage. The watt – hour capacity (WhC) or energy
137
capacity is the time integral of the product of discharge current and voltage
from fully charge (DOD = zero) to (DOD= 60%). Figure (5.9.A) shows the
WhC behavior as a function of time and figure (5.9.B) shows the
relationship between WhC and voltage. The ampere hour efficiency of a
battery ( ) is the ratio of the number of ampere hours delivered during
discharge to that needed to return to its original condition, see equation
(5.4). ( ) is the ratio of the number of watt hours delivered (energy
delivered) during discharge to that needed to return to its original
condition, see equation (5.5).
(5.4)
(12V/60Ah) =
(5.5)
(12V/60Ah) =
Figure (5.6): Ampere hour within 4.5 hour during discharge process.
138
Figure (5.7): Battery ampere hour capacity under discharged process.
A: Battery ampere hour capacity under discharged time.
B: Ampere hour capacity as a function of discharge current.
C: Voltage behavior under the changed of the ampere hour capacity.
139
Figure (5.8): Discharge process of the battery.
A: Watt hour during discharge.
B: Relation between watt hours delivered from battery and the voltage.
140
Figure (5.9): Discharge process of the battery.
A: Watt hour capacity as a function of time.
B: Relation between watt hour capacity and battery voltage.
5.1.4 Depth of discharge (DOD)
The Depth of Discharge (DOD) is a measure of how deeply a battery
is discharged. When a battery is 100% full, then the DOD is 0%.
Conversely, when a battery is 100% empty, the DOD is 100% [1]. Figure
(5.10.A) shows how DOD increases with time of discharge while the
figures (5.10.B) and (5.10.C) describe the relationship between DOD with
voltage and specific gravity.
141
Figure (5.10): Discharge process of the battery.
A: DOD is a function of time.
B: DOD is a function of voltage.
C: DOD is a function of specific gravity.
Considering the curve in figure (5.11), we see that the temperature of
battery doesn’t differ during discharge.
142
Figure (5.11): Battery temperature during battery discharge process.
Figure (5.12) shows the time needed to discharge the battery under
different loads, as the current increases, the time of the discharge decreases
and the battery becomes empty or reaches to (DOD = 60%) quickly and the
same is true for SOC which reaches (40%) quickly for the higher current,
see figure (5.13).
Figure (5.12): The relationship between under load voltage and time of discharge for different load currents.
143
Figure (5.13): The relationship between SOC and time of discharge for different load currents.
5.1.5 Battery completed discharged under 8.4A current load
In table (5.5), the battery was discharged at 8.4A current until it
reached DOD=100% or SOC=0%. It means the battery becomes
completely empty and so the electrolyte was converted to water. There,
upon the battery was damaged and could never be charged again. Table
(5.5) shows that the electrolyte specific gravity became 1032 gr/liter which
is very closed to water density which is (1000 gr/liter). At this condition,
the battery voltage dropped to 9.43V while the open circuit voltage of the
battery dropped to 9.63V. Therefore, the battery should never be
discharged under 10.8V.
Figure (5.14) and (5.15) show the battery behavior under the
mentioned damaging discharge. In this time (SOC = 0%), (DOD = 100%),
(AhC = 0) and (VOC = 9.63V) and the time of discharged equal (8 hr) to
discharged battery under (8.4A) loads.
144
Table (5.5): (12V/60Ah) lead acid battery completed discharged behavior under (8.4A) current.