Page 1
Modeling and Simulation of Thermal
Stratification and Mixing induced by Steam
Injection through Spargers into Large Water Pool
Master of Science Thesis by:
Łukasz Filich
Supervisor:
Associate Professor Pavel Kudinov, Ph.D.
Stockholm, Sweden, May 2015
Royal Institute of Technology School of Engineering Sciences
Nuclear Energy Engineering Nuclear Power Safety
TRITA-FYS 2015:32 ISSN 0280-316X ISRN KTH/FYS/--15:32—SE
Page 3
I
ABSTRACT
Pressure suppression pool constitutes an important feature of BWRs characterized by a compact
containment structure. It provides a water source for emergency core cooling system and allows
for high heat removal rates by condensing large amounts of steam during accidental or transient
situations, thereby preventing containment overpressurization. Depending on the pool
temperature and steam injection conditions, different condensation regimes may occur and some
of them may favor the development of thermal stratification. This phenomenon diminishes
pressure suppression capabilities and causes the increase of containment pressure. The complex
physics of condensation and the need to consider long steam blowdown transients in a large
geometry makes current computational techniques unsuitable for its analysis.
The following study builds upon the efforts made at KTH to develop efficient models, namely
Effective Heat Source (EHS) and Effective Momentum Source (EMS) models, for transient
thermal mixing and stratification. These models aim to model the impact of steam injection on
the thermal behavior in the pool where small-scale local phenomena due to direct contact
condensation are not considered.
The study’s objective was to develop such models for steam injection through spargers.
Furthermore, analytical support for experimental activities at LUT was provided. For this reason,
scaling methodology was proposed and pre-test calculations were performed. Finally, a
preliminary validation of the EHS/EMS models implemented with GOTHIC code was performed
against experimental data obtained in one of the experiments. It was found that numerical
analysis is particularly sensitive to the effective momentum provided as a result of condensation.
Given a properly estimated effective momentum, the numerical simulations with EHS/EMS
models was able to reproduce the global pool behavior very well and with high computational
efficiency.
Page 5
III
ACKNOWLEDGEMENTS
First, I would like to thank Pavel Kudinov for allowing me to participate in this project in the
Nuclear Power Safety division at the Royal Institute of Technology, and for his supervision in
key elements of this Master thesis. I also want to express my gratitude to Walter Villanueva for
his co-supervision, patience, constantly monitoring the work progress, providing insightful
observations and ideas, as well as all the discussions during presentations. I sincerely appreciate
your contribution to this work. Another person to whom I owe a huge debt of gratitude, and who
deserves special recognition, is Ignacio Gallego Marcos. Thank you for your help in teaching me
GOTHIC, and later in solving problems and doubts I would across along the way. I can safely
say that you have been a big part of this work, and without your comments and help it would
have had no chance of success whatsoever. I would also like to mention and thank Hua Li for his
help in the early stages of my work. Although I only had a brief opportunity to learn from you,
you were always willing to offer me your time. Thanks to each and every one of you, and the
friendly atmosphere you created, I will remember with joy the time I spent working in the office
over this Master Thesis.
I also want to thank Hans Kronkvist for providing me with cozy low-cost accommodation for
most of my studies in Sweden. Not only did you offer me home, but you also have been a great
friend who I could turn to with real-life problems outside of school.
Last but not least, I would like to thank my family: my parents, brothers and grandmother, who
have always believed in me and who I could always count on. It is thanks to you that I have
managed to balance studies in Sweden with my work in Poland, and for this I am very grateful.
Page 7
V
TABLE OF CONTENTS
Abstract I
Acknowledgments II
List of Acronyms V
Nomenclature VI
List of Figures VII
List of Tables VIII
1 Introduction ....................................................................................................................... - 1 -
1.1 Motivation .................................................................................................................... - 1 -
1.2 Previous work ............................................................................................................... - 4 -
1.3 Remarks on the state-of-the-art .................................................................................... - 6 -
1.4 Goals and Tasks ........................................................................................................... - 7 -
2 Development of effective models for spargers ................................................................ - 9 -
2.1 Approach ...................................................................................................................... - 9 -
2.2 EHS/EMS models for spargers .................................................................................. - 10 -
2.3 Modeling at local scales ............................................................................................. - 12 -
2.3.1 Local behavior of condensing steam jet.............................................................. - 12 -
2.3.2 Mathematical model............................................................................................ - 13 -
2.4 Computational Analysis Tool..................................................................................... - 14 -
2.4.1 EHS/EMS implementation in GOTHIC code ..................................................... - 15 -
3 Experimental design and test conditions ....................................................................... - 17 -
3.1 Scaling ........................................................................................................................ - 17 -
3.1.1 Literature review ................................................................................................. - 17 -
3.1.2 Goal of the scaling .............................................................................................. - 19 -
3.1.3 Reference NPP and transient to be scaled........................................................... - 20 -
3.1.4 Scaling methodology .......................................................................................... - 22 -
3.1.5 Rationale for scaling choices .............................................................................. - 22 -
Page 8
VI
3.2 Pre-test Calculations ................................................................................................... - 27 -
3.2.1 Goal of the pre-test.............................................................................................. - 27 -
3.2.2 Separate-effect tests ............................................................................................ - 27 -
3.2.3 Model for pre-test calculations ........................................................................... - 27 -
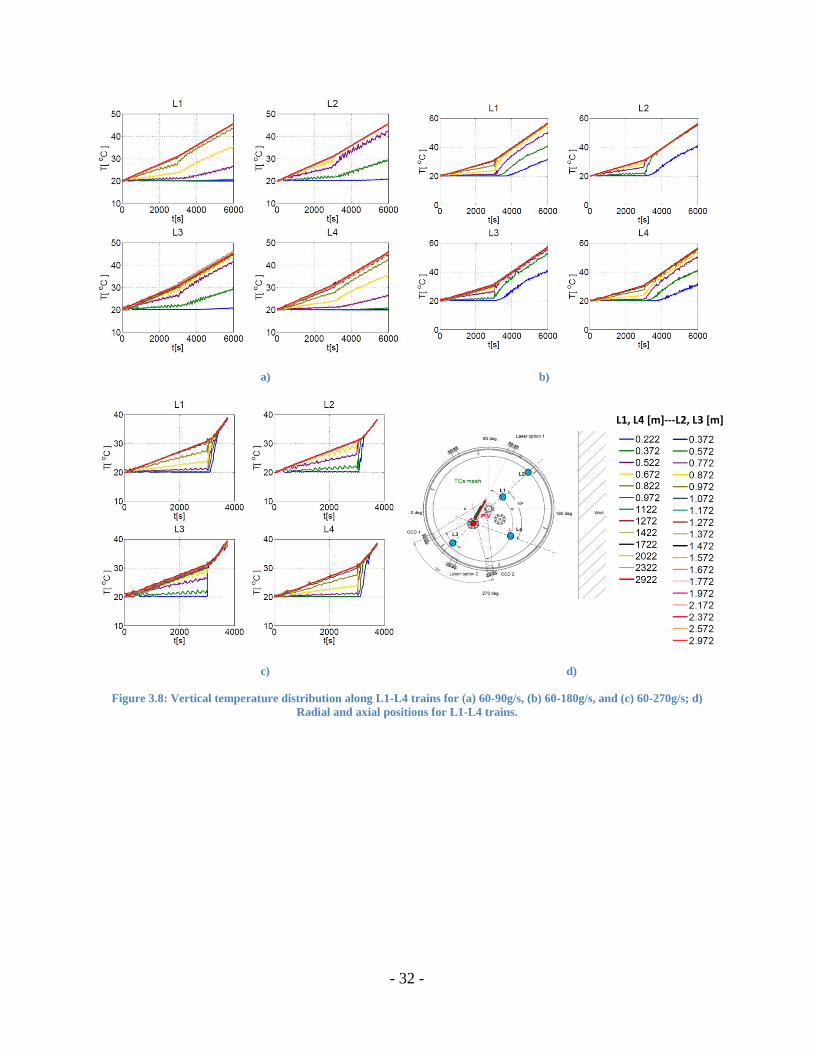
3.2.4 Initial and boundary conditions for pre-test ........................................................ - 31 -
3.2.5 Analysis of pre-test results .................................................................................. - 31 -
3.3 Instrumentation Setup ................................................................................................ - 34 -
3.4 Test-Matrix ................................................................................................................. - 36 -
4 Validation of EHS/EMS models for spargers ............................................................... - 38 -
4.1 PPOOLEX SPA-T3 experiment ................................................................................. - 38 -
4.2 Model for post-test validation .................................................................................... - 40 -
4.2.1 Model Improvements ................................................................................................ - 40 -
4.2.2 Test-conditions used in post-test validation ............................................................. - 43 -
4.3 Analysis of post-test results........................................................................................ - 45 -
4.3.1 Water level and average liquid temperature ............................................................. - 45 -
4.3.2 Temperature profile in the pool ................................................................................ - 47 -
4.3.2 Near-field temperature .............................................................................................. - 53 -
5 Summary and Conclusions ............................................................................................. - 55 -
6 Outlook ............................................................................................................................. - 57 -
7 Bibliography ..................................................................................................................... - 58 -
Page 9
VII
LIST OF ACRONYMS
ADS Automatic Depressurization System
APR Advanced Power Reactor
B&C Blowdown and Condensation facility
BMIX++ Berkeley mechanistic MIXing code in C++
BWR Boiling Water Reactor
CFD Computational Fluid Dynamics
DCC Direct Contact Condensation
ECCS Emergency Core Cooling System
EHS Effective Heat Source
EMS Effective Momentum Source
GOTHIC Generation of Thermal Hydraulic Information in Containments
H2TS Hierarchical Two-Tiered Scaling
IRWST In-containment Refueling Water Storage Tank
JICO Jet Injection and Condensation facility
JNES Japan Nuclear Energy Safety organization
KAERI Korean Atomic Energy Research Institute
KTH Kungliga Tekniska Högskölan
LOCA Loss of Coolant Accident
LRR Load Reduction Ring
LUT Lappeenranta University of Technology
LWR Light Water Reactor
MAAP Modular Accident Analysis Program
MELCOR Methods for Estimation of Leakages and Consequences of Releases
MSIV Main Steam Isolation Valves
NAI Numerical Applications, A Division of Zachry Nuclear Engineering, Inc.
NKS Nordic Nuclear Safety Research
Page 10
VIII
NORTHNET Nordic Nuclear Reactor Thermal-Hydraulics Network
NPSH Net-Positive Suction Head
PCV Primary Containment Vessel
P/D Pitch to Diameter
PIRT Phenomena Identification and Ranking Table
PIV Particle Image Velocimetry
PSP Pressure Suppression Pool
PSTF Pressure Suppression Test Facility
PUMA Purdue University Multi-dimensional integral test Assembly
RANS Reynolds-Averaged Navier-Stokes
RCIC Reactor Core Isolation Cooling
RHR Residual Heat Removal
RMSE Root Mean Square Error
SAFIR Safety of Nuclear Power Plants - Finnish National Research Programme
SBO Station Black Out
SBWR Simplified Boiling Water Reactor
SCRM Steam Condensation Region Model
TC Thermocouple
TEPCO Tokyo Electric Power Company
TRACE TRAC/RELAP Advanced Computational Engine
VTT Technical Research Centre of Finland
VYR Finish State Nuclear Waste Management Fund
Page 11
IX
NOMENCLATURE
, , *Mass flow rate, kg/(s)
, , *Enthalpy, J/kg
, *Velocity, m/s
, *Pressure, Pa
Static Pressure in the tank, kPa
, *Jet area,
Spatial scale
Water level, m
Vessel diameter, m
ω Time scale, 1/s
Total liquid mass, kg
Liquid enthalpy, J/kg
Liquid velocity in the pool, m/s
Mass of water condensed inside the sparger, kg
Q Heat flux through sparger walls, W/m2
Latent heat, J/kg
Temperature at the sparger wall, K
Diameter of the sparger, m
S Sparger submergence depth, m
Thermal conductivity, W/(mK)
Richardson number,
Reynolds number,
Injection hole diameter, m
Density of steam and liquid, kg/m3
Gravitational acceleration, m/s2
Dynamic viscosity of steam, Pa.s
*S, E, C subscripts refer to steam, entrainment and condensation, respectively.
Page 12
X
LIST OF FIGURES
Figure 1.1: Schematic of a Pressure Suppression Pool (PSP) of a Nordic BWR [1]. ................ - 1 -
Figure 1.2: Pressure Containment Vessel (PCV) pressure changes at Unit 3, Fukushima accident
[7]. ............................................................................................................................................... - 3 -
Figure 1.3: Thermal Stratification of PSP during RCIC operation [9]. ...................................... - 3 -
Figure 2.1: Schematic of Effective Heat Source (EHS) and Effective Momentum Source (EMS)
approach for spargers. ............................................................................................................... - 11 -
Figure 2.2: a) Condensation regime map for single hole [31]; b) Flow structure of condensing
steam jet (d=10.15mm, G=600kg/m2s, Tp=40
oC ) [3] .............................................................. - 12 -
Figure 2.3: SCRM: a) individual model [27], b) lumped model .............................................. - 14 -
Figure 2.4: General GOTHIC model used for the simulations. ................................................ - 16 -
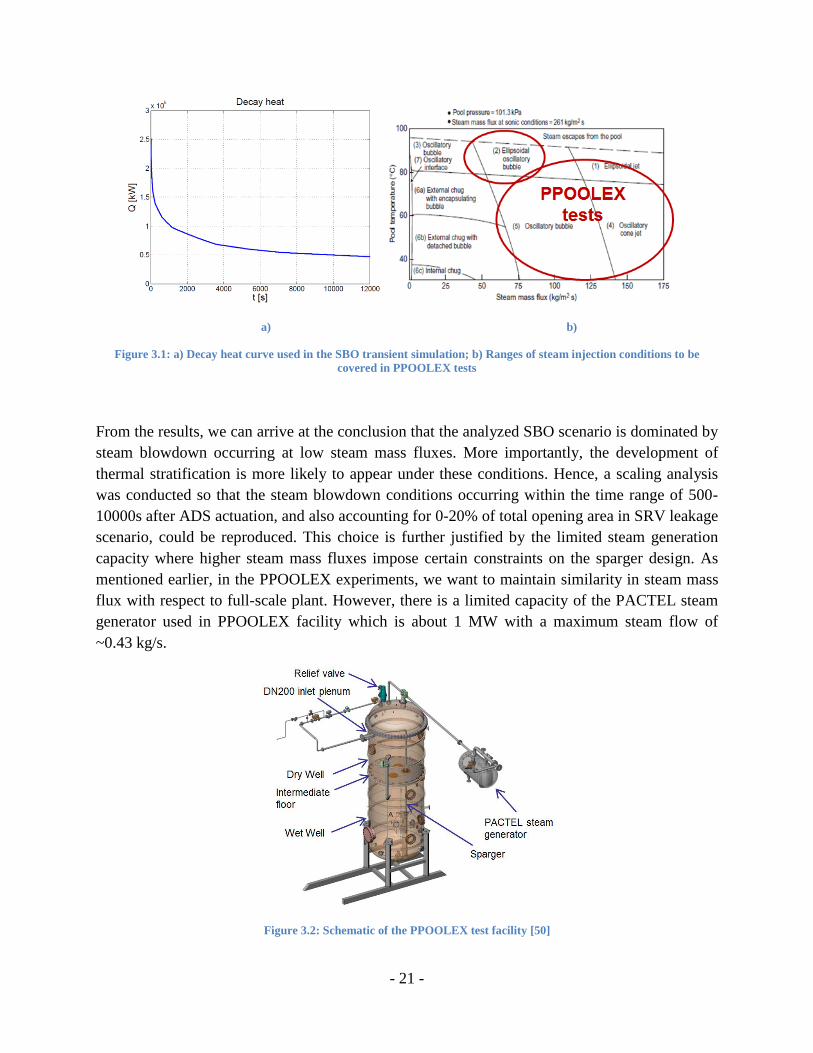
Figure 3.1: a) Decay heat curve used in the SBO transient simulation; b) Ranges of steam
injection conditions to be covered in PPOOLEX tests ............................................................. - 21 -
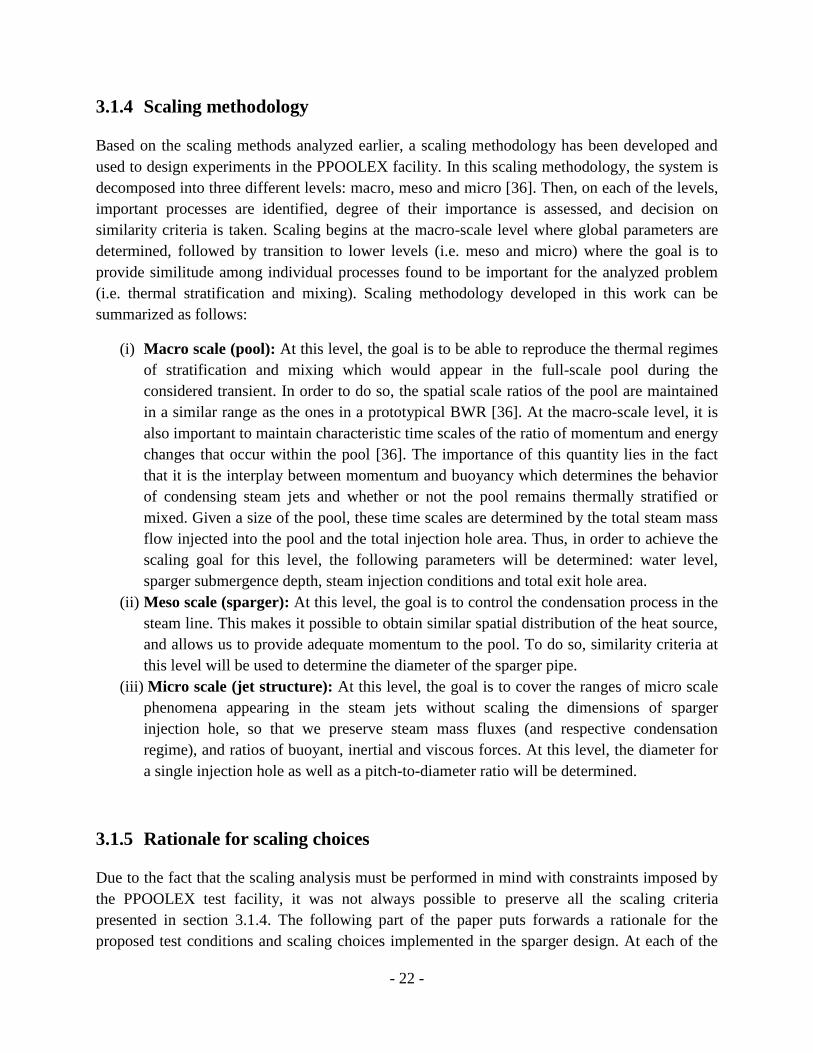
Figure 3.2: Schematic of the PPOOLEX test facility [49]........................................................ - 21 -
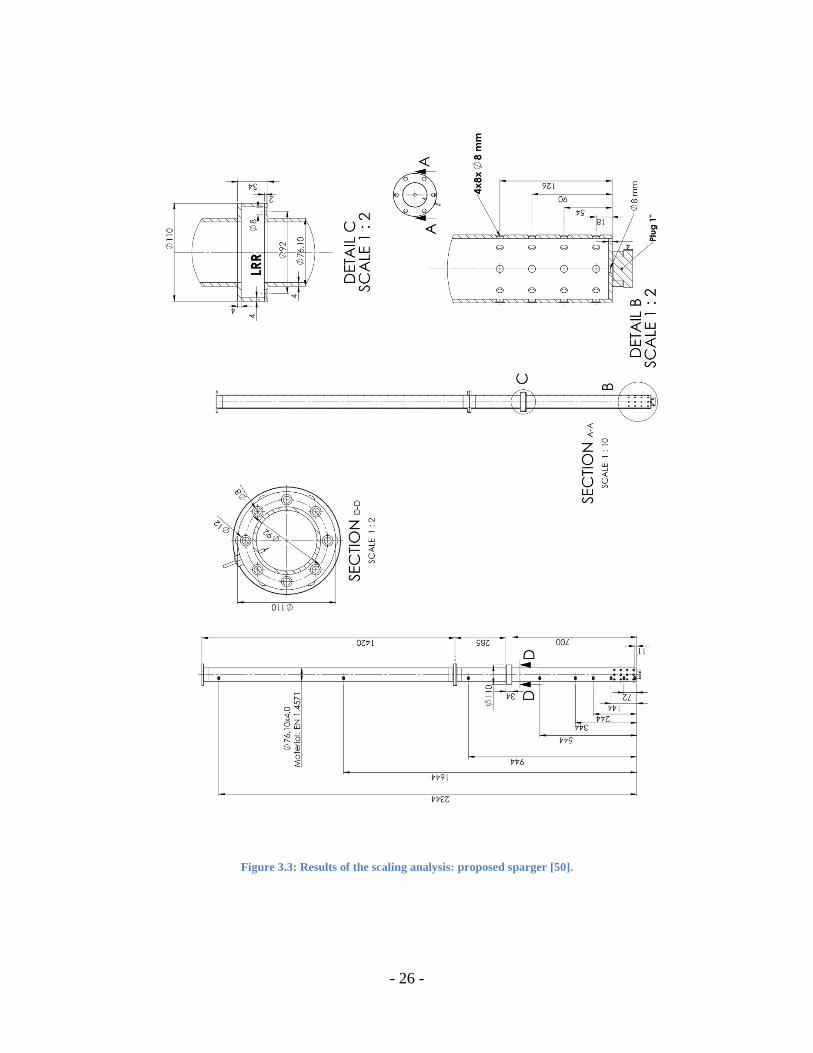
Figure 3.3: Results of the scaling analysis: proposed sparger [49]. .......................................... - 26 -
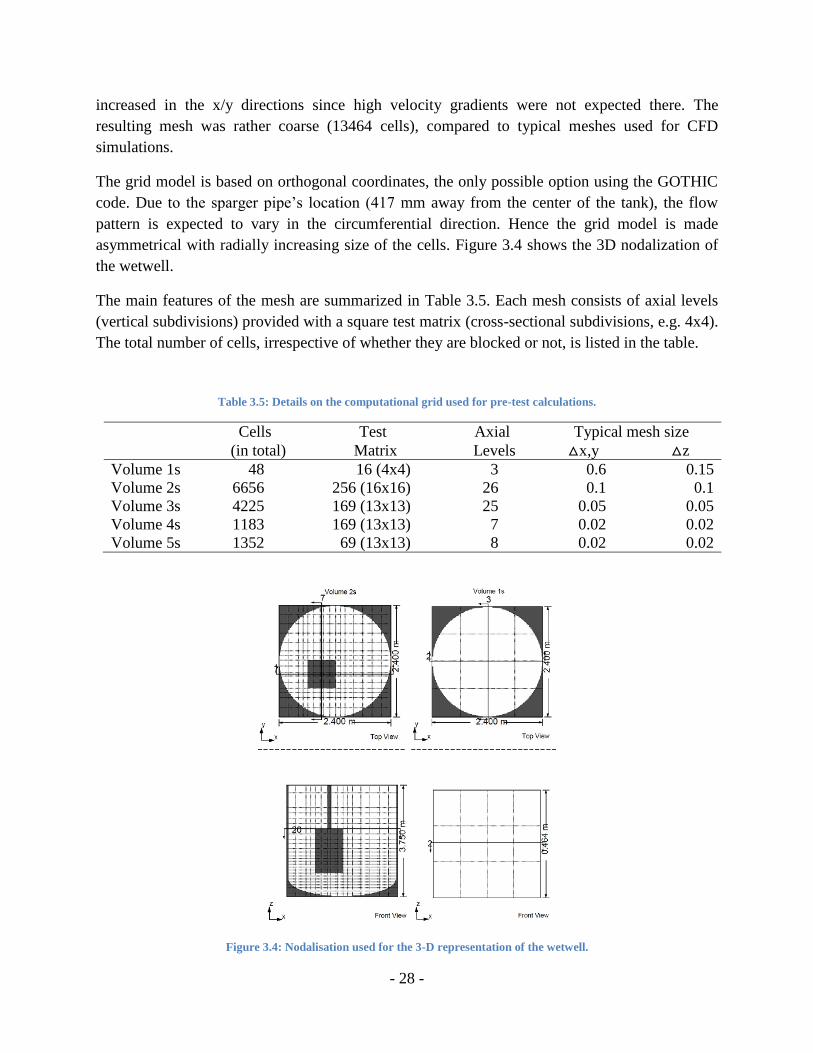
Figure 3.4: Nodalisation used for the 3-D representation of the wetwell. ................................ - 28 -
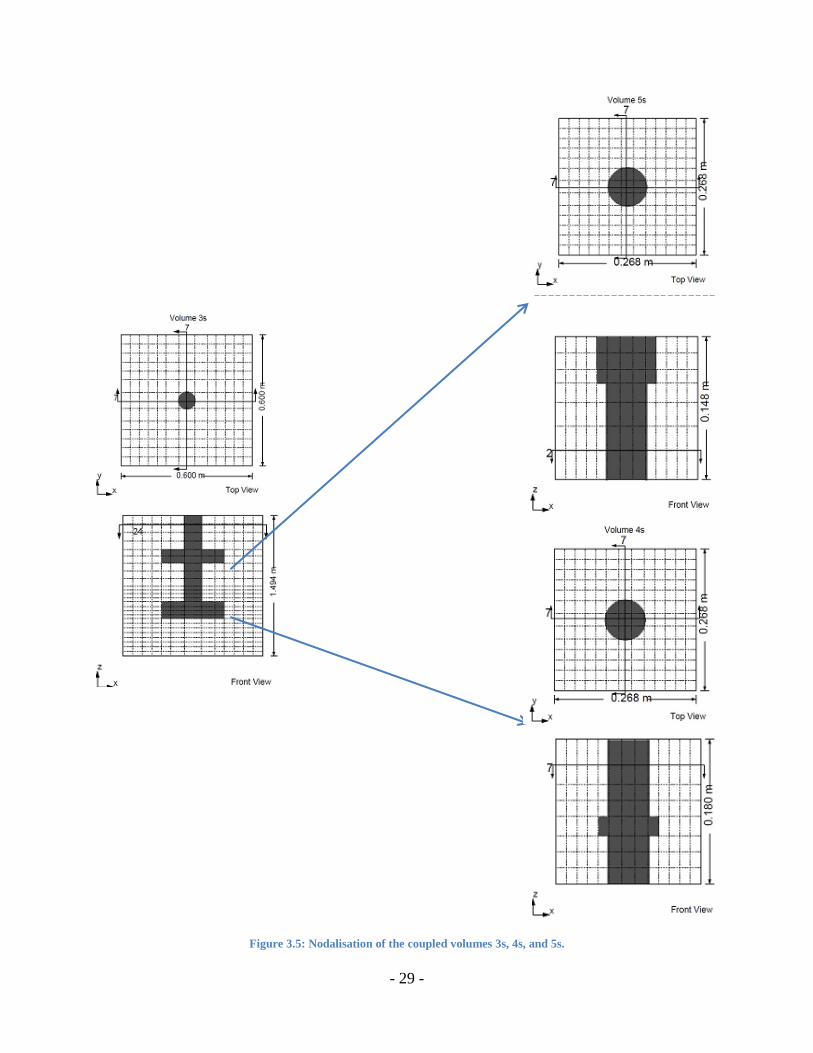
Figure 3.5: Nodalisation of the coupled volumes 3s, 4s, and 5s. .............................................. - 29 -
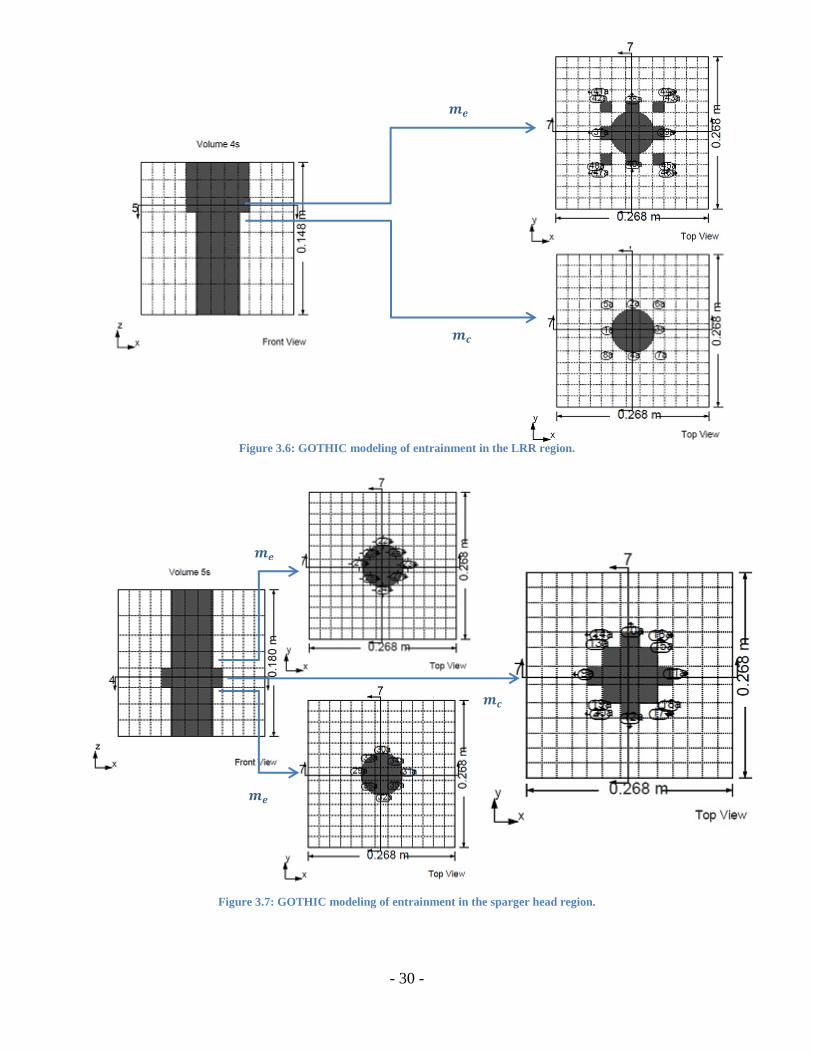
Figure 3.6: GOTHIC modeling of entrainment in the LRR region. ......................................... - 30 -
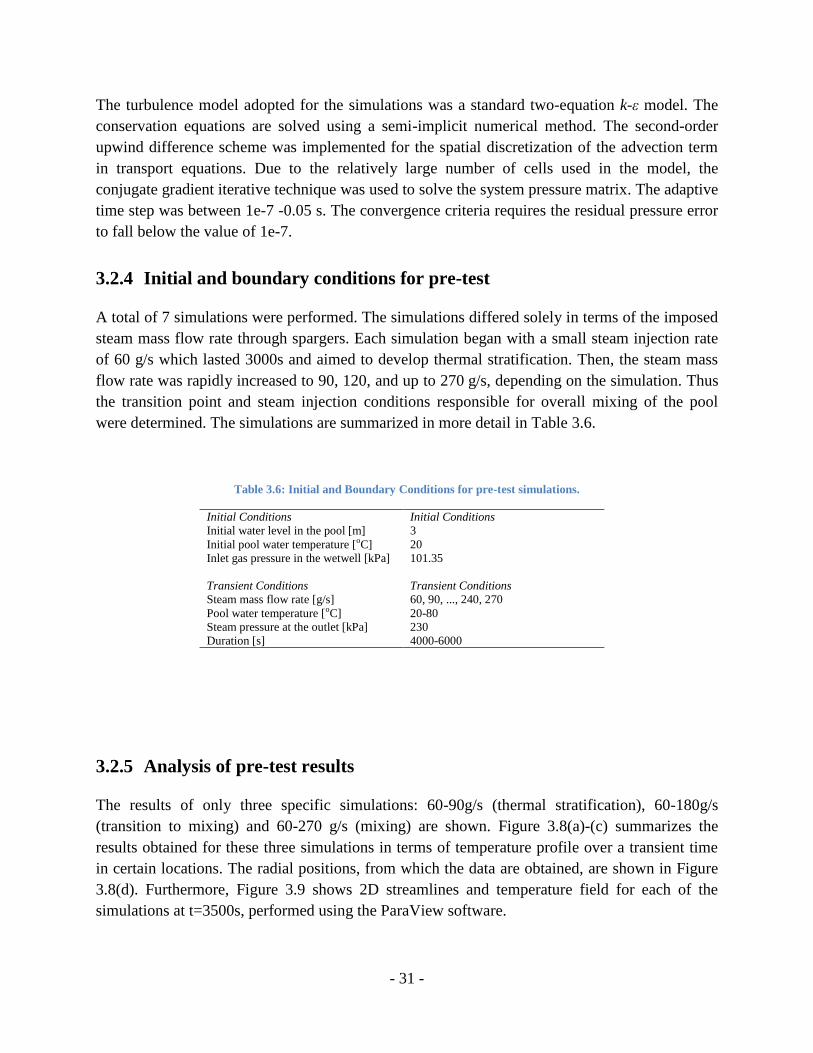
Figure 3.7: GOTHIC modeling of entrainment in the sparger head region. ............................. - 30 -
Figure 3.8: Vertical temperature distribution along L1-L4 trains for (a) 60-90g/s, (b) 60-180g/s,
and (c) 60-270g/s; d) Radial and axial positions for L1-L4 trains. ........................................... - 32 -
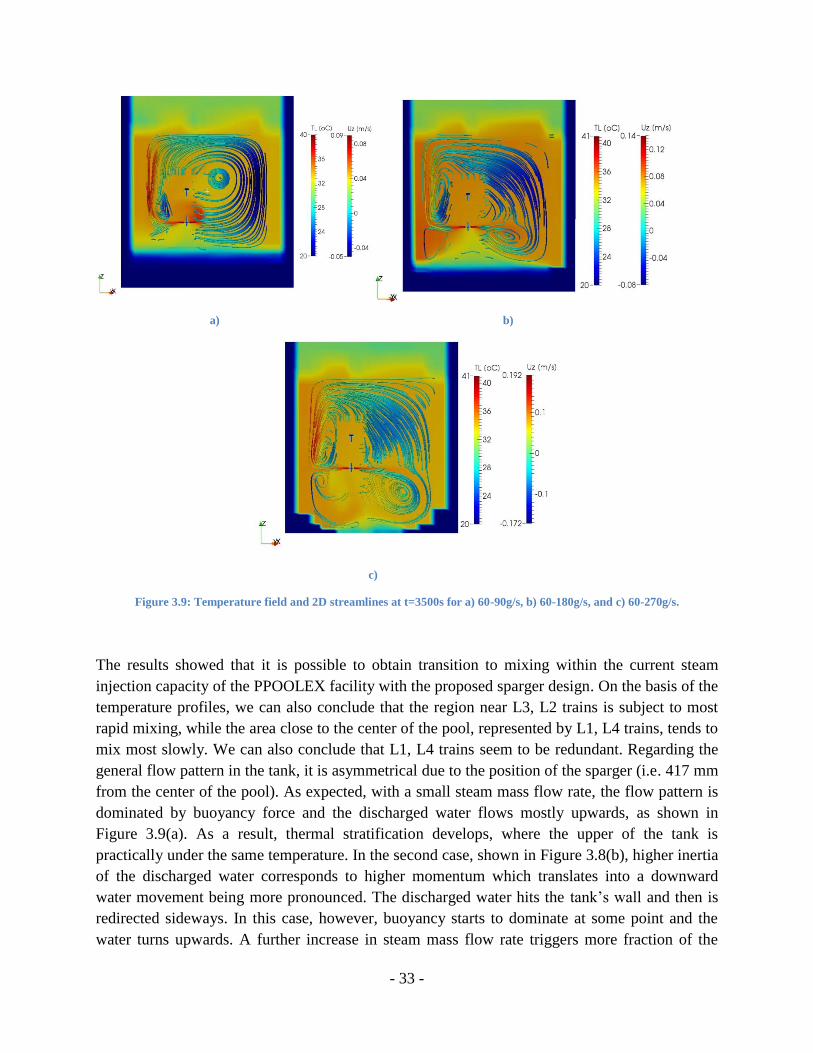
Figure 3.9: Temperature field and 2D streamlines at t=3500s for a) 60-90g/s, b) 60-180g/s, and c)
60-270g/s................................................................................................................................... - 33 -
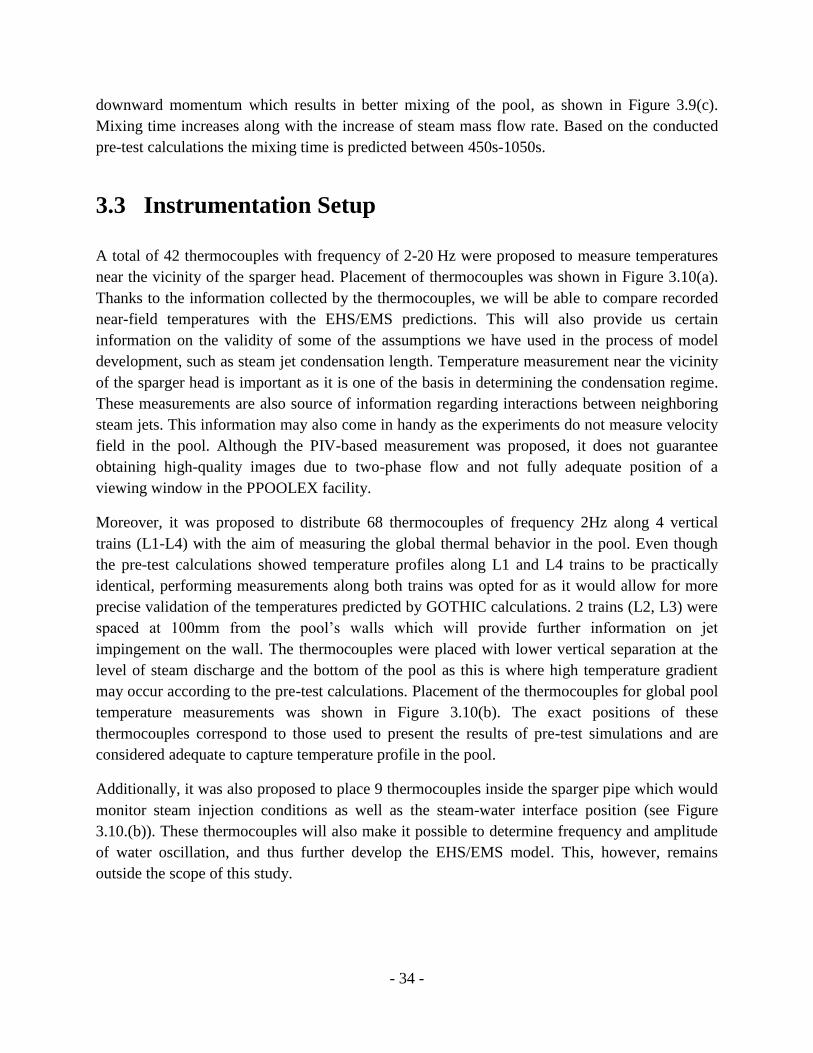
Figure 3.10: a) Near field TC grid; b) TC inside sparger pipe [49]. ......................................... - 35 -
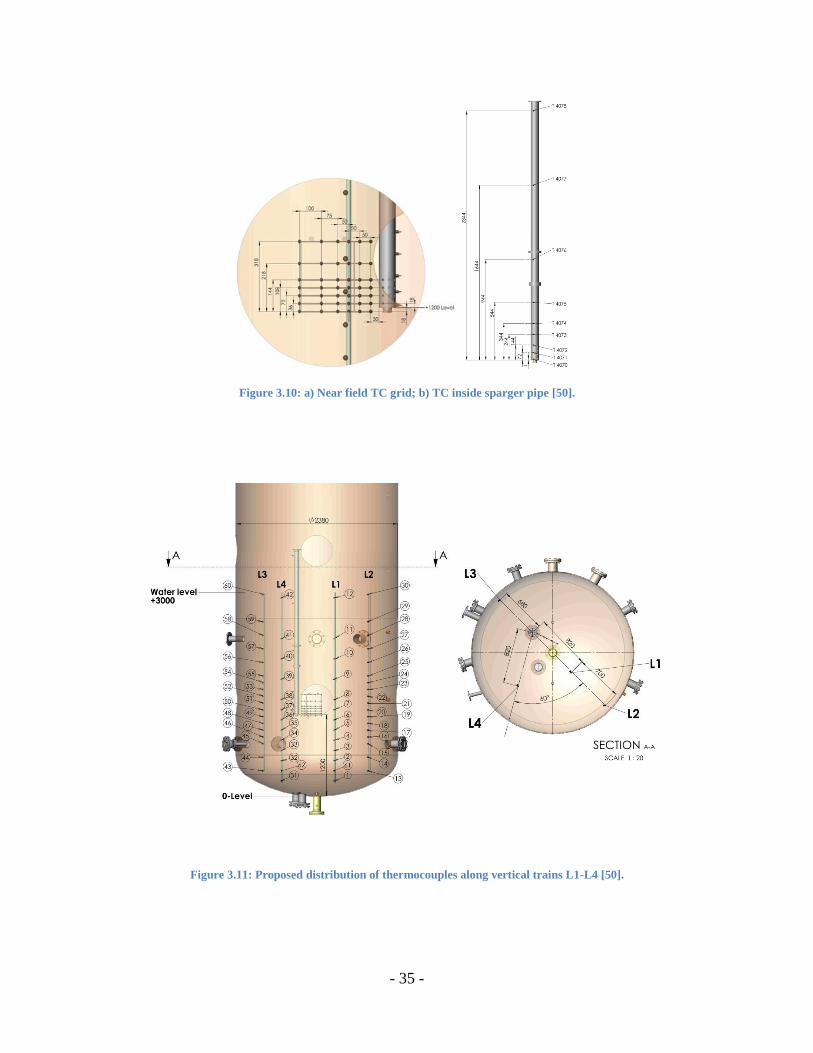
Figure 3.11: Proposed distribution of thermocouples along vertical trains L1-L4 [49]. .......... - 35 -
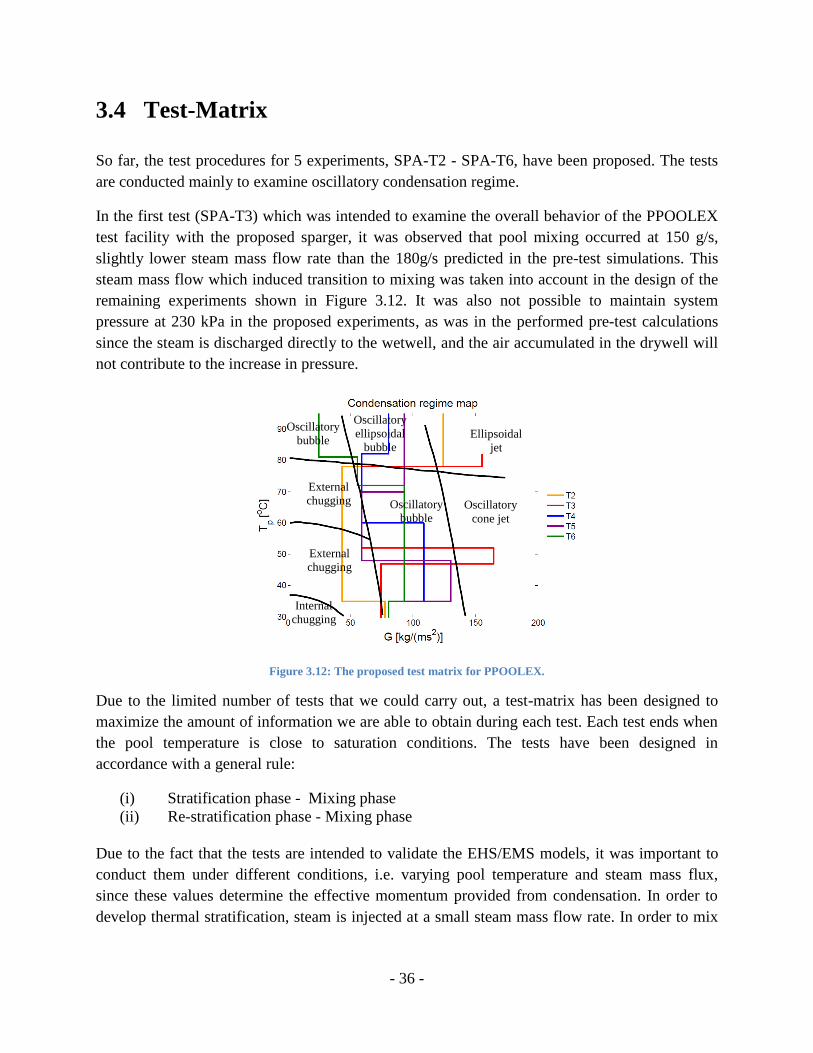
Figure 3.12: The proposed test matrix for PPOOLEX. ............................................................ - 36 -
Page 13
XI
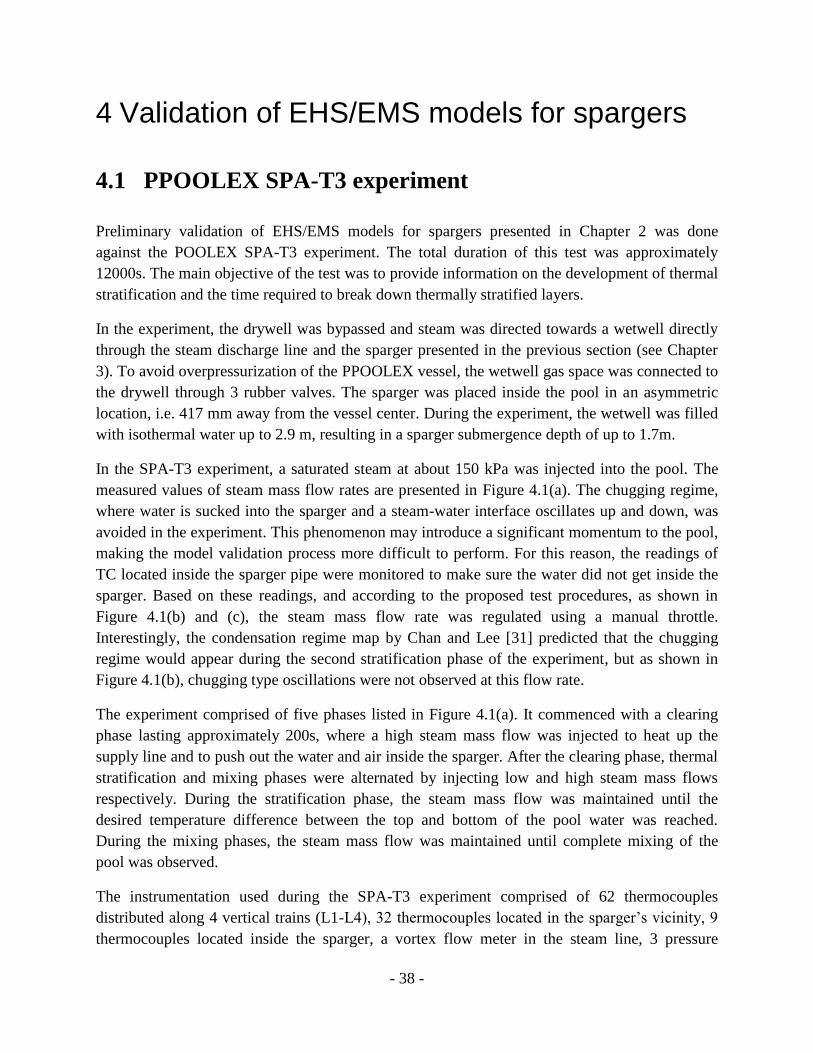
Figure 4.1: Steam injection conditions in the PPOOLEX SPA-T3 experiment: a) steam mass
flow rate, b) steam temperatures recorded inside sparger pipe, and c) path of T3 experiment in
the condensation regime map of Chan and Lee [31] . .............................................................. - 39 -
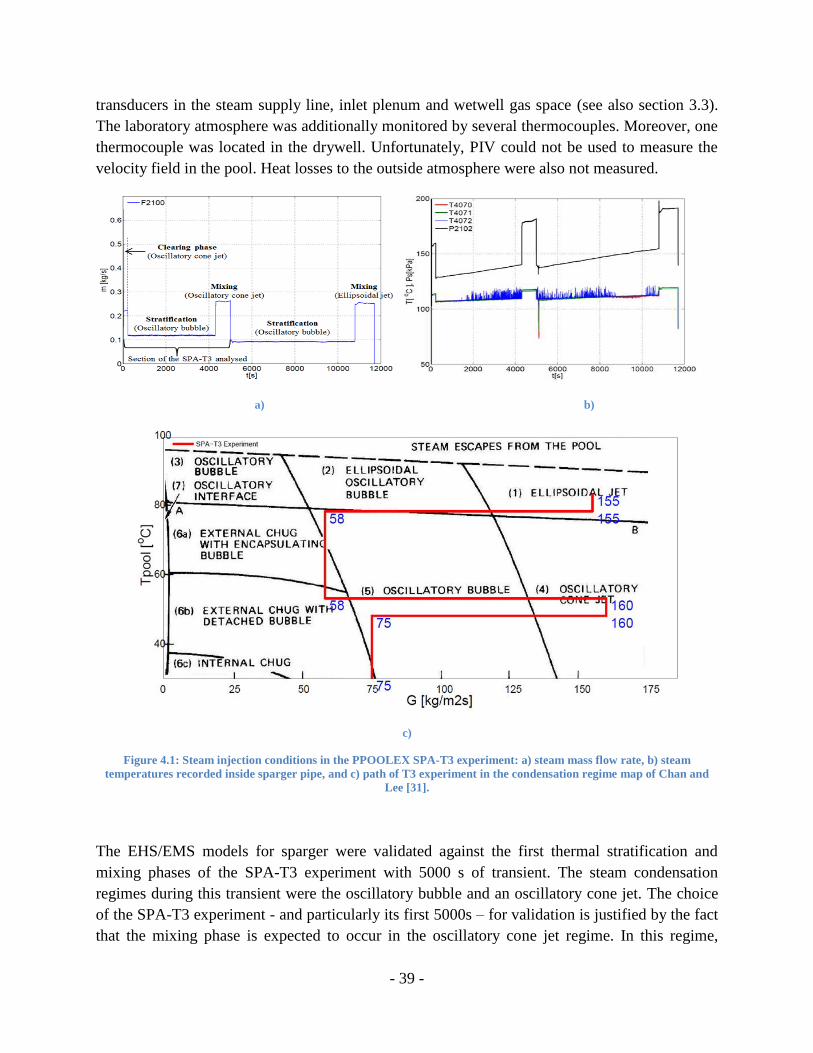
Figure 4.2: Video frame from SPA-T3 experiment: a) oscillatory bubble (4900-4925 s), b)
oscillatory cone jet (500-525 s)................................................................................................. - 40 -
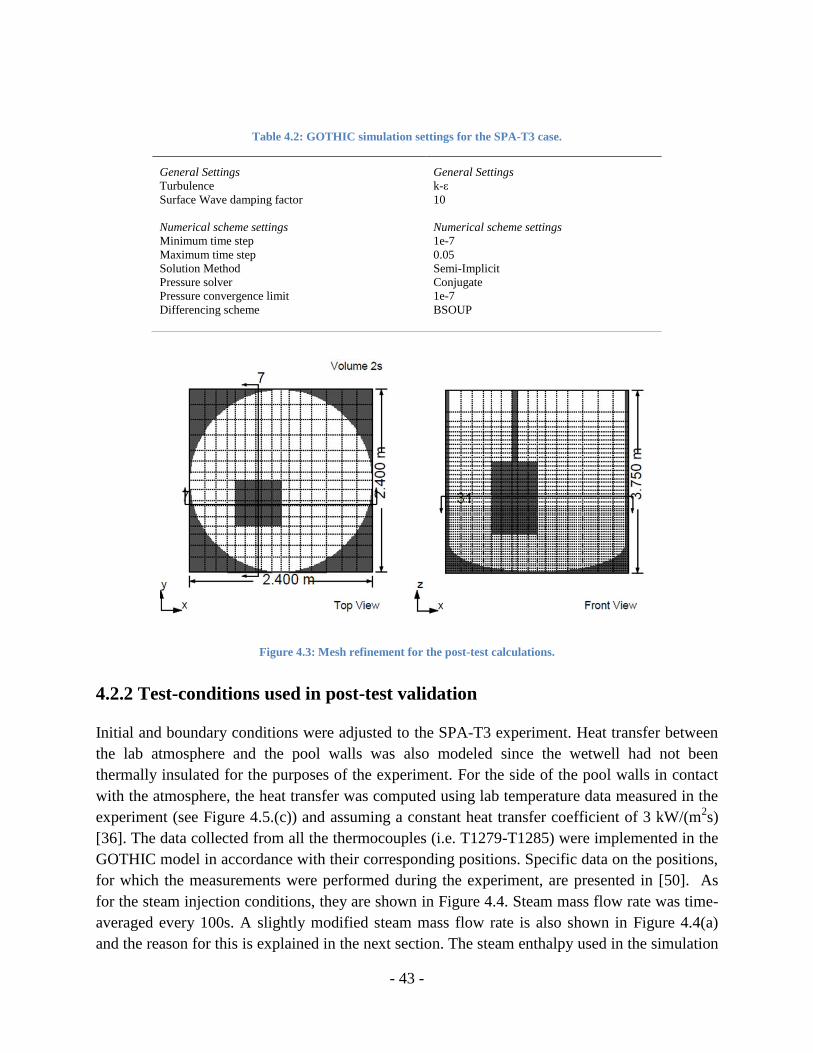
Figure 4.3: Mesh refinement for the post-test calculations....................................................... - 43 -
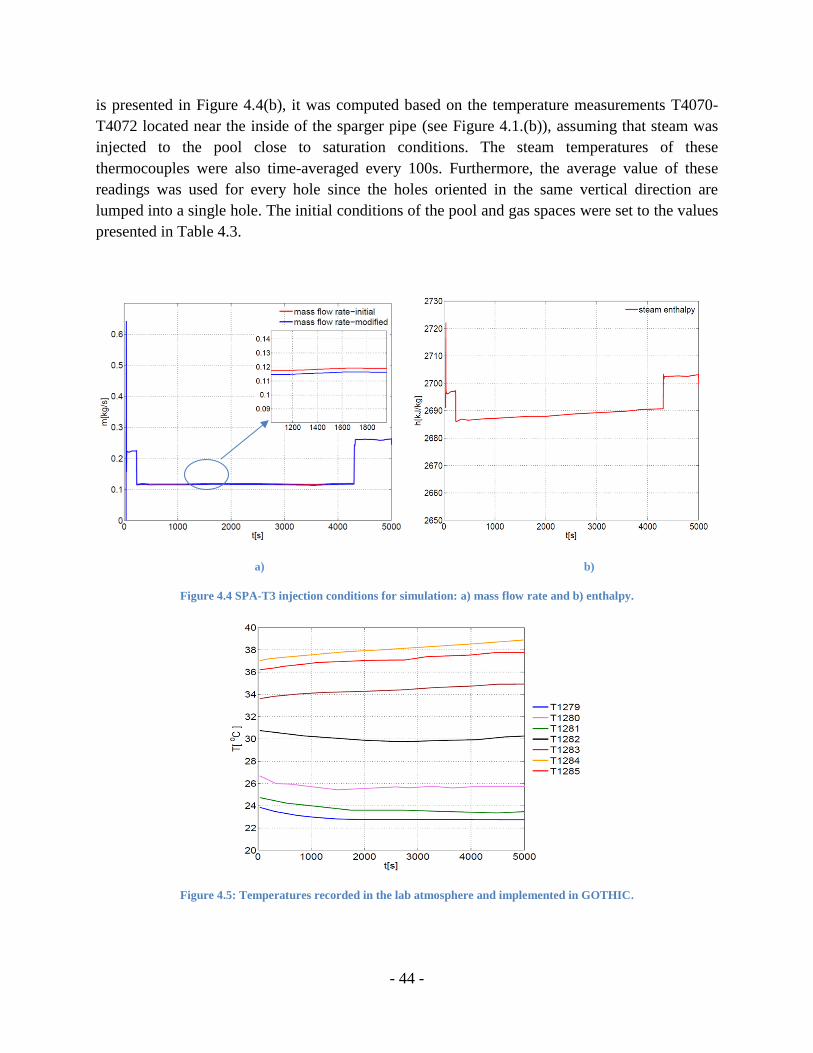
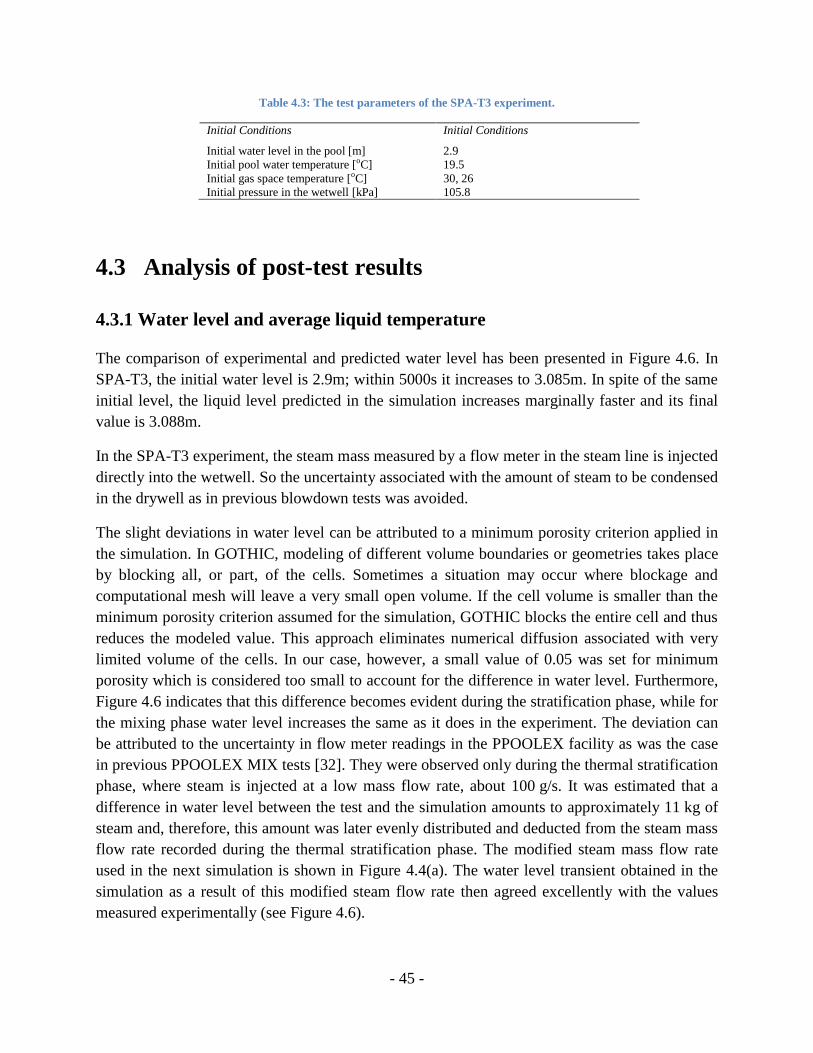
Figure 4.4 SPA-T3 injection conditions for simulation: a) mass flow rate and b) enthalpy. ... - 44 -
Figure 4.5: Temperatures recorded in the lab atmosphere and implemented in GOTHIC. ...... - 44 -
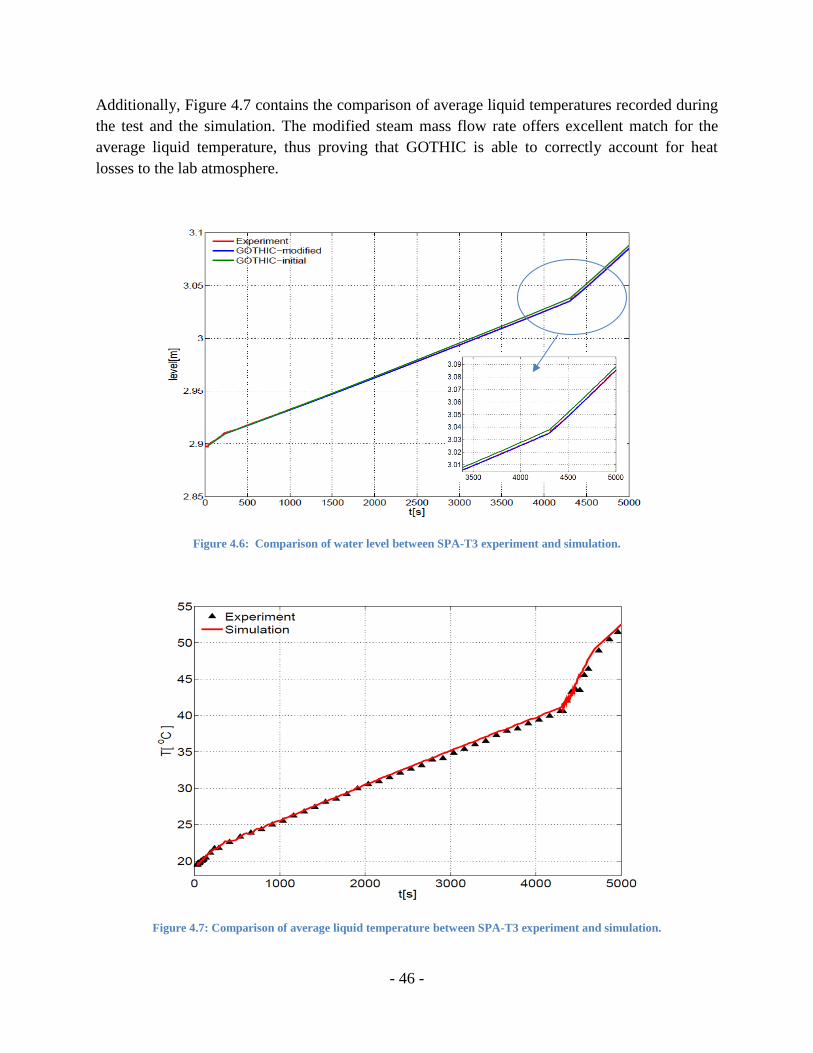
Figure 4.6: Comparison of water level between SPA-T3 experiment and simulation. ........... - 46 -
Figure 4.7: Comparison of average liquid temperature between SPA-T3 experiment and
simulation. ................................................................................................................................. - 46 -
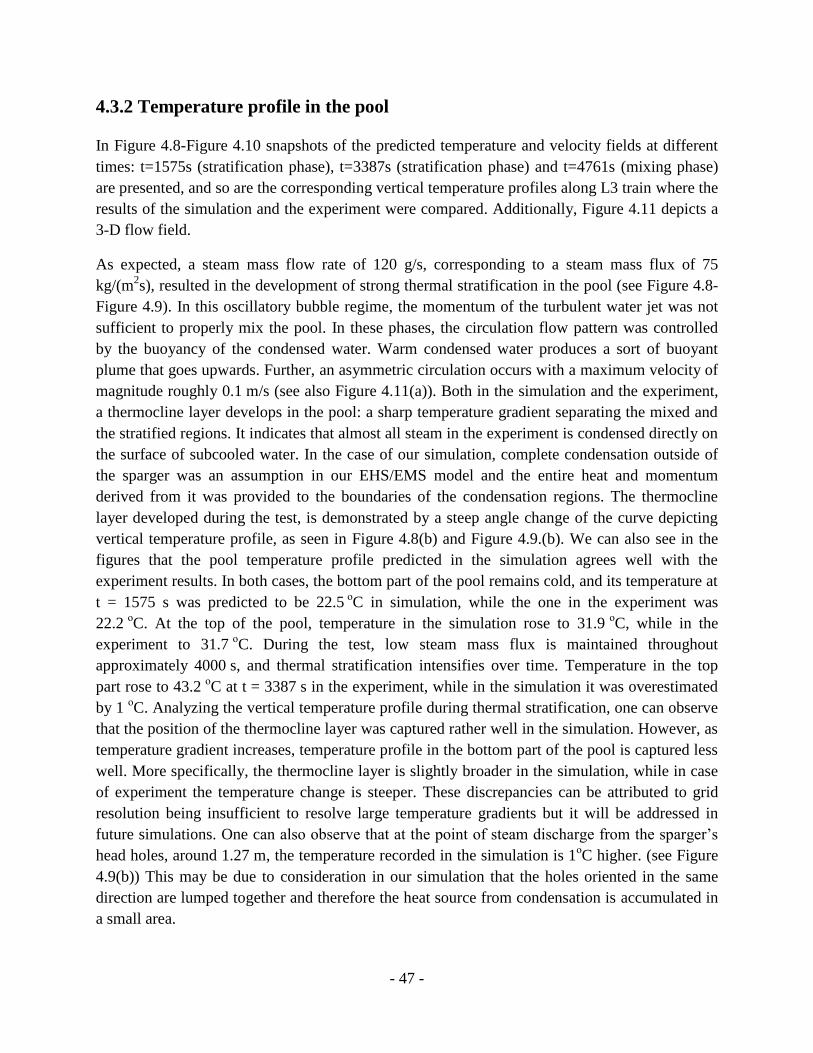
Figure 4.8: Temperature distribution in the pool at t=1575 s (stratification phase):
a) comparison of pool temperature profile along L3 train , b) temperature and velocity field from
GOTHIC simulation.................................................................................................................. - 48 -
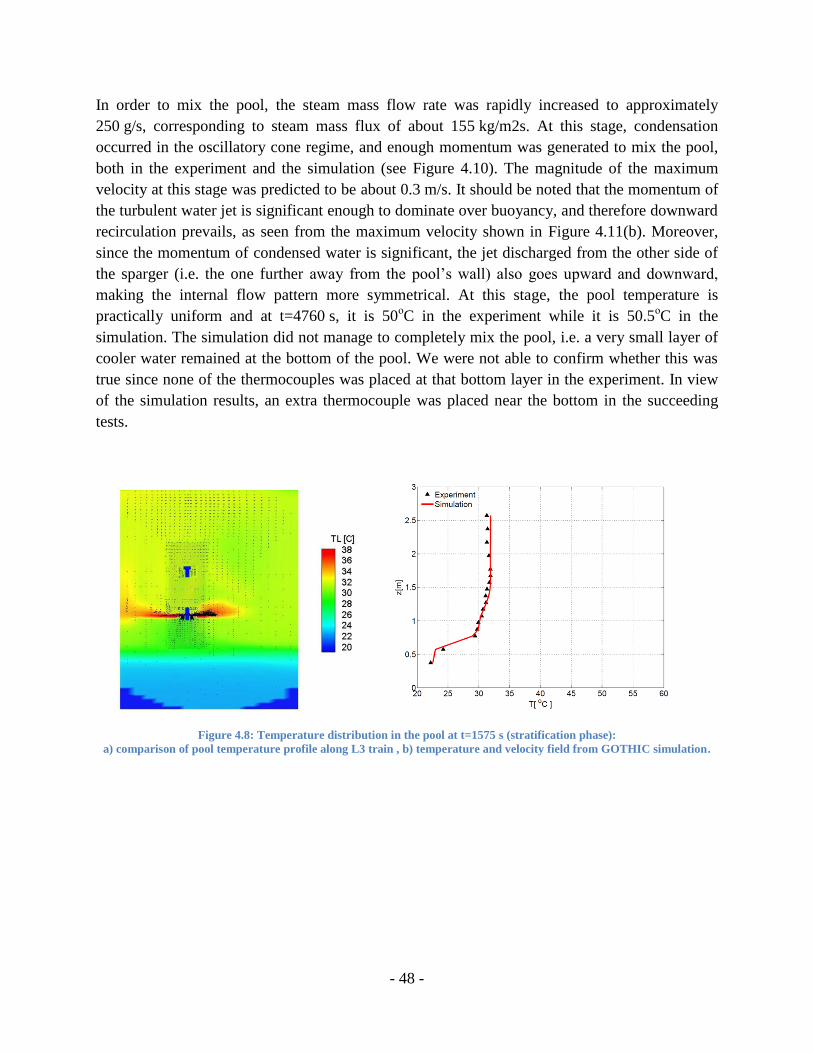
Figure 4.9: Temperature distribution in the pool at t=3387s (stratification phase):
a) temperature and velocity field from GOTHIC simulation, b) comparison of pool temperature
profile along L3 train. ............................................................................................................... - 49 -
Figure 4.10: Temperature distribution in the pool at t=4761s (mixing phase):
a) comparison of pool temperature profile along L3 train , b) temperature and velocity field from
GOTHIC simulation.................................................................................................................. - 49 -
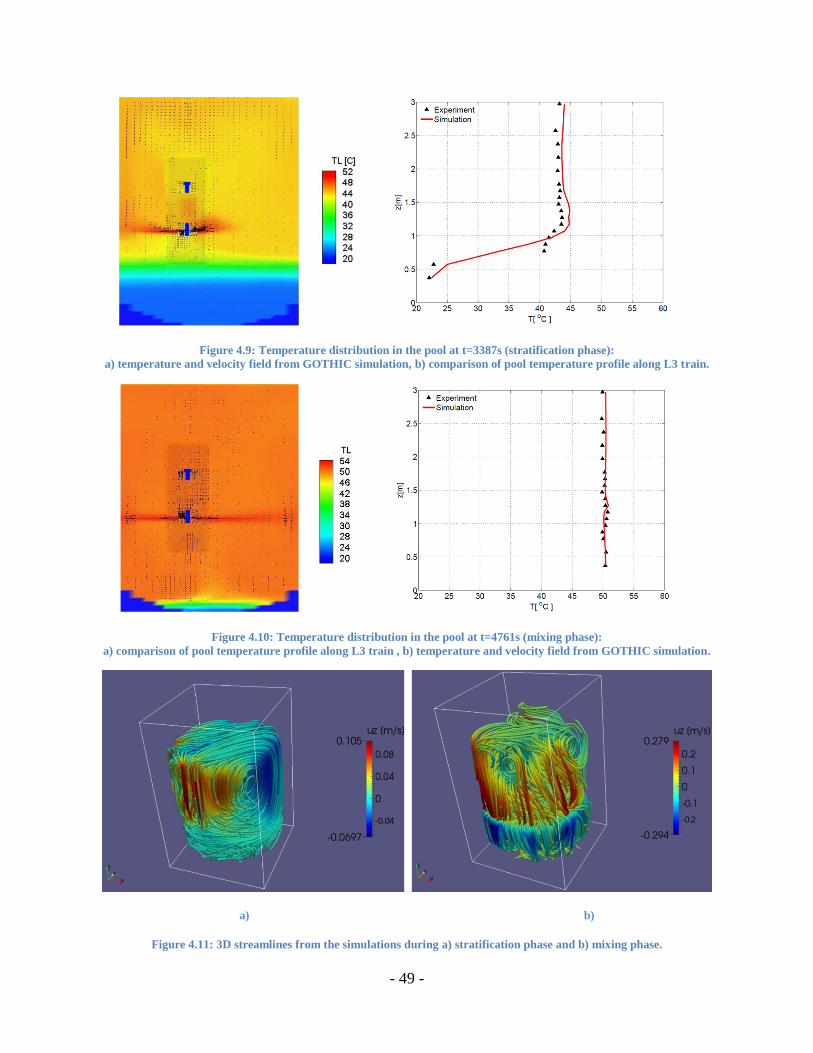
Figure 4.11: 3D streamlines from the simulations during a) stratification phase and b) mixing
phase. ........................................................................................................................................ - 49 -
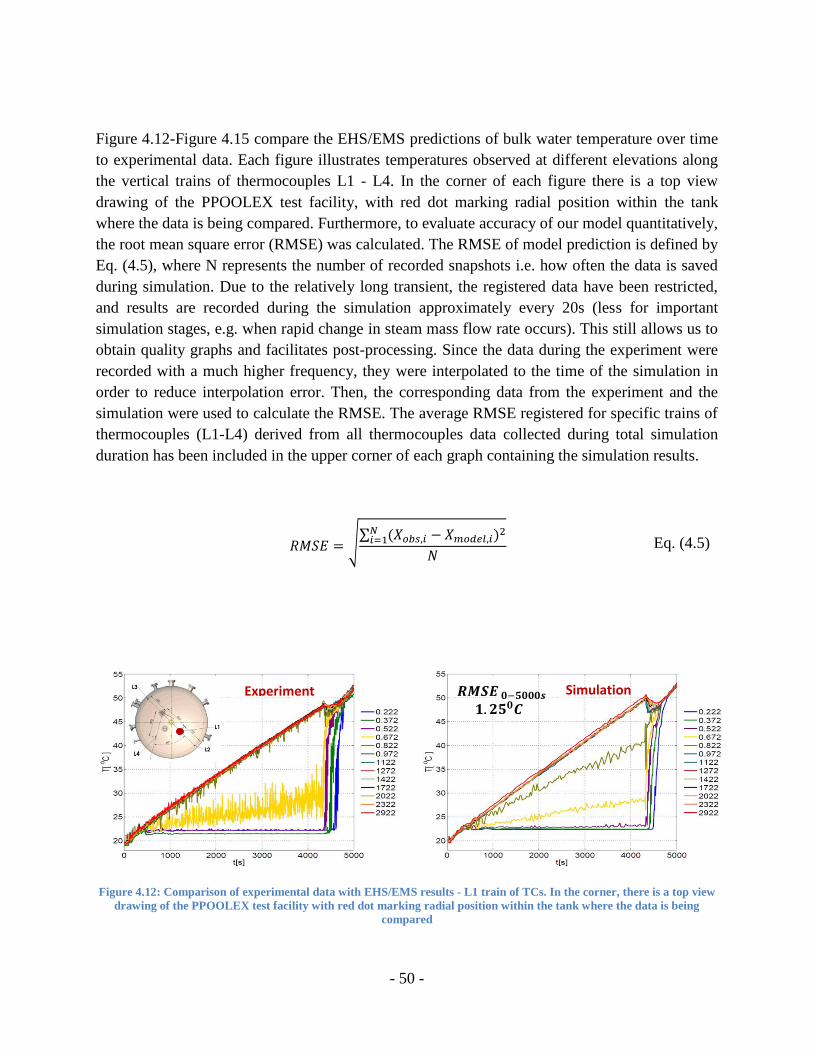
Figure 4.12: Comparison of experimental data with EHS/EMS results - L1 train of TCs. ...... - 50 -
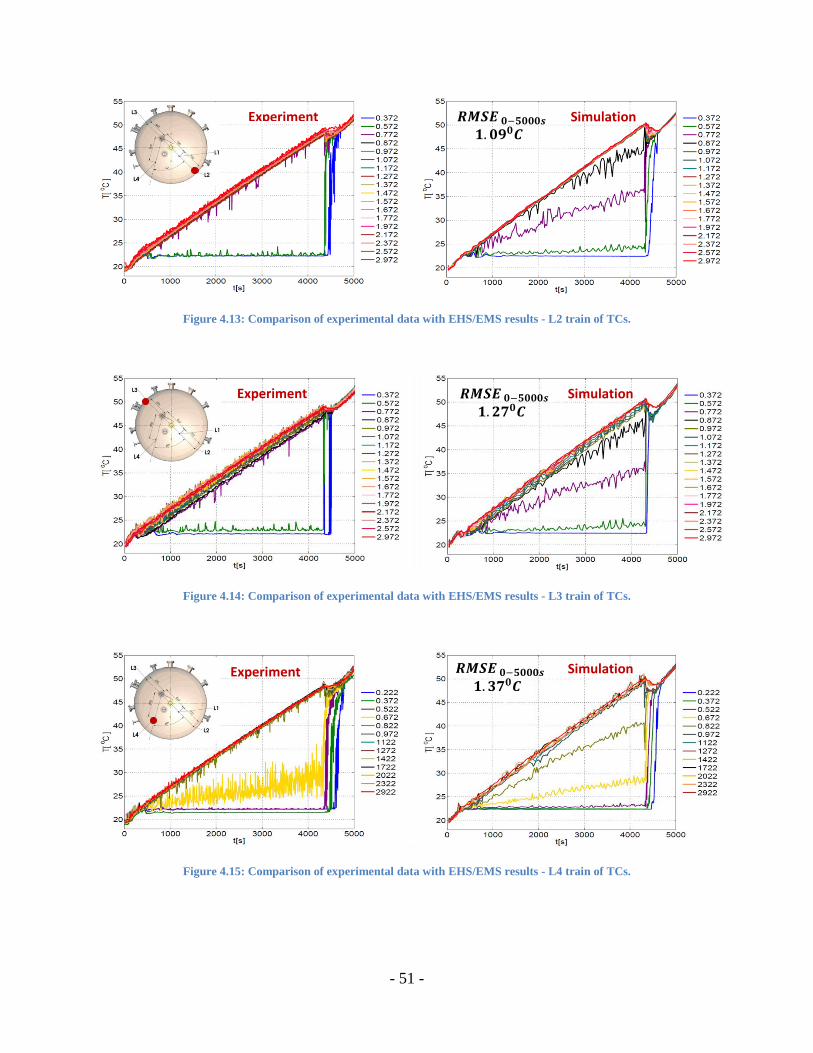
Figure 4.13: Comparison of experimental data with EHS/EMS results - L2 train of TCs. ...... - 51 -
Figure 4.14: Comparison of experimental data with EHS/EMS results - L3 train of TCs. ...... - 51 -
Figure 4.15: Comparison of experimental data with EHS/EMS results - L4 train of TCs. ...... - 51 -
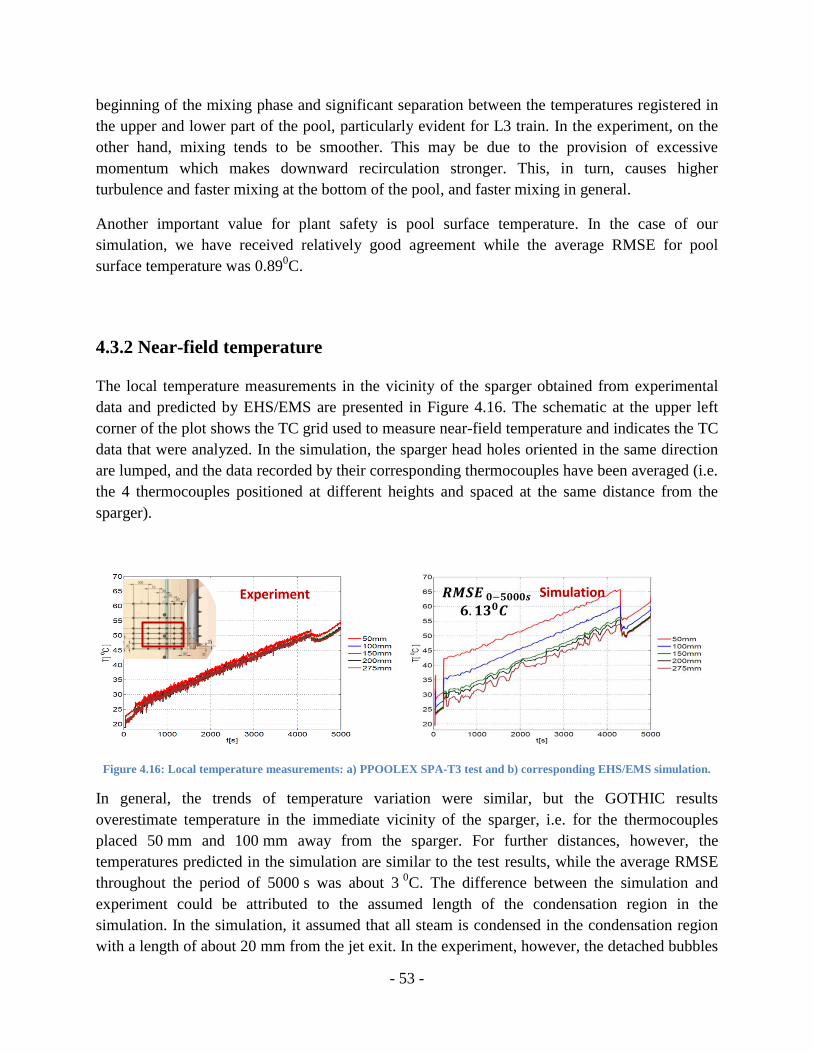
Figure 4.16: Local temperature measurements: a) PPOOLEX SPA-T3 test and b) corresponding
EHS/EMS simulation. ............................................................................................................... - 53 -
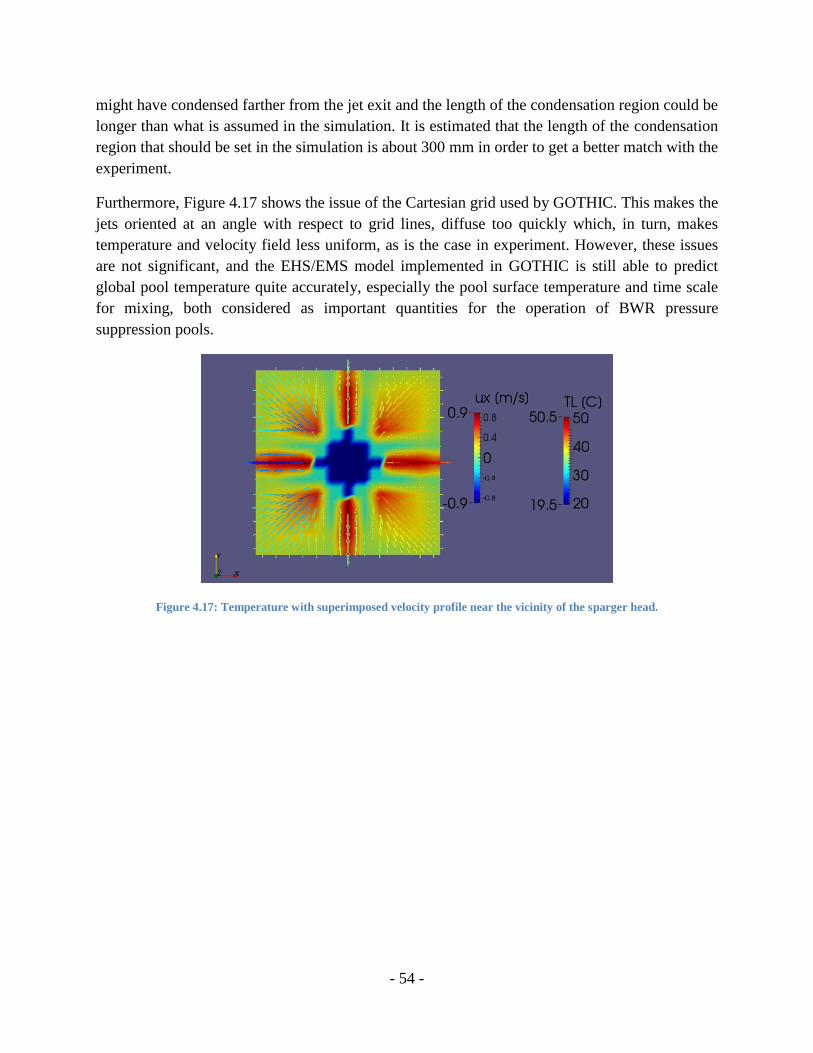
Figure 4.17: Temperature with superimposed velocity profile near the vicinity of the sparger
head. .......................................................................................................................................... - 54 -
Page 14
XII
LIST OF TABLES
Table 3.1: Prototypical steam injection conditions- SBO scenario [36] ................................... - 20 -
Table 3.2: Prototypical steam injection conditions- Leaking valve scenario [36] .................... - 20 -
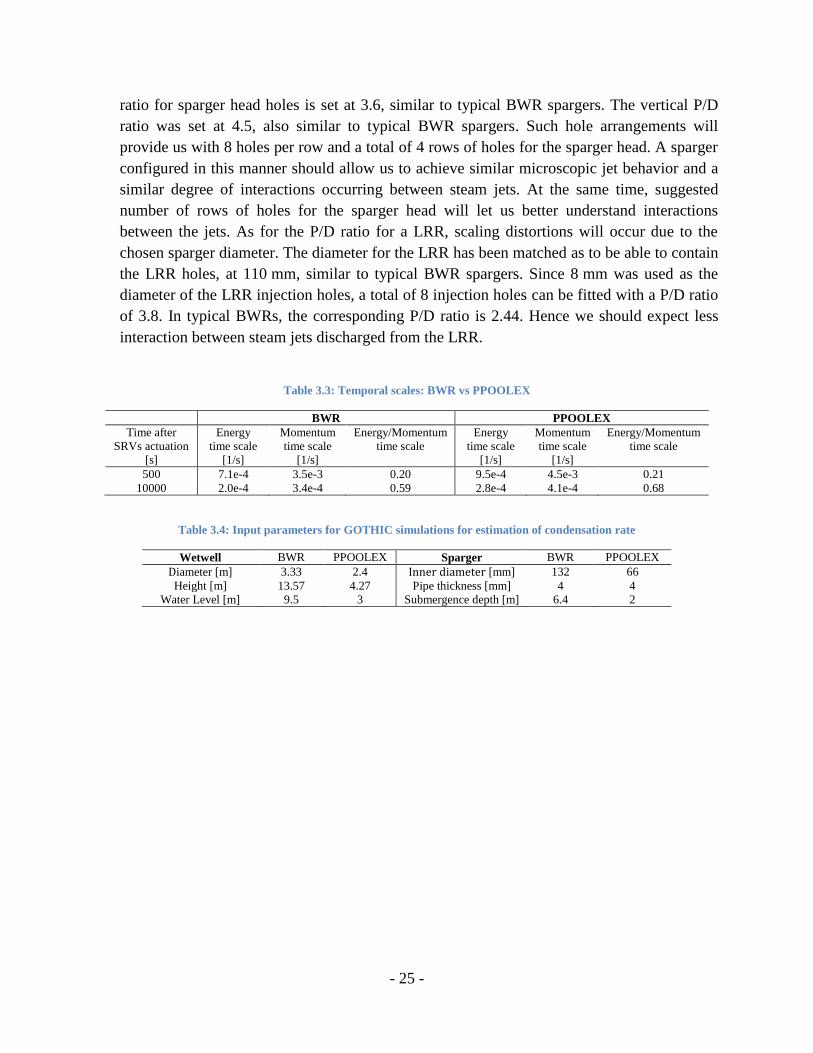
Table 3.3: Temporal scales: BWR vs PPOOLEX .................................................................... - 25 -
Table 3.4: Input parameters for GOTHIC simulations for estimation of condensation rate .... - 25 -
Table 3.5: Details on the computational grid used for pre-test calculations. ............................ - 28 -
Table 3.6: Initial and Boundary Conditions for pre-test simulations........................................ - 31 -
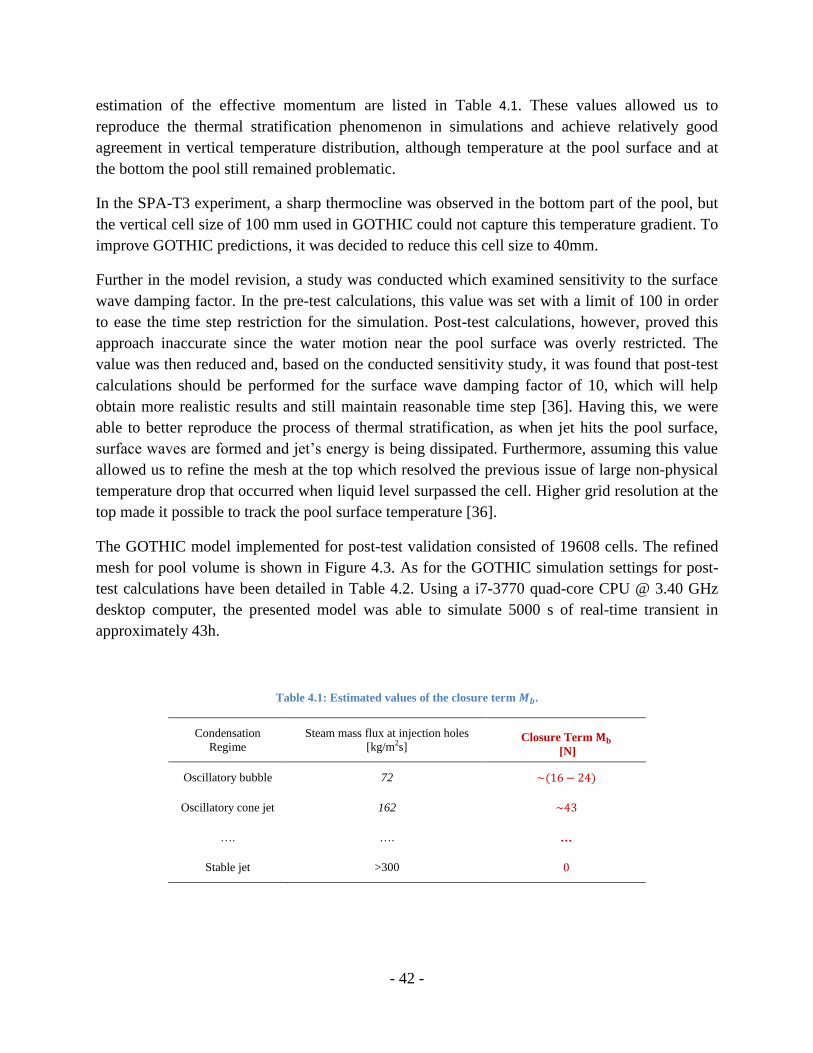
Table 4.1: Estimated values of the closure term . .............................................................. - 42 -
Table 4.2: GOTHIC simulation settings for the SPA-T3 case.................................................. - 43 -
Table 4.3: The test parameters of the SPA-T3 experiment. ...................................................... - 45 -
Page 15
- 1 -
1 Introduction
1.1 Motivation
The containment structure in a nuclear power plant is the final barrier in the defense in depth
concept against release of radioactive substances into the environment. However, there are
certain accidental or transient situations such as loss of coolant accident (LOCA) and safety
relief valve (SRV) actuation that may cause pressure to rise and threaten containment integrity.
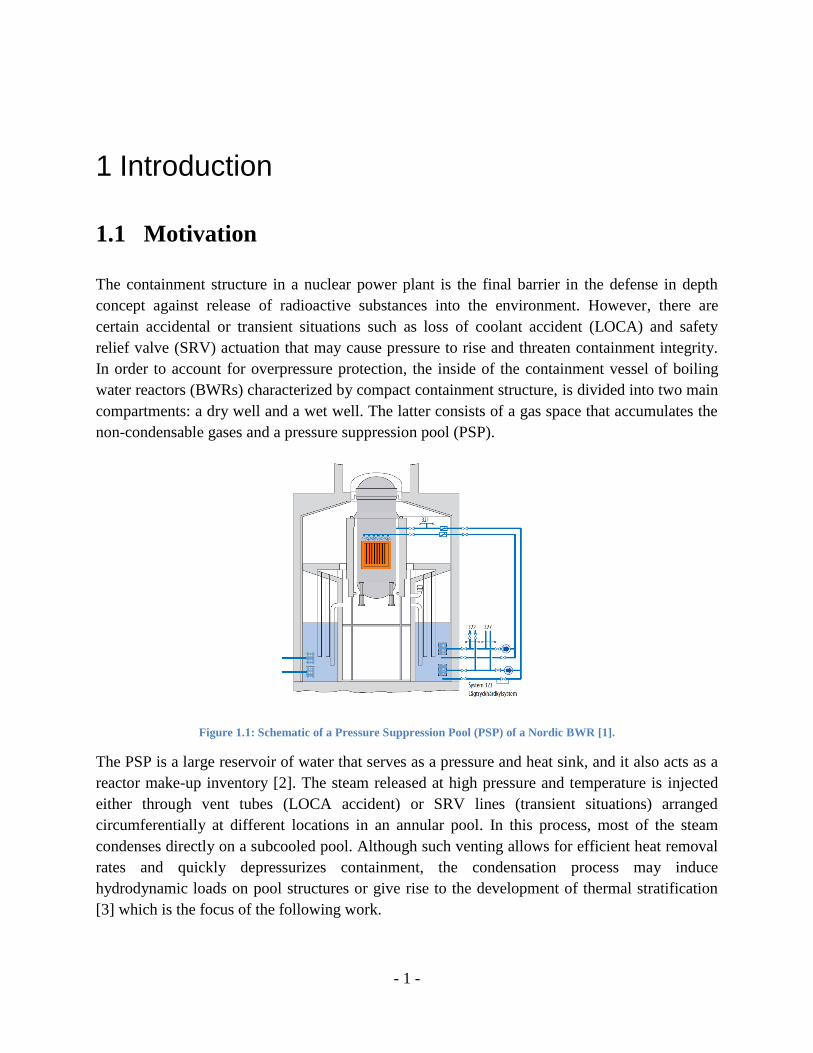
In order to account for overpressure protection, the inside of the containment vessel of boiling
water reactors (BWRs) characterized by compact containment structure, is divided into two main
compartments: a dry well and a wet well. The latter consists of a gas space that accumulates the
non-condensable gases and a pressure suppression pool (PSP).
Figure 1.1: Schematic of a Pressure Suppression Pool (PSP) of a Nordic BWR [1].
The PSP is a large reservoir of water that serves as a pressure and heat sink, and it also acts as a
reactor make-up inventory [2]. The steam released at high pressure and temperature is injected
either through vent tubes (LOCA accident) or SRV lines (transient situations) arranged
circumferentially at different locations in an annular pool. In this process, most of the steam
condenses directly on a subcooled pool. Although such venting allows for efficient heat removal
rates and quickly depressurizes containment, the condensation process may induce
hydrodynamic loads on pool structures or give rise to the development of thermal stratification
[3] which is the focus of the following work.
Page 16
- 2 -
In a thermally stratified pool, cold water is at the bottom whereas hot water is accumulated at the
top. Thermal stratification phenomenon is of primary importance for the overall PSP
performance since it can significantly diminish the pressure suppression capacity. Moreover, the
water surface temperature determines the steam partial pressure in the wet well, and any boost in
its temperature increases containment failure risk [4]. Thermal stratification also affects the
available net-positive suction head (NPSH) and therefore the performance of the Emergency
Core Cooling System (ECCS) and the Reactor Core Isolation Cooling System (RCIC) pumps [5].
It is then clear that homogeneous temperature distribution is the preferred state of the
suppression pool. Thermally stratified layers can be broken by turbulent mixing. Mixing can be
achieved either through the use of forced circulation (pumps), or when the steam discharged into
the subcooled pool has sufficient momentum (high-steam mass flux). The characteristic time
scale for turbulent mixing is an important value as it indicates the time period within which the
pressure suppression capacity will be restored [6].
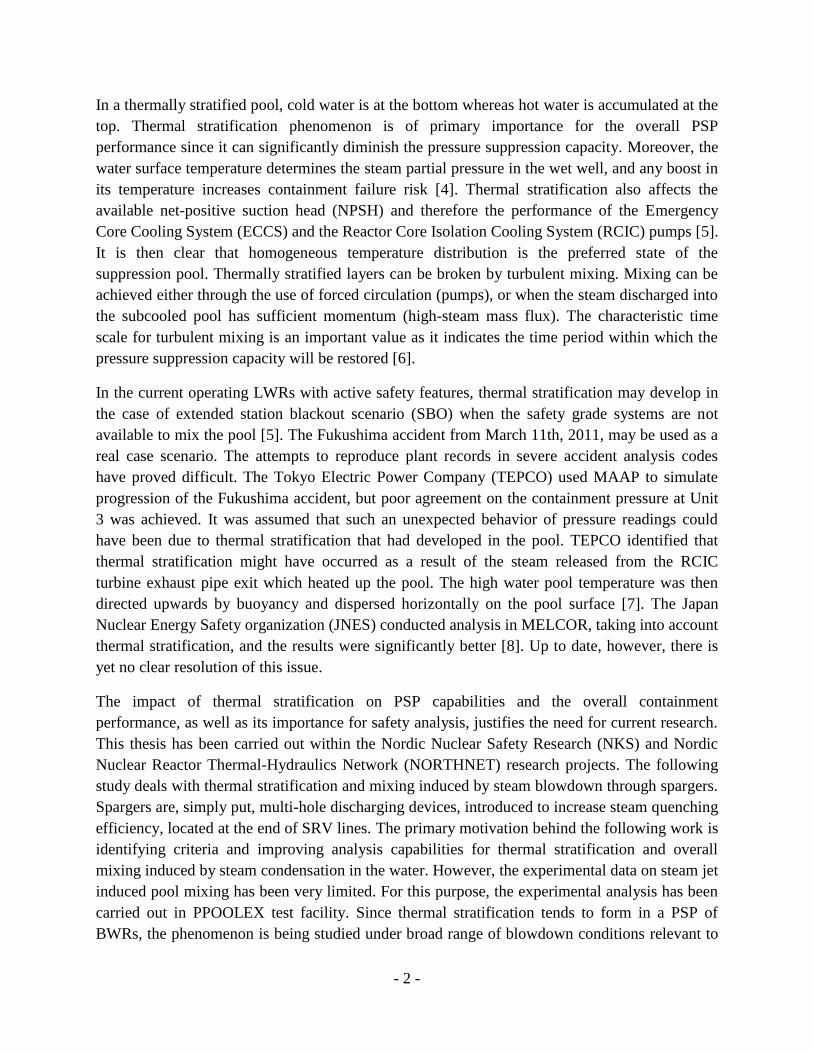
In the current operating LWRs with active safety features, thermal stratification may develop in
the case of extended station blackout scenario (SBO) when the safety grade systems are not
available to mix the pool [5]. The Fukushima accident from March 11th, 2011, may be used as a
real case scenario. The attempts to reproduce plant records in severe accident analysis codes
have proved difficult. The Tokyo Electric Power Company (TEPCO) used MAAP to simulate
progression of the Fukushima accident, but poor agreement on the containment pressure at Unit
3 was achieved. It was assumed that such an unexpected behavior of pressure readings could
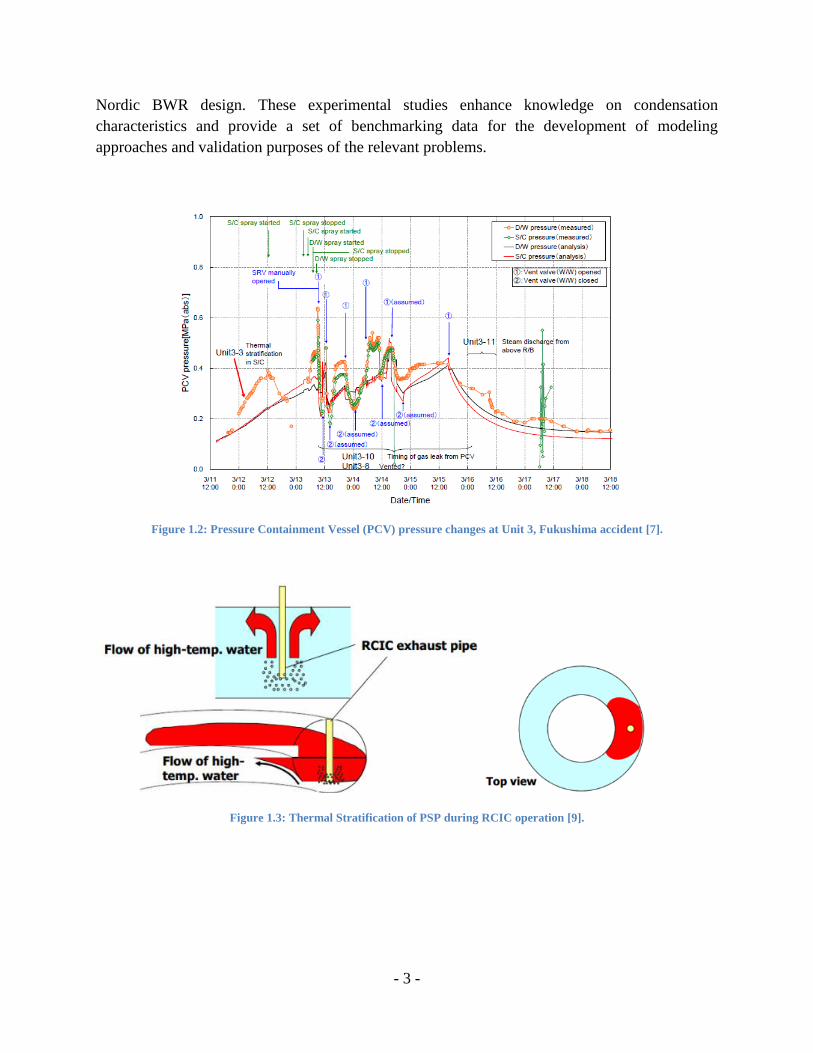
have been due to thermal stratification that had developed in the pool. TEPCO identified that
thermal stratification might have occurred as a result of the steam released from the RCIC
turbine exhaust pipe exit which heated up the pool. The high water pool temperature was then
directed upwards by buoyancy and dispersed horizontally on the pool surface [7]. The Japan
Nuclear Energy Safety organization (JNES) conducted analysis in MELCOR, taking into account
thermal stratification, and the results were significantly better [8]. Up to date, however, there is
yet no clear resolution of this issue.
The impact of thermal stratification on PSP capabilities and the overall containment
performance, as well as its importance for safety analysis, justifies the need for current research.
This thesis has been carried out within the Nordic Nuclear Safety Research (NKS) and Nordic
Nuclear Reactor Thermal-Hydraulics Network (NORTHNET) research projects. The following
study deals with thermal stratification and mixing induced by steam blowdown through spargers.
Spargers are, simply put, multi-hole discharging devices, introduced to increase steam quenching
efficiency, located at the end of SRV lines. The primary motivation behind the following work is
identifying criteria and improving analysis capabilities for thermal stratification and overall
mixing induced by steam condensation in the water. However, the experimental data on steam jet
induced pool mixing has been very limited. For this purpose, the experimental analysis has been
carried out in PPOOLEX test facility. Since thermal stratification tends to form in a PSP of
BWRs, the phenomenon is being studied under broad range of blowdown conditions relevant to
Page 17
- 3 -
Nordic BWR design. These experimental studies enhance knowledge on condensation
characteristics and provide a set of benchmarking data for the development of modeling
approaches and validation purposes of the relevant problems.
Figure 1.2: Pressure Containment Vessel (PCV) pressure changes at Unit 3, Fukushima accident [7].
Figure 1.3: Thermal Stratification of PSP during RCIC operation [9].
Page 18
- 4 -
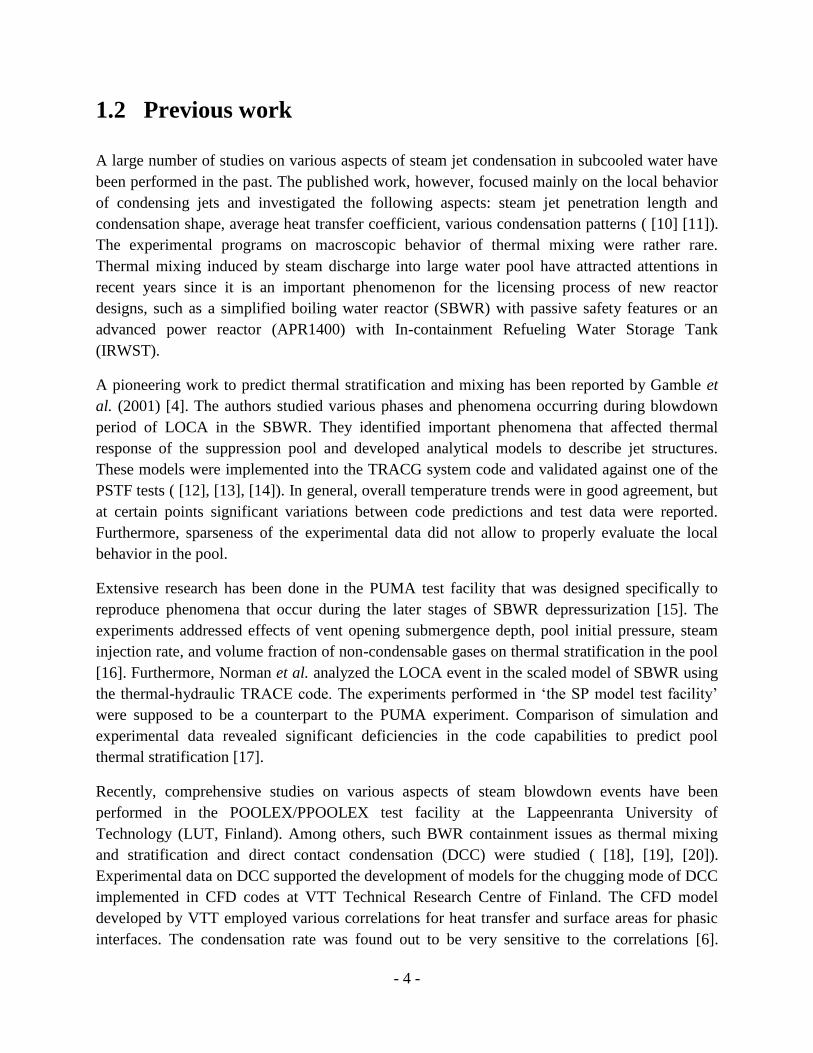
1.2 Previous work
A large number of studies on various aspects of steam jet condensation in subcooled water have
been performed in the past. The published work, however, focused mainly on the local behavior
of condensing jets and investigated the following aspects: steam jet penetration length and
condensation shape, average heat transfer coefficient, various condensation patterns ( [10] [11]).
The experimental programs on macroscopic behavior of thermal mixing were rather rare.
Thermal mixing induced by steam discharge into large water pool have attracted attentions in
recent years since it is an important phenomenon for the licensing process of new reactor
designs, such as a simplified boiling water reactor (SBWR) with passive safety features or an
advanced power reactor (APR1400) with In-containment Refueling Water Storage Tank
(IRWST).
A pioneering work to predict thermal stratification and mixing has been reported by Gamble et
al. (2001) [4]. The authors studied various phases and phenomena occurring during blowdown
period of LOCA in the SBWR. They identified important phenomena that affected thermal
response of the suppression pool and developed analytical models to describe jet structures.
These models were implemented into the TRACG system code and validated against one of the
PSTF tests ( [12], [13], [14]). In general, overall temperature trends were in good agreement, but
at certain points significant variations between code predictions and test data were reported.
Furthermore, sparseness of the experimental data did not allow to properly evaluate the local
behavior in the pool.
Extensive research has been done in the PUMA test facility that was designed specifically to
reproduce phenomena that occur during the later stages of SBWR depressurization [15]. The
experiments addressed effects of vent opening submergence depth, pool initial pressure, steam
injection rate, and volume fraction of non-condensable gases on thermal stratification in the pool
[16]. Furthermore, Norman et al. analyzed the LOCA event in the scaled model of SBWR using
the thermal-hydraulic TRACE code. The experiments performed in ‘the SP model test facility’
were supposed to be a counterpart to the PUMA experiment. Comparison of simulation and
experimental data revealed significant deficiencies in the code capabilities to predict pool
thermal stratification [17].
Recently, comprehensive studies on various aspects of steam blowdown events have been
performed in the POOLEX/PPOOLEX test facility at the Lappeenranta University of
Technology (LUT, Finland). Among others, such BWR containment issues as thermal mixing
and stratification and direct contact condensation (DCC) were studied ( [18], [19], [20]).
Experimental data on DCC supported the development of models for the chugging mode of DCC
implemented in CFD codes at VTT Technical Research Centre of Finland. The CFD model
developed by VTT employed various correlations for heat transfer and surface areas for phasic
interfaces. The condensation rate was found out to be very sensitive to the correlations [6].
Page 19
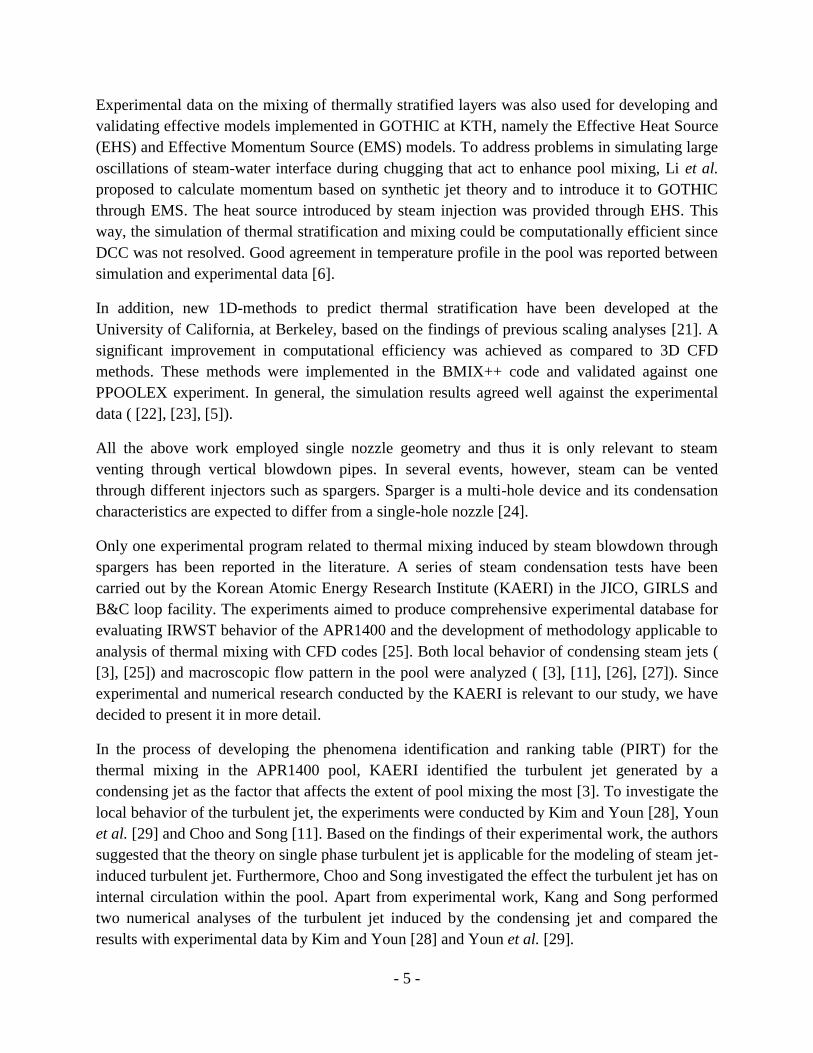
- 5 -
Experimental data on the mixing of thermally stratified layers was also used for developing and
validating effective models implemented in GOTHIC at KTH, namely the Effective Heat Source
(EHS) and Effective Momentum Source (EMS) models. To address problems in simulating large
oscillations of steam-water interface during chugging that act to enhance pool mixing, Li et al.
proposed to calculate momentum based on synthetic jet theory and to introduce it to GOTHIC
through EMS. The heat source introduced by steam injection was provided through EHS. This
way, the simulation of thermal stratification and mixing could be computationally efficient since
DCC was not resolved. Good agreement in temperature profile in the pool was reported between
simulation and experimental data [6].
In addition, new 1D-methods to predict thermal stratification have been developed at the
University of California, at Berkeley, based on the findings of previous scaling analyses [21]. A
significant improvement in computational efficiency was achieved as compared to 3D CFD
methods. These methods were implemented in the BMIX++ code and validated against one
PPOOLEX experiment. In general, the simulation results agreed well against the experimental
data ( [22], [23], [5]).
All the above work employed single nozzle geometry and thus it is only relevant to steam
venting through vertical blowdown pipes. In several events, however, steam can be vented
through different injectors such as spargers. Sparger is a multi-hole device and its condensation
characteristics are expected to differ from a single-hole nozzle [24].
Only one experimental program related to thermal mixing induced by steam blowdown through
spargers has been reported in the literature. A series of steam condensation tests have been
carried out by the Korean Atomic Energy Research Institute (KAERI) in the JICO, GIRLS and
B&C loop facility. The experiments aimed to produce comprehensive experimental database for
evaluating IRWST behavior of the APR1400 and the development of methodology applicable to
analysis of thermal mixing with CFD codes [25]. Both local behavior of condensing steam jets (
[3], [25]) and macroscopic flow pattern in the pool were analyzed ( [3], [11], [26], [27]). Since
experimental and numerical research conducted by the KAERI is relevant to our study, we have
decided to present it in more detail.
In the process of developing the phenomena identification and ranking table (PIRT) for the
thermal mixing in the APR1400 pool, KAERI identified the turbulent jet generated by a
condensing jet as the factor that affects the extent of pool mixing the most [3]. To investigate the
local behavior of the turbulent jet, the experiments were conducted by Kim and Youn [28], Youn
et al. [29] and Choo and Song [11]. Based on the findings of their experimental work, the authors
suggested that the theory on single phase turbulent jet is applicable for the modeling of steam jet-
induced turbulent jet. Furthermore, Choo and Song investigated the effect the turbulent jet has on
internal circulation within the pool. Apart from experimental work, Kang and Song performed
two numerical analyses of the turbulent jet induced by the condensing jet and compared the
results with experimental data by Kim and Youn [28] and Youn et al. [29].
Page 20
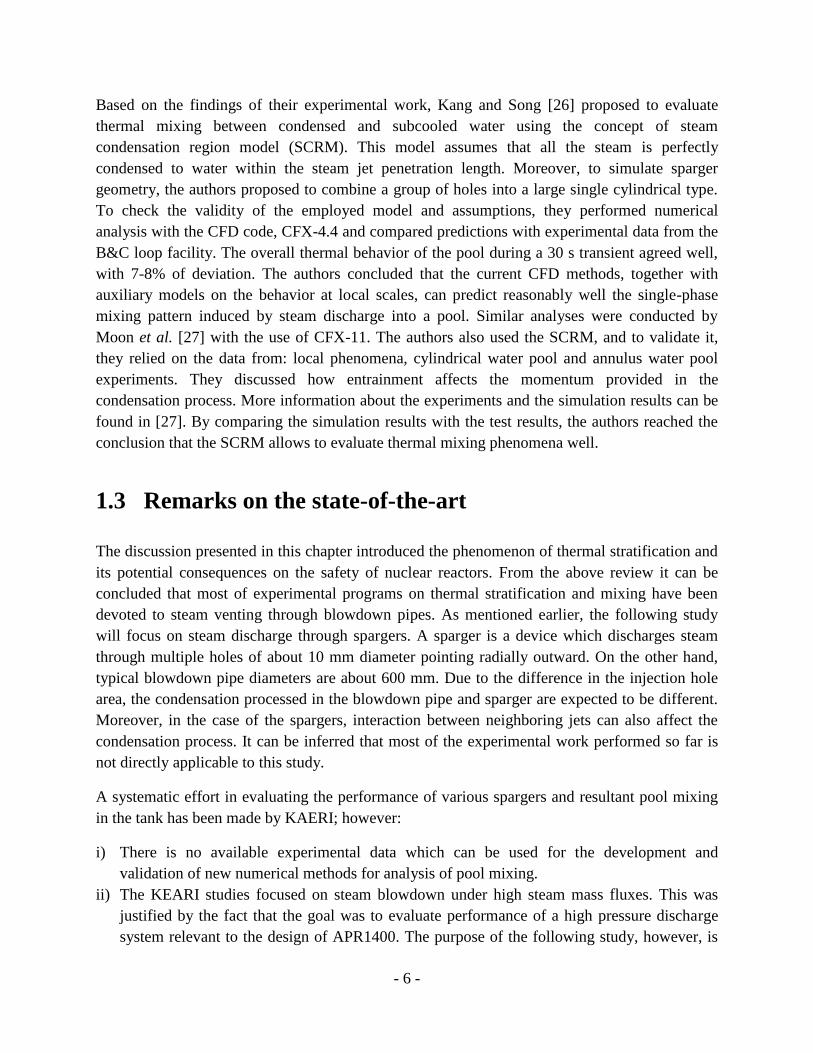
- 6 -
Based on the findings of their experimental work, Kang and Song [26] proposed to evaluate
thermal mixing between condensed and subcooled water using the concept of steam
condensation region model (SCRM). This model assumes that all the steam is perfectly
condensed to water within the steam jet penetration length. Moreover, to simulate sparger
geometry, the authors proposed to combine a group of holes into a large single cylindrical type.
To check the validity of the employed model and assumptions, they performed numerical
analysis with the CFD code, CFX-4.4 and compared predictions with experimental data from the
B&C loop facility. The overall thermal behavior of the pool during a 30 s transient agreed well,
with 7-8% of deviation. The authors concluded that the current CFD methods, together with
auxiliary models on the behavior at local scales, can predict reasonably well the single-phase
mixing pattern induced by steam discharge into a pool. Similar analyses were conducted by
Moon et al. [27] with the use of CFX-11. The authors also used the SCRM, and to validate it,
they relied on the data from: local phenomena, cylindrical water pool and annulus water pool
experiments. They discussed how entrainment affects the momentum provided in the
condensation process. More information about the experiments and the simulation results can be
found in [27]. By comparing the simulation results with the test results, the authors reached the
conclusion that the SCRM allows to evaluate thermal mixing phenomena well.
1.3 Remarks on the state-of-the-art
The discussion presented in this chapter introduced the phenomenon of thermal stratification and
its potential consequences on the safety of nuclear reactors. From the above review it can be
concluded that most of experimental programs on thermal stratification and mixing have been
devoted to steam venting through blowdown pipes. As mentioned earlier, the following study
will focus on steam discharge through spargers. A sparger is a device which discharges steam
through multiple holes of about 10 mm diameter pointing radially outward. On the other hand,
typical blowdown pipe diameters are about 600 mm. Due to the difference in the injection hole
area, the condensation processed in the blowdown pipe and sparger are expected to be different.
Moreover, in the case of the spargers, interaction between neighboring jets can also affect the
condensation process. It can be inferred that most of the experimental work performed so far is
not directly applicable to this study.
A systematic effort in evaluating the performance of various spargers and resultant pool mixing
in the tank has been made by KAERI; however:
i) There is no available experimental data which can be used for the development and
validation of new numerical methods for analysis of pool mixing.
ii) The KEARI studies focused on steam blowdown under high steam mass fluxes. This was
justified by the fact that the goal was to evaluate performance of a high pressure discharge
system relevant to the design of APR1400. The purpose of the following study, however, is
Page 21
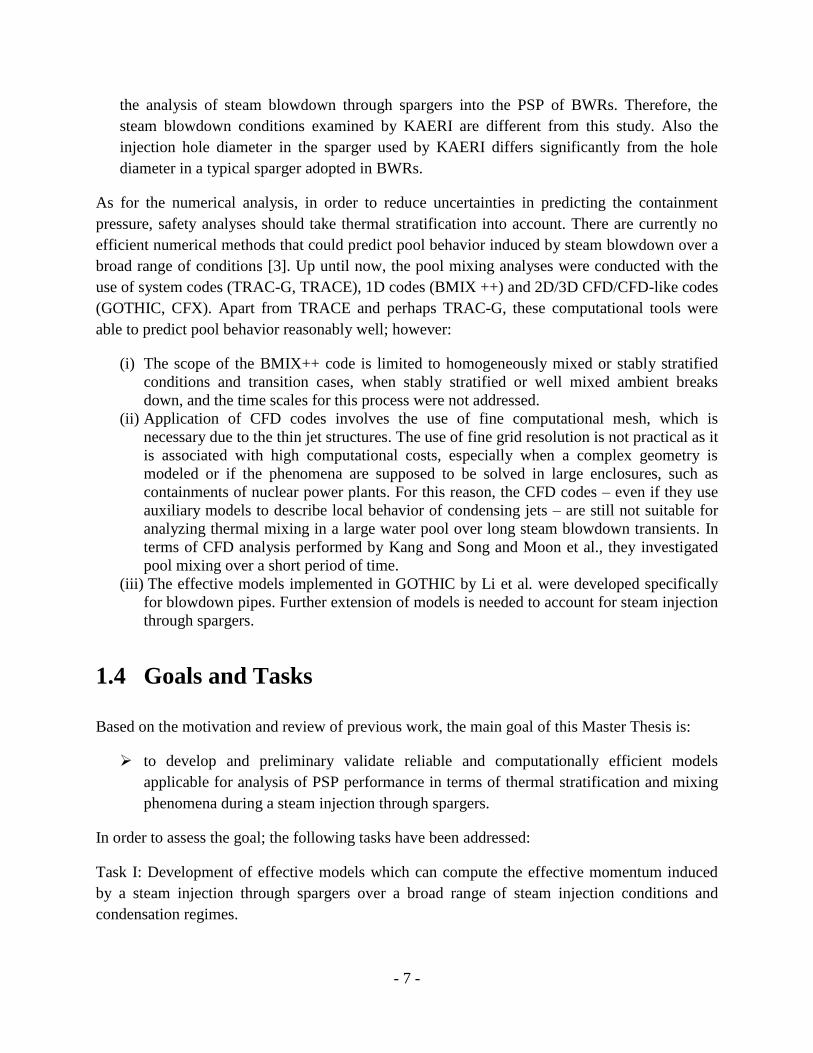
- 7 -
the analysis of steam blowdown through spargers into the PSP of BWRs. Therefore, the
steam blowdown conditions examined by KAERI are different from this study. Also the
injection hole diameter in the sparger used by KAERI differs significantly from the hole
diameter in a typical sparger adopted in BWRs.
As for the numerical analysis, in order to reduce uncertainties in predicting the containment
pressure, safety analyses should take thermal stratification into account. There are currently no
efficient numerical methods that could predict pool behavior induced by steam blowdown over a
broad range of conditions [3]. Up until now, the pool mixing analyses were conducted with the
use of system codes (TRAC-G, TRACE), 1D codes (BMIX ++) and 2D/3D CFD/CFD-like codes
(GOTHIC, CFX). Apart from TRACE and perhaps TRAC-G, these computational tools were
able to predict pool behavior reasonably well; however:
(i) The scope of the BMIX++ code is limited to homogeneously mixed or stably stratified
conditions and transition cases, when stably stratified or well mixed ambient breaks
down, and the time scales for this process were not addressed.
(ii) Application of CFD codes involves the use of fine computational mesh, which is
necessary due to the thin jet structures. The use of fine grid resolution is not practical as it
is associated with high computational costs, especially when a complex geometry is
modeled or if the phenomena are supposed to be solved in large enclosures, such as
containments of nuclear power plants. For this reason, the CFD codes – even if they use
auxiliary models to describe local behavior of condensing jets – are still not suitable for
analyzing thermal mixing in a large water pool over long steam blowdown transients. In
terms of CFD analysis performed by Kang and Song and Moon et al., they investigated
pool mixing over a short period of time.
(iii) The effective models implemented in GOTHIC by Li et al. were developed specifically
for blowdown pipes. Further extension of models is needed to account for steam injection
through spargers.
1.4 Goals and Tasks
Based on the motivation and review of previous work, the main goal of this Master Thesis is:
to develop and preliminary validate reliable and computationally efficient models
applicable for analysis of PSP performance in terms of thermal stratification and mixing
phenomena during a steam injection through spargers.
In order to assess the goal; the following tasks have been addressed:
Task I: Development of effective models which can compute the effective momentum induced
by a steam injection through spargers over a broad range of steam injection conditions and
condensation regimes.
Page 22
- 8 -
Task II: Development of a scaling approach that can be used to design the experiments with
spargers at the PPOOLEX facility, so that they can reproduce the thermal hydraulic phenomena
and regimes relevant to a BWR-PSP.
Task III: Pre-test analytical support in order to:
(i) verify that the BWR pool regimes can be reproduced in the PPOOLEX tests,
(ii) define the instrumentation setup,
(iii) define a test-matrix.
Task IV: Validation of the proposed models against PPOOLEX experiments
Page 23
- 9 -
2 Development of effective models for spargers
2.1 Approach
The analysis of thermal mixing due to steam injection is difficult to perform with current
computational techniques. Problems associated with this process can be attributed mainly to the
complex thermal-hydraulic characteristics of Direct Contact Condensation (DCC). Due to the
complexity of this condensation process, current CFD codes are still not able to resolve DCC
phenomenon accurately. Moreover, resolving DCC requires fine mesh resolution and severe
restrictions in the time step. Therefore, it appears necessary to develop new models for analyzing
thermal mixing in large water pools.
Effective models for analysis of thermal stratification and mixing are being currently developed
at the Nuclear Safety Department at KTH. These models were named as the Effective Heat
Source (EHS) and Effective Momentum Source (EMS). The idea behind the EHS/EMS models
is that it is not necessary to resolve the DCC phenomena in order to predict the global pool
thermal behavior. Up to now, EHS/EMS models have been developed and validated for steam
injection through blowdown pipes against PPOOLEX experiments; further works are underway
with regard to the development of models to account for steam injection through spargers, RHR
nozzles, strainers and sprays. These works aim to provide a complete set of models that will be
able to predict the behavior of PSP under transient or accidental conditions.
In the EHS/EMS models, Li et al. [6] stipulated that phenomena occurring at local (small) scales
are lost due to large differences in time/space scales of DCC and resultant macroscopic
circulation within the pool. Thus, only integral effects of the local behavior of condensing steam
jet were accounted for with respect to thermal mixing in the pool. This approach to the problem
is advantageous since resolving DCC is avoided, and only the transfer of energy and momentum
from the steam to the surrounding water are considered. It is the energy of injected steam that
influences the pool thermal response, whereas the momentum derived from condensation leads
to the development of macroscopic circulation within the pool.
This master thesis aims to develop and preliminary validate effective models which can be used
to predict the thermal behavior of a water pool during a steam injection through spargers. The
EHS/EMS approach presented above is valid for the purposes of this work as it will allow the
simulation of thermal mixing and stratification in a large water pool, such as PSP of BWRs, with
acceptable accuracy and significantly increased computational efficiency.
Page 24
- 10 -
2.2 EHS/EMS models for spargers
Generally, the Effective Heat Source and Effective Momentum Source (EHS/EMS) models are
proposed to predict and simulate thermal stratification and mixing in a pool induced by steam
and/or fluid (water and non-condensable gases) injection through blowdown pipes, spargers,
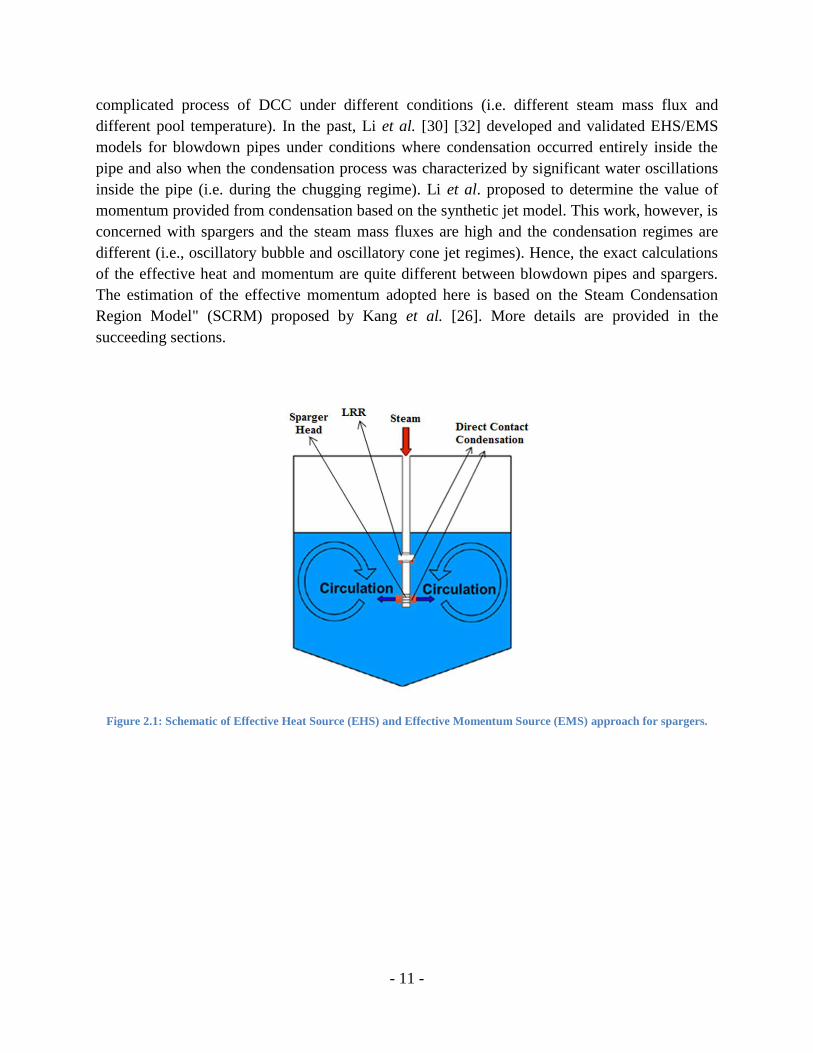
strainers, and/or nozzles [30]. The schematic of the EHS/EMS approach is shown in Figure 2.1.
The EHS model [30] provides an integral heat source defined by
∫
Eq. (2.1)
where and
are time-averaged mass flow and enthalpy, respectively. A heat source is
calculated separately for the LRR and sparger head. Also, the time-averaging ∆t is considered
much longer than the time scale of DCC. In the EHS model, mass and energies provided with
steam are conserved. However, in order for the model to function well, proper spatial distribution
of the effective heat source also needs to be taken care of. The EHS model for spargers assumes
that entire condensation occurs on the surface of subcooled water, and therefore total effective
heat source is applied at the injection holes. This assumption should not differ significantly from
reality since the spargers have been introduced in order to increase steam quenching efficiency,
and are characterized by a large number of injection holes with small diameters. Post-test
analysis also confirms that condensation inside the sparger is significantly less compared to the
condensation at the exit holes.
The EMS model, on the other hand, provides time-averaged momentum induced by steam
injection. The effective momentum depends on the condensation regime and does not necessarily
equal the momentum of injected steam. This is due to the fact that there are different patterns of
fluid oscillations in the pool depending on the condensation regime. More information on the
condensation regimes can be found in Section 2.3.1 as well as in [31]. The EMS model [30]
calculates the time-averaged effective momentum source defined by
∫
Eq. (2.2)
where is an instantaneous momentum of the condensed water at the exit holes. A momentum
source is calculated separately for the LRR and sparger head.
The main challenge in the development of these EHS/EMS models is to find simplified
analytical models able to predict the integral heat and momentum sources generated by the
Page 25
- 11 -
complicated process of DCC under different conditions (i.e. different steam mass flux and
different pool temperature). In the past, Li et al. [30] [32] developed and validated EHS/EMS
models for blowdown pipes under conditions where condensation occurred entirely inside the
pipe and also when the condensation process was characterized by significant water oscillations
inside the pipe (i.e. during the chugging regime). Li et al. proposed to determine the value of
momentum provided from condensation based on the synthetic jet model. This work, however, is
concerned with spargers and the steam mass fluxes are high and the condensation regimes are
different (i.e., oscillatory bubble and oscillatory cone jet regimes). Hence, the exact calculations
of the effective heat and momentum are quite different between blowdown pipes and spargers.
The estimation of the effective momentum adopted here is based on the Steam Condensation
Region Model" (SCRM) proposed by Kang et al. [26]. More details are provided in the
succeeding sections.
Figure 2.1: Schematic of Effective Heat Source (EHS) and Effective Momentum Source (EMS) approach for spargers.
Page 26
- 12 -
2.3 Modeling at local scales
2.3.1 Local behavior of condensing steam jet
In order to develop the mathematical models that could be implemented in the analysis of
thermal mixing in the pool, one first needs to understand the mechanism of condensation. Thus
the model development process should begin by analyzing a single condensing steam jet.
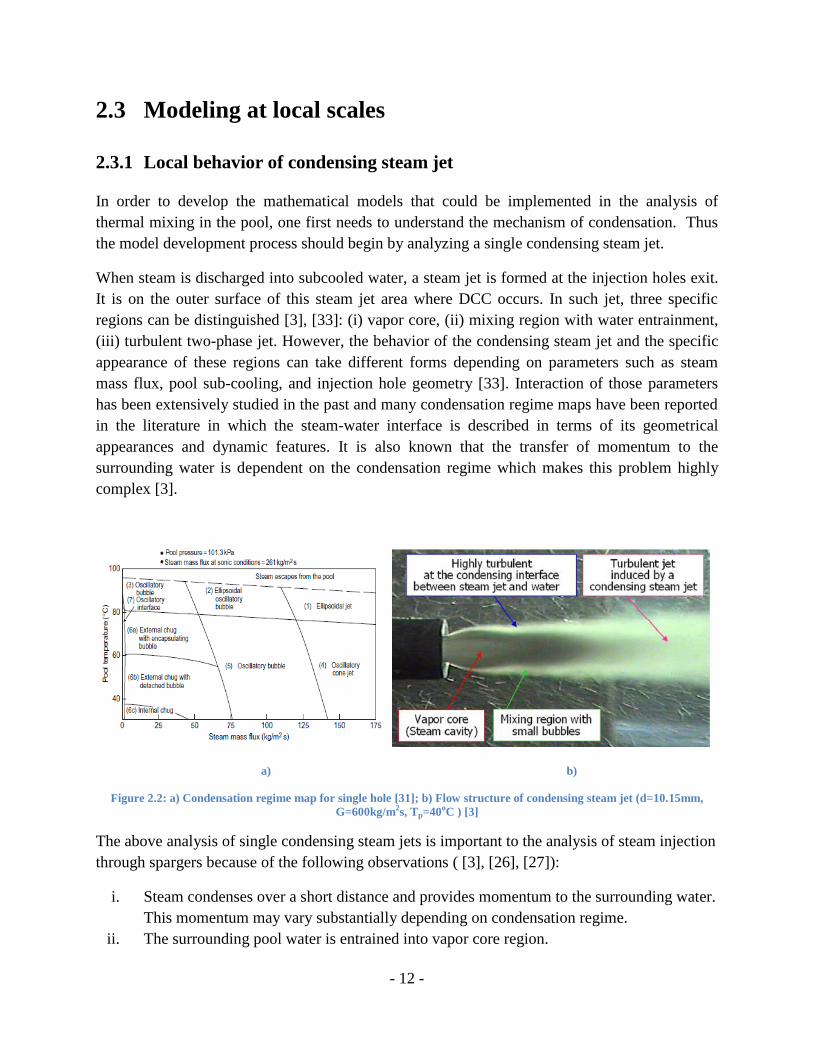
When steam is discharged into subcooled water, a steam jet is formed at the injection holes exit.
It is on the outer surface of this steam jet area where DCC occurs. In such jet, three specific
regions can be distinguished [3], [33]: (i) vapor core, (ii) mixing region with water entrainment,
(iii) turbulent two-phase jet. However, the behavior of the condensing steam jet and the specific
appearance of these regions can take different forms depending on parameters such as steam
mass flux, pool sub-cooling, and injection hole geometry [33]. Interaction of those parameters
has been extensively studied in the past and many condensation regime maps have been reported
in the literature in which the steam-water interface is described in terms of its geometrical
appearances and dynamic features. It is also known that the transfer of momentum to the
surrounding water is dependent on the condensation regime which makes this problem highly
complex [3].
a) b)
Figure 2.2: a) Condensation regime map for single hole [31]; b) Flow structure of condensing steam jet (d=10.15mm,
G=600kg/m2s, Tp=40oC ) [3]
The above analysis of single condensing steam jets is important to the analysis of steam injection
through spargers because of the following observations ( [3], [26], [27]):
i. Steam condenses over a short distance and provides momentum to the surrounding water.
This momentum may vary substantially depending on condensation regime.
ii. The surrounding pool water is entrained into vapor core region.
Page 27
- 13 -
iii. A turbulent jet is formed and it propels the macroscopic circulation within the pool.
Moreover, previous studies have shown that two-phase turbulent jet also shows self-
similarity and can be modeled through single-phase turbulent jet.
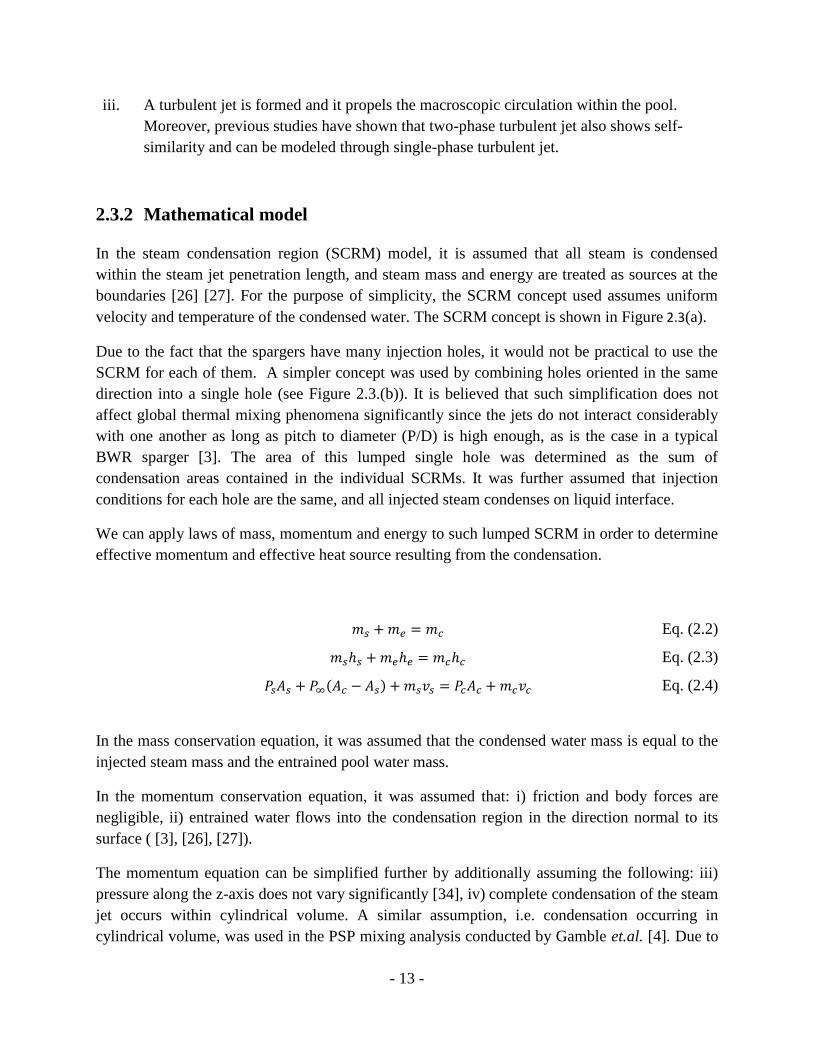
2.3.2 Mathematical model
In the steam condensation region (SCRM) model, it is assumed that all steam is condensed
within the steam jet penetration length, and steam mass and energy are treated as sources at the
boundaries [26] [27]. For the purpose of simplicity, the SCRM concept used assumes uniform
velocity and temperature of the condensed water. The SCRM concept is shown in Figure 2.3(a).
Due to the fact that the spargers have many injection holes, it would not be practical to use the
SCRM for each of them. A simpler concept was used by combining holes oriented in the same
direction into a single hole (see Figure 2.3.(b)). It is believed that such simplification does not
affect global thermal mixing phenomena significantly since the jets do not interact considerably
with one another as long as pitch to diameter (P/D) is high enough, as is the case in a typical
BWR sparger [3]. The area of this lumped single hole was determined as the sum of
condensation areas contained in the individual SCRMs. It was further assumed that injection
conditions for each hole are the same, and all injected steam condenses on liquid interface.
We can apply laws of mass, momentum and energy to such lumped SCRM in order to determine
effective momentum and effective heat source resulting from the condensation.
Eq. (2.2)
Eq. (2.3)
Eq. (2.4)
In the mass conservation equation, it was assumed that the condensed water mass is equal to the
injected steam mass and the entrained pool water mass.
In the momentum conservation equation, it was assumed that: i) friction and body forces are
negligible, ii) entrained water flows into the condensation region in the direction normal to its
surface ( [3], [26], [27]).
The momentum equation can be simplified further by additionally assuming the following: iii)
pressure along the z-axis does not vary significantly [34], iv) complete condensation of the steam
jet occurs within cylindrical volume. A similar assumption, i.e. condensation occurring in
cylindrical volume, was used in the PSP mixing analysis conducted by Gamble et.al. [4]. Due to
Page 28
- 14 -
the above assumptions, the momentum equation was finally expressed by Eq. (2.5) and this
equation will be used in pre-test calculations.
Eq. (2.5)
As for the calculation procedure, Eq. (2.5) was first used to calculate the velocity of condensed
water. Then, this velocity was used to calculate the mass of condensed and entrained water with
equation Eq. (2.2). The resulting data allowed us then to calculate the enthalpy of condensed
water with Eq. (2.3).
It should be noted that this model is only valid for the case where the entire momentum is
transported to the condensed water jet.
a) b)
Figure 2.3: SCRM: a) individual model [27], b) lumped model
2.4 Computational Analysis Tool
Proper modeling of mixing patterns induced by steam jets requires a prediction tool with three-
dimensional capabilities. Furthermore, in the case of devices such as spargers, multiplicity of
injection holes may trigger complicated flow patterns due to interaction occurring between
neighboring steam jets.
Although Kang and Song [26] and Moon et al. [27] evaluated pool thermal hydraulic behavior
using CFX 4.4 and CFX 11 software with the SCRM, they only computed a small transient of
approximately 30s (Kang and Song) and 300s (Moon et al.). The main goal of the EHS/EMS
Page 29
- 15 -
models developed at the KTH is their further application in the analysis of the PSP pool behavior
under realistic transient situations. In general, these transient situations occur over a broad range
of steam blowdown conditions and need to be analyzed over a long period of time. For example:
the development of thermal stratification in PSP is important at the later stage of steam
blowdown phenomena, when steam mass flux has reduced significantly. Although 3D, single-
phase CFD computations are commonplace, the size of the system considered in our case, as
well as the long transient behavior discouraged the application of CFD methods.
Given the importance of 3D effects in the analysis of pool behavior, we decided to use the
GOTHIC code (Generation of Thermal Hydraulic Information in Containments). GOTHIC is a
thermal hydraulic code developed by NAI for modeling transient multiphase, multidimensional,
compressible flows and heat transfer in a complex geometry. It has been extensively validated
against a wide variety of experiments including gas stratification and mixing phenomena in large
enclosures [35].
GOTHIC uses 3D Reynolds-Averaged Navier-Stokes Equations (RANS). When solving
equations, GOTHIC implements a set of correlations for the transfer of mass, energy and
momentum between the phases, and between the walls and the fluid. Because of this, there is no
need to resolve boundary layers which, compared to CFD codes, allows for the use of much
coarser mesh achieving a much better computational efficiency.
2.4.1 EHS/EMS implementation in GOTHIC code
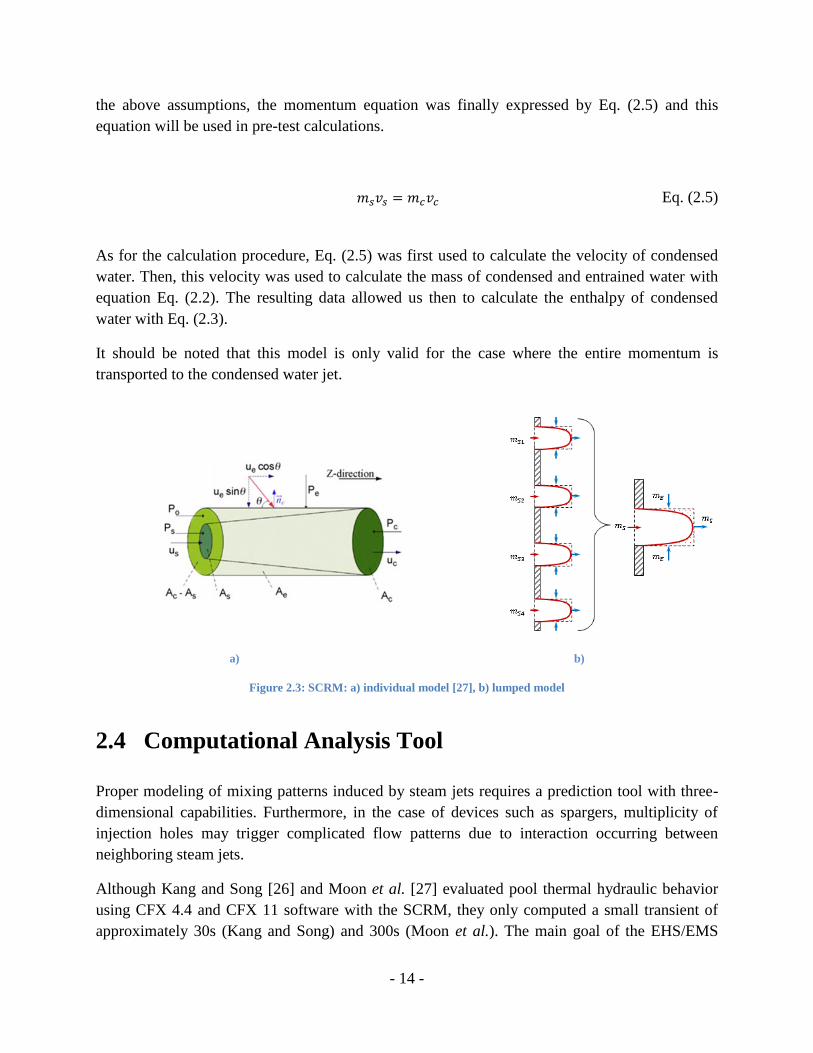
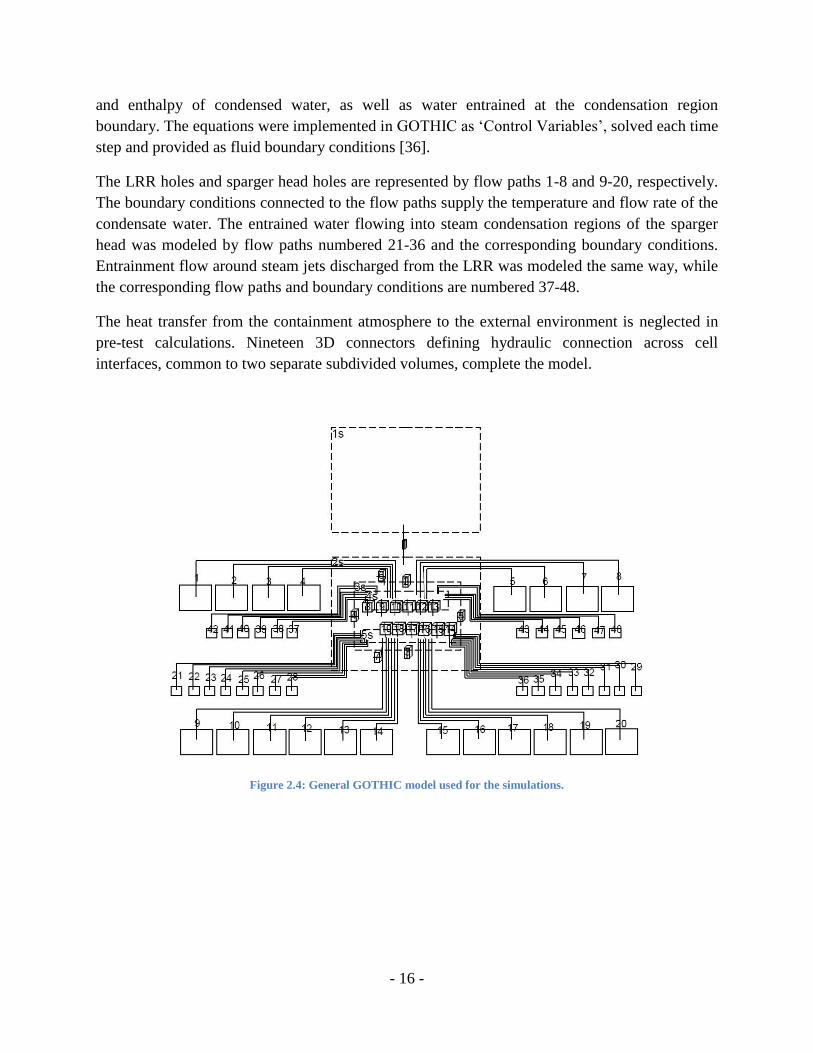
The schematic of the GOTHIC model developed in this thesis is shown in Figure 2.4. The
computational domain of the model only includes the wetwell space that is represented by two
subdivided volumes. The lower volume (2s) models the suppression pool, and the upper volume
(1s) represents the gas space. Additional three volumes (3s, 4s, 5s) are defined within the second
volume for local refinements of the mesh around the sparger, which otherwise are not possible in
the GOTHIC code [36]. The size of volumes 3s and 4s was determined so as to properly resolve
the core region of the jets discharged through the holes. The temperature in this region is about
the same as the jet discharge temperature, and it will not be predicted if too large of a cell size is
determined.
The actual geometry of the wetwell and the sparger were represented by blocking groups of cells.
In order to introduce the coupled volumes 3s, 4s, and 5s, the cells corresponding to their location
were also blocked, and slip boundary conditions were set on their surfaces.
In the SCRM presented in section 2.3.2, the length of condensation region was assumed to be
equal to 2.5 times the outlet hole diameter. Even though the jet penetration length can change
along with pool temperature and steam mass flux, it is assumed constant since earlier numerical
simulations have shown its effect on thermal mixing analysis to be negligible [26]. Conservation
laws of mass, momentum and energy (Eq. (2.2)-Eq. (2.5)) were used to determine mass flow rate
Page 30
- 16 -
and enthalpy of condensed water, as well as water entrained at the condensation region
boundary. The equations were implemented in GOTHIC as ‘Control Variables’, solved each time
step and provided as fluid boundary conditions [36].
The LRR holes and sparger head holes are represented by flow paths 1-8 and 9-20, respectively.
The boundary conditions connected to the flow paths supply the temperature and flow rate of the
condensate water. The entrained water flowing into steam condensation regions of the sparger
head was modeled by flow paths numbered 21-36 and the corresponding boundary conditions.
Entrainment flow around steam jets discharged from the LRR was modeled the same way, while
the corresponding flow paths and boundary conditions are numbered 37-48.
The heat transfer from the containment atmosphere to the external environment is neglected in
pre-test calculations. Nineteen 3D connectors defining hydraulic connection across cell
interfaces, common to two separate subdivided volumes, complete the model.
Figure 2.4: General GOTHIC model used for the simulations.
Page 31
- 17 -
3 Experimental design and test conditions
3.1 Scaling
The EHS/EMS models developed for spargers need to be validated against experimental data. It
is particularly important that the conditions of the experiment are relevant to a full scale plant
transient. In recognition of the importance of this model validation, the NORTHNET-RM3 and
NKS research projects decided to conduct experiments in the PPOOLEX test facility located at
LUT [19]. The test facility is, however, reduced-size, and in order to make sure that the
experimental data and developed numerical models maintain similarity with prototypical, or full-
scale, facilities in terms of key thermal-hydraulic phenomena, it is essential to perform
corresponding scaling analysis. Our goal is to develop a scaling approach to determine physical
dimensions of the sparger and the operating conditions so that the important features of BWR
steam blowdown and PSP behavior can be reproduced in the experiment.
3.1.1 Literature review
Many scaling techniques have been proposed over the last decades (especially in the 80’s and
90’s). On their basis, numerous experimental facilities simulating nuclear power plants have
been designed. Using different scaling techniques, however, leads to obtaining a variety of
scaling laws which are not always compatible with each other [37]. Therefore, depending on the
purpose with which a particular test facility is built (i.e. what phenomena we wish to reproduce
with the best accuracy), priorities should be set, followed by choosing relevant scaling
techniques. The most commonly used scaling techniques include, among others: linear scaling,
volume scaling, Ishii scaling and, hierarchical, two-tiered scaling (H2TS).
Linear scaling laws have been derived independently by Carbiener et al. [38] and Nahavandi et
al. [39]. In this technique, linear dimensions as well as a time scale of the prototype are reduced
with the use of a fixed scale factor. This leads to small volumes and amplifies acceleration in the
model [40] [37]. Because of this, the technique should not be used for phenomena where
gravitational acceleration is important. Nahavandi et al. [39] have also derived scaling laws for a
technique commonly referred to as volume scaling. It involves reducing both the volume and
power by a certain common scale factor, while height, velocity and time scales are maintained
with respect to the full-scale plant. Most integral test facilities for the LOCA have been designed
using volume scaling [40]. This technique, however, proves problematic as it results in obtaining
small cross-section areas and therefore entails significant flow resistance and a pressure drop
[37]. Furthermore, issues also occur with regard to excessive heat losses. Ishii et al. [41] have
come up with scaling laws which allow to overcome the drawbacks of volume scaling [42]. They
have proposed scaling laws for single and two-phase natural circulation systems. It should be
Page 32
- 18 -
emphasized that this scaling approach is the most general and makes it possible to derive scaling
laws for volume and linear scaling (see [37]). Ishii scaling allows to select a height scale, and the
authors have emphasized the advantages of using reduced-height scaling, noting that such
scaling helps reduce friction losses. Due to the differences in time scale and velocity scale with
respect to the full-scale plant, this scaling approach, however, triggers certain distortions,
especially for local phenomena [43]. More information on the above scaling techniques can be
found in [37]. A more recent technique, considered to be the scaling state-of-the-art and known
as H2TS, has been proposed by Zuber [44]. This scaling method offers consistency, reduces
arbitrariness in deriving scaling criteria, and facilitates identification of important processes and
assessment of scaling distortions. This is why it is recommended for scaling complex thermal-
hydraulic scenarios, especially when synergistic effects are important, i.e. for integral test
facilities. Main features of this scaling technique include: system decomposition, scale
identification, top-down and bottom-up scaling analysis. The system is decomposed into
hierarchical levels in order to facilitate scaling analysis, and each of these levels is characterized
by a temporal scale (transfer rate) and a spatial scale (transfer area). For each stage of the
analyzed accident, important phenomena are identified in the process of PIRT development and
being assigned particular scaling levels at which they should be considered. Top-down scaling is
conducted, proceeding downward through subsequent hierarchical levels. Top-down scaling
allows to determine the global system behavior and interactions between hierarchical levels, as
well as identify important processes to be addressed in bottom-up scaling. For each of the
hierarchical levels conservation equations are defined, and they are non-dimensionalized. Thus,
non-dimensional coefficients are obtained and expressed in terms of characteristic time ratios
governing similitude between the full-scale and test facility. These non-dimensional coefficients
further allow to determine which processes govern the system behavior. Bottom-up scaling, on
the other hand, is conducted in order to examine specific processes which are important for the
system behavior. Based on closure relations for these processes (e.g. flow pattern transitions,
critical heat flux), scaling criteria are derived, allowing to maintain similarity to the full-scale
plant [45]. In bottom-up scaling, more traditional, non-dimensional groups - such as the
Reynolds number or the Prandtl number - are derived. Scaling criteria derived in bottom-up
scaling help optimize the design of test facility. A more comprehensive description of H2TS can
be found in [44] and [46].
Scaling analyses specific to the steam relief into a large water pool were conducted by Peterson
[21], Sonin et al. [47] and Li et al. [48]. Peterson [21] analyzed mixing processes triggered by
injected buoyant jets, plumes and wall jets in large volumes of water. The analysis was
performed under stratified conditions where it was assumed that temperature distribution is one-
dimensional. For his analysis, Peterson used the H2TS method to derive non-dimensional
parameters that allowed him to predict the onset and breakdown of thermal stratification. These
non-dimensional parameters were expressed in terms of: ratio of height of the stratified water
layer (or jet submergence depth) and jet diameter at the injection hole, as well as the Richardson
number. Sonin [47] analyzed steam discharge and condensation at a steady mass flow rate
Page 33
- 19 -
through the SRV system. He identified physical quantities relevant to the examined problem,
and, based on dimensional analysis, he derived similarity parameters allowing for proper
modeling of this process in reduced-scale studies. He noted that, when using a system that is
geometrically similar to the prototype, i.e., the same thermodynamic conditions and the same
steam mass flux, most of the similarity parameters (8 out of 12) can be preserved. Furthermore,
he reached the conclusion that the derived scaling laws may also be used to analyze the initial air
clearing transient. Sonin also conducted an experiment confirming the validity of the derived
scaling laws [49]. Li et al. [48] examined a similar problem, i.e., steam injection into the water
tank through the ADS system of an AP1000 reactor. Their examination was based on non-
dimensionalizing the governing mass, momentum and energy equations for important stages of
the steam discharge process, with the inclusion of some simplifying assumptions. Although
another approach was used with regard to the analysis conducted by Sonin, the authors still
arrived at the same conclusions. This may point to the validity of the derived scaling laws in both
analyses and prove how important these particular parameters are for analyzing steam injection
into the pool.
3.1.2 Goal of the scaling
Total similitude in a scaled-down test facility is not possible to achieve. Because of this, proper
scaling methodology must select those phenomena that we wish to reproduce with highest
accuracy. For the phenomena of less interest, it will be necessary to determine the resulting
scaling distortions. In our case, scaling distortions are additionally generated due to the fact that
the experiment is going to be conducted in an existing test facility with its own constraints and
physical limitations, such as steam production capacity, size restrictions etc.
For experimental activities in the PPOOLEX test facility the general objective was to examine,
in separate effect tests, thermal stratification and mixing in the pool under different steam
injection conditions relevant to prototypical BWR blowdown transient. To meet the experiment
objectives, a sparger was designed and constructed in order to preserve condensation regimes
and steam injection conditions as those quantities have been assumed to be important to the PSP
behavior. It is worth noting that the conducted scaling analysis does not focus on designing a
sparger that could be used in experiments from which results could be directly extrapolated to
full-scale plant. This was not possible to achieve due to the constraints of the PPOOLEX facility.
The scaling approach developed in this work only aims to scale down prototypical plant
conditions and parameters which will allow us to reproduce important phenomena (i.e. thermal
stratification and mixing) during the tests in the PPOOLEX test facility. Separate effect
experiments performed in this manner will make it possible to develop and asses closure models
for different condensation regimes, as well as validate our modeling approach under conditions
applicable to full-scale analysis of plant transient. Having a validated numerical model for each
condensation regime, we will then be able to implement it in the analysis of full scale plant
behavior.
Page 34
- 20 -
3.1.3 Reference NPP and transient to be scaled
The PPOOLEX test facility was initially modeled after the Olkiluoto 1 reactor but the design of
the sparger and the test condition parameters were based on typical Nordic BWR values.
A station blackout (SBO) scenario, followed by automatic depressurization system (ADS)
actuation, was chosen as the base scenario to be scaled in the PPOOLEX facility. This scenario is
similar to a SRV leakage. As for station blackout transient, it was assumed that loss of off-site
and on-site power occur simultaneously and the latter is due to the failure of emergency diesel
generators. A similar scenario took place in Fukushima accident, where total loss of AC power
caused by a tsunami that flooded diesel generators occurred shortly after losing off-site power.
Upon loss of off-site power, the reactor scrams and the main steam isolation valves (MSIV) are
shut to isolate the reactor coolant pressure boundary. However, heat is still generated from decay
heat of the fuel located in the reactor core. During the postulated SBO event, decay heat can be
removed only through passive safety systems, such as SRVs, that discharge steam generated in
the vessel to PSP. For the purposes of this scaling analysis, the steam injection conditions during
the postulated SBO event were estimated by means of simulation conducted in the GOTHIC
code and were summarized in Table 3.1 [36]. As for the core power, a decay heat curve for a
Nordic BWR reactor of similar power was used in the calculations and shown in Figure 3.1.(a).
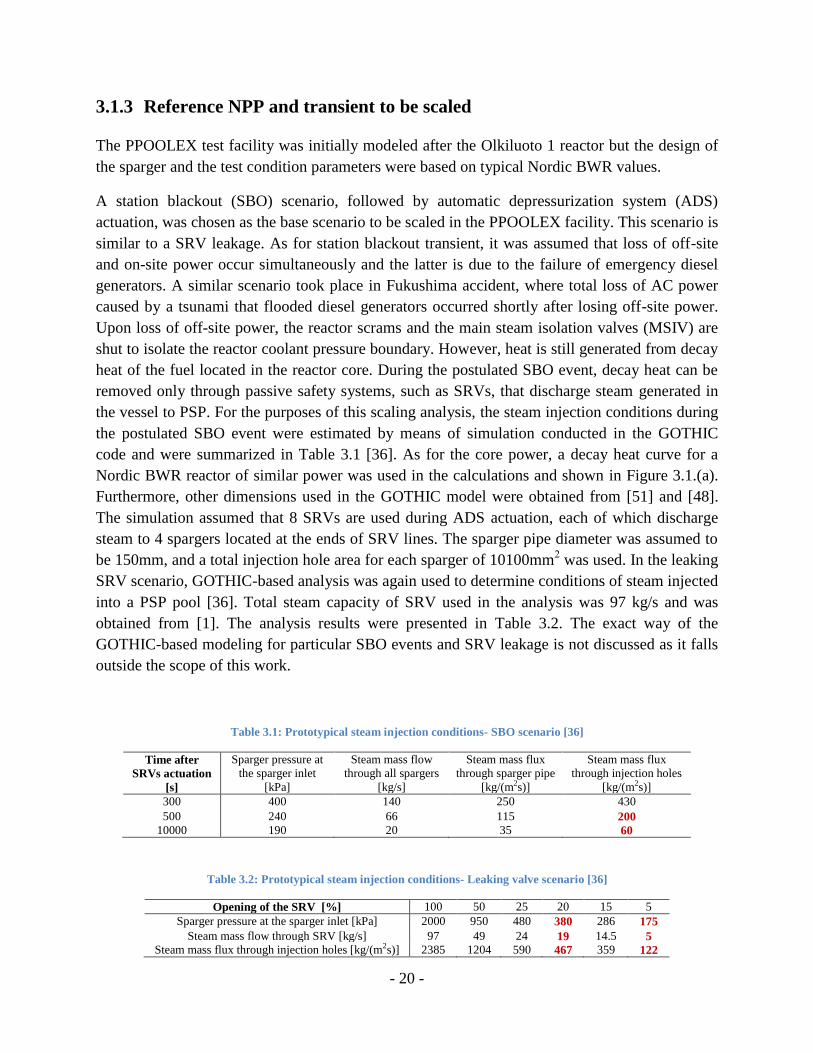
Furthermore, other dimensions used in the GOTHIC model were obtained from [51] and [48].
The simulation assumed that 8 SRVs are used during ADS actuation, each of which discharge
steam to 4 spargers located at the ends of SRV lines. The sparger pipe diameter was assumed to
be 150mm, and a total injection hole area for each sparger of 10100mm2 was used. In the leaking
SRV scenario, GOTHIC-based analysis was again used to determine conditions of steam injected
into a PSP pool [36]. Total steam capacity of SRV used in the analysis was 97 kg/s and was
obtained from [1]. The analysis results were presented in Table 3.2. The exact way of the
GOTHIC-based modeling for particular SBO events and SRV leakage is not discussed as it falls
outside the scope of this work.
Table 3.1: Prototypical steam injection conditions- SBO scenario [36]
Time after
SRVs actuation
[s]
Sparger pressure at
the sparger inlet
[kPa]
Steam mass flow
through all spargers
[kg/s]
Steam mass flux
through sparger pipe
[kg/(m2s)]
Steam mass flux
through injection holes
[kg/(m2s)]
300 400 140 250 430
500 240 66 115 200
10000 190 20 35 60
Table 3.2: Prototypical steam injection conditions- Leaking valve scenario [36]
Opening of the SRV [%] 100 50 25 20 15 5
Sparger pressure at the sparger inlet [kPa] 2000 950 480 380 286 175
Steam mass flow through SRV [kg/s] 97 49 24 19 14.5 5
Steam mass flux through injection holes [kg/(m2s)] 2385 1204 590 467 359 122
Page 35
- 21 -
a) b)
Figure 3.1: a) Decay heat curve used in the SBO transient simulation; b) Ranges of steam injection conditions to be
covered in PPOOLEX tests
From the results, we can arrive at the conclusion that the analyzed SBO scenario is dominated by
steam blowdown occurring at low steam mass fluxes. More importantly, the development of
thermal stratification is more likely to appear under these conditions. Hence, a scaling analysis
was conducted so that the steam blowdown conditions occurring within the time range of 500-
10000s after ADS actuation, and also accounting for 0-20% of total opening area in SRV leakage
scenario, could be reproduced. This choice is further justified by the limited steam generation
capacity where higher steam mass fluxes impose certain constraints on the sparger design. As
mentioned earlier, in the PPOOLEX experiments, we want to maintain similarity in steam mass
flux with respect to full-scale plant. However, there is a limited capacity of the PACTEL steam
generator used in PPOOLEX facility which is about 1 MW with a maximum steam flow of
~0.43 kg/s.
Figure 3.2: Schematic of the PPOOLEX test facility [50]
Page 36
- 22 -
3.1.4 Scaling methodology
Based on the scaling methods analyzed earlier, a scaling methodology has been developed and
used to design experiments in the PPOOLEX facility. In this scaling methodology, the system is
decomposed into three different levels: macro, meso and micro [36]. Then, on each of the levels,
important processes are identified, degree of their importance is assessed, and decision on
similarity criteria is taken. Scaling begins at the macro-scale level where global parameters are
determined, followed by transition to lower levels (i.e. meso and micro) where the goal is to
provide similitude among individual processes found to be important for the analyzed problem
(i.e. thermal stratification and mixing). Scaling methodology developed in this work can be
summarized as follows:
(i) Macro scale (pool): At this level, the goal is to be able to reproduce the thermal regimes
of stratification and mixing which would appear in the full-scale pool during the
considered transient. In order to do so, the spatial scale ratios of the pool are maintained
in a similar range as the ones in a prototypical BWR [36]. At the macro-scale level, it is
also important to maintain characteristic time scales of the ratio of momentum and energy
changes that occur within the pool [36]. The importance of this quantity lies in the fact
that it is the interplay between momentum and buoyancy which determines the behavior
of condensing steam jets and whether or not the pool remains thermally stratified or
mixed. Given a size of the pool, these time scales are determined by the total steam mass
flow injected into the pool and the total injection hole area. Thus, in order to achieve the
scaling goal for this level, the following parameters will be determined: water level,
sparger submergence depth, steam injection conditions and total exit hole area.
(ii) Meso scale (sparger): At this level, the goal is to control the condensation process in the
steam line. This makes it possible to obtain similar spatial distribution of the heat source,
and allows us to provide adequate momentum to the pool. To do so, similarity criteria at
this level will be used to determine the diameter of the sparger pipe.
(iii) Micro scale (jet structure): At this level, the goal is to cover the ranges of micro scale
phenomena appearing in the steam jets without scaling the dimensions of sparger
injection hole, so that we preserve steam mass fluxes (and respective condensation
regime), and ratios of buoyant, inertial and viscous forces. At this level, the diameter for
a single injection hole as well as a pitch-to-diameter ratio will be determined.
3.1.5 Rationale for scaling choices
Due to the fact that the scaling analysis must be performed in mind with constraints imposed by
the PPOOLEX test facility, it was not always possible to preserve all the scaling criteria
presented in section 3.1.4. The following part of the paper puts forwards a rationale for the
proposed test conditions and scaling choices implemented in the sparger design. At each of the
Page 37
- 23 -
scaling levels, a description is offered with regard to how the parameters were determined, what
were the limitations, as well as what are the scaling distortions, if any. It can be summed up as
follows:
(i) Macro scale (pool): When determining water level, we wanted to maintain similar spatial
scale ratios as in a volume of water surrounding a single sparger in a BWR. The spatial scales
ratio was defined by Eq. (3.1). Unfortunately, spatial scale distortion was unavoidable
because of the fixed dimension of the PPOOLEX tank, making its pool broader than in
prototypical BWRs. The water level was set to 3m. This water level was chosen so that the
distortion in spatial scale of the pool was considered small while it is possible to examine
long steam blowdown transients and maintain reasonable sparger dimensions. As for the
sparger submergence depth, it was determined taking into account the spatial scales of the
pool in terms of volume of water between the upper and lower part of the sparger end. Data
on prototypical BWR values were obtained from [51]. It was decided that sparger
submergence depth should be 2 m which is about 60% of pool depth and represent a similar
percentage to BWRs. The position of a load reduction ring (LRR) was determined using the
same method. In this case, however, scaling distortions are bound to occur as the distance
between the LRR and the sparger head will be shorter, resulting in a stronger interaction
between jets discharged through different sections of the sparger (i.e. sparger head and LRR).
Such positioning of the LRR, however, will cause the parameters of steam discharged
through the LRR to be similar to prototypical values. It was decided that the LRR should be
positioned 0.7 m from the sparger end; for prototypical BWR spargers, this value is within
the range of 1.8-2 m. Other parameters to be determined were total injection hole area and
total steam mass flow rate. Here we decided to maintain the ratio between the energy and
momentum time scales and condensation regimes. The energy time scale was calculated
using Eq. (3.2) while the momentum time scale was determined using Eq. (3.3). To
determine injection hole area and total steam mass flow rate, we had to account for the
limited capacity of steam generators used in the PPOOLEX facility, which is about 1 MW
(maximum of ~0.43 kg/s steam flow). Steam injection conditions were chosen to fully utilize
the production capability of steam as it allows to maximize total steam injection hole area
while maintaining a similar ratio of the energy and momentum time scale. This ratio was
calculated for the analyzed range of the SBO scenario and was presented in Table 3.3.
Eq. (3.1)
Eq. (3.2)
Eq. (3.3)
Page 38
- 24 -
(ii) Meso scale (sparger): The sparger diameter was determined with the condition that
condensation rate inside the sparger pipe is similar to prototypical values. This will allow to
maintain similar values of heat distribution along the sparger pipe and similar steam quality
and temperature at the injection holes. In the analytical approach, the condensation rate was
obtained from the heat exchanged through the sparger walls, and latent heat, as shown in Eq.
(3.4). Meanwhile, the heat transferred through sparger walls was calculated based on a heat
transfer formula for cylinder, as shown in Eq. (3.5). The calculations assumed certain
simplifications, such as the same boundary layer thickness or the same temperatures of inner
and outer walls. The resulting value of the sparger diameter was 66mm. To verify the validity
of analytical approach, GOTHIC simulations of steam injection into a lumped wetwell
through a blowdown pipe were run. Two GOTHIC simulations were performed, (i) steam
blowdown in a prototypical BWR, and (ii) PPOOLEX conditions using the diameter of the
sparger obtained with Eq. (3.5). The data used for BWR calculations were obtained from [1]
and [51]. For the prototypical BWR geometry, only the space occupied by a single sparger
was modeled. The steam mass flow rates for BWR and PPOOLEX were 1.82 kg/s and 0.3
kg/s, respectively. The initial parameters, as well as steam enthalpy were the same in both
cases. Furthermore, the GOTHIC model used in the simulations had a lumped wetwell and
sub-divided volume for the pipe. The heat transfer through the sparger walls was modeled
using built-in heat transfer models in GOTHIC. For both cases, the parameters used in the
modeling have been contained in Table 3.4. The results obtained showed similar
condensation rates, thus confirming the validity of the proposed diameter.
Eq. (3.4)
Eq. (3.5)
(iii) Micro scale (jets structure): The pitch-to-diameter (P/D) ratio and injection hole diameter
were determined so that they would cover the ranges of micro scale phenomena similar to
prototypical BWRs. At this level, our limitations were the total injection hole area and
sparger pipe diameter determined at the macro and meso-level scaling, respectively. The
injection hole diameter is set to 8mm. The injection hole diameter is similar to prototypical
values and expected to result in a similar range of ratios of buoyant, inertial and viscous
forces. We also need to take into account the interactions occurring between neighboring
steam jets. Previous experimental investigations conducted for spargers with different P/D
ratio demonstrated that this quantity has a significant influence in jet interaction [52]. As P/D
ratio decreases, the steam jets tend to become more interactive, and the neighboring steam
jets are combined to build extremely unstable bubbles around the sparger. As a result of this
interaction, the discharging velocity of the steam, which acts as a driving force of thermal
mixing, decreases rapidly [52]. Using 8 mm as the injection hole diameter, the horizontal P/D
Page 39
- 25 -
ratio for sparger head holes is set at 3.6, similar to typical BWR spargers. The vertical P/D
ratio was set at 4.5, also similar to typical BWR spargers. Such hole arrangements will
provide us with 8 holes per row and a total of 4 rows of holes for the sparger head. A sparger
configured in this manner should allow us to achieve similar microscopic jet behavior and a
similar degree of interactions occurring between steam jets. At the same time, suggested
number of rows of holes for the sparger head will let us better understand interactions
between the jets. As for the P/D ratio for a LRR, scaling distortions will occur due to the
chosen sparger diameter. The diameter for the LRR has been matched as to be able to contain
the LRR holes, at 110 mm, similar to typical BWR spargers. Since 8 mm was used as the
diameter of the LRR injection holes, a total of 8 injection holes can be fitted with a P/D ratio
of 3.8. In typical BWRs, the corresponding P/D ratio is 2.44. Hence we should expect less
interaction between steam jets discharged from the LRR.
Table 3.3: Temporal scales: BWR vs PPOOLEX
BWR PPOOLEX
Time after
SRVs actuation
[s]
Energy
time scale
[1/s]
Momentum
time scale
[1/s]
Energy/Momentum
time scale
Energy
time scale
[1/s]
Momentum
time scale
[1/s]
Energy/Momentum
time scale
500 7.1e-4 3.5e-3 0.20 9.5e-4 4.5e-3 0.21
10000 2.0e-4 3.4e-4 0.59 2.8e-4 4.1e-4 0.68
Table 3.4: Input parameters for GOTHIC simulations for estimation of condensation rate
Wetwell BWR PPOOLEX Sparger BWR PPOOLEX
iameter [m] 3.33 2.4 [mm] 132 66
Height [m] 13.57 4.27 Pipe thickness [mm] 4 4
Water Level [m] 9.5 3 Submergence depth [m] 6.4 2
Page 40
- 26 -
Figure 3.3: Results of the scaling analysis: proposed sparger [50].
Page 41
- 27 -
3.2 Pre-test Calculations
3.2.1 Goal of the pre-test
An important part of this study was to provide analytical support for the LUT University with
respect to future experiments involving steam blowdown through spargers. For this purpose, pre-
test calculations were performed with the use of the EHS/EMS model presented in Chapter 2.
The goal of these pre-test calculations is to confirm that the scaled sparger design, presented in
Figure 3.3, is able to reproduce both thermal stratification and mixing in the PPOOLEX facility.
Based on the pre-test analysis, operational regimes and test procedures for future experiments
were proposed. Also, based on the obtained temperature and velocity profiles in the tank,
suitable placement of the thermocouples to get better data was proposed.
3.2.2 Separate-effect tests
Geometrical complexity of a sparger and complicated flow patterns induced after steam injection
make the analysis of thermal behavior in the pool difficult to perform. In order to facilitate the
validation process of the proposed models, separate effect tests were conducted. For this purpose,
the steam is discharged only through the sparger head holes while holes in the LRR are blocked.
In this way, we avoided uncertainty in the redistribution of steam mass between the LRR and
sparger head holes which are difficult to measure during the experiment. It will also prevent
interaction between jets discharged from the two different parts of the sparger (i.e. LRR and
sparger head). This approach proves efficient and makes the model validation process much
easier as it reduces uncertainties in estimating the effective momentum provided to the pool.
From this point on, both the experiments performed in the PPOOLEX facility as well as the
results of our numerical analysis will relate solely to the case where steam is injected only
through sparger head holes.
3.2.3 Model for pre-test calculations
The GOTHIC 8.0 (QA) code will be used in calculations. Implementation of the EHS/EMS
models into GOTHIC was discussed in the previous section of the study. This section, discusses
the specific characteristics of the model, such as computational grid or numerical schemes, used
in pre-test calculations.
The grid model with a denser cell distribution around the sparger pipe was introduced to resolve
the high velocity and temperature gradients occurring near condensation regions. The cell size in
the LRR and sparger head region was determined so that the cell area downstream from the
condensation region is similar to the actual jet area at that location (according to the guidelines
found in the GOTHIC user manual). In the pool region far from the sparger, the mesh size was
Page 42
- 28 -
increased in the x/y directions since high velocity gradients were not expected there. The
resulting mesh was rather coarse (13464 cells), compared to typical meshes used for CFD
simulations.
The grid model is based on orthogonal coordinates, the only possible option using the GOTHIC
code. Due to the sparger pipe’s location (417 mm away from the center of the tank), the flow
pattern is expected to vary in the circumferential direction. Hence the grid model is made
asymmetrical with radially increasing size of the cells. Figure 3.4 shows the 3D nodalization of
the wetwell.
The main features of the mesh are summarized in Table 3.5. Each mesh consists of axial levels
(vertical subdivisions) provided with a square test matrix (cross-sectional subdivisions, e.g. 4x4).
The total number of cells, irrespective of whether they are blocked or not, is listed in the table.
Table 3.5: Details on the computational grid used for pre-test calculations.
Cells Test Axial Typical mesh size
(in total) Matrix Levels △x,y △z
Volume 1s 48 16 (4x4) 3 0.6 0.15
Volume 2s 6656 256 (16x16) 26 0.1 0.1
Volume 3s 4225 169 (13x13) 25 0.05 0.05
Volume 4s 1183 169 (13x13) 7 0.02 0.02
Volume 5s 1352 69 (13x13) 8 0.02 0.02
Figure 3.4: Nodalisation used for the 3-D representation of the wetwell.
Page 43
- 29 -
Figure 3.5: Nodalisation of the coupled volumes 3s, 4s, and 5s.
Page 44
- 30 -
Figure 3.6: GOTHIC modeling of entrainment in the LRR region.
Figure 3.7: GOTHIC modeling of entrainment in the sparger head region.
Page 45
- 31 -
The turbulence model adopted for the simulations was a standard two-equation k-ε model. The
conservation equations are solved using a semi-implicit numerical method. The second-order
upwind difference scheme was implemented for the spatial discretization of the advection term
in transport equations. Due to the relatively large number of cells used in the model, the
conjugate gradient iterative technique was used to solve the system pressure matrix. The adaptive
time step was between 1e-7 -0.05 s. The convergence criteria requires the residual pressure error
to fall below the value of 1e-7.
3.2.4 Initial and boundary conditions for pre-test
A total of 7 simulations were performed. The simulations differed solely in terms of the imposed
steam mass flow rate through spargers. Each simulation began with a small steam injection rate
of 60 g/s which lasted 3000s and aimed to develop thermal stratification. Then, the steam mass
flow rate was rapidly increased to 90, 120, and up to 270 g/s, depending on the simulation. Thus
the transition point and steam injection conditions responsible for overall mixing of the pool
were determined. The simulations are summarized in more detail in Table 3.6.
Table 3.6: Initial and Boundary Conditions for pre-test simulations.
Initial Conditions
Initial water level in the pool [m]
Initial pool water temperature [oC]
Inlet gas pressure in the wetwell [kPa]
Transient Conditions
Steam mass flow rate [g/s]
Pool water temperature [oC]
Steam pressure at the outlet [kPa]
Duration [s]
Initial Conditions
3
20
101.35
Transient Conditions
60, 90, ..., 240, 270
20-80
230
4000-6000
3.2.5 Analysis of pre-test results
The results of only three specific simulations: 60-90g/s (thermal stratification), 60-180g/s
(transition to mixing) and 60-270 g/s (mixing) are shown. Figure 3.8(a)-(c) summarizes the
results obtained for these three simulations in terms of temperature profile over a transient time
in certain locations. The radial positions, from which the data are obtained, are shown in Figure
3.8(d). Furthermore, Figure 3.9 shows 2D streamlines and temperature field for each of the
simulations at t=3500s, performed using the ParaView software.
Page 46
- 32 -
a) b)
c) d)
Figure 3.8: Vertical temperature distribution along L1-L4 trains for (a) 60-90g/s, (b) 60-180g/s, and (c) 60-270g/s; d)
Radial and axial positions for L1-L4 trains.
L1, L4 [m]---L2, L3 [m]
Page 47
- 33 -
a) b)
c)
Figure 3.9: Temperature field and 2D streamlines at t=3500s for a) 60-90g/s, b) 60-180g/s, and c) 60-270g/s.
The results showed that it is possible to obtain transition to mixing within the current steam
injection capacity of the PPOOLEX facility with the proposed sparger design. On the basis of the
temperature profiles, we can also conclude that the region near L3, L2 trains is subject to most
rapid mixing, while the area close to the center of the pool, represented by L1, L4 trains, tends to
mix most slowly. We can also conclude that L1, L4 trains seem to be redundant. Regarding the
general flow pattern in the tank, it is asymmetrical due to the position of the sparger (i.e. 417 mm
from the center of the pool). As expected, with a small steam mass flow rate, the flow pattern is
dominated by buoyancy force and the discharged water flows mostly upwards, as shown in
Figure 3.9(a). As a result, thermal stratification develops, where the upper of the tank is
practically under the same temperature. In the second case, shown in Figure 3.8(b), higher inertia
of the discharged water corresponds to higher momentum which translates into a downward
water movement being more pronounced. The discharged water hits the tank’s wall and then is
redirected sideways. In this case, however, buoyancy starts to dominate at some point and the
water turns upwards. A further increase in steam mass flow rate triggers more fraction of the
Page 48
- 34 -
downward momentum which results in better mixing of the pool, as shown in Figure 3.9(c).
Mixing time increases along with the increase of steam mass flow rate. Based on the conducted
pre-test calculations the mixing time is predicted between 450s-1050s.
3.3 Instrumentation Setup
A total of 42 thermocouples with frequency of 2-20 Hz were proposed to measure temperatures
near the vicinity of the sparger head. Placement of thermocouples was shown in Figure 3.10(a).
Thanks to the information collected by the thermocouples, we will be able to compare recorded
near-field temperatures with the EHS/EMS predictions. This will also provide us certain
information on the validity of some of the assumptions we have used in the process of model
development, such as steam jet condensation length. Temperature measurement near the vicinity
of the sparger head is important as it is one of the basis in determining the condensation regime.
These measurements are also source of information regarding interactions between neighboring
steam jets. This information may also come in handy as the experiments do not measure velocity
field in the pool. Although the PIV-based measurement was proposed, it does not guarantee
obtaining high-quality images due to two-phase flow and not fully adequate position of a
viewing window in the PPOOLEX facility.
Moreover, it was proposed to distribute 68 thermocouples of frequency 2Hz along 4 vertical
trains (L1-L4) with the aim of measuring the global thermal behavior in the pool. Even though
the pre-test calculations showed temperature profiles along L1 and L4 trains to be practically
identical, performing measurements along both trains was opted for as it would allow for more
precise validation of the temperatures predicted by GOTHIC calculations. 2 trains (L2, L3) were
spaced at 100mm from the pool’s walls which will provide further information on jet
impingement on the wall. The thermocouples were placed with lower vertical separation at the
level of steam discharge and the bottom of the pool as this is where high temperature gradient
may occur according to the pre-test calculations. Placement of the thermocouples for global pool
temperature measurements was shown in Figure 3.10(b). The exact positions of these
thermocouples correspond to those used to present the results of pre-test simulations and are
considered adequate to capture temperature profile in the pool.
Additionally, it was also proposed to place 9 thermocouples inside the sparger pipe which would
monitor steam injection conditions as well as the steam-water interface position (see Figure
3.10.(b)). These thermocouples will also make it possible to determine frequency and amplitude
of water oscillation, and thus further develop the EHS/EMS model. This, however, remains
outside the scope of this study.
Page 49
- 35 -
Figure 3.10: a) Near field TC grid; b) TC inside sparger pipe [50].
Figure 3.11: Proposed distribution of thermocouples along vertical trains L1-L4 [50].
Page 50
- 36 -
3.4 Test-Matrix
So far, the test procedures for 5 experiments, SPA-T2 - SPA-T6, have been proposed. The tests
are conducted mainly to examine oscillatory condensation regime.
In the first test (SPA-T3) which was intended to examine the overall behavior of the PPOOLEX
test facility with the proposed sparger, it was observed that pool mixing occurred at 150 g/s,
slightly lower steam mass flow rate than the 180g/s predicted in the pre-test simulations. This
steam mass flow which induced transition to mixing was taken into account in the design of the
remaining experiments shown in Figure 3.12. It was also not possible to maintain system
pressure at 230 kPa in the proposed experiments, as was in the performed pre-test calculations
since the steam is discharged directly to the wetwell, and the air accumulated in the drywell will
not contribute to the increase in pressure.
Figure 3.12: The proposed test matrix for PPOOLEX.
Due to the limited number of tests that we could carry out, a test-matrix has been designed to
maximize the amount of information we are able to obtain during each test. Each test ends when
the pool temperature is close to saturation conditions. The tests have been designed in
accordance with a general rule:
(i) Stratification phase - Mixing phase
(ii) Re-stratification phase - Mixing phase
Due to the fact that the tests are intended to validate the EHS/EMS models, it was important to
conduct them under different conditions, i.e. varying pool temperature and steam mass flux,
since these values determine the effective momentum provided from condensation. In order to
develop thermal stratification, steam is injected at a small steam mass flow rate. In order to mix
Oscillatory
cone jet
Ellipsoidal
jet
Oscillatory
bubble
External
chugging
Internal
chugging
External
chugging
Oscillatory
bubble
Oscillatory
ellipsoidal
bubble
Page 51
- 37 -
the pool, this rate is rapidly increased. To achieve different degrees of thermal stratification and
different mixing times, the duration of individual phases was varied.
Page 52
- 38 -
4 Validation of EHS/EMS models for spargers
4.1 PPOOLEX SPA-T3 experiment
Preliminary validation of EHS/EMS models for spargers presented in Chapter 2 was done
against the POOLEX SPA-T3 experiment. The total duration of this test was approximately
12000s. The main objective of the test was to provide information on the development of thermal
stratification and the time required to break down thermally stratified layers.
In the experiment, the drywell was bypassed and steam was directed towards a wetwell directly
through the steam discharge line and the sparger presented in the previous section (see Chapter
3). To avoid overpressurization of the PPOOLEX vessel, the wetwell gas space was connected to
the drywell through 3 rubber valves. The sparger was placed inside the pool in an asymmetric
location, i.e. 417 mm away from the vessel center. During the experiment, the wetwell was filled
with isothermal water up to 2.9 m, resulting in a sparger submergence depth of up to 1.7m.
In the SPA-T3 experiment, a saturated steam at about 150 kPa was injected into the pool. The
measured values of steam mass flow rates are presented in Figure 4.1(a). The chugging regime,
where water is sucked into the sparger and a steam-water interface oscillates up and down, was
avoided in the experiment. This phenomenon may introduce a significant momentum to the pool,
making the model validation process more difficult to perform. For this reason, the readings of
TC located inside the sparger pipe were monitored to make sure the water did not get inside the
sparger. Based on these readings, and according to the proposed test procedures, as shown in
Figure 4.1(b) and (c), the steam mass flow rate was regulated using a manual throttle.
Interestingly, the condensation regime map by Chan and Lee [31] predicted that the chugging
regime would appear during the second stratification phase of the experiment, but as shown in
Figure 4.1(b), chugging type oscillations were not observed at this flow rate.
The experiment comprised of five phases listed in Figure 4.1(a). It commenced with a clearing
phase lasting approximately 200s, where a high steam mass flow was injected to heat up the
supply line and to push out the water and air inside the sparger. After the clearing phase, thermal
stratification and mixing phases were alternated by injecting low and high steam mass flows
respectively. During the stratification phase, the steam mass flow was maintained until the
desired temperature difference between the top and bottom of the pool water was reached.
During the mixing phases, the steam mass flow was maintained until complete mixing of the
pool was observed.
The instrumentation used during the SPA-T3 experiment comprised of 62 thermocouples
distributed along 4 vertical trains (L1-L4), 32 thermocouples located in the sparger’s vicinity, 9
thermocouples located inside the sparger, a vortex flow meter in the steam line, 3 pressure
Page 53
- 39 -
transducers in the steam supply line, inlet plenum and wetwell gas space (see also section 3.3).
The laboratory atmosphere was additionally monitored by several thermocouples. Moreover, one
thermocouple was located in the drywell. Unfortunately, PIV could not be used to measure the
velocity field in the pool. Heat losses to the outside atmosphere were also not measured.
a) b)
c)
Figure 4.1: Steam injection conditions in the PPOOLEX SPA-T3 experiment: a) steam mass flow rate, b) steam
temperatures recorded inside sparger pipe, and c) path of T3 experiment in the condensation regime map of Chan and
Lee [31].
The EHS/EMS models for sparger were validated against the first thermal stratification and
mixing phases of the SPA-T3 experiment with 5000 s of transient. The steam condensation
regimes during this transient were the oscillatory bubble and an oscillatory cone jet. The choice
of the SPA-T3 experiment - and particularly its first 5000s – for validation is justified by the fact
that the mixing phase is expected to occur in the oscillatory cone jet regime. In this regime,
Page 54
- 40 -
oscillations of steam-water interface occur with low amplitude and high frequency. The behavior
of steam jets during this regime should be similar to stable condensation for which the applied
model is expected to be valid according to [3] [26] [27]. A stable condensation regime occurs
above 300 kg/m2s and has been depicted in the condensation regime map presented in [3].
Starting the validation process with oscillatory cone jet regime will allow us to better determine
the value of effective momentum provided to the pool as a result of condensation.
Figure 4.2: Video frame from SPA-T3 experiment: a) oscillatory bubble (4900-4925 s), b) oscillatory cone jet (500-525 s)
Courtesy of M. Puustinen (LUT, Finland)
4.2 Model for post-test validation
4.2.1 Model Improvements
At the initial stage of post-test validation, the same model as in pre-test was used, only with
slight modifications accounting for SPA-T3 test conditions. General features of the GOTHIC
model are contained in Chapter 2, and in Chapter 3, Section 3.2.3. It was observed that this
model could not predict the vertical temperature profiles obtained in the SPA-T3 experiment, i.e.
we predicted complete mixing of the pool while the experiment showed a long thermal
stratification development. These results are not included in this work. Instead, we have
presented in this section the changes introduced in the model. In the next section, the results
obtained with the improved model will be presented.
Complete pool mixing predicted in the simulation was due to an excessive momentum which
even during the thermal stratification phase induced a strong circulation in the pool, resulting in a
uniform temperature. Thermal stratification is very sensitive to the value of effective momentum
provided from condensation and, in order to obtain good agreement in the vertical temperature
distribution and time scale of mixing, it needs to be determined accurately. Our EHS/EMS model
used for the pre-test analysis uses Eq. (2.5) to calculate the effective momentum. However,
during the experiment, it was noted that the two-phase jet expansion is significant and should be
taken into account in the momentum equation. Therefore, the equation was redefined with an
Page 55
- 41 -
area of condensed water ( ) different from the area of the injection holes ( ). The pressure
difference along an z-axis, i.e. pressure of steam at the injection holes ( ) and pressure at the
outlet of the condensation region ( ), was also taken into consideration [36]. It was further
assumed that the surface where the two-phase jet expands ( ) is at pressure equal to the
hydrostatic pressure in the pool at the injection holes level. It was also assumed that is equal
to . Based on these assumptions, the momentum equation (Eq. (4.1)) applied to the steam
condensation region is further simplified to Eq. (4.2).
Eq. (4.1)
Eq. (4.2)
It was observed in the validation process that the condensate momentum predicted by Eq.
(4.2) was over-estimated: During the first stratification phase of the SPA-T3 experiment,
complete mixing of the pool was obtained in the GOTHIC simulations whereas the experiment
showed thermal stratification. Since Eq. (4.2) has been observed to provide satisfactory results in
[26] [27] when applied to stable jet condensation appearing at high steam mass fluxes, this over-
estimation of the momentum can be attributed to the unsteady behavior of the steam/water
interface in the oscillatory bubble regime induced in the SPA-T3 experiment at lower steam mass
flux. In the oscillatory bubble regime, bubbles are detached from the steam jet with a frequency
of 20-40 Hz. It is assumed that the pressure changes, interfacial forces, sudden collapse of the
detached bubbles, interactions between neighboring jets, entrainment, etc., can be possible
reasons for this reduction of the momentum. The exact reasons are not clear yet and investigation
is ongoing. Assumptions applied in the process of derivation of Eq. (4.2) have to be re-assessed.
In order to account for the observed effect within current model presented by Eq. (4.2), an
additional closure term ( ) was included, resulting in a momentum equation expressed by Eq.
(4.3). The resulting effective momentum is expressed by Eq. (4.4).
Eq. (4.3)
Eq. (4.4)
The term depends on the condensation regime. In stable jet condensation regime appears
to be close to zero according to [26]. It should be noted that research on the impact of unstable
condensation on effective momentum is still underway, and a more detailed description of the
examined phenomena will be contained in [36].
For the condensation regimes appearing in the SPA-T3 experiment, different values of were
used until the effective momentum computed by Eq. (4.4) resulted in a similar temperature
profile in GOTHIC as the one measured in the experiment. The values which lead to a good
Page 56
- 42 -
estimation of the effective momentum are listed in Table 4.1. These values allowed us to
reproduce the thermal stratification phenomenon in simulations and achieve relatively good
agreement in vertical temperature distribution, although temperature at the pool surface and at
the bottom the pool still remained problematic.
In the SPA-T3 experiment, a sharp thermocline was observed in the bottom part of the pool, but
the vertical cell size of 100 mm used in GOTHIC could not capture this temperature gradient. To
improve GOTHIC predictions, it was decided to reduce this cell size to 40mm.
Further in the model revision, a study was conducted which examined sensitivity to the surface
wave damping factor. In the pre-test calculations, this value was set with a limit of 100 in order
to ease the time step restriction for the simulation. Post-test calculations, however, proved this
approach inaccurate since the water motion near the pool surface was overly restricted. The
value was then reduced and, based on the conducted sensitivity study, it was found that post-test
calculations should be performed for the surface wave damping factor of 10, which will help
obtain more realistic results and still maintain reasonable time step [36]. Having this, we were
able to better reproduce the process of thermal stratification, as when jet hits the pool surface,
surface waves are formed and jet’s energy is being dissipated. Furthermore, assuming this value
allowed us to refine the mesh at the top which resolved the previous issue of large non-physical
temperature drop that occurred when liquid level surpassed the cell. Higher grid resolution at the
top made it possible to track the pool surface temperature [36].
The GOTHIC model implemented for post-test validation consisted of 19608 cells. The refined
mesh for pool volume is shown in Figure 4.3. As for the GOTHIC simulation settings for post-
test calculations have been detailed in Table 4.2. Using a i7-3770 quad-core CPU @ 3.40 GHz
desktop computer, the presented model was able to simulate 5000 s of real-time transient in
approximately 43h.
Table 4.1: Estimated values of the closure term .
Condensation
Regime
Steam mass flux at injection holes
[kg/m2s] Closure Term
[N]
Oscillatory bubble 72
Oscillatory cone jet 162
…. …. …
Stable jet >300
Page 57
- 43 -
Table 4.2: GOTHIC simulation settings for the SPA-T3 case.
Figure 4.3: Mesh refinement for the post-test calculations.
4.2.2 Test-conditions used in post-test validation
Initial and boundary conditions were adjusted to the SPA-T3 experiment. Heat transfer between
the lab atmosphere and the pool walls was also modeled since the wetwell had not been
thermally insulated for the purposes of the experiment. For the side of the pool walls in contact
with the atmosphere, the heat transfer was computed using lab temperature data measured in the
experiment (see Figure 4.5.(c)) and assuming a constant heat transfer coefficient of 3 kW/(m2s)
[36]. The data collected from all the thermocouples (i.e. T1279-T1285) were implemented in the
GOTHIC model in accordance with their corresponding positions. Specific data on the positions,
for which the measurements were performed during the experiment, are presented in [50]. As
for the steam injection conditions, they are shown in Figure 4.4. Steam mass flow rate was time-
averaged every 100s. A slightly modified steam mass flow rate is also shown in Figure 4.4(a)
and the reason for this is explained in the next section. The steam enthalpy used in the simulation
General Settings
Turbulence
Surface Wave damping factor
Numerical scheme settings
Minimum time step
Maximum time step
Solution Method
Pressure solver
Pressure convergence limit
Differencing scheme
General Settings
k-ε
10
Numerical scheme settings
1e-7
0.05
Semi-Implicit
Conjugate
1e-7
BSOUP
Page 58
- 44 -
is presented in Figure 4.4(b), it was computed based on the temperature measurements T4070-
T4072 located near the inside of the sparger pipe (see Figure 4.1.(b)), assuming that steam was
injected to the pool close to saturation conditions. The steam temperatures of these
thermocouples were also time-averaged every 100s. Furthermore, the average value of these
readings was used for every hole since the holes oriented in the same vertical direction are
lumped into a single hole. The initial conditions of the pool and gas spaces were set to the values
presented in Table 4.3.
a) b)
Figure 4.4 SPA-T3 injection conditions for simulation: a) mass flow rate and b) enthalpy.
Figure 4.5: Temperatures recorded in the lab atmosphere and implemented in GOTHIC.
Page 59
- 45 -
Table 4.3: The test parameters of the SPA-T3 experiment.
Initial Conditions
Initial water level in the pool [m]
Initial pool water temperature [oC]
Initial gas space temperature [oC]
Initial pressure in the wetwell [kPa]
Initial Conditions
2.9
19.5
30, 26
105.8
4.3 Analysis of post-test results
4.3.1 Water level and average liquid temperature
The comparison of experimental and predicted water level has been presented in Figure 4.6. In
SPA-T3, the initial water level is 2.9m; within 5000s it increases to 3.085m. In spite of the same
initial level, the liquid level predicted in the simulation increases marginally faster and its final
value is 3.088m.
In the SPA-T3 experiment, the steam mass measured by a flow meter in the steam line is injected
directly into the wetwell. So the uncertainty associated with the amount of steam to be condensed
in the drywell as in previous blowdown tests was avoided.
The slight deviations in water level can be attributed to a minimum porosity criterion applied in
the simulation. In GOTHIC, modeling of different volume boundaries or geometries takes place
by blocking all, or part, of the cells. Sometimes a situation may occur where blockage and
computational mesh will leave a very small open volume. If the cell volume is smaller than the
minimum porosity criterion assumed for the simulation, GOTHIC blocks the entire cell and thus
reduces the modeled value. This approach eliminates numerical diffusion associated with very
limited volume of the cells. In our case, however, a small value of 0.05 was set for minimum
porosity which is considered too small to account for the difference in water level. Furthermore,
Figure 4.6 indicates that this difference becomes evident during the stratification phase, while for
the mixing phase water level increases the same as it does in the experiment. The deviation can
be attributed to the uncertainty in flow meter readings in the PPOOLEX facility as was the case
in previous PPOOLEX MIX tests [32]. They were observed only during the thermal stratification
phase, where steam is injected at a low mass flow rate, about 100 g/s. It was estimated that a
difference in water level between the test and the simulation amounts to approximately 11 kg of
steam and, therefore, this amount was later evenly distributed and deducted from the steam mass
flow rate recorded during the thermal stratification phase. The modified steam mass flow rate
used in the next simulation is shown in Figure 4.4(a). The water level transient obtained in the
simulation as a result of this modified steam flow rate then agreed excellently with the values
measured experimentally (see Figure 4.6).
Page 60
- 46 -
Additionally, Figure 4.7 contains the comparison of average liquid temperatures recorded during
the test and the simulation. The modified steam mass flow rate offers excellent match for the
average liquid temperature, thus proving that GOTHIC is able to correctly account for heat
losses to the lab atmosphere.
Figure 4.6: Comparison of water level between SPA-T3 experiment and simulation.
Figure 4.7: Comparison of average liquid temperature between SPA-T3 experiment and simulation.
Page 61
- 47 -
4.3.2 Temperature profile in the pool
In Figure 4.8-Figure 4.10 snapshots of the predicted temperature and velocity fields at different
times: t=1575s (stratification phase), t=3387s (stratification phase) and t=4761s (mixing phase)
are presented, and so are the corresponding vertical temperature profiles along L3 train where the
results of the simulation and the experiment were compared. Additionally, Figure 4.11 depicts a
3-D flow field.
As expected, a steam mass flow rate of 120 g/s, corresponding to a steam mass flux of 75
kg/(m2s), resulted in the development of strong thermal stratification in the pool (see Figure 4.8-
Figure 4.9). In this oscillatory bubble regime, the momentum of the turbulent water jet was not
sufficient to properly mix the pool. In these phases, the circulation flow pattern was controlled
by the buoyancy of the condensed water. Warm condensed water produces a sort of buoyant
plume that goes upwards. Further, an asymmetric circulation occurs with a maximum velocity of
magnitude roughly 0.1 m/s (see also Figure 4.11(a)). Both in the simulation and the experiment,
a thermocline layer develops in the pool: a sharp temperature gradient separating the mixed and
the stratified regions. It indicates that almost all steam in the experiment is condensed directly on
the surface of subcooled water. In the case of our simulation, complete condensation outside of
the sparger was an assumption in our EHS/EMS model and the entire heat and momentum
derived from it was provided to the boundaries of the condensation regions. The thermocline
layer developed during the test, is demonstrated by a steep angle change of the curve depicting
vertical temperature profile, as seen in Figure 4.8(b) and Figure 4.9.(b). We can also see in the
figures that the pool temperature profile predicted in the simulation agrees well with the
experiment results. In both cases, the bottom part of the pool remains cold, and its temperature at
t = 1575 s was predicted to be 22.5 o
C in simulation, while the one in the experiment was
22.2 oC. At the top of the pool, temperature in the simulation rose to 31.9
oC, while in the
experiment to 31.7 oC. During the test, low steam mass flux is maintained throughout
approximately 4000 s, and thermal stratification intensifies over time. Temperature in the top
part rose to 43.2 oC at t = 3387 s in the experiment, while in the simulation it was overestimated
by 1 oC. Analyzing the vertical temperature profile during thermal stratification, one can observe
that the position of the thermocline layer was captured rather well in the simulation. However, as
temperature gradient increases, temperature profile in the bottom part of the pool is captured less
well. More specifically, the thermocline layer is slightly broader in the simulation, while in case
of experiment the temperature change is steeper. These discrepancies can be attributed to grid
resolution being insufficient to resolve large temperature gradients but it will be addressed in
future simulations. One can also observe that at the point of steam discharge from the sparger’s
head holes, around 1.27 m, the temperature recorded in the simulation is 1oC higher. (see Figure
4.9(b)) This may be due to consideration in our simulation that the holes oriented in the same
direction are lumped together and therefore the heat source from condensation is accumulated in
a small area.
Page 62
- 48 -
In order to mix the pool, the steam mass flow rate was rapidly increased to approximately
250 g/s, corresponding to steam mass flux of about 155 kg/m2s. At this stage, condensation
occurred in the oscillatory cone regime, and enough momentum was generated to mix the pool,
both in the experiment and the simulation (see Figure 4.10). The magnitude of the maximum
velocity at this stage was predicted to be about 0.3 m/s. It should be noted that the momentum of
the turbulent water jet is significant enough to dominate over buoyancy, and therefore downward
recirculation prevails, as seen from the maximum velocity shown in Figure 4.11(b). Moreover,
since the momentum of condensed water is significant, the jet discharged from the other side of
the sparger (i.e. the one further away from the pool’s wall) also goes upward and downward,
making the internal flow pattern more symmetrical. At this stage, the pool temperature is
practically uniform and at t=4760 s, it is 50oC in the experiment while it is 50.5
oC in the
simulation. The simulation did not manage to completely mix the pool, i.e. a very small layer of
cooler water remained at the bottom of the pool. We were not able to confirm whether this was
true since none of the thermocouples was placed at that bottom layer in the experiment. In view
of the simulation results, an extra thermocouple was placed near the bottom in the succeeding
tests.
Figure 4.8: Temperature distribution in the pool at t=1575 s (stratification phase):
a) comparison of pool temperature profile along L3 train , b) temperature and velocity field from GOTHIC simulation.
Page 63
- 49 -
Figure 4.9: Temperature distribution in the pool at t=3387s (stratification phase):
a) temperature and velocity field from GOTHIC simulation, b) comparison of pool temperature profile along L3 train.
Figure 4.10: Temperature distribution in the pool at t=4761s (mixing phase):
a) comparison of pool temperature profile along L3 train , b) temperature and velocity field from GOTHIC simulation.
a) b)
Figure 4.11: 3D streamlines from the simulations during a) stratification phase and b) mixing phase.
Page 64
- 50 -
Figure 4.12-Figure 4.15 compare the EHS/EMS predictions of bulk water temperature over time
to experimental data. Each figure illustrates temperatures observed at different elevations along
the vertical trains of thermocouples L1 - L4. In the corner of each figure there is a top view
drawing of the PPOOLEX test facility, with red dot marking radial position within the tank
where the data is being compared. Furthermore, to evaluate accuracy of our model quantitatively,
the root mean square error (RMSE) was calculated. The RMSE of model prediction is defined by
Eq. (4.5), where N represents the number of recorded snapshots i.e. how often the data is saved
during simulation. Due to the relatively long transient, the registered data have been restricted,
and results are recorded during the simulation approximately every 20s (less for important
simulation stages, e.g. when rapid change in steam mass flow rate occurs). This still allows us to
obtain quality graphs and facilitates post-processing. Since the data during the experiment were
recorded with a much higher frequency, they were interpolated to the time of the simulation in
order to reduce interpolation error. Then, the corresponding data from the experiment and the
simulation were used to calculate the RMSE. The average RMSE registered for specific trains of
thermocouples (L1-L4) derived from all thermocouples data collected during total simulation
duration has been included in the upper corner of each graph containing the simulation results.
√∑
Eq. (4.5)
Figure 4.12: Comparison of experimental data with EHS/EMS results - L1 train of TCs. In the corner, there is a top view
drawing of the PPOOLEX test facility with red dot marking radial position within the tank where the data is being
compared
Experiment Simulation
m
Page 65
- 51 -
Figure 4.13: Comparison of experimental data with EHS/EMS results - L2 train of TCs.
Figure 4.14: Comparison of experimental data with EHS/EMS results - L3 train of TCs.
Figure 4.15: Comparison of experimental data with EHS/EMS results - L4 train of TCs.
Experiment
Simulation
m
Experiment
Experiment
Simulation
m
Simulation
m
Page 66
- 52 -
Given the results for specific trains of thermocouples, it can be concluded that generally
predicted global pool temperatures in the simulation agree well with the measured data over
time. Overall, the build-up of thermal stratification is well-reproduced in the simulation for each
of the analyzed radial position in the pool. However, considerable discrepancies in the simulation
occurred in a water layer at 0.77m – 0.87m. As explained earlier, this has been attributed to
insufficient grid resolution. Further, the results also indicate small differences in temperature in
the upper part of the pool. This is especially true for L3 train that is located near the wall. The
differences between minimum and maximum temperature recorded during the experiment in the
upper-warm part of the pool (i.e. above 0.8m) for L3 train are 3 oC. The simulation predicted a
slightly lower temperature differences in the upper part of the pool, at about 2 oC. This could be
due to the fact that effective momentum in the simulation is slightly higher. As for the trains L1
or L4, differences in temperature in the upper part are insignificant, which was also true for the
simulation. In addition, the experiment has shown that the data recorded by thermocouples
arranged along L1 and L4 are quite similar, which was also predicted in the simulation. The
redundancy of these trains was expected based on the results of pre-test calculations. The data
collected from the thermocouples arranged along L2 and L3 are also quite similar with slight
differences due to the asymmetrical position of the sparger.
The simulation was able to provide good prediction for development dynamics of thermal
stratification. The clearing phase ended after 230s, during which the pool was completely mixed
and relatively strong circulation flow was triggered, which required 250s to stagnate and enable
the development of thermal stratification in the vicinity of L1, L2 and L4 trains at t=500s. As for
L3, a visible development of thermal stratification occurred much earlier, i.e. at t=300s, since
this particular train is located in close proximity to the sparger and the wall, and therefore pool
dynamics slightly differs. In the simulation, thermal stratification was predicted with good
accuracy and began at t= 480s (for L1, L2 and L4) and 280s (for L3).
Furthermore, an important value for the PSP operation is the time scale necessary to achieve
erosion of thermally stratified layers. For this reason, the predictive capabilities of the proposed
EHS/EMS model should also be evaluated in this regard. It is known that the time scale of
mixing depends on temperature differences between the water layers. Layers of different
temperatures begin mixing at different times after increasing steam mass flow rate. Also, the
characteristic time scale varies for different layers. In analyzing the results, the time scale of
mixing will be defined as the time from a sudden increase of steam mass flow rate up until an
isothermal pool is obtained. The time scale of mixing can be determined from Figure 4.12-Figure
4.15. As for the experiment, this particular time scale was predicted to be about 500s. The fastest
to mix was the area around L3 train, the slowest - areas around L1 and L4. The simulation has
shown the same pattern, but here the predicted time scale of mixing was slightly faster and was
about 450s. This was most likely due to overestimation of effective momentum provided during
condensation in the oscillatory cone regime. This is further supported by the fact that mixing for
all layers starts a little earlier, as well as the occurrence of a rapid temperature drop at the
Page 67
- 53 -
beginning of the mixing phase and significant separation between the temperatures registered in
the upper and lower part of the pool, particularly evident for L3 train. In the experiment, on the
other hand, mixing tends to be smoother. This may be due to the provision of excessive
momentum which makes downward recirculation stronger. This, in turn, causes higher
turbulence and faster mixing at the bottom of the pool, and faster mixing in general.
Another important value for plant safety is pool surface temperature. In the case of our
simulation, we have received relatively good agreement while the average RMSE for pool
surface temperature was 0.890C.
4.3.2 Near-field temperature
The local temperature measurements in the vicinity of the sparger obtained from experimental
data and predicted by EHS/EMS are presented in Figure 4.16. The schematic at the upper left
corner of the plot shows the TC grid used to measure near-field temperature and indicates the TC
data that were analyzed. In the simulation, the sparger head holes oriented in the same direction
are lumped, and the data recorded by their corresponding thermocouples have been averaged (i.e.
the 4 thermocouples positioned at different heights and spaced at the same distance from the
sparger).
Figure 4.16: Local temperature measurements: a) PPOOLEX SPA-T3 test and b) corresponding EHS/EMS simulation.
In general, the trends of temperature variation were similar, but the GOTHIC results
overestimate temperature in the immediate vicinity of the sparger, i.e. for the thermocouples
placed 50 mm and 100 mm away from the sparger. For further distances, however, the
temperatures predicted in the simulation are similar to the test results, while the average RMSE
throughout the period of 5000 s was about 3 0C. The difference between the simulation and
experiment could be attributed to the assumed length of the condensation region in the
simulation. In the simulation, it assumed that all steam is condensed in the condensation region
with a length of about 20 mm from the jet exit. In the experiment, however, the detached bubbles
Experiment
Simulation
m
Page 68
- 54 -
might have condensed farther from the jet exit and the length of the condensation region could be
longer than what is assumed in the simulation. It is estimated that the length of the condensation
region that should be set in the simulation is about 300 mm in order to get a better match with the
experiment.
Furthermore, Figure 4.17 shows the issue of the Cartesian grid used by GOTHIC. This makes the
jets oriented at an angle with respect to grid lines, diffuse too quickly which, in turn, makes
temperature and velocity field less uniform, as is the case in experiment. However, these issues
are not significant, and the EHS/EMS model implemented in GOTHIC is still able to predict
global pool temperature quite accurately, especially the pool surface temperature and time scale
for mixing, both considered as important quantities for the operation of BWR pressure
suppression pools.
Figure 4.17: Temperature with superimposed velocity profile near the vicinity of the sparger head.
Page 69
- 55 -
5 Summary and Conclusions
Thermal stratification and mixing has direct influence in pressure suppression pool’s capabilities
and should be accounted for in safety analysis. There are currently no numerical methods that
could accurately, and in a computationally affordable manner, predict transient mixing induced
by steam blowdown over a broad range of conditions. This thesis aimed to develop and
preliminary validate effective models for steam injection through spargers. The steps required to
meet the objective of the work were: i) to develop and validate models to calculate the source of
effective heat and momentum derived from condensation process, and ii) to provide analytical
support to the experimental activity at LUT by designing a sparger and performing pre-test
calculations.
The major achievements and conclusions of the following work are summarized as follows:
(i) Effective Heat Source (EHS) and Effective Momentum Source (EMS) models for
prediction of thermal stratification and mixing induced by steam injection in a pool
through spargers were developed. The GOTHIC code was chosen as a computational
platform due to its combined 3D capability and better computational efficiency in
comparison with contemporary CFD codes.
(ii) A scaling methodology was proposed as a way to scale down the sparger for PPOOLEX
experiments. Due to the fact that thermal mixing induced by steam injection is a multi-
scale process, we analyzed processes at the macro-, meso-, and micro-scales. The
approach aimed to reproduce physical phenomena and condensation regimes relevant to
Nordic BWRs in the considered transient situation; both mixing and the development of
thermal stratification were possible within the current limitations of the PPOOLEX
facility.
(iii) Pre-test calculations were performed and became the basis for proposed test procedures,
operational regimes and suitable locations of thermocouples. The calculations predicted
the transition to mixing at a steam flow rate of 180 g/s, compared to about 150 g/s in the
experiment. Despite this, the pre-test calculations still provided valuable information,
which is the existence of the transition and is much lower than the steam generation
capacity of the PPOOLEX facility. This information means that both thermal
stratification and mixing can be attained experimentally. Moreover, the thermocouples
can capture relatively well the temperature profile in the pool. A set of experiments
according to a proposed test matrix were successfully conducted by LUT and provided
valuable data that will be used to further validate and develop the EHS/EMS models.
(iv) A preliminary validation of the EHS/EMS models for spargers was done against the
POOLEX SPA-T3 experiment. It was found that the simulation results are very sensitive
to the momentum provided as an input to the simulation. By providing a properly
estimated effective momentum, it was possible to obtain good agreement between
Page 70
- 56 -
experimental data and simulation results. Thermal stratification and mixing phases, as
well as transition between them, were generally well-predicted. Results of the simulation
predicted the temperature profile in the pool with an average RMSE of 1.250C. The
largest discrepancies between experimental data and simulation results occurred in the
thermocline layer This might have been due to insufficient mesh refinement in that
particular region, which will be accounted for in future simulations. Furthermore, the
near-field temperature was overpredicted by GOTHIC with an average RMSE of 6.13 0
C.
The main reason for this disagreement was attributed to length of condensation region
assumed in the simulation. Finally, it can be concluded that the EHS/EMS approach
implemented in GOTHIC code can predict, with acceptable accuracy and high
computational efficiency, the thermal stratification and mixing induced by steam
injection into a pool through a sparger.
Page 71
- 57 -
6 Outlook
In this section, it is emphasized that the proposed EHS/EMS model is still only at an initial stage
of development. It has been preliminarily validated against the PPOOLEX SPA-T3 test, which
were recorded throughout the initial period of 5000s. The data related to condensation occurring
in an oscillatory bubble and the oscillatory cone jet regime. It should be noted that numerous
regimes have been recognized, as shown by the regime map of Chan and Lee. The effective
momentum provided as a result of condensation strongly depends on the condensation regime,
even when steam mass flux is maintained at the same level. The most pressing issue is finding
analytical expressions that could properly describe the effective momentum. Validation of our
model in the chugging regime may turn out to be especially difficult since the physics of this
condensation mode is different and high-amplitude steam-water oscillations may introduce high
momentum to the pool. Calculation of the amplitude, frequency of oscillations and resulting
effective momentum in the chugging regime is also challenging but will be addressed in the
future. Further, experiments with the use of different holes configuration will be conducted, i.e.
experiments with a different number of rows of holes, whereas the other rows will be blocked.
This will allow to investigate the interaction occurring between neighboring jets, while using our
model for these cases will help us observe to what extent this interaction impacts the effective
momentum value. Moreover, later in the work, integral tests will be performed, where steam is
discharged both through sparger head holes and LRR holes. The experimental data will give us
an insight into the behavior of the developed sparger in such situations, while validating the
model against those tests will confirm whether it can account well enough for the interactions
between steam discharged from different parts of the sparger. The EHS/EMS model
implemented in GOTHIC will also address issues encountered when validating the model against
the SPA-T3 experiment, i.e. grid sensitivity study will be conducted to verify whether it is
possible to better capture temperature gradient in the bottom part of the pool, where the
thermocline layer occurs. An attempt will also be made to improve our model in terms of
predicting near-field temperature. With respect to near-field temperature, we will attempt to
obtain more uniform temperature in the vicinity of the sparger, and also to increase the steam
condensation region with the aim of reducing temperature in the immediate vicinity of the
sparger. There is still lot of work that needs to be done before the complete model can be applied
to plant analysis. Nevertheless, based on the results obtained from the preliminary validation, it
appears that further efforts in this direction are justified, since the EHS/EMS models can predict
well the pool’s surface temperature and time scale for mixing which are both considered
important quantities for pressure suppression pool operation.
Page 72
- 58 -
7 Bibliography
[1] "Störningshandboken," SKI Report 03:02, 2003.
[2] Norman, T. L.; Revankar, S. T., "Jet-plume condensation of steam–air mixtures in
subcooled water, Part 1: Experiments," Nuclear Engineering and Design, vol. 240, no. 3, p.
524–532, 2010.
[3] Song, C. H.; Cho, S.; Kang, H. S., "Steam Jet Condensation in a Pool: From Fundamental
Understanding to Engineering Scale Analysis," J. Heat Transfer, vol. 134, no. 3, 2012.
[4] Gamble, R. E.; Nguyen, T. T.; Shiralkar, B. S.; Peterson, P. F.; Greif, R.; Tabata, H.,
"Pressure suppression pool mixing in passive advanced BWR plants," Nuclear Engineering
and Design, vol. 204, no. 1–3, p. 321–336, 2001.
[5] Zhao, H.; Zou, L.; Zhang, H., "Simulation of thermal stratification in BWR suppression
pools with one dimensional modeling method," Annals of Nuclear Energy, vol. 63, p. 533–
540, 2014.
[6] Li, Hua, "Effective Models for Simulation of Thermal Stratification and Mixing Induced by
Steam Injection into a Large Pool of Water," KTH Royal Institute of Technology, 2014.
[7] Tokyo Electric Power Company, Inc., "Evaluation of the situation of cores and containment
vessels of Fukushima Daiichi Nuclear Power Station Units-1 to 3 and examination into
unsolved issues in the accident progression," 2013.
[8] Harutaka, H.; Masashi, H., "Severe Accident Analyses of Fukushima-Daiich Units 1 to 3,"
in Side Event by Government of Japan at 56th IAEA General Conference, 2012.
[9] Hoshi, H.; Kawabe, R., "Accident Sequence Analysis of Unit 1 to 3 Using MELCOR
Code," in Technical Workshop on TEPCO's Fukushima Dai-ichi NPS Accident, 2012.
[10] Gulawani, S. S.; Joshi, J. B.; Shah, M. S.; RamaPrasad, C. S.; Shukla, D. S., "CFD analysis
of flow pattern and heat transfer in direct contact steam condensation," Chemical
Engineering Science, vol. 61, no. 16, p. 5204 – 5220, 2006.
[11] Choo, Y. J.; Song, C. H., "PIV measurements of turbulent jet and pool mixing produced by
a steam jet discharge in a subcooled water pool," Nuclear Engineering and Design, vol. 240,
Page 73
- 59 -
no. 9, p. 2215–2224, 2010.
[12] Varzaly, A. M.; Grafton, W. A.; Chang, H.; Mitchell, M. K., "Mark III, 1977. Confirmatory
test program, 1: 3 scale condensation and stratification phenomena test series 5807,"
General Electric Report, 1977.
[13] Varzaly, A. M.; Grafton, , W. A.; Seely, D. S., "Mark III, 1978. Confirmatory test program,
full scale condensation and stratification phenomena-test series 5707," General Electric
Report, 1978.
[14] Varzaly, A. M.; Yu, K. P.; Kerinenen, J. A., "Mark III, 1980. Confirmatory test program,
1:9 area scale multicell condensation and stratification phenomena-test series 6003,"
General Electric Report, 1980.
[15] Ishii, M.; Ravankar, S. T.; Dowlati, R.; Bertodano, M. L.; Babelli, I.; Wang, W.; Pokhama,
H.; Ransom, V. H.; Viskanta, R.; Wilmarth, T.; Han, J. T., "Scientific Design of Purdue
University Multi-Dimensional Integral Test Assembly (PUMA) for GE SBWR,"
NUREG/CR-6309, 1996.
[16] Li, Hua; Kudinov, Pavel; Villanueva, Walter, "Development and Validation of Effective
Models for Simulation of Stratification and Mixing Phenomena in a Pool of Water," Nordic
Nuclear Safety Research (NKS), 2011.
[17] Norman, T. L.; Park, H. S.; Revankar, S. T.; Ishii, M.; Kelly, J. M., "Thermal Stratification
and Mixing in an Open Water Pool by Submerged Mixtures of Steam and Air," in ASME
2006 International Mechanical Engineering Congress and Exposition, Chicago, Illinois,
USA, 2006.
[18] Puustinen, M.; Laine, J.; Räsänen, A., "PPOOLEX Experiments on Thermal Stratification
and Mixing," NKS-198, 2009.
[19] Laine, J.; Puustinen, M.; Räsänen, A., "PPOOLEX Mixing Experiments," NKS-309, 2014.
[20] Puustinen, M.; Laine, J.; Räsänen, A.; Hujala, E., "Chugging Test with DN100 Blowdown
Pipe in the PPOOLEX Facility," NKS-310, 2014.
[21] Peterson, P. F., "Scaling and analysis of mixing in large stratified volumes," International
Journal of Heat and Mass Transfer, vol. 37, no. 1, pp. 97-106, 1994.
[22] Zhao, H.; Peterson, P. F., "An Overview of Modeling Methods for Thermal Mixing and
Stratification in Large Enclosures for Reactor Safety Analysis," in The 8th International
Topical Meeting on Nuclear Thermal-Hydraulics, Operation and Safety (NUTHOS-8),
Page 74
- 60 -
Shanghai, China, 2010.
[23] Zhao, H.; Zou, L.; Zhang , H., "An Efficient Modeling Method for Thermal Stratification
Simulation in A BWR Suppression Pool," in The 9th International Topical Meeting on
Nuclear Thermal-Hydraulics, Operation and Safety (NUTHOS-9), Kaohsiung, Taiwan,
2012.
[24] Cho, S.; Song, C. H.; Chung, H. J.; Chun, S. Y.; Chung, M. K., "Multiple-Hole Effect on the
Performance of a Sparger During Direct Contact Condensation of Steam," KSME
International Journal, vol. 15, no. 4, pp. 482- 491, 2001.
[25] Song, C. H.; Cho, S.; Kim, H. Y.; Bae, Y. Y.; Chung, M. K, "Characterization of direct
contact condensation of steam jets discharged into a subcooled water," in IAEA Technical
Commitee Mtg., Villigen, Switzerland, 1998.
[26] Kang, H. S.; Song, C. H., "CFD analysis for thermal mixing in a subcooled water tank under
a high steam mass flux discharge condition," Nuclear Engineering and Design, vol. 238, no.
3, p. 492–501, 2008.
[27] Moon, Y. T.; Lee, H. D.; Park, G. C., "CFD simulation of steam jet-induced thermal mixing
in subcooled water pool," Nuclear Engineering and Design, vol. 239, no. 12, p. 2849–2863,
2009.
[28] Kim, Y. S.; Youn, Y. J., "Experimental study of turbulent jet induced by steam jet
condensation through a hole in a water tank," International Communications in Heat and
Mass Transfer, vol. 35, no. 1, p. 21–29, 2008.
[29] Youn, Y. J.; Cho, Y. J.; Kim, Y. S.; Song, C. H., "Velocity and temperature profiles of a
turbulent jet induced by a steam jet discharged into a subcooled water pool," in 7th
International Topical Meeting on Nuclear Reactor Thermal Hydraulics, Operation and
Safety (NUTHOS-7), Seoul, Korea, 2008.
[30] H. Li, W. Villanueva and P. Kudinov, "Approach and Development of Effective Models for
Simulation of Thermal Stratification and Mixing Induced by Steam Injection into a Large
Pool of Water," Science and Technology of Nuclear Installations, vol. 2014, p. 11, 2014.
[31] Chan, C. K.; Lee, C.K. B., "A regime map for direct contact condensation," International
Journal of Multiphase Flow, vol. 8, no. 1, p. 11–20, 1982.
[32] Li, H.; Villanueva, W.; Puustinen, M.; Laine, J.; Kudinov, P., "Validation of Effective
Models for Simulation of Thermal Stratification and Mixing Induced by Steam Injection
into a Large Pool of Water," Science and Technology of Nuclear Installations, vol. 2014, p.
Page 75
- 61 -
18, 2014.
[33] Petrovic de With, A.; Calay, R. K.; de With, G., "Three-dimensional condensation regime
diagram for direct contact condensation of steam injected into water," International Journal
of Heat and Mass Transfer, vol. 50, no. 9–10, p. 1762–1770, 2007.
[34] Miller, D. R.; Comings, E. W., "Static pressure distribution in the free turbulent jet,"
Industrial & Engineering Chemistry Research, vol. 49, p. 985–985, 1957.
[35] Electric Power Research Institute, "GOTHIC Thermal hydraulics analysis package;
Qualification Report," NAI 8907-09, 2012.
[36] Gallego-Marcos, I.; Filich, L.; Villanueva, W.; Kudinov, P.;, "Effective models to predict
thermal stratification and mixing during a steam injection through spargers into a water
pool," The manuscript to be submitted, 2015.
[37] Kiang, R. L.;, "Scaling criteria for nuclear reactor thermal hydraulics," Nuclear Science and
Engineering, vol. 89, no. 3, pp. 207-216, 1985.
[38] Carbiener, W. A.; Cudnik, R. A., "Similitude consideration for modeling nuclear reactor
blowdown," Trans. Amer. Nucl. Soc., vol. 12, p. 361, 1969.
[39] Nahavandi, A. N.; Castellana, F. S.; Moradkhanian, E. N., "Scaling laws for modeling
nuclear reasctor systems," Nuclear Science and Engineering, vol. 72, no. 1, pp. 75-83, 1979.
[40] Hsu, Y. Y.; Wang, Z. Y.; Unal, C.; di Marzo, M.; Almenas, K., "Scaling-modeling for small
break LOCA test facilities," Nuclear Engineering and Design, vol. 122, no. 1-3, pp. 175-
194, 1990.
[41] Ishii, M.; Kataoka, I., "Scaling criteria for LWRs under single-phase and two-phase natural
circulation," US NRC NUREG/CR-3267, 1983.
[42] D’Auria, F.; Galassi, G. M., "Scaling in nuclear reactor system thermal-hydraulics,"
Nuclear Engineering and Design, vol. 240, no. 10, pp. 3267-3293, 2010.
[43] Yun, B. J.; Cho, H. K.; Euh, D. J.; Song, C. H.; Park, G. C., "Scaling for the ECC bypass
phenomena during the LBLOCA reflood phase," Nuclear Engineering and Design, vol. 231,
no. 3, pp. 315-325, 2004.
[44] Zuber, N., "An Integrated Structure and Scaling Methodology for Severe Accident
Technical Issue Resolution," NUREG/CR-5809, 1991.
Page 76
- 62 -
[45] Reyes Jr, J. N.; Hochreiter, L., "Scaling analysis for the OSU AP600 test facility (APEX),"
Nuclear Engineering and Design, vol. 186, no. 1–2, p. 53–109, 1998.
[46] Zuber, N.; Wilson, G. E.; Ishii, M.; Wulff, W.; Boyack, B. E.; Dukler, A. E.; Griffith, P.;
Healzer, J. M.; Henry, R. E.; Lehner, J. R.; Levy, S.; Moody, F. J.; Pilch, M.; Sehgal, B. R.;
Spencer, B. W.; Theofanous, T. G.; Valente, J., "An integrated structure and scaling
methodology for severe accident technical issue resolution: Development of methodology,"
Nuclear Engineering and Design, vol. 186, no. 1-2, p. 1–21, 1998.
[47] Sonin, A. A., "Scaling laws for small-scale modeling of steam relief into water pools,"
Nuclear Engineering and Design, vol. 65, no. 1, pp. 17-21, 1981.
[48] Li, Xiangbin; Zhang, M.; Du, Z.; Fu, Xiaoliang; Lu, Daogang; Yang, Y., "Scaling analysis
of coolant spraying process in automatic depressurized system," Annals of Nuclear Energy,
vol. 72, p. 350–357, 2014.
[49] Chun, J. H.; Sonin, A. A.;, "Small-scale simulation of vapor discharges into subcooled
liquid pools," Nuclear Engineering and Design, vol. 85, no. 3, p. 353–362, 1985.
[50] Laine, J.; Puustinen, M.; Räsänen, A., "PPOOLEX Experiments with a Sparger," NKS-334,
2015.
[51] Nilsson, L., "Development of an Input Model to MELCOR 1.8.5 for Oskarshamn 3 BWR,"
SKI Report 2007:05, 2006.
[52] Cho, S.; Chun, S. Y.; Baek, W. P.; Kim, Y, "Effect of multiple holes on the performance of
sparger during direct contact condensation of steam," Experimental Thermal and Fluid
Science, vol. 28, no. 6, p. 629–638, 2004.