38 th International Electronics Manufacturing Technology Conference 2018 Fig. 1 Typical electronic packaging assembly flow Incoming Materials •Package Design – manufacturing variation •Substrate warpage variation •Die Warpage •Raw materials (need to break it down the material model) Electronic Package Assembly •Process Steps •Temperature exposure •Time effect (Visco and creep) •Mechanical loading SMT Assembly •Reflow Temperature/Transient Thermal exposure and distribution •Mechanical interaction •Board level SJR •Yield Chip Attach •Mass Reflow •TCB •Non- Conductive Paste or Film Encapsulation & Molding •Underfill •Injection or Compression Molding •Molded Underfill Lid Attach (if applicable) •Mechanical loading •Adhesive •Thermal Interface Material Ball Attach •Mechanical loading •Reflow temperature Test and Final Inspection •Mechanical loading •Coplanarity/ Warpage Modeling of Molded Electronic Package Warpage Characteristic with Cure Induced Shrinkage and Viscoelasticity Properties Wei Keat Loh Intel Technology Sdn Bhd Malaysia [email protected]Chih Chung Hsu CoreTech System (Moldex3D) Taiwan [email protected]Ron W. Kulterman Flex Ltd, Austin Tx. USA [email protected]Haley Fu iNEMI Shanghai [email protected]Abstract— One of the challenges for developing an electronic package is to understand the dynamic warpage behavior of the package even before having the real physical sample. Hence, industry relies on the use of simulation tools, be it the finite element model and analytical equations, to refine the design options to obtain a high confidence warpage prediction. However, this is never consistently predictable because of the underlying assumptions where the actual assembly process is a lot more complex. In this paper, the comparison of assembly process steps and modeling method is discussed coupled with a demonstration of the use of Moldex3D to predict the mold flow pattern and warpage prediction by leveraging the mold cure kinetics, PVTC (Pressure Volume Temperature Cure) and viscoelasticity material properties of the mold. Effect of mesh detail, mold shrinkage percentage and glass transition temperature were considered to provide some general trend of these parameters impacting the package warpage prediction. The use of analytical equation in managing the material properties transition from uncured to cured mold was demonstrated. Even with existing modeling capabilities, there is no one common modeling method and capability to capture all the potential package assembly process interaction. Hence, this is the motivation for further development. Keywords—package warpage; simulation; assembly process; modeling; mold flow; viscoelasticity; PVTC, non-linear; glass transition I. INTRODUCTION In order to keep up with the demand and plethora of functionality in electronic devices, electronic packaging technology is getting more complex and integrated. One of the challenges for developing an electronic package is to understand the dynamic warpage behavior of the package even before having the real physical sample to reduce time to market and development cost. Hence, industry relies on the use of simulation tools, be it the finite element model and analytical equations, to refine the design options and to obtain a high confidence prediction. However, this is never consistently predictable because of the underlying assumptions used. The actual electronic package assembly process flow is complex as shown in Fig. 1. Starting from the incoming materials like substrate, silicon die and encapsulation materials which have different residual stresses built in, incoming warpage and material properties. Next is the electronic package assembly process steps which rely on thermal, mechanical loading and fluid flow principles to assemble the package. The assembly process can be further broken down into, not limited to, chip attach, encapsulation and molding, lid attached for package with lids, ball attach, test and final inspection. Within these processes, multi-physics interactions between thermal, mechanical, and fluid play a significant role in establishing the
Transcript
38th International Electronics Manufacturing Technology Conference 2018
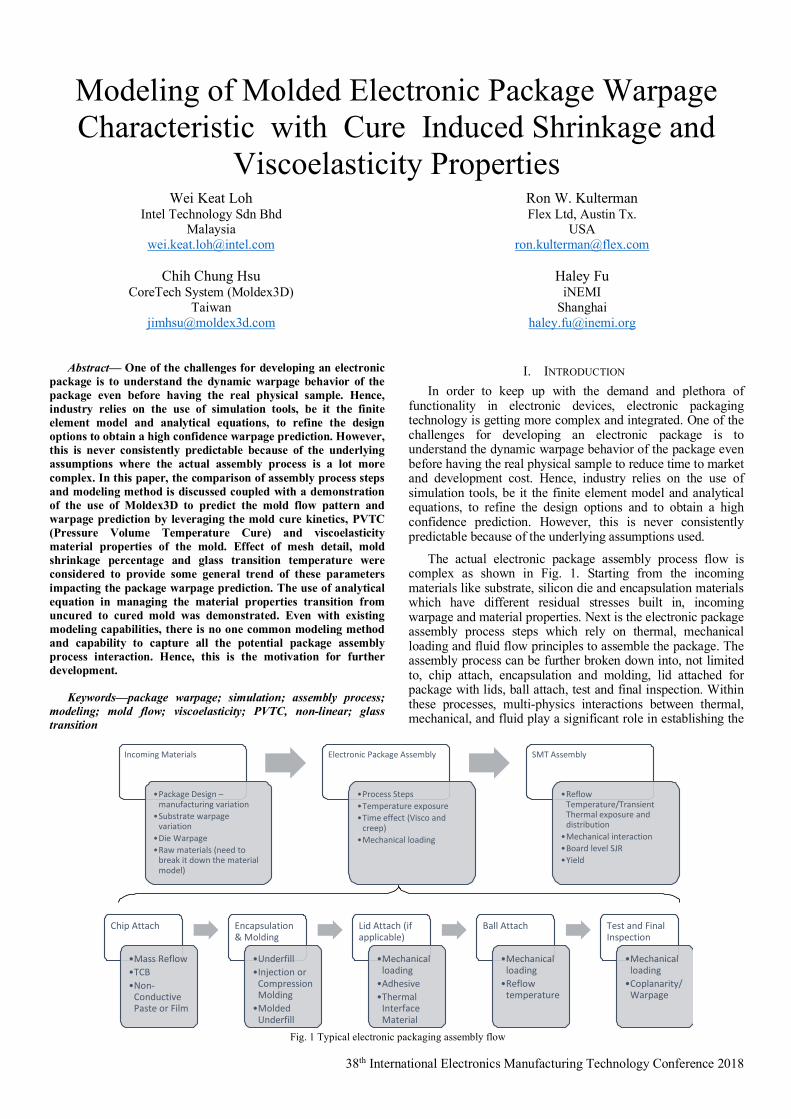
Fig. 1 Typical electronic packaging assembly flow
Incoming Materials
•Package Design –manufacturing variation
•Substrate warpage variation
•Die Warpage•Raw materials (need to
break it down the material model)
Electronic Package Assembly
•Process Steps•Temperature exposure•Time effect (Visco and
creep)•Mechanical loading
SMT Assembly
•Reflow Temperature/Transient Thermal exposure and distribution
•Mechanical interaction•Board level SJR•Yield
Chip Attach
•Mass Reflow•TCB•Non-
Conductive Paste or Film
Encapsulation & Molding
•Underfill•Injection or
Compression Molding
•Molded Underfill
Lid Attach (if applicable)
•Mechanical loading
•Adhesive•Thermal
Interface Material
Ball Attach
•Mechanical loading
•Reflow temperature
Test and Final Inspection
•Mechanical loading
•Coplanarity/Warpage
Modeling of Molded Electronic Package Warpage Characteristic with Cure Induced Shrinkage and
Abstract— One of the challenges for developing an electronic package is to understand the dynamic warpage behavior of the package even before having the real physical sample. Hence, industry relies on the use of simulation tools, be it the finite element model and analytical equations, to refine the design options to obtain a high confidence warpage prediction. However, this is never consistently predictable because of the underlying assumptions where the actual assembly process is a lot more complex. In this paper, the comparison of assembly process steps and modeling method is discussed coupled with a demonstration of the use of Moldex3D to predict the mold flow pattern and warpage prediction by leveraging the mold cure kinetics, PVTC (Pressure Volume Temperature Cure) and viscoelasticity material properties of the mold. Effect of mesh detail, mold shrinkage percentage and glass transition temperature were considered to provide some general trend of these parameters impacting the package warpage prediction. The use of analytical equation in managing the material properties transition from uncured to cured mold was demonstrated. Even with existing modeling capabilities, there is no one common modeling method and capability to capture all the potential package assembly process interaction. Hence, this is the motivation for further development.
I. INTRODUCTION In order to keep up with the demand and plethora of
functionality in electronic devices, electronic packaging technology is getting more complex and integrated. One of the challenges for developing an electronic package is to understand the dynamic warpage behavior of the package even before having the real physical sample to reduce time to market and development cost. Hence, industry relies on the use of simulation tools, be it the finite element model and analytical equations, to refine the design options and to obtain a high confidence prediction. However, this is never consistently predictable because of the underlying assumptions used.
The actual electronic package assembly process flow is complex as shown in Fig. 1. Starting from the incoming materials like substrate, silicon die and encapsulation materials which have different residual stresses built in, incoming warpage and material properties. Next is the electronic package assembly process steps which rely on thermal, mechanical loading and fluid flow principles to assemble the package. The assembly process can be further broken down into, not limited to, chip attach, encapsulation and molding, lid attached for package with lids, ball attach, test and final inspection. Within these processes, multi-physics interactions between thermal, mechanical, and fluid play a significant role in establishing the
38th International Electronics Manufacturing Technology Conference 2018
residual stress history in the package. Lastly, a successful surface mount process (SMT), where the electronic package is mounted onto a board using reflow processes, coupled with the demands of high yield assembly depends on the dynamic warpage of the package as well as the SMT parameters.
On contrary, the widely used simulation tool or methodology for predicting the dynamic warpage hardly reflects the actual assembly process history and not to mention the incoming variation of raw materials shapes and properties. The common method for warpage prediction typically progresses from ideal geometry model creation, then followed by meshing and applying relevant boundary constraints; then followed by applying relevant measured material properties. The material models widely used are combinations of linear and non-linear properties. Next, the model loading is applied assuming a certain stress free temperature and cooled down to room temperature or heated up to temperature of interest after computing the equivalent state of stress and strain distribution. Then the predicted stress and package warpage are assessed for the goodness of the design. All the above can be presented as shown in Fig. 2. In practice, this is a close approximation method for relative comparison. However, when the warpage
contribution of other complex boundary conditions like viscos-elasticity properties, staging time effect, mechanical loading, fluid structural interaction, post assembly annealing (eg: post mold cure), repeated exposure to high temperature and moisture are involved, the current modelling approach may not predict well and very much depends on experienced gained priori. This can cause uncertainty on the electronic package design decision made during the early stage of development. For the scope of this paper, the molded package warpage characteristic is of interest which involves fluid dynamic and stress analysis principles.
In order to improve the simulated package warpage with the measured data, it is very important to consider the process-dependent constitutive behaviors of the packaging materials. A practical warpage prediction model should cover three key factors. The first factor is the viscoelastic nature of the package polymeric materials; second is the proper accounting for chemical shrinkage behavior of the polymeric compound [1] and lastly is the inclusion of the potential variation sensitivity studies. For the viscoelastic properties of the molding material, it is essential to consider the constitutive behaviors of the materials by using time-dependent viscoelastic models for ensuring accurate warpage predictions. The molding material is highly dependent on temperature and degree of cure, most of the studies applied a dynamic mechanical analyzer (DMA) to investigate the increase of
elastic modulus and the changes in the viscoelastic behavior[2][3]. And the generalized Maxwell model and WLF (Williams–Landel–Ferry) relation for cure-time-temperature superposition are widely used to describe the viscoelastic behavior of molding compounds [4]. The other key factor is the chemical shrinkage that influences the warpage dramatically and needs to be considered in the simulation model. The chemical shrinkage is not widely used due to the difficulty of measuring this kind of shrinkage for molding compounds. Alternative to the use of TMA data, the pressure-volume-temperature-cure (PVTC) equation can account for the chemical shrinkage during the molding process and the thermal expansion properties as well [5]. The PVTC equation can be simply expressed as a polynomials or traditional Taited model [6] to describe the historical profiles of volume shrinkage under specified isothermal and isobaric states. From the predicted results, volume shrinkage under different pressure levels in any specified temperature can be approximated to predict the shrinkage behavior for a package during molding. Lastly, the process and material variation sensitivity study should be included to capture the final
package warpage population distribution.
In this paper, an arbitrary molded package design was used to demonstrate the different assumptions employed to simulate the package dynamic warpage behavior using temperature and chemical curing dependent visco-elasticity and PVTC properties. The implementation equations and analytical solutions are presented together with a detail discussion of the properties used. Since molded package involves the transfer mold flow process, the mold flow characteristic is briefly presented to understand the curing and filling process. Subsequently, structural analysis is modeled to evaluate the impact of post mold cure, visco-elasticity properties, glass transition temperature and substrate design details sensitivity study on the simulated package warpage.
II. IMPLEMNTATION DETAILS The commercial modeling software considered here was based on Moldex3D R16. The implementation of the simulation can be divided into two stages as shown in Fig. 3. First stage is the mold transfer and in-mold curing stage, and second stage is the post mold cure stage. In the in-mold cure stage, the simulation took into account flow viscosity and curing kinetics for the mold flow simulation and leveraged the Pressure-Volume-Temperature-Cure (PVTC) properties for stress analysis which include the mold shrinkage computation. On the second stage, the stress analysis was computed for post mold cure induced shrinkage and subsequent other time
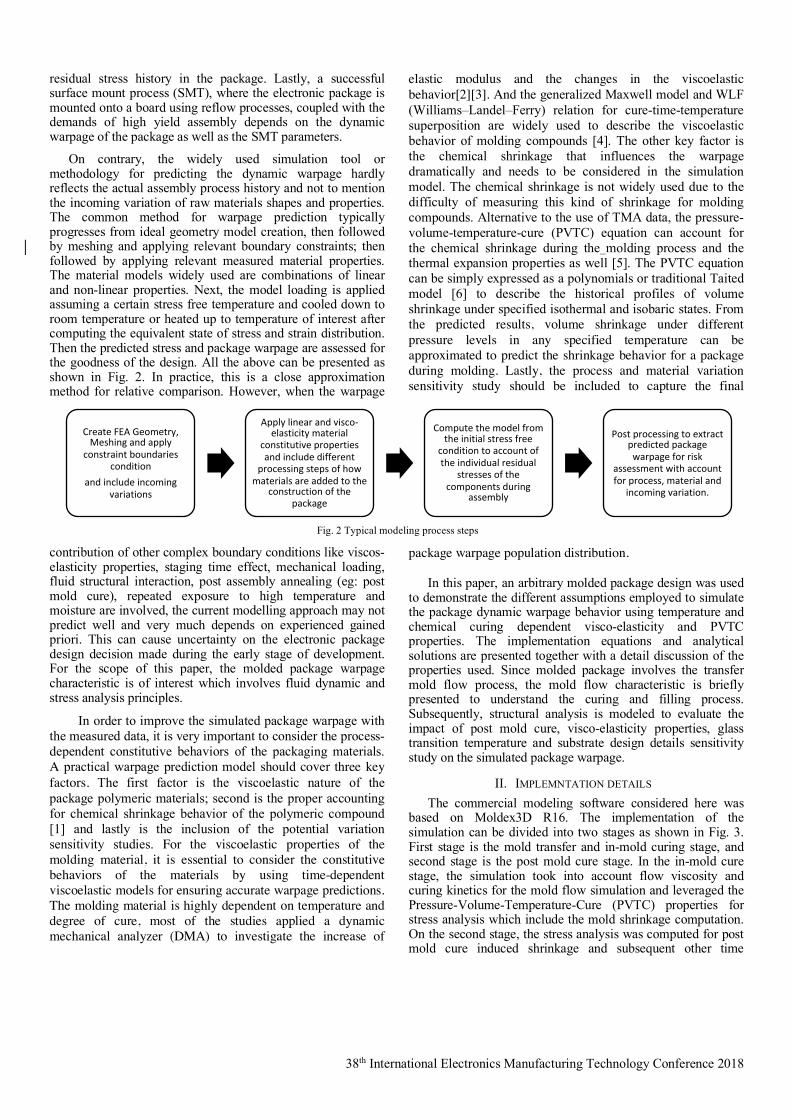
Fig. 2 Typical modeling process steps
Create FEA Geometry, Meshing and apply
constraint boundaries condition
and include incoming variations
Apply linear and visco-elasticity material
constitutive properties and include different
processing steps of how materials are added to the
construction of the package
Compute the model from the initial stress free
condition to account of the individual residual
stresses of the components during
assembly
Post processing to extract predicted package warpage for risk
assessment with account for process, material and
incoming variation.
38th International Electronics Manufacturing Technology Conference 2018
dependent thermal exposure loading. As the final result, the level of warpage of the package can be deduced based on mold flow, evolution of mold curing and residual stresses due to the thermal expansion and mold shrinkage properties. Each of the properties are described in the following subsections.
A. Flow Governing Equations
Theoretically, microchip encapsulation process is a three-dimensional, transient, reactive problem with moving resin front. The non-isothermal resin flow into the mold cavity can be mathematically described by the following equations [7]:
(1)
(2)
(3) (4)
where u is the velocity vector, T is the temperature, t is the time, p is the pressure, σ is the total stress tensor, ρ is the fluid density, k is the thermal conductivity, Cp is the specific heat, and is the energy source term. In this work, the energy source contains two contributions:
(5) where η is the viscosity, is the magnitude of the rate of
deformation tensor, is the conversion rate and is the exothermic heat of polymerization. B. Chemorheology or Curing Kinetics: The curing reaction of epoxy resins has received much attention using different analyses. In this work, we apply the combined model to investigate the curing kinetics of the given mold because of its ability to accurately predict the experimental data. The combined model can be expressed as follows:
(6)
(7)
(8)
where is the conversion rate of the reaction, are model parameters. During the curing process, the
viscosity of epoxy resins changes with temperature and conversion rate. The Castro-Macosko model is adopted to describe the rheological properties of epoxy resins:
(9)
(10) where are model parameters, denotes gelation conversion at which viscosity curve grows up because of the formation of the three-dimensional network structure of the epoxy resins.
After the mold strip or package is ejected from the mold chase, a free thermal and cure shrinkage happens due to the temperature and conversion rate difference. The mechanical properties are described as viscoelastic for post mold cure analysis. The equilibrium equation with representing the stress is expressed as follows:
(11) And the relation between stress and strain,
(12)
(13)
where is the stress, is a tensor and function of relaxation modulus E(t, T, ) , is the strain tensor and is the displacement vector, representatively. The stiffness tensor could be expressed as
(14)
where ν is the Poisson ratio, δij is the Kronecker delta. Thermal and cure induced strains can be expressed in the following:
(15)
(16)
is CTE tensor, VS(P,V,T,C) can be calculated from the chemical volume shrinkage by PVTC model.
C. Pressure-Volume-Temperature-Cure model(PVTC): The two domain modified Tait model [6] is used to formulate the specified volume of resin as below:
(17)
where are model parameters.
0=r×Ñ+¶r¶ ut
( ) ( ) gσuuu rrr =-×Ñ+¶¶t
( )Tp uuIσ Ñ+Ñ+-= h
( ) F+ÑÑ=÷øö
çèæ Ñ×+¶¶ TTtTCP kur
F
HD+=F agh !!
g!a! HD
( )( )nmkkdtd aaa
-+= 121
÷øö
çèæ-=RTEAk 1
11 exp
÷øö
çèæ-=RTEAk 2
22 exp
a ,,,, 2121 EEAAnm,
( ) ( )a
aaa
hah21
0,CC
g
gTT+
÷÷ø
öççè
æ
-=
( ) ( )RTEAT aexp0 =h
21,,, CCEA a ga
0=Ñs
s C th4a e U
( ) ( ) ( )( ) klijjkiljlikijkltEtEC dd
nnndddd
n 211)(
12)(
-+++
+==C
CLTEa
51 ~ bb
Fig. 3 Moldex3D modeling implementation approach
Flow viscosity
Curing kinetics
PVTC
Viscoelasticity
Stage 1: Compute for1. In mold filling and
curing stage2. Induce residual
stress and shrinkage based on degree of cure and pressure
Stage 2: Compute for1. Post mold cure stage2. Subsequent Thermal
exposure stage
))( CureThermal eees --=C
)(21 TUU Ñ+Ñ=e
TCLTEThermal D=ae
),,,( CTVPVSCure =e
( )( )
0894.0,
if if ,
,expexp
if if ,
,
1ln1
1)1(11
5
65
43
43
21
210
0/
=-=
+=
>£
ïî
ïíì
-
-=
>£
ïî
ïíì
+
+=
úû
ùêë
é÷øö
çèæ +-=
+-=
CbTTPbbT
TTTT
TbbTbb
B
TTTT
TbbTbb
V
BpCVV
VVV
t
t
t
LL
SS
t
t
LL
SS
uncuredcured
cureduncured
aa
38th International Electronics Manufacturing Technology Conference 2018
D. Viscoelastic constitutive behavior: Assuming the constitutive behavior of the epoxy molding
compound is linear viscoelastic, the stress-strain relationship for the molding compound during the polymerization conversion phase may be expressed as equation (14). E is the relaxation modulus, and it is a function of time, temperature and the degree of conversion. It is assumed that the epoxy resin considered behaves thermo-rheologically simple (TRS), and the cure-time-temperature superposition principle is applicable for modeling the relaxation modulus. A master function for the relaxation modulus is described by using the Generalized Maxwell model (also known as the Prony series), which is given by [4]:
(18) where the shift factor , is the temperature shift factor, is the curing shift factor. In addition,
(19)
(20)
III. MODEL DETAILS An arbitrary flip chip molded package with given geometry
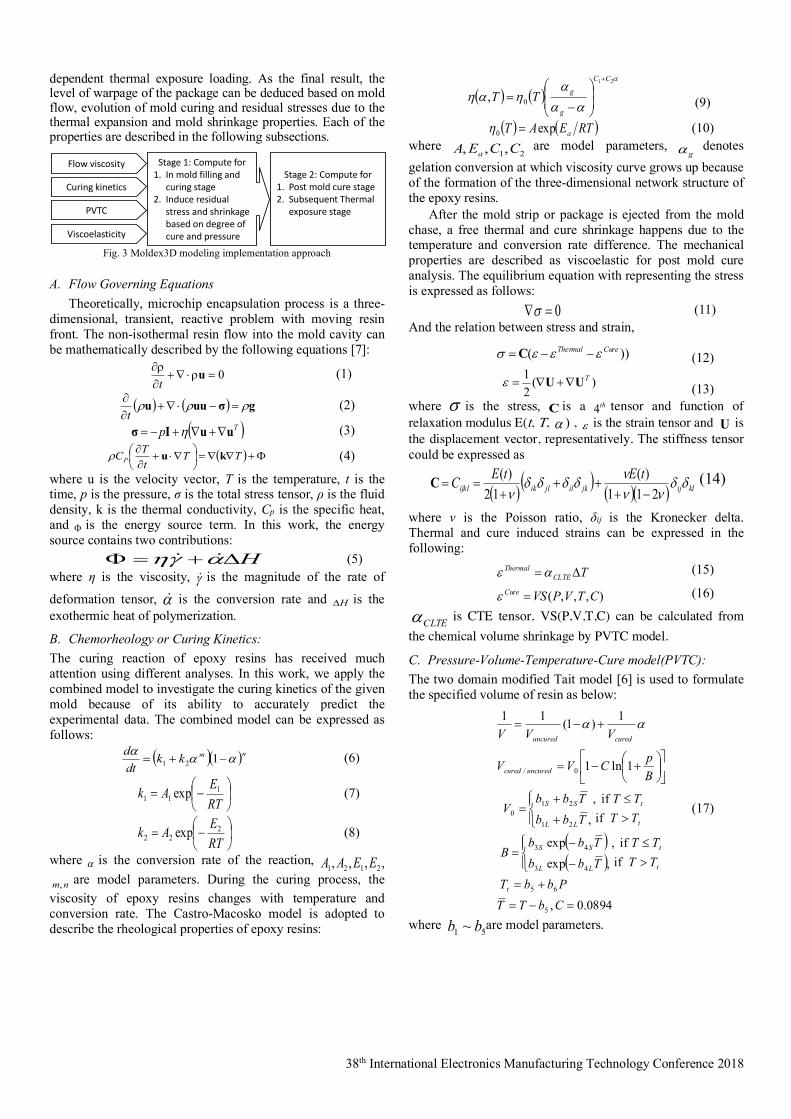
as shown in Fig. 4 was used for this demonstration. The mesh size used was approximately 50um with total element of 256k were generated. The detail of substrate design was approximated to the actual design. The substrate consists of two dielectric layers over the substrate core material. The mold thickness was 450 um. The generic properties of the materials used are listed in TABLE I. In addition, time and cure dependency material properties of the mold were employed to capture the effect of curing kinetics, PVTC and viscoelasticity on package warpage prediction as depicted in Fig. 5 to Fig. 7
.
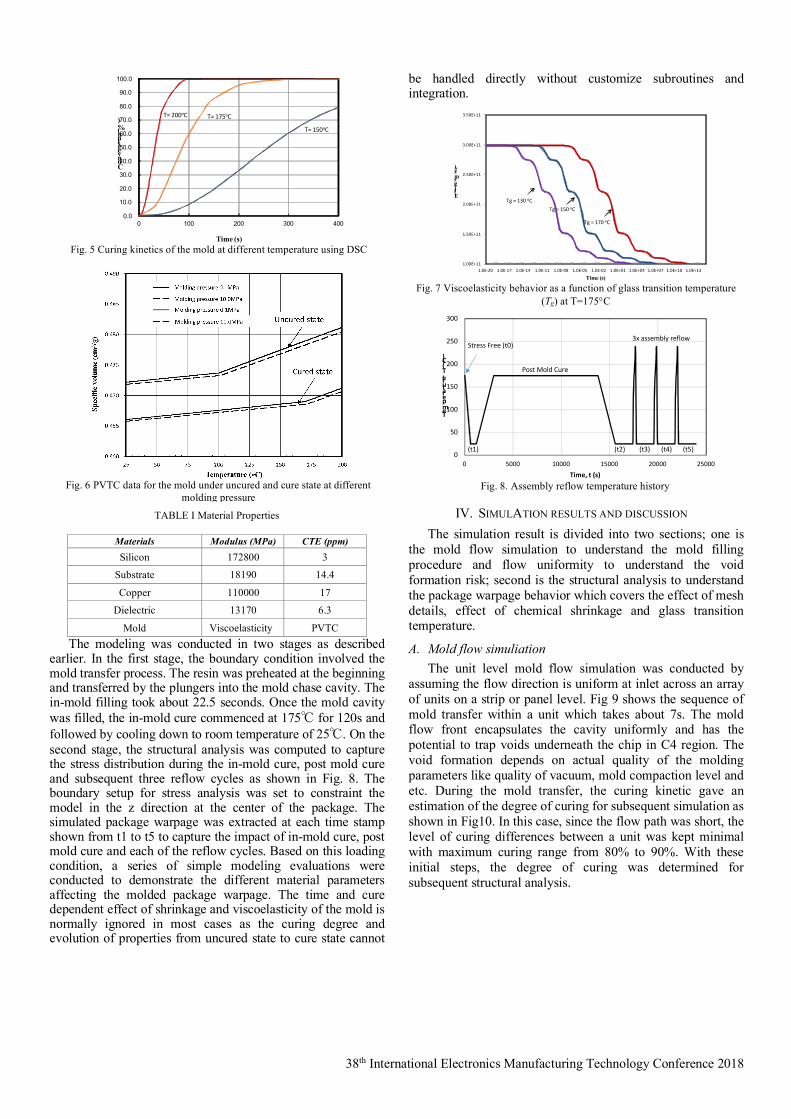
The curing kinetic and PVTC of the mold was
characterized using differential scanning calorimetry (DSC) and piston apparatus method to obtain the percentage of conversion of monomer to polymer and shrinkage respectively. As the curing temperature increases, the conversion time from uncured to cured state shorten as shown in Fig 5 due to higher activation energy. The PVTC data shown in Fig 6 was collected under uncured and cured state to detect the displacement change of the plunger under the non-isothermal heating condition. The specific volume for an uncured state characteristic was estimated in the heating cycle where the specific volume increases with temperature. The measurement proceeds until it reached the intended curing temperature which will pass over the glass-transition temperature. As for the cured state, the specific volume reduced significantly due to polymerization. The graph shows that the specific volume reduces with respect of temperature where it crosses the glass transition temperature during cooling. The amount of pressure applied during the curing also affects the packing of polymer and yielded a different level of specific volume or density and chemical shrinkage. However, based on the data observed, the pressure induced shrinkage was not a dominant factor and was omitted in this scope of study. As for viscoelasticity properties of the mold, a dynamic mechanical analyzer was used to characterize the viscoelasticity at different curing levels and temperature as depicted in
Fig. 7. Different Tg values influence the time-temperature dependence of relaxation modulus as in Fig. 7. As the Tg temperature is decreased, the stiffness drops dramatically and induces a lower modulus. These respective properties were inserted into the model based on the governing equations mentioned in the earlier section.
Mold Viscoelasticity PVTC The modeling was conducted in two stages as described earlier. In the first stage, the boundary condition involved the mold transfer process. The resin was preheated at the beginning and transferred by the plungers into the mold chase cavity. The in-mold filling took about 22.5 seconds. Once the mold cavity was filled, the in-mold cure commenced at 175℃ for 120s and followed by cooling down to room temperature of 25℃. On the second stage, the structural analysis was computed to capture the stress distribution during the in-mold cure, post mold cure and subsequent three reflow cycles as shown in Fig. 8. The boundary setup for stress analysis was set to constraint the model in the z direction at the center of the package. The simulated package warpage was extracted at each time stamp shown from t1 to t5 to capture the impact of in-mold cure, post mold cure and each of the reflow cycles. Based on this loading condition, a series of simple modeling evaluations were conducted to demonstrate the different material parameters affecting the molded package warpage. The time and cure dependent effect of shrinkage and viscoelasticity of the mold is normally ignored in most cases as the curing degree and evolution of properties from uncured state to cure state cannot
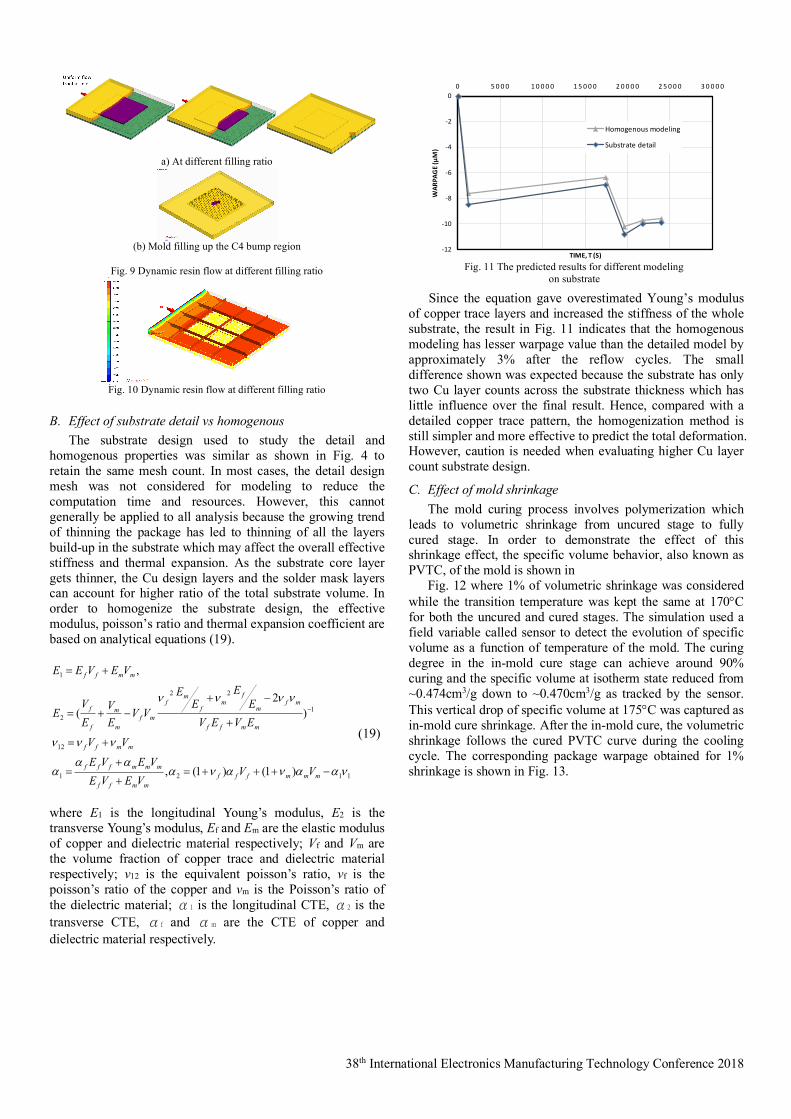
be handled directly without customize subroutines and integration.
IV. SIMULATION RESULTS AND DISCUSSION The simulation result is divided into two sections; one is
the mold flow simulation to understand the mold filling procedure and flow uniformity to understand the void formation risk; second is the structural analysis to understand the package warpage behavior which covers the effect of mesh details, effect of chemical shrinkage and glass transition temperature.
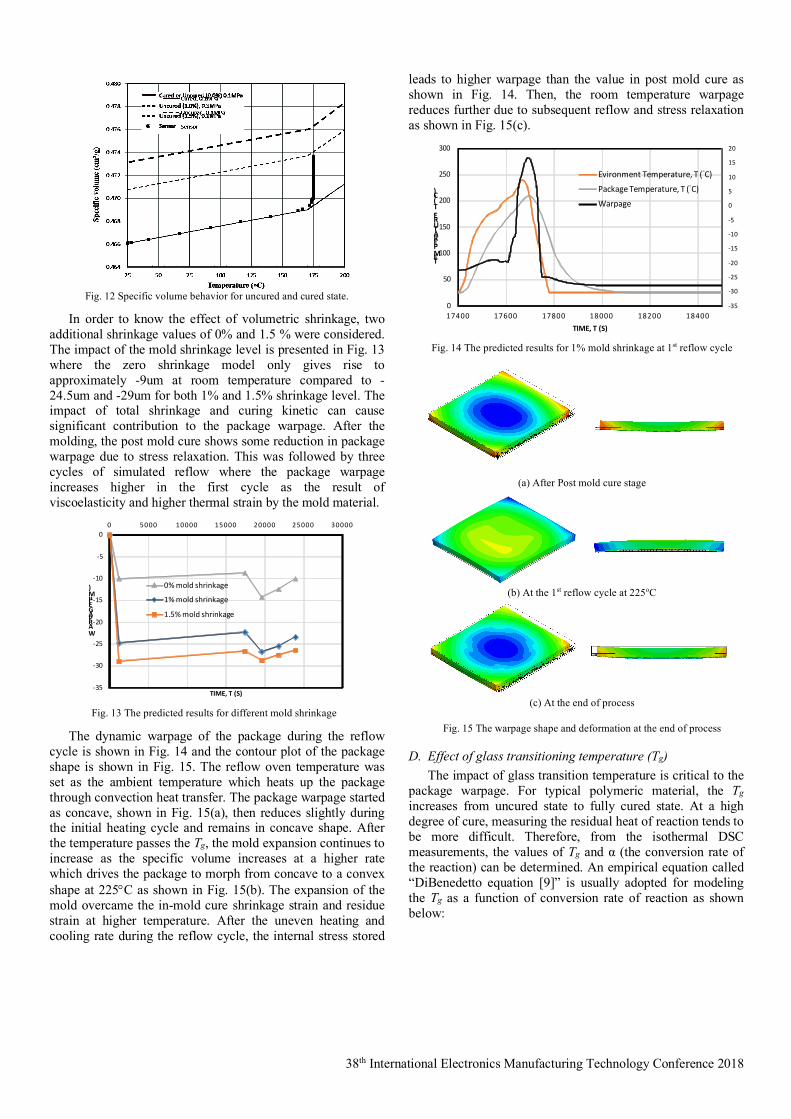
A. Mold flow simuliation The unit level mold flow simulation was conducted by
assuming the flow direction is uniform at inlet across an array of units on a strip or panel level. Fig 9 shows the sequence of mold transfer within a unit which takes about 7s. The mold flow front encapsulates the cavity uniformly and has the potential to trap voids underneath the chip in C4 region. The void formation depends on actual quality of the molding parameters like quality of vacuum, mold compaction level and etc. During the mold transfer, the curing kinetic gave an estimation of the degree of curing for subsequent simulation as shown in Fig10. In this case, since the flow path was short, the level of curing differences between a unit was kept minimal with maximum curing range from 80% to 90%. With these initial steps, the degree of curing was determined for subsequent structural analysis.
Fig. 5 Curing kinetics of the mold at different temperature using DSC
0.0
10.0
20.0
30.0
40.0
50.0
60.0
70.0
80.0
90.0
100.0
0 100 200 300 400
Conversion(%)
Time (s)
T= 200oC T= 175oC
T= 150oC
Fig. 6 PVTC data for the mold under uncured and cure state at different
molding pressure
Fig. 7 Viscoelasticity behavior as a function of glass transition temperature
38th International Electronics Manufacturing Technology Conference 2018
B. Effect of substrate detail vs homogenous
The substrate design used to study the detail and homogenous properties was similar as shown in Fig. 4 to retain the same mesh count. In most cases, the detail design mesh was not considered for modeling to reduce the computation time and resources. However, this cannot generally be applied to all analysis because the growing trend of thinning the package has led to thinning of all the layers build-up in the substrate which may affect the overall effective stiffness and thermal expansion. As the substrate core layer gets thinner, the Cu design layers and the solder mask layers can account for higher ratio of the total substrate volume. In order to homogenize the substrate design, the effective modulus, poisson’s ratio and thermal expansion coefficient are based on analytical equations (19).
(19)
where E1 is the longitudinal Young’s modulus, E2 is the transverse Young’s modulus, Ef and Em are the elastic modulus of copper and dielectric material respectively; Vf and Vm are the volume fraction of copper trace and dielectric material respectively; v12 is the equivalent poisson’s ratio, vf is the poisson’s ratio of the copper and vm is the Poisson’s ratio of the dielectric material; α1 is the longitudinal CTE, α2 is the transverse CTE, αf and αm are the CTE of copper and dielectric material respectively.
Since the equation gave overestimated Young’s modulus
of copper trace layers and increased the stiffness of the whole substrate, the result in Fig. 11 indicates that the homogenous modeling has lesser warpage value than the detailed model by approximately 3% after the reflow cycles. The small difference shown was expected because the substrate has only two Cu layer counts across the substrate thickness which has little influence over the final result. Hence, compared with a detailed copper trace pattern, the homogenization method is still simpler and more effective to predict the total deformation. However, caution is needed when evaluating higher Cu layer count substrate design.
C. Effect of mold shrinkage The mold curing process involves polymerization which
leads to volumetric shrinkage from uncured stage to fully cured stage. In order to demonstrate the effect of this shrinkage effect, the specific volume behavior, also known as PVTC, of the mold is shown in
Fig. 12 where 1% of volumetric shrinkage was considered while the transition temperature was kept the same at 170°C for both the uncured and cured stages. The simulation used a field variable called sensor to detect the evolution of specific volume as a function of temperature of the mold. The curing degree in the in-mold cure stage can achieve around 90% curing and the specific volume at isotherm state reduced from ~0.474cm3/g down to ~0.470cm3/g as tracked by the sensor. This vertical drop of specific volume at 175°C was captured as in-mold cure shrinkage. After the in-mold cure, the volumetric shrinkage follows the cured PVTC curve during the cooling cycle. The corresponding package warpage obtained for 1% shrinkage is shown in Fig. 13. 12121
12
1
22
2
1
)1()1(,
)2
(
,
naananaaa
a
nnn
nnnn
-+++=+
+=
+=
+
-+-+=
+=
-
mmmfffmmff
mmmfff
mmff
mmff
mfm
fm
f
mf
mfm
m
f
f
mmff
VVVEVEVEVE
VVEVEVE
EE
E
VVEV
EV
E
VEVEE
a) At different filling ratio
(b) Mold filling up the C4 bump region
Fig. 9 Dynamic resin flow at different filling ratio
Fig. 10 Dynamic resin flow at different filling ratio
Fig. 11 The predicted results for different modeling
38th International Electronics Manufacturing Technology Conference 2018
In order to know the effect of volumetric shrinkage, two
additional shrinkage values of 0% and 1.5 % were considered. The impact of the mold shrinkage level is presented in Fig. 13 where the zero shrinkage model only gives rise to approximately -9um at room temperature compared to -24.5um and -29um for both 1% and 1.5% shrinkage level. The impact of total shrinkage and curing kinetic can cause significant contribution to the package warpage. After the molding, the post mold cure shows some reduction in package warpage due to stress relaxation. This was followed by three cycles of simulated reflow where the package warpage increases higher in the first cycle as the result of viscoelasticity and higher thermal strain by the mold material.
The dynamic warpage of the package during the reflow
cycle is shown in Fig. 14 and the contour plot of the package shape is shown in Fig. 15. The reflow oven temperature was set as the ambient temperature which heats up the package through convection heat transfer. The package warpage started as concave, shown in Fig. 15(a), then reduces slightly during the initial heating cycle and remains in concave shape. After the temperature passes the Tg, the mold expansion continues to increase as the specific volume increases at a higher rate which drives the package to morph from concave to a convex shape at 225°C as shown in Fig. 15(b). The expansion of the mold overcame the in-mold cure shrinkage strain and residue strain at higher temperature. After the uneven heating and cooling rate during the reflow cycle, the internal stress stored
leads to higher warpage than the value in post mold cure as shown in Fig. 14. Then, the room temperature warpage reduces further due to subsequent reflow and stress relaxation as shown in Fig. 15(c).
D. Effect of glass transitioning temperature (Tg)
The impact of glass transition temperature is critical to the package warpage. For typical polymeric material, the Tg increases from uncured state to fully cured state. At a high degree of cure, measuring the residual heat of reaction tends to be more difficult. Therefore, from the isothermal DSC measurements, the values of Tg and α (the conversion rate of the reaction) can be determined. An empirical equation called “DiBenedetto equation [9]” is usually adopted for modeling the Tg as a function of conversion rate of reaction as shown below:
Fig. 12 Specific volume behavior for uncured and cured state.
Fig. 13 The predicted results for different mold shrinkage
-35
-30
-25
-20
-15
-10
-5
00 5000 10000 15000 20000 25000 30000
WARPAGE (µM)
TIME, T (S)
0% mold shrinkage
1% mold shrinkage
1.5% mold shrinkage
Fig. 14 The predicted results for 1% mold shrinkage at 1st reflow cycle
-35
-30
-25
-20
-15
-10
-5
0
5
10
15
20
0
50
100
150
200
250
300
17400 17600 17800 18000 18200 18400
WARPAGE (µM)
TEMPERATURE, T (°C)
TIME, T (S)
Evironment Temperature, T (°C)
Package Temperature, T (°C)
Warpage
(a) After Post mold cure stage
(b) At the 1st reflow cycle at 225oC
(c) At the end of process
Fig. 15 The warpage shape and deformation at the end of process
38th International Electronics Manufacturing Technology Conference 2018
(20)
where l is the model constant. And the curing shift factor, ac, utilizes Vogel model [10] is based on this analytical model:
(21)
ΔH and R are activation energy and Boltzmann constant. The plot of the Tg and ac at corresponding temperature is shown in Fig. 16. The equation estimates the Tg and shift factor as a function of curing degree. The impact of package warpage considering Tg effect is presented in Fig. 17. When the Tg effect was considered, the evolution of Tg as the mold changed from uncured state of Tg of 100°C to fully cured Tg of 170°C, as shown in Fig. 16. This induced higher specific volume shrinkage and the cure dependent viscoelasticity properties which leads to a higher warpage than constant Tg of 170°C. This phenomenon is particularly true when the level of mold curing conversion rate and the evolution of Tg based on the equations above are taken into account and could be representing the potential of variation in molding process.
After considering the impact of conversion rate and
evolution of Tg, the same modeling approach was used to evaluate the impact of package warpage at different levels of cured Tg as shown in Fig. 18, where the higher the Tg, the lower the package warpage obtained. This is attributed to the level of reduction of specific volume from the curing temperature to the Tg and subsequently to room temperature.
This can be shown in Fig. 19 where the ΔV130 is higher than ΔV170 . This showed that higher Tg mold material is desirable to reduce the package warpage.
V. CONCLUSIONS The work here purely focuses on sensitivity study of an
arbitrary case study. Modeling the package warpage by capturing the packaging assembly process involved requires significant effort in refining the assumptions, the numerical approach, and the analytical approach. The sensitivity model studied here only covered the molding process by capturing the mold flow and structural analysis based on fluid dynamics, PVTC, viscoelasticity with corresponding analytical equations and non-linear properties. Based on a simple package design, the impact of a detail model was not significant compared to a homogenous model. The in-mold cure shrinkage which was represented by PVTC data, played a significant role in determining the final package warpage. A higher cure shrinkage can yield a higher package warpage. The impact of mold cure conversion rate on Tg and PVTC can change the characteristic of package warpage from uncured to fully cured mold. The modeling demonstrated that a higher cured Tg mold gives rise to a lower package warpage. The additional reflow cycles included in the model increases the package warpage as the result of changes in the viscoelasticity and stress relaxation. The next logical step is to evaluate other modeling approaches and validation that can mimic the actual assembly
Fig. 19 Impact of high and low Tg on the specific volume reduction for two
different degree of cured mold
0.46
0.47
0.47
0.48
0.48
0.49
0.49
25 50 75 100 125 150 175 200
Spec
ific v
olum
e (c
m3 /g
)
Temperature (∘C)
Sensor(130)
Cured(130), 0.1MPa
Uncured(130), 0.1MPa
Sensor(170 degree C)
Cured(170), 0.1MPa
Uncured(170), 0.1MPa
△V170
△V130
38th International Electronics Manufacturing Technology Conference 2018
process as close as possible to enhance the prediction capability.
ACKNOWLEDGMENT The authors would like acknowledge iNEMI sponsors for creating a conducive environment for cross sharing of knowledge to enhance the industry best known method in applying modeling to real assembly process.
REFERENCES [1] Lin, Wei, and Min Woo Lee. "PoP/CSP warpage evaluation and
[2] Teng, Shiang-Yu, and Sheng-Jye Hwang. "Simulations of process-induced warpage during IC encapsulation process." Journal of Electronic Packaging129.3 (2007): 307-315.
[3] Huang, H-W., T-C. Chiu, and Y-S. Lai. "Warpage simulation for encapsulated package during post-mold curing process." Microsystems Packaging Assembly and Circuits Technology Conference (IMPACT), 2010 5th International. IEEE, 2010.
[4] Yeh, Shu-Shen, et al. "A novel integrated warpage prediction model based on characterization of viscoelasticity in time domain and chemical shrinkage for molded underfill." Microsystems, Packaging, Assembly
and Circuits Technology Conference (IMPACT), 2015 10th International. IEEE, 2015.
[5] H. Sejin, et al. Integrated flow analysis during filling and post-filling stage of semiconductor encapsulation. TRANSACTIONS-AMERICAN SOCIETY OF MECHANICAL ENGINEERS JOURNAL OF ELECTRONIC PACKAGING, 2000, 122.1: 20-27.
[6] Hwang, Sheng-Jye, and Yi-San Chang. "PVTC equation for epoxy molding compound." IEEE Transactions on Components and Packaging Technologies 29.1 (2006): 112-117.
[7] C. C., Hsu, et al. A study on warpage behavior of EMC in post-mold cure stage using Moldex3D. Additional Papers and Presentations, 2016, 2016.DPC: 000826-000850.
[8] HU, Guojun; KIM, Yong Goh; JUDY, Lim. Micromechanical analysis of copper trace in printed circuit boards. Microelectronics Reliability, 2011, 51.2: 416-424.
[9] DiBenedetto, A. T. "Prediction of the glass transition temperature of polymers: a model based on the principle of corresponding states." Journal of Polymer Science Part B: Polymer Physics25.9 (1987): 1949-1969.
[10] Simon, Sindee L., Gregory B. Mckenna, and Olivier Sindt. "Modeling the evolution of the dynamic mechanical properties of a commercial epoxy during cure after gelation." Journal of Applied Polymer Science 76.4 (2000): 495-508.


![Warpage Mechanism of Thin Embedded LSI Packages · 2013. 7. 3. · 47 [Technical Paper] Warpage Mechanism of Thin Embedded LSI Packages Yoshiki Nakashima*, Katsumi Kikuchi*, Kentaro](https://static.documents.pub/doc/80x56/60eee77b52764269737825c9/warpage-mechanism-of-thin-embedded-lsi-2013-7-3-47-technical-paper-warpage.jpg)
