43
Introduction to Counting APAM E4990 Modeling Social Data Jake Hofman Columbia University January 30, 2013 Jake Hofman (Columbia University) Intro to Counting January 30, 2013 1 / 28
| Date post: | 15-Jul-2015 |
| Category: |
Science |
| Upload: | jakehofman |
| View: | 848 times |
| Download: | 2 times |
Introduction to CountingAPAM E4990
Modeling Social Data
Jake Hofman
Columbia University
January 30, 2013
Jake Hofman (Columbia University) Intro to Counting January 30, 2013 1 / 28

Why counting?
Jake Hofman (Columbia University) Intro to Counting January 30, 2013 2 / 28
Why counting?
sta·tis·tic
noun1. A function of a random sample of data
Jake Hofman (Columbia University) Intro to Counting January 30, 2013 3 / 28

Why counting?
p( y︸︷︷︸support
| x︸︷︷︸age
)
Jake Hofman (Columbia University) Intro to Counting January 30, 2013 4 / 28

Why counting?
?p( y︸︷︷︸
support
| x1, x2, x3, . . .︸ ︷︷ ︸age, sex, race, party
)
Jake Hofman (Columbia University) Intro to Counting January 30, 2013 4 / 28

Why counting?
Problem:
Traditionally difficult to obtain reliable estimates due to smallsample sizes or sparsity
(e.g., ∼ 100 age × 2 sex × 5 race × 3 party = 3000 groups,but typical surveys collect ∼ 1,000s of responses)
Jake Hofman (Columbia University) Intro to Counting January 30, 2013 5 / 28

Why counting?
Potential solution:
Sacrifice granularity for precision, by binning observations intolarger, but fewer, groups
(e.g., bin age into a few groups: 18-29, 30-49, 50-64, 65+)
Jake Hofman (Columbia University) Intro to Counting January 30, 2013 5 / 28

Why counting?
Potential solution:
Develop more sophisticated methods that generalize well fromsmall samples
(e.g., fit a model: support ∼ β0 + β1age + β2age2 + . . .)
Jake Hofman (Columbia University) Intro to Counting January 30, 2013 5 / 28

Why counting?
(Partial) solution:
Obtain larger samples through other means, so we can just countand divide to make estimates via relative frequencies
(e.g., with ∼ 1M responses, we have 100s per group and canestimate support within a few percentage points)
Jake Hofman (Columbia University) Intro to Counting January 30, 2013 6 / 28

Why counting?
The good:
Shift away from sophisticated statistical methods on small samplesto simple methods on large samples
Jake Hofman (Columbia University) Intro to Counting January 30, 2013 7 / 28

Why counting?
The bad:
Even simple methods (e.g., counting) are computationallychallenging at large scales
(1M is easy, 1B a bit less so, 1T gets interesting)
Jake Hofman (Columbia University) Intro to Counting January 30, 2013 7 / 28

Why counting?
Claim:
Solving the counting problem at scale enables you to investigatemany interesting questions in the social sciences
Jake Hofman (Columbia University) Intro to Counting January 30, 2013 7 / 28

Learning to count
This week:
Counting at small/medium scales on a single machine
Following weeks:
Counting at large scales in parallel
Jake Hofman (Columbia University) Intro to Counting January 30, 2013 8 / 28
Learning to count
This week:
Counting at small/medium scales on a single machine
Following weeks:
Counting at large scales in parallel
Jake Hofman (Columbia University) Intro to Counting January 30, 2013 8 / 28

Counting, the easy way
Split / Apply / Combine1
http://bit.ly/sactutorial
• Load dataset into memory
• Split: Arrange observations into groups of interest
• Apply: Compute distributions and statistics within each group
• Combine: Collect results across groups1http://bit.ly/splitapplycombine
Jake Hofman (Columbia University) Intro to Counting January 30, 2013 9 / 28

The generic group-by operation
Split / Apply / Combine
for each observation as (group, value):
place value in bucket for corresponding group
for each group:
apply a function over values in bucket
output group and result
Useful for computing arbitrary within-group statistics when wehave required memory
(e.g., conditional distribution, median, etc.)
Jake Hofman (Columbia University) Intro to Counting January 30, 2013 10 / 28

Why counting?
Jake Hofman (Columbia University) Intro to Counting January 30, 2013 11 / 28

Example: Anatomy of the long tail
Dataset Users Items Rating levels ObservationsMovielens 100K 10K 10 10M
Netflix 500K 20K 5 100M
Jake Hofman (Columbia University) Intro to Counting January 30, 2013 12 / 28

Example: Anatomy of the long tail
Dataset Users Items Rating levels ObservationsMovielens 100K 10K 10 10M
Netflix 500K 20K 5 100M
Jake Hofman (Columbia University) Intro to Counting January 30, 2013 12 / 28

Example: Movielens
0
1,000,000
2,000,000
3,000,000
1 2 3 4 5Rating
Num
ber
of r
atin
gs
Jake Hofman (Columbia University) Intro to Counting January 30, 2013 13 / 28

Example: Movielens
0
1,000,000
2,000,000
3,000,000
1 2 3 4 5Rating
Num
ber
of r
atin
gs
group by rating value
for each group:
count # ratings
Jake Hofman (Columbia University) Intro to Counting January 30, 2013 14 / 28

Example: Movielens
1 2 3 4 5Mean Rating by Movie
Den
sity
Jake Hofman (Columbia University) Intro to Counting January 30, 2013 15 / 28

Example: Movielens
group by movie id
for each group:
compute average rating
1 2 3 4 5Mean Rating by Movie
Den
sity
Jake Hofman (Columbia University) Intro to Counting January 30, 2013 16 / 28

Example: Movielens
0%
25%
50%
75%
100%
0 3,000 6,000 9,000Movie Rank
CD
F
Jake Hofman (Columbia University) Intro to Counting January 30, 2013 17 / 28

Example: Movielens
0%
25%
50%
75%
100%
0 3,000 6,000 9,000Movie Rank
CD
F
group by movie id
for each group:
count # ratings
sort by group size
cumulatively sum group sizes
Jake Hofman (Columbia University) Intro to Counting January 30, 2013 18 / 28

Example: Movielens
0
2,000
4,000
6,000
8,000
100 10,000User eccentricity
Num
ber
of u
sers
Jake Hofman (Columbia University) Intro to Counting January 30, 2013 19 / 28

Example: Movielens
join movie ranks to ratings
group by user id
for each group:
compute median movie rank
0
2,000
4,000
6,000
8,000
100 10,000User eccentricity
Num
ber
of u
sers
Jake Hofman (Columbia University) Intro to Counting January 30, 2013 20 / 28

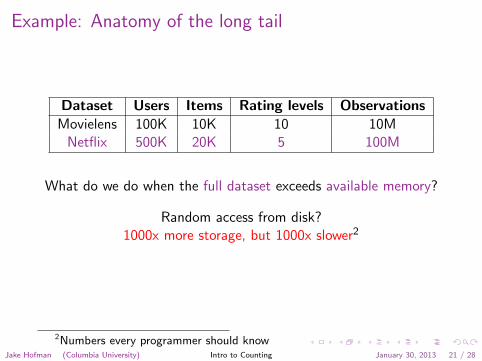
Example: Anatomy of the long tail
Dataset Users Items Rating levels ObservationsMovielens 100K 10K 10 10M
Netflix 500K 20K 5 100M
What do we do when the full dataset exceeds available memory?
Jake Hofman (Columbia University) Intro to Counting January 30, 2013 21 / 28

Example: Anatomy of the long tail
Dataset Users Items Rating levels ObservationsMovielens 100K 10K 10 10M
Netflix 500K 20K 5 100M
What do we do when the full dataset exceeds available memory?
Sampling?Unreliable estimates for rare groups
Jake Hofman (Columbia University) Intro to Counting January 30, 2013 21 / 28
Example: Anatomy of the long tail
Dataset Users Items Rating levels ObservationsMovielens 100K 10K 10 10M
Netflix 500K 20K 5 100M
What do we do when the full dataset exceeds available memory?
Random access from disk?1000x more storage, but 1000x slower2
2Numbers every programmer should knowJake Hofman (Columbia University) Intro to Counting January 30, 2013 21 / 28

Example: Anatomy of the long tail
Dataset Users Items Rating levels ObservationsMovielens 100K 10K 10 10M
Netflix 500K 20K 5 100M
What do we do when the full dataset exceeds available memory?
StreamingRead data one observation at a time, storing only needed state
Jake Hofman (Columbia University) Intro to Counting January 30, 2013 21 / 28

The combinable group-by operation
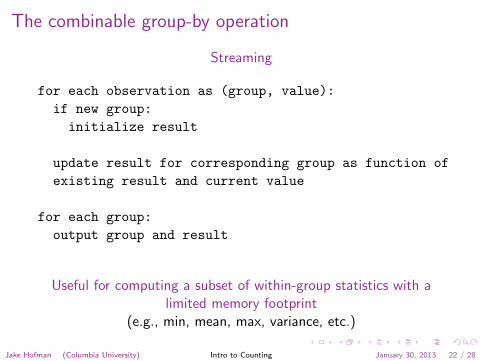
Streaming
for each observation as (group, value):
if new group:
initialize result
update result for corresponding group as function of
existing result and current value
for each group:
output group and result
Useful for computing a subset of within-group statistics with alimited memory footprint
(e.g., min, mean, max, variance, etc.)
Jake Hofman (Columbia University) Intro to Counting January 30, 2013 22 / 28
The combinable group-by operation
Streaming
for each observation as (group, value):
if new group:
initialize result
update result for corresponding group as function of
existing result and current value
for each group:
output group and result
Useful for computing a subset of within-group statistics with alimited memory footprint
(e.g., min, mean, max, variance, etc.)
Jake Hofman (Columbia University) Intro to Counting January 30, 2013 22 / 28

Example: Movielens
0
1,000,000
2,000,000
3,000,000
1 2 3 4 5Rating
Num
ber
of r
atin
gs
for each rating:
counts[movie id]++
Jake Hofman (Columbia University) Intro to Counting January 30, 2013 23 / 28

Example: Movielens
for each rating:
totals[movie id] += rating
counts[movie id]++
for each group:
totals[movie id] /
counts[movie id]
1 2 3 4 5Mean Rating by Movie
Den
sity
Jake Hofman (Columbia University) Intro to Counting January 30, 2013 24 / 28

Yet another group-by operation
Per-group histograms
for each observation as (group, value):
histogram[group][value]++
for each group:
compute result as a function of histogram
output group and result
We can recover arbitrary statistics if we can afford to store countsof all distinct values within in each group
Jake Hofman (Columbia University) Intro to Counting January 30, 2013 25 / 28
The group-by operation
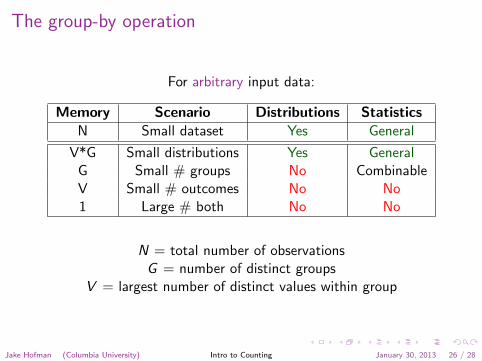
For arbitrary input data:
Memory Scenario Distributions StatisticsN Small dataset Yes General
V*G Small distributions Yes GeneralG Small # groups No CombinableV Small # outcomes No No1 Large # both No No
N = total number of observationsG = number of distinct groups
V = largest number of distinct values within group
Jake Hofman (Columbia University) Intro to Counting January 30, 2013 26 / 28

Examples (w/ 8GB RAM)
Median rating by movie for Netflix
N ∼ 100M ratingsG ∼ 20K movies
V ∼ 10 half-star values
V *G ∼ 200K, store per-group histograms for arbitrary statistics
(scales to arbitrary N, if you’re patient)
Jake Hofman (Columbia University) Intro to Counting January 30, 2013 27 / 28
Examples (w/ 8GB RAM)
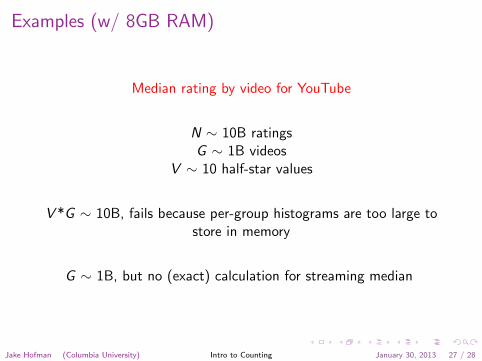
Median rating by video for YouTube
N ∼ 10B ratingsG ∼ 1B videos
V ∼ 10 half-star values
V *G ∼ 10B, fails because per-group histograms are too large tostore in memory
G ∼ 1B, but no (exact) calculation for streaming median
Jake Hofman (Columbia University) Intro to Counting January 30, 2013 27 / 28
Examples (w/ 8GB RAM)
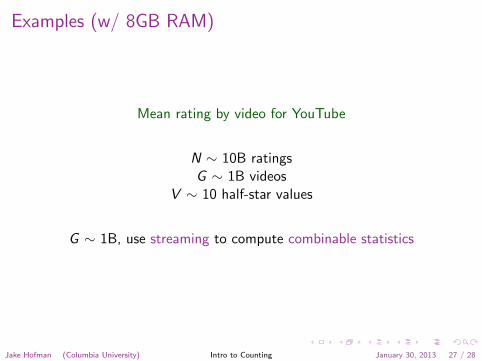
Mean rating by video for YouTube
N ∼ 10B ratingsG ∼ 1B videos
V ∼ 10 half-star values
G ∼ 1B, use streaming to compute combinable statistics
Jake Hofman (Columbia University) Intro to Counting January 30, 2013 27 / 28

The group-by operation
For pre-grouped input data:
Memory Scenario Distributions StatisticsN Small dataset Yes General
V*G Small distributions Yes GeneralG Small # groups No CombinableV Small # outcomes Yes General1 Large # both No Combinable
N = total number of observationsG = number of distinct groups
V = largest number of distinct values within group
Jake Hofman (Columbia University) Intro to Counting January 30, 2013 28 / 28


