Modelling Pedestrian Circulation in Rail Transit Stations Using Micro-Simulation Ronald John Galiza*, Inhi Kim**, Luis Ferreira* and Julian Laufer** *Intelligent Transport Systems Laboratory, University of Queensland **PTV-Asia-Pacific Abstract: Rail transit with its high passenger capacity and high efficiency has become one of the preferred alternatives to automobile travel. This is evident in the increasing patronage of rail travel especially in urban areas. As a result, many railway stations experience high levels of pedestrian congestion especially during the morning and afternoon peak periods. Traditional design and evaluation procedures for pedestrian transit facilities aim to maintain a desirable pedestrian level-of-service (PLOS) for the individual pedestrian areas or sub- precincts. In complex transit facilities, these sub-precincts interact with one another so that pedestrian circulation might be better assessed from a broader systems perspective. Micro- simulation packages that can model pedestrians (e.g. VISSIM) can be employed to assess these interactions. This paper outlines a procedure for the potential implementation of pedestrian flow analysis in a rail transit station using micro-simulation. Base model data requirements are identified which include static (facility layout and locations of temporary equipment) and dynamic data (pedestrian demand and public transport services). Possible model calibration criteria were also identified. A VISSIM® micro-simulation base model was developed for the North Melbourne Rail Station for investigating proposed station operational and infrastructure changes. This case study provided a good example for the potential implementation of micro-simulation models in the analysis of pedestrian circulation. Keywords: Pedestrian circulation, micro-simulation, rail transit stations 1. INTRODUCTION Micro-simulation traffic models (MSTMs) have in recent years become a widely accepted tool to analyse and identify solutions for traffic and transport planning. Micro- simulation has evolved from the crude 2-D analysis and simulation tool to functions that range from 3-D visualisation to emulation of actual traffic signal control systems. Use of MSTMs is potentially recommended for complex traffic operation schemes, significant conflicts among different road users, major road work on traffic movements, operation of dynamic control systems, large scale traffic studies, and public transport operations (Austroads 2006). Guidelines on the limitations and usage of MSTMs as an analysis tool for the vehicle-driven traffic are also well established (FHWA 2004; Austroads 2006; FaberMaunsell 2007). In developed countries where car ownership is high, policy makers are promoting public transport as a sustainable transportation system management measure and as a means to curtail increasing road congestion. This is especially true in central business districts (CBDs) of major cities and other concentrated employment centres where work trips cause the urban transportation system to congest. For this policy to be successful, a high capacity, reliable and comparable level of comfort alternative to car travel should be provided. Rail transit with its high passenger capacity and high efficiency offers the potential in reducing overall traffic congestion in the urban network. With this mode shift, additional ridership is introduced on the rail network and its corresponding facilities.
Transcript
Modelling Pedestrian Circulation in Rail Transit Stations Using Micro-Simulation Ronald John Galiza*, Inhi Kim**, Luis Ferreira* and Julian Laufer** *Intelligent Transport Systems Laboratory, University of Queensland **PTV-Asia-Pacific Abstract: Rail transit with its high passenger capacity and high efficiency has become one of the preferred alternatives to automobile travel. This is evident in the increasing patronage of rail travel especially in urban areas. As a result, many railway stations experience high levels of pedestrian congestion especially during the morning and afternoon peak periods. Traditional design and evaluation procedures for pedestrian transit facilities aim to maintain a desirable pedestrian level-of-service (PLOS) for the individual pedestrian areas or sub-precincts. In complex transit facilities, these sub-precincts interact with one another so that pedestrian circulation might be better assessed from a broader systems perspective. Micro-simulation packages that can model pedestrians (e.g. VISSIM) can be employed to assess these interactions. This paper outlines a procedure for the potential implementation of pedestrian flow analysis in a rail transit station using micro-simulation. Base model data requirements are identified which include static (facility layout and locations of temporary equipment) and dynamic data (pedestrian demand and public transport services). Possible model calibration criteria were also identified. A VISSIM® micro-simulation base model was developed for the North Melbourne Rail Station for investigating proposed station operational and infrastructure changes. This case study provided a good example for the potential implementation of micro-simulation models in the analysis of pedestrian circulation. Keywords: Pedestrian circulation, micro-simulation, rail transit stations 1. INTRODUCTION
Micro-simulation traffic models (MSTMs) have in recent years become a widely accepted tool to analyse and identify solutions for traffic and transport planning. Micro-simulation has evolved from the crude 2-D analysis and simulation tool to functions that range from 3-D visualisation to emulation of actual traffic signal control systems. Use of MSTMs is potentially recommended for complex traffic operation schemes, significant conflicts among different road users, major road work on traffic movements, operation of dynamic control systems, large scale traffic studies, and public transport operations (Austroads 2006). Guidelines on the limitations and usage of MSTMs as an analysis tool for the vehicle-driven traffic are also well established (FHWA 2004; Austroads 2006; FaberMaunsell 2007).
In developed countries where car ownership is high, policy makers are promoting public transport as a sustainable transportation system management measure and as a means to curtail increasing road congestion. This is especially true in central business districts (CBDs) of major cities and other concentrated employment centres where work trips cause the urban transportation system to congest. For this policy to be successful, a high capacity, reliable and comparable level of comfort alternative to car travel should be provided. Rail transit with its high passenger capacity and high efficiency offers the potential in reducing overall traffic congestion in the urban network. With this mode shift, additional ridership is introduced on the rail network and its corresponding facilities.
Traditional design and evaluation procedures for pedestrian transit facilities are aimed at maintaining a desirable pedestrian level-of-service (PLOS) for the individual pedestrian areas or sub-precincts. These sub-precincts include entrances/exits, ticketing areas, fare arrays, stairs/ramps/lifts, waiting areas, platforms, etc. In complex transit facilities, these sub-precincts interact with one another that pedestrian circulation might be better assessed from a broader systems perspective. Micro-simulation packages that can model pedestrians (e.g. VISSIM®, SimWalk®, Legion®, NoMad®) can be employed to assess these interactions.
This paper is outlined as follows. Section 2 discusses some basic static and dynamic characteristics differences between vehicle and pedestrian traffic. Section 3 recalls the conventional method for analysis of pedestrian in a rail transit stations. Section 4 and 5 outlines the state-of-practice in pedestrian circulation modelling and simulation and general requirements for rail transit station simulation, respectively. The VISSIM pedestrian simulation model is described in section 6. Section 7 presents a case study of pedestrian micro-simulation featuring the North Melbourne station. Section 8 summarizes the conclusions and discusses future research directions.
2. VEHICLE VERSUS PEDESTRIAN CHARACTERISTICS
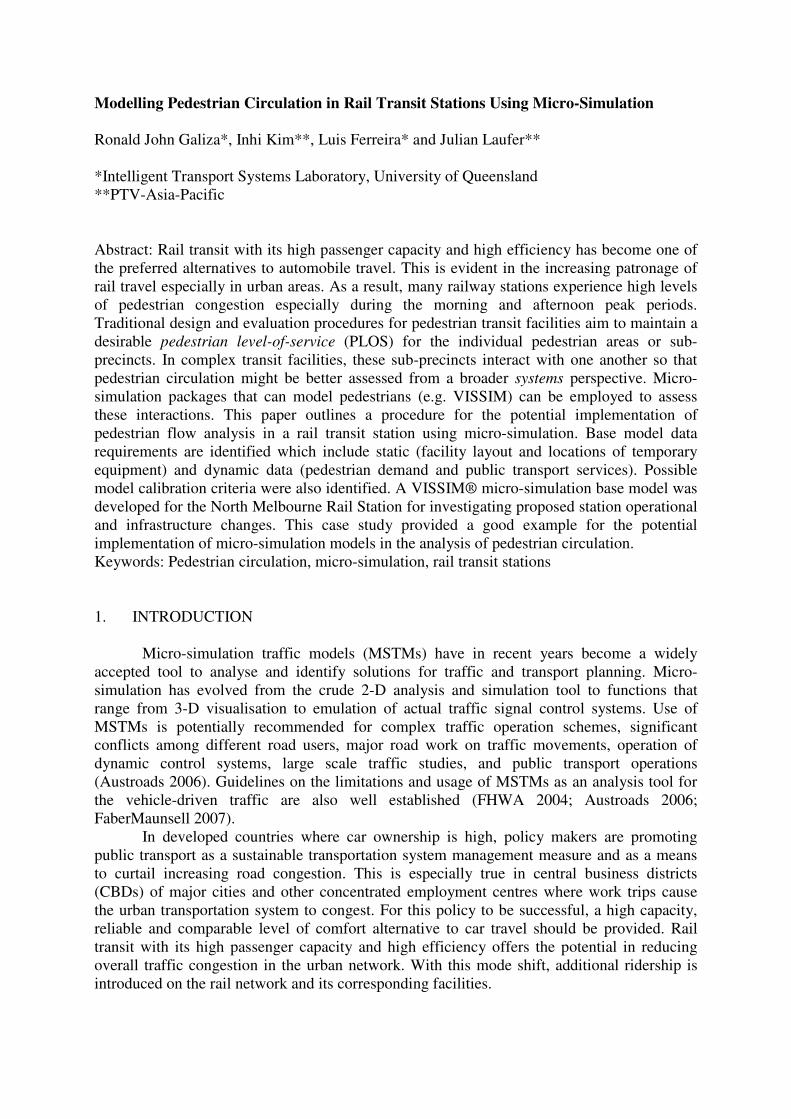
Before any comparison is made between micro-simulation of vehicle traffic and pedestrian traffic, a clear understanding of the physical and dynamic characteristics between the two should be presented. Micro-simulation of pedestrian traffic is not simply adopting the micro-simulation methodology for vehicle traffic for use. Vehicles and pedestrians have different physical and operational limitations in traffic. 2.1. Static Characteristics Body depth and shoulder width are the primary human measurements used by designers of pedestrian spaces and facilities, where shoulder breadth is the factor affecting practical capacity. The plan view of an average adult male human body occupies an area of about 0.14m2 but the design envelope adopted is an ellipse 460mm by 610mm, of area 0.21m2 (see Figure 1). This space is used to determine practical standing capacity, allowing for the fact that many pedestrians carry personal articles, natural psychological preferences to avoid bodily contact with others and body sway (Austroads 1995). As for vehicles, they come in many different sizes depending on the number of axles. The dimension for design passenger cars normally measure 1.9m by 5.0m (Australian Standard for Parking Facilities, AS 2890.1) but this does not account for some safe lateral distance between vehicles.
Figure 1. Body Ellipse (Austroads 1995)
2.2. Dynamic Characteristics
Vehicles are constrained to the roadway and are governed by car-following and lane changing characteristic whilst pedestrians can basically move laterally in any direction subject to their physical capabilities. Pedestrians are able to decelerate at a very high rate, implying that they can stop almost at once. This holds equally for their acceleration. On the contrary, car-drivers are restricted by the possibilities of their vehicles and the discomfort due to high deceleration and acceleration. While cars are bound to lanes, they usually have interactions with few vehicles at one moment, most of the time driving in the same direction as the car driver. Only at specific occasions, for instance a lane-change, car-drivers will take traffic other than the vehicles in front of them into account. On the contrary, pedestrians can expect interactions from all directions at all times (Daamen, Bovy et al. 2002). Also, pedestrians easily reverse their direction of travel and exit a system where they enter. Vehicles cannot reverse their directions on the same lane and exit in the same way they came in.
Pedestrians may be considered as being similar to vehicles when pedestrians are constrained to a footpath, stairs, travelators, road lane or corridor. In this situation, network capacity can be defined, demand measured or predicted, operational levels calculated, and areas of congestion and hazard identified (Austroads 1995).
3. CONVENTIONAL PEDESTRIAN ANALYSIS IN RAIL TRANSIT STATIONS
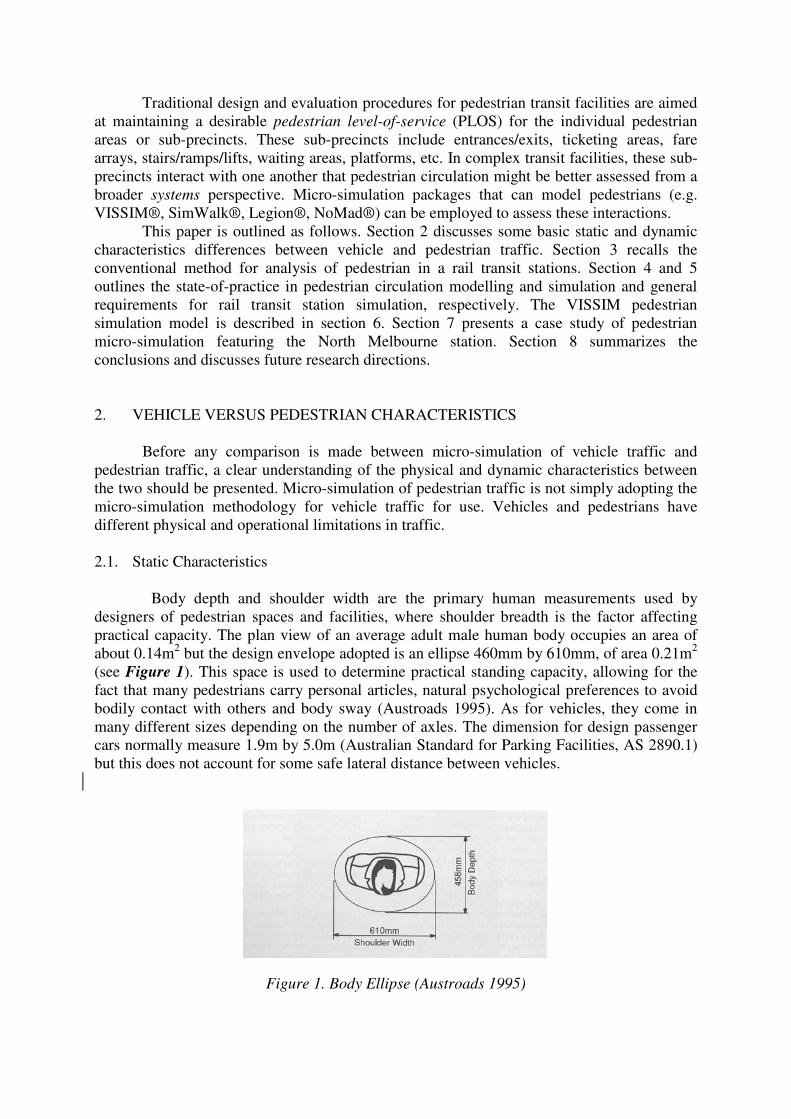
A model for station capacity analysis is shown in Figure 2 which lists key station activities and their relationships. It consists of a series of passenger flows, from the station access at the street through entrances, stairs, and escalators to the mezzanine and then platform level, where this capacity interacts with the line capacity that trains provide. At transfer stations, a special analysis must be made for passenger volumes transferring between the lines, whether at different levels or across the platform (Vuchic 2005). The time required to complete each activity is a function of fare structures, fare collection policies, station layout, equipment design, operating policies and system capacity.
The first step in evaluating a transit station design is to outline the pedestrian system requirements. Determining passenger circulation and queuing requirements begins with a detailed understanding of the pedestrian flow process through a station in the form of a flowchart similar to Figure 2. Conventional pedestrian circulation analysis in a rail station employs the use of spreadsheets models. The station is subdivided into discrete circulation zones including areas of the concourse and platform levels and each of the vertical circulation elements (VCEs). Extensive spreadsheets are used to assign peak-period pedestrians moving between distinct origin and destination points within the station to routes that either pass through or stay within each zone within the station (Kittelson and Associates 2003). The result of this procedure is a level-of-service (LOS) of the different circulation zones based on Fruin’s LOS tables (1971) which are then used to evaluate station system performance.
4. PEDESTRIAN MODELLING AND SIMULATION
In recent years, there has been a growing interest in understanding traveller behaviour, especially that of pedestrians. Pedestrians form the largest single road-user group. Most individual trips whatever the primary mode used, begin and/or finish with a walk section, so that walking is a fundamental component of all travel. Only recently, when more advanced observation techniques became available, computers became faster and could handle larger
and more complicated models, the number of available pedestrian models as well as their application scope and accuracy increased significantly (Daamen 2004).
Figure 2. Analysis of station capacity – passenger throughput (Vuchic 2005)
4.1. Pedestrian Modelling
Although pedestrian traffic has been empirically studied for the past 40 years, most of the transportation-related researches still focused on vehicle traffic. Pedestrian flow studies were scarce. With the construction of pedestrian-dominated facilities (in mass rail transit systems) such as elevated or underground walkways, stairs and escalators etc., there is an apparent deficiency of pedestrian flow researches for planning and design of those facilities. Probably the earliest systematic approach to the comfort and safety of pedestrian facilities was the LOS concept of Fruin (1971). Recent empirical studies of pedestrian flows addressed the following: (1) the evacuation of football stadium (Klupfel 2003) and classrooms (Helbing, Buzna et al. 2005); (2) the investigation of pedestrian walking behaviour using discrete choice analysis (Antonini 2005); (3) the study of pedestrian movement characteristics at signalized intersections (Bennett, Felton et al. 2001); (4) modelling pedestrian flows in public transport facilities (Daamen 2004); and (5) the simulation of pedestrian traffic with a focus on evacuation processes (Kretz 2007).
Despite more researches on pedestrians, there are still gaps in quantitative experimental studies. Slowly, experimental studies has improved significantly through the availability of advanced video technology and development of image processing software (Teknomo 2002; Antonini 2005) and infrared detectors (Krotosky and Trivedi 2008). This has paved the way for increase interest in pedestrian research in pedestrian facilities. A clear understanding of pedestrian behaviour in these facilities is essential in the proper design and analysis of these facilities.
Passenger Origins
Entrances • Walk • Bike • Bus • Taxi
Stairs Escalators Elevators (VCEs)
Fare Collection
Stairs Escalators Elevators (VCEs)
Platforms • Capacity • Facilities • Info
Trains • Frequency • Capacity • Boarding/
Alighting
Passenger Destination
Exits • Walk • Bike • Bus • Taxi
Stairs Escalators Elevators (VCEs)
Fare Exit, Additional Fares
Stairs Escalators Elevators (VCEs)
Platforms • Capacity • Info
S T A T I O N
Alighting
Boarding
Area Coverage, Access
Street Level
I Flight Mezzanine II Flight Platform Level
Interline Transfers
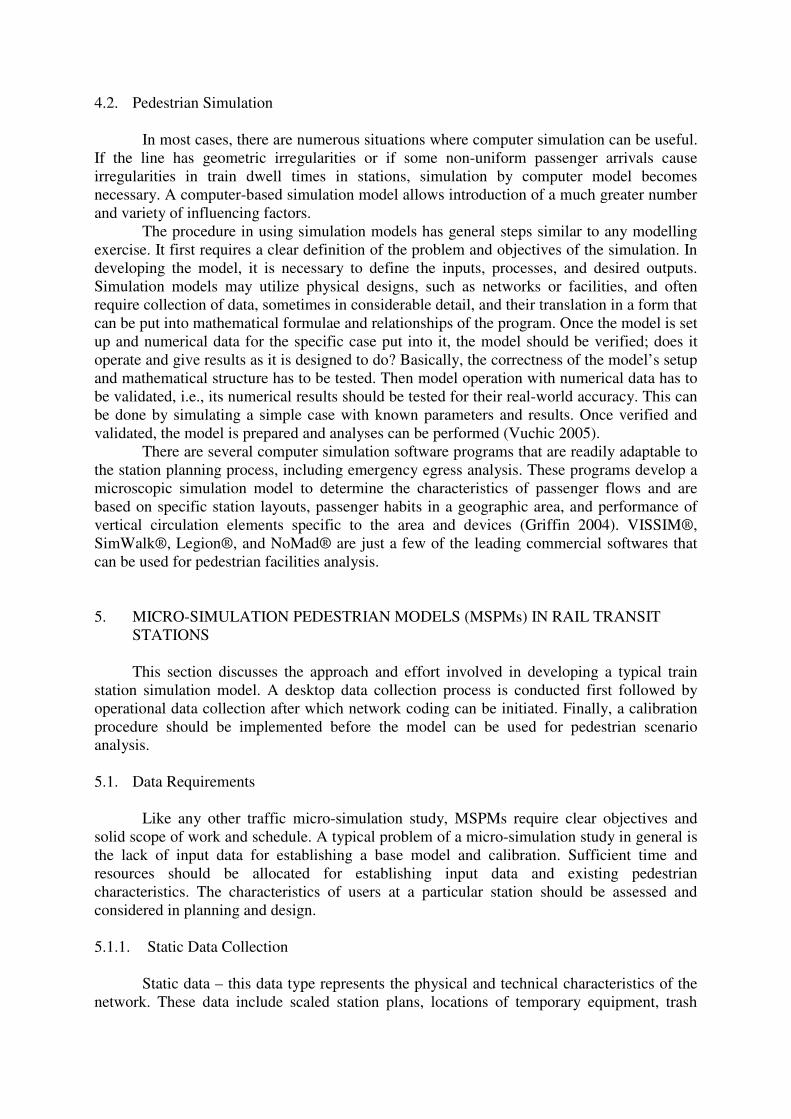
4.2. Pedestrian Simulation In most cases, there are numerous situations where computer simulation can be useful.
If the line has geometric irregularities or if some non-uniform passenger arrivals cause irregularities in train dwell times in stations, simulation by computer model becomes necessary. A computer-based simulation model allows introduction of a much greater number and variety of influencing factors.
The procedure in using simulation models has general steps similar to any modelling exercise. It first requires a clear definition of the problem and objectives of the simulation. In developing the model, it is necessary to define the inputs, processes, and desired outputs. Simulation models may utilize physical designs, such as networks or facilities, and often require collection of data, sometimes in considerable detail, and their translation in a form that can be put into mathematical formulae and relationships of the program. Once the model is set up and numerical data for the specific case put into it, the model should be verified; does it operate and give results as it is designed to do? Basically, the correctness of the model’s setup and mathematical structure has to be tested. Then model operation with numerical data has to be validated, i.e., its numerical results should be tested for their real-world accuracy. This can be done by simulating a simple case with known parameters and results. Once verified and validated, the model is prepared and analyses can be performed (Vuchic 2005).
There are several computer simulation software programs that are readily adaptable to the station planning process, including emergency egress analysis. These programs develop a microscopic simulation model to determine the characteristics of passenger flows and are based on specific station layouts, passenger habits in a geographic area, and performance of vertical circulation elements specific to the area and devices (Griffin 2004). VISSIM®, SimWalk®, Legion®, and NoMad® are just a few of the leading commercial softwares that can be used for pedestrian facilities analysis.
5. MICRO-SIMULATION PEDESTRIAN MODELS (MSPMs) IN RAIL TRANSIT
STATIONS
This section discusses the approach and effort involved in developing a typical train station simulation model. A desktop data collection process is conducted first followed by operational data collection after which network coding can be initiated. Finally, a calibration procedure should be implemented before the model can be used for pedestrian scenario analysis.
5.1. Data Requirements
Like any other traffic micro-simulation study, MSPMs require clear objectives and
solid scope of work and schedule. A typical problem of a micro-simulation study in general is the lack of input data for establishing a base model and calibration. Sufficient time and resources should be allocated for establishing input data and existing pedestrian characteristics. The characteristics of users at a particular station should be assessed and considered in planning and design.
5.1.1. Static Data Collection
Static data – this data type represents the physical and technical characteristics of the
network. These data include scaled station plans, locations of temporary equipment, trash
bins, obstructions, and ticket vending machines. These data can be derived from paper maps or CAD drawings and actual station layout plans. These data are then used to define the MSPM network characteristics such as entrance, walkway, and stairways widths, fare array geometry, locations of lifts, and platform geometry.
5.1.2. Operational Data Collection
Dynamic data – this data type refers to traffic demands on the network, represented by train arrivals, pedestrian volumes and characteristics. Train arrivals and pedestrian volumes data can be obtained from the concerned transit agency operating the service. As for pedestrian characteristics, a separate video survey should be conducted to establish local pedestrian characteristics. These can either be station-specific or general for all stations. Pedestrian characteristics are greatly influenced by trip purpose - thus station location plays an important role in the type of pedestrian behaviour in question.
5.2. Network Coding
Typically, pedestrian micro-simulation software includes a network editing module
wherein images can be loaded as a background to serve as a guide in drawing the station geometry. This process makes the network-coding easier compared to traditional coding procedures. To create a base model, there are three basic steps in the editing process:
1) The population needs to be defined and pedestrians grouped into types, classes and compositions. Their properties, such as walking speed, model parameters, colour, and 3D models are to be configured.
2) Geometry using walking areas, obstacles, ramps, stairways, escalators, traffic lights and levels is to be specified. Some software supports a number of image formats (among them jpg and dxf), which can be loaded as background images to assist in creating the geometry.
3) The inputs and routes of pedestrians are added to the geometry.
5.3. Calibration Process and Criteria Measurements such as density, speed, flow, travel time and lost time can be included
in the simulation at arbitrary positions. For each measurement, raw data can be measured and aggregation time intervals can be defined freely. Initially, for the case study that follows, the modelling criteria used were percent difference of pedestrian volumes on the platforms. A 10 percent deviation from the observed platform pedestrian flow volumes and a 5 percent sum of all pedestrian flows in the network seems a reasonable accuracy. Alternatively, a GEH1 statistics of <5 for individual platform pedestrian volumes (>85% of cases) and GEH <4 (FHWA 2004) for the sum of all pedestrian volumes can be adopted for lack of any guideline for pedestrian simulation.
6. VISSIM® PEDESTRIAN SIMULATION
VISSIM® is a microscopic simulation tool meaning that all vehicles and pedestrians
are simulated individually. The behaviour of pedestrians can be defined individually, in the same way as before with vehicles. With available pedestrian speed distribution, the modeller can allocate to each pedestrian their own individual maximum walking/running speed. A new component of the VISSIM micro-simulation software allows for evaluation and assessment of
complex operational pedestrian and passenger movements within the design of transportation systems.
The VISSIM® pedestrian micro-simulation software introduces an area based modelling system including representation of multiple levels within a single model. This approach allows for an enhanced capability in modelling those locations that pedestrians consider for route choice. Rather than determining route choice through a series of small tile-based sections, VISSIM® pedestrian micro-simulation allows for dynamic route choice within a study location – that is each individual passenger will determine their route over both a large section of travel and a shorter section of travel. Passengers are free to determine which paths best apply for their needs. In this way, passengers can travel over varied sections of larger scale areas (e.g. station ticket halls, concourses, platforms etc.) without the need for the modellers to explicitly designate such considerations. Users have the flexibility to identify origins, destination and intermediate destination (e.g. ticket machines, information counters etc). The combination of these points is used to assist individual objects (passengers) through a complex network (Laufer 2008). 7. CASE STUDY: NORTH MELBOURNE STATION
This case study is presented as an exercise about building a pedestrian simulation
model for analysing pedestrian facilities and also to show matching of current circumstances, as “proof of concept” before scenario testing is implemented. This new paradigm opens a myriad of possible applications in pedestrian analysis.
The Victoria Department of Transport commissioned PTV Asia-Pacific to undertake the modeling of passenger movements at one of the largest and more complex rail stations within the Melbourne metropolitan region. North Melbourne station is to undergo an upgrade of facilities to better manage the significant interchange of passengers between regional and metropolitan rail systems. Key findings lessons learned in the modelling exercise are presented next.
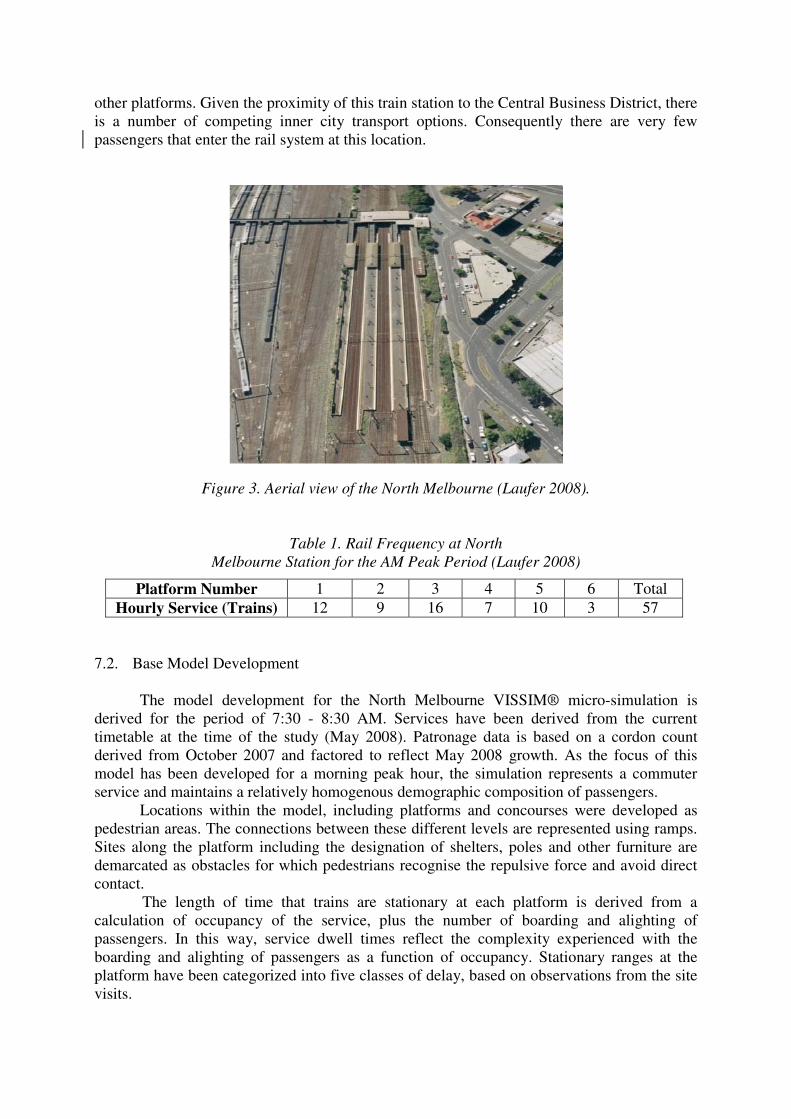
The North Melbourne Station provided an interesting case study for the simulation of pedestrian movements within the VISSIM® micro-simulation model. The station is located to the immediate north of the Melbourne Central Business District and contains six platforms. As identified in Figure 3, there are four ramps at the northern end of the station connecting the platforms to the concourse. Platforms No. 1 and No. 6 each contain a separate ramp for access. The remaining two ramps are shared between the centre four platforms. There are road transport connections to the east of the station. Three platforms are utilized for train services in the “Down” (Northbound) direction with a further three platforms for the services travelling in the “Up” (Southbound) direction. The station is also within close proximity to Melbourne University and the “hospitals precinct” at north Melbourne. 7.1. Data Input
The frequency of rail services during the peak period is listed in Table 1. This table
identifies that a total of 57 services stopped at North Melbourne station in the peak period. A total of twelve services access Platform 1 and sixteen services access Platform 3. There are a total of 38 services traveling in the “Up” direction with the remaining nineteen rail services moving in the “Down” direction. In the morning peak hour, the North Melbourne station currently receives approximately 3,000 persons alighting from rail services. Approximately 40% of these passengers exit the station. The remaining 60% of passengers transfer within the station to
other platforms. Given the proximity of this train station to the Central Business District, there is a number of competing inner city transport options. Consequently there are very few passengers that enter the rail system at this location.
Figure 3. Aerial view of the North Melbourne (Laufer 2008).
Table 1. Rail Frequency at North Melbourne Station for the AM Peak Period (Laufer 2008)
Platform Number 1 2 3 4 5 6 Total Hourly Service (Trains) 12 9 16 7 10 3 57
7.2. Base Model Development
The model development for the North Melbourne VISSIM® micro-simulation is derived for the period of 7:30 - 8:30 AM. Services have been derived from the current timetable at the time of the study (May 2008). Patronage data is based on a cordon count derived from October 2007 and factored to reflect May 2008 growth. As the focus of this model has been developed for a morning peak hour, the simulation represents a commuter service and maintains a relatively homogenous demographic composition of passengers.
Locations within the model, including platforms and concourses were developed as pedestrian areas. The connections between these different levels are represented using ramps. Sites along the platform including the designation of shelters, poles and other furniture are demarcated as obstacles for which pedestrians recognise the repulsive force and avoid direct contact.
The length of time that trains are stationary at each platform is derived from a calculation of occupancy of the service, plus the number of boarding and alighting of passengers. In this way, service dwell times reflect the complexity experienced with the boarding and alighting of passengers as a function of occupancy. Stationary ranges at the platform have been categorized into five classes of delay, based on observations from the site visits.
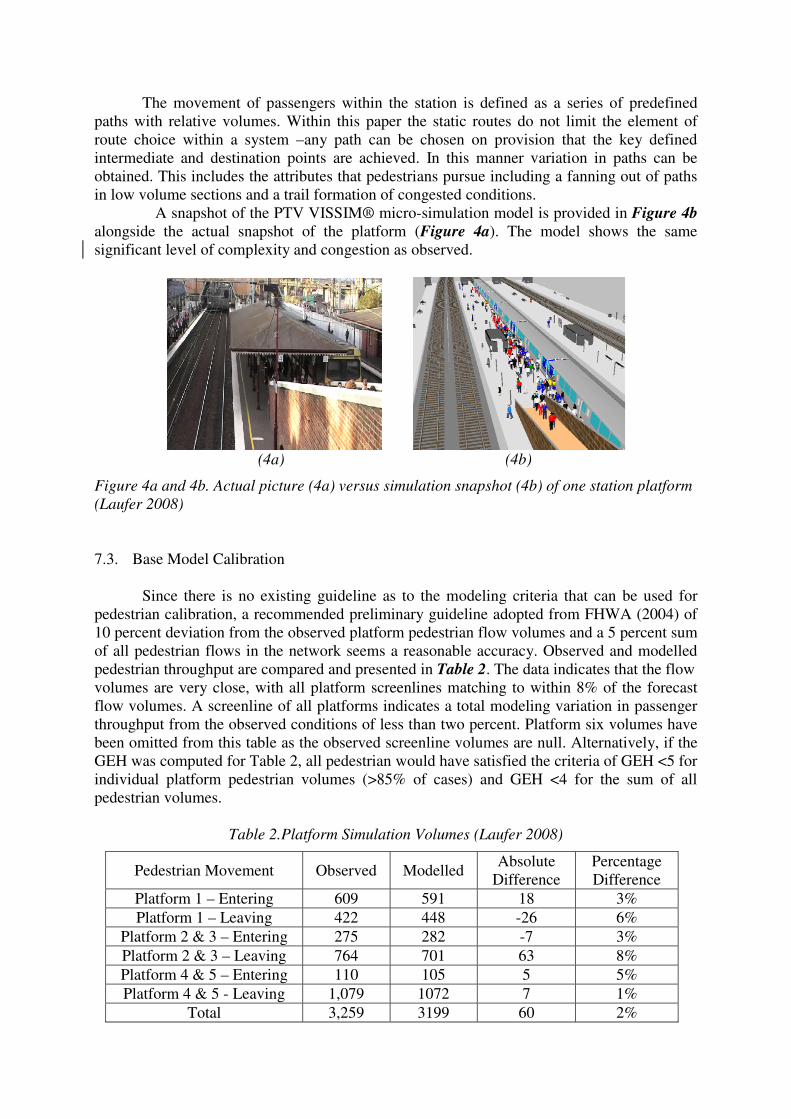
The movement of passengers within the station is defined as a series of predefined paths with relative volumes. Within this paper the static routes do not limit the element of route choice within a system –any path can be chosen on provision that the key defined intermediate and destination points are achieved. In this manner variation in paths can be obtained. This includes the attributes that pedestrians pursue including a fanning out of paths in low volume sections and a trail formation of congested conditions. A snapshot of the PTV VISSIM® micro-simulation model is provided in Figure 4b alongside the actual snapshot of the platform (Figure 4a). The model shows the same significant level of complexity and congestion as observed.
(4a) (4b)
Figure 4a and 4b. Actual picture (4a) versus simulation snapshot (4b) of one station platform (Laufer 2008) 7.3. Base Model Calibration
Since there is no existing guideline as to the modeling criteria that can be used for
pedestrian calibration, a recommended preliminary guideline adopted from FHWA (2004) of 10 percent deviation from the observed platform pedestrian flow volumes and a 5 percent sum of all pedestrian flows in the network seems a reasonable accuracy. Observed and modelled pedestrian throughput are compared and presented in Table 2. The data indicates that the flow volumes are very close, with all platform screenlines matching to within 8% of the forecast flow volumes. A screenline of all platforms indicates a total modeling variation in passenger throughput from the observed conditions of less than two percent. Platform six volumes have been omitted from this table as the observed screenline volumes are null. Alternatively, if the GEH was computed for Table 2, all pedestrian would have satisfied the criteria of GEH <5 for individual platform pedestrian volumes (>85% of cases) and GEH <4 for the sum of all pedestrian volumes.
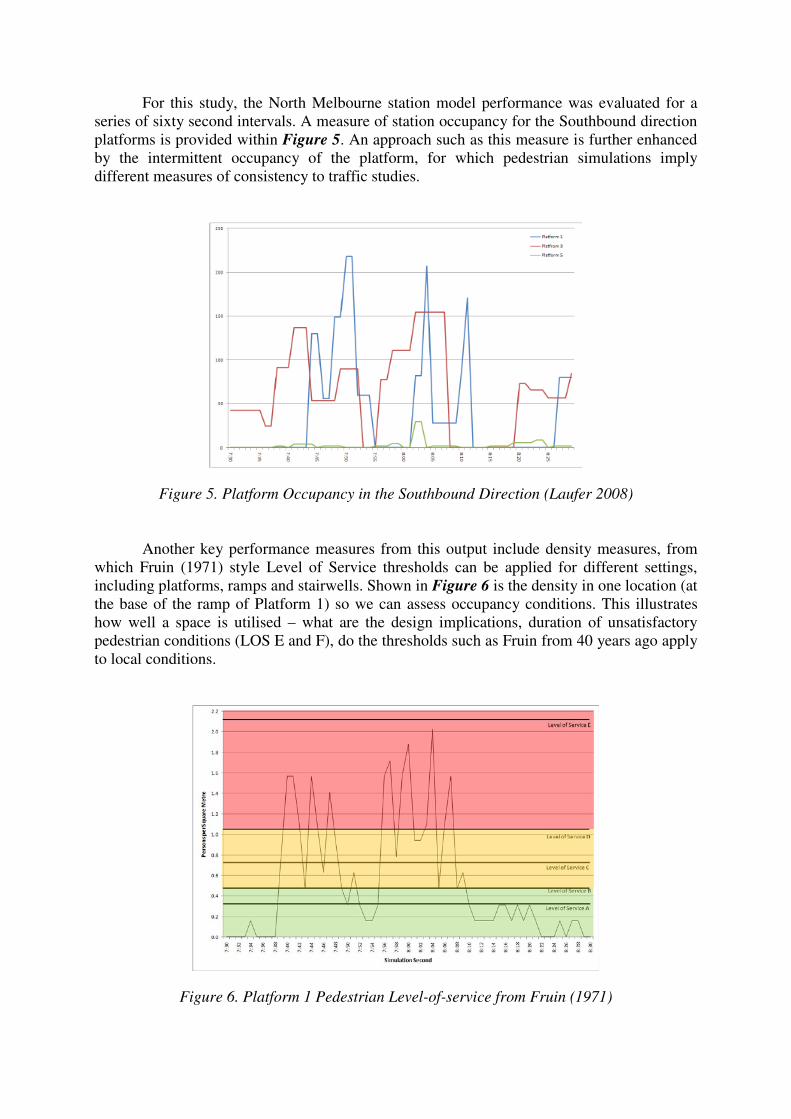
For this study, the North Melbourne station model performance was evaluated for a series of sixty second intervals. A measure of station occupancy for the Southbound direction platforms is provided within Figure 5. An approach such as this measure is further enhanced by the intermittent occupancy of the platform, for which pedestrian simulations imply different measures of consistency to traffic studies.
Figure 5. Platform Occupancy in the Southbound Direction (Laufer 2008)
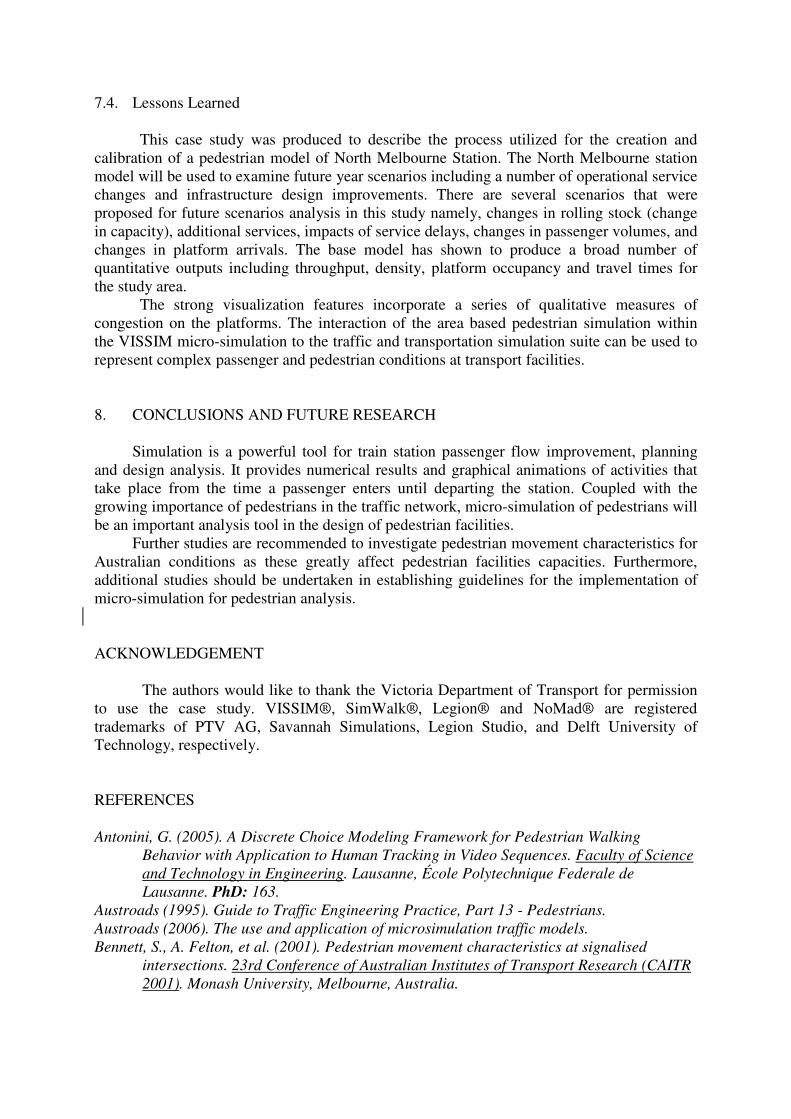
Another key performance measures from this output include density measures, from which Fruin (1971) style Level of Service thresholds can be applied for different settings, including platforms, ramps and stairwells. Shown in Figure 6 is the density in one location (at the base of the ramp of Platform 1) so we can assess occupancy conditions. This illustrates how well a space is utilised – what are the design implications, duration of unsatisfactory pedestrian conditions (LOS E and F), do the thresholds such as Fruin from 40 years ago apply to local conditions.
Figure 6. Platform 1 Pedestrian Level-of-service from Fruin (1971)
7.4. Lessons Learned
This case study was produced to describe the process utilized for the creation and calibration of a pedestrian model of North Melbourne Station. The North Melbourne station model will be used to examine future year scenarios including a number of operational service changes and infrastructure design improvements. There are several scenarios that were proposed for future scenarios analysis in this study namely, changes in rolling stock (change in capacity), additional services, impacts of service delays, changes in passenger volumes, and changes in platform arrivals. The base model has shown to produce a broad number of quantitative outputs including throughput, density, platform occupancy and travel times for the study area.
The strong visualization features incorporate a series of qualitative measures of congestion on the platforms. The interaction of the area based pedestrian simulation within the VISSIM micro-simulation to the traffic and transportation simulation suite can be used to represent complex passenger and pedestrian conditions at transport facilities. 8. CONCLUSIONS AND FUTURE RESEARCH
Simulation is a powerful tool for train station passenger flow improvement, planning and design analysis. It provides numerical results and graphical animations of activities that take place from the time a passenger enters until departing the station. Coupled with the growing importance of pedestrians in the traffic network, micro-simulation of pedestrians will be an important analysis tool in the design of pedestrian facilities.
Further studies are recommended to investigate pedestrian movement characteristics for Australian conditions as these greatly affect pedestrian facilities capacities. Furthermore, additional studies should be undertaken in establishing guidelines for the implementation of micro-simulation for pedestrian analysis. ACKNOWLEDGEMENT
The authors would like to thank the Victoria Department of Transport for permission to use the case study. VISSIM®, SimWalk®, Legion® and NoMad® are registered trademarks of PTV AG, Savannah Simulations, Legion Studio, and Delft University of Technology, respectively. REFERENCES
Antonini, G. (2005). A Discrete Choice Modeling Framework for Pedestrian Walking
Behavior with Application to Human Tracking in Video Sequences. Faculty of Science and Technology in Engineering. Lausanne, École Polytechnique Federale de Lausanne. PhD: 163.
Austroads (1995). Guide to Traffic Engineering Practice, Part 13 - Pedestrians. Austroads (2006). The use and application of microsimulation traffic models. Bennett, S., A. Felton, et al. (2001). Pedestrian movement characteristics at signalised
intersections. 23rd Conference of Australian Institutes of Transport Research (CAITR 2001). Monash University, Melbourne, Australia.
Daamen, W. (2004). Modelling Passenger Flows in Public Transport Facilities. Faculty of Civil Engineering and Geosciences. Delft, Delft University of Technology. PhD: 403.
Daamen, W., P. H. L. Bovy, et al., Eds. (2002). Modelling pedestrians in transfer stations. Pedestrian and Evacuation Dynamics.
FaberMaunsell (2007). Guidelines for the Use of Microsimulation Software. D. o. Transport-UK.
Fruin, J. J. (1971). "Designing for pedestrians. A level- of- service concept." Highw Res Rec(35): 1-15.
Griffin, K. W. (2004). Building Type Basics for Transit Facilities. New Jersey, John Wiley & Sons.
Helbing, D., L. Buzna, et al. (2005). "Self-Organized Pedestrian Crowd Dynamics: Experiments, Simulations, and Design Solutions." Transportation Science 39(1): 1-24.
Kittelson and Associates (2003). Transit Capacity and Quality of Service Manual - TCRP Report 100 2nd Ed. TRB. Washington, DC.
Klupfel, H. L. (2003). A Cellular Automaton Model for Crowd Movement and Egress Simulation. Faculty of Natural Sciences. Essen, University of Duisburg. PhD: 160.
Kretz, T. (2007). Pedestrian Traffic: Simulation and Experiments. Faculty of Physics. Essen, University of Duisburg. PhD: 245.
Krotosky, S. J. and M. M. Trivedi (2008). "Person surveillance using visual and infrared imagery." Ieee Transactions on Circuits and Systems for Video Technology 18(8): 1096-1105.
Laufer, J. (2008). Passenger and Pedestrian Modelling at Transport Facilities. 2008 Annual AIPTM Conference. Perth, Australia.
Teknomo, K. (2002). Microscopic Pedestrian Flow Characteristics: Development of an Image Processing Data Collection and Simulation Model. Department of Human Social Information Sciences. Tohoku, Tohoku University. PhD: 141.
Vuchic, V. R. (2005). Urban Transit - Operations, Planning and Economics. New Jersey, John Wiley & Sons.
1 GEH statistics is defined as
( )
OM
OMGEH
+
−=
22
where M is the model estimated volume and O is the observed volume.