agriculture Article Modelling the Impacts of Climate Change on Soybeans Water Use and Yields in Ogun-Ona River Basin, Nigeria Oludare Sunday Durodola 1,2 and Khaldoon A. Mourad 3, * 1 Pan African University Institute of Water and Energy Sciences, Abou Bekr Belkaid University of Tlemcen B.P. 119, Tlemcen 13000, Algeria; [email protected] or [email protected]2 Land and Water Division, Food and Agriculture Organization of the United Nations, 00153 Rome, Italy 3 The Centre for Sustainable Visions and Lund University, 201, SE-22100 Lund, Sweden * Correspondence: [email protected]Received: 22 October 2020; Accepted: 30 November 2020; Published: 1 December 2020 Abstract: African countries such as Nigeria are anticipated to be more susceptible to the impacts of climate change due to reliance on rainfed agriculture. In this regard, the impacts of climate change on crop water requirements (CWR), yields and crop water productivity (CWP) of soybean in the Ogun-Ona River Basin, Nigeria, were evaluated for the baseline period (1986–2015) and future period (2021–2099) under Representative Concentration Pathway (RCP) 4.5 and 8.5 scenarios using AquaCrop Version 6.1. Future climate projections from the Swedish Meteorological and Hydrological Institute’s climate models (HadGEM2-ES and RCA4) were used in simulating the future scenarios. The results show that for the baseline period, CWR and yield are increasing while CWP shows a slight increase. For the future period, the CWR is projected to fluctuate and depend on the rainfall pattern. Meanwhile, carbon dioxide fertilization has positive effects on yield and is projected to increase up to 40% under RCP 8.5. The results of this study certainly offer useful information on suitable adaption measures which could be implemented by stakeholders and policymakers to improve soybean productivity in Nigeria. Keywords: crop water requirements; AquaCrop; crop water productivity; carbon dioxide fertilization; Ogun-Ona River Basin; Nigeria 1. Introduction Africa is projected to be more vulnerable to climate change impacts due to reliance on natural resources, the high level of climate variability, the vast rainfed agriculture, and the low institutional and economic capacity to manage and adapt to climate change [1–3]. The connection between agriculture and climate change is interwoven. It is predicted that agriculture will be greatly affected by climate change and agriculture will contribute to climate change. According to Food and Agriculture Organization (FAO), a 60% increase above the 2006 global food demand levels is expected by 2050 as a result of rapid population growth, increase in urbanization, as well as income growth [4]. Water use for agriculture amounts to about 70% of all water withdrawals from rivers, lakes, streams and aquifers [5]. However, water resources, which are the basis for food production are finite and currently under serious pressure. Despite this pressure, water resources need to meet up with current and future demands for agricultural, domestic and industrial uses. The main biophysical processes involved in agricultural crop production such as evaporation from soils, transpiration from plants, nutrient cycles and growth of plants are altered by climate change [6]. Thus, the climate is a vital factor in crop production and could directly influence crop Agriculture 2020, 10, 593; doi:10.3390/agriculture10120593 www.mdpi.com/journal/agriculture
Transcript
agriculture
Article
Modelling the Impacts of Climate Change onSoybeans Water Use and Yields in Ogun-Ona RiverBasin, Nigeria
Oludare Sunday Durodola 1,2 and Khaldoon A. Mourad 3,*1 Pan African University Institute of Water and Energy Sciences, Abou Bekr Belkaid University of Tlemcen
B.P. 119, Tlemcen 13000, Algeria; [email protected] or [email protected] Land and Water Division, Food and Agriculture Organization of the United Nations, 00153 Rome, Italy3 The Centre for Sustainable Visions and Lund University, 201, SE-22100 Lund, Sweden* Correspondence: [email protected]
Received: 22 October 2020; Accepted: 30 November 2020; Published: 1 December 2020�����������������
Abstract: African countries such as Nigeria are anticipated to be more susceptible to the impactsof climate change due to reliance on rainfed agriculture. In this regard, the impacts of climatechange on crop water requirements (CWR), yields and crop water productivity (CWP) of soybean inthe Ogun-Ona River Basin, Nigeria, were evaluated for the baseline period (1986–2015) and futureperiod (2021–2099) under Representative Concentration Pathway (RCP) 4.5 and 8.5 scenarios usingAquaCrop Version 6.1. Future climate projections from the Swedish Meteorological and HydrologicalInstitute’s climate models (HadGEM2-ES and RCA4) were used in simulating the future scenarios.The results show that for the baseline period, CWR and yield are increasing while CWP shows a slightincrease. For the future period, the CWR is projected to fluctuate and depend on the rainfall pattern.Meanwhile, carbon dioxide fertilization has positive effects on yield and is projected to increaseup to 40% under RCP 8.5. The results of this study certainly offer useful information on suitableadaption measures which could be implemented by stakeholders and policymakers to improvesoybean productivity in Nigeria.
Keywords: crop water requirements; AquaCrop; crop water productivity; carbon dioxide fertilization;Ogun-Ona River Basin; Nigeria
1. Introduction
Africa is projected to be more vulnerable to climate change impacts due to reliance on naturalresources, the high level of climate variability, the vast rainfed agriculture, and the low institutionaland economic capacity to manage and adapt to climate change [1–3]. The connection betweenagriculture and climate change is interwoven. It is predicted that agriculture will be greatly affected byclimate change and agriculture will contribute to climate change. According to Food and AgricultureOrganization (FAO), a 60% increase above the 2006 global food demand levels is expected by 2050 as aresult of rapid population growth, increase in urbanization, as well as income growth [4]. Water use foragriculture amounts to about 70% of all water withdrawals from rivers, lakes, streams and aquifers [5].However, water resources, which are the basis for food production are finite and currently underserious pressure. Despite this pressure, water resources need to meet up with current and futuredemands for agricultural, domestic and industrial uses.
The main biophysical processes involved in agricultural crop production such as evaporationfrom soils, transpiration from plants, nutrient cycles and growth of plants are altered by climatechange [6]. Thus, the climate is a vital factor in crop production and could directly influence crop
productivity. Studies have shown that climate change will affect water and crop productivity differentlydepending on location, crops and climatic zone [6–13]. While some crops will benefit, other cropswill be affected negatively [7]. Some crops will perform optimally with hotter temperatures andlong growing seasons [5]. However, studies have shown that the negative effects might exceed thepositive effects across different locations [8–13]. The interaction among water, food and climate changeshows that it is important to examine the impacts of climate change on water and crop productivity.Meanwhile, one of the means of examining these impacts is through the use of crop models coupledwith future climate projections. Recently, crop modelling and crop model applications have gainedmore interest in examining the impacts of climate change on water and crop productivity. Due to thethreats of climate change on agricultural water use and other demanding uses, simulation modelshave been found to be significant tools in evaluating the water needs of crops [9–15]. These models aredeveloped to estimate crop growth, development, yield, water use efficiency, water consumption andirrigation schedules under different climatic conditions, soil textures, field management, conservationpractices and soil fertility.
Several studies in Nigeria have shown that the increase in temperature will affect water and cropproductivity [9,16–20]. The predicted changes in temperature, consecutive dry and wet days willlikely have huge impacts on water and crop productivity in Ogun-Ona River Basin and Nigeria atlarge. Crop development, water requirements and growth are highly dependent on the number ofconsecutive dry and wet days. Most agricultural production in Nigeria depends on rainfall. Therefore,significant changes in rainfall patterns, the number of consecutive dry and wet days will greatlyimpact crop production and might lead to food insecurity if proper and urgent actions are not taken.Crop water requirement (CWR) is the total amount of water that crops need for growth throughout theseason [21–23]. In addition, there are uncertainties in future crop yield and crop water productivity(CWP). Yield is the harvestable quantity of crops [24] and CWP is the ratio of crop yield to the quantityof water consumed by the crop during a growing season [24]. Hence, it is important to examine theimpact of climate change on water and crop productivity due to the fact that the impacts of climatechange vary across locations and activities.
Soybean is one of the common staple foods grown in Nigeria. Soybean is a profitable crop that isgrown in all parts of Nigeria but predominant in the sub-humid and savannah agro-ecological zoneswhich cover the Ogun-Ona River Basin [9]. Nigeria and South Africa are the two leading Africancountries in the production of soybean and responsible for 29% and 40% of total African productionrespectively [25]. Soybean production is expected to rise due to population growth, an increase infood demand and a shift in food consumption. Currently, there is an increased demand for soybeanglobally and production is expected to double by 2050 compared to the rate of production in 2010.Soybean is a typical C3 plant. C3 plants are the type of plants that their first products of photosynthesisgive a 3-carbon compound i.e., phosphoglyceric acid (PGA). Other features of C3 plants are thatthe optimal temperature required for photosynthesis is really low, photorespiration rate is high,the plants perform more efficiently when the temperature decreases and CO2 fixation is really low inC3 plants [26]. Additionally, soybean is highly sensitive to changes in climate and soil properties [27].Also, Kumagai et al. [28] found that the plasticity of biomass and pod production at a low plantingdensity reveals suitable parameters to maximize soybean yield under elevated atmospheric carbondioxide (eCO2).
In Ogun-Ona River Basin, soybean is predominantly cultivated under rainfed agriculture whichmeans that irregularities in rainfall pattern and rise in temperature can cause water stress for cropsand significantly affect yields and water requirements. Soybean has been reported to be highlysensitive to climate change [25]. Just as other crops, there are a lot of uncertainties on the responsesof soybean to rise in temperature, changes in rainfall patterns and an increase in atmosphericCO2 concentration. However, there are some studies that have been carried out to predict thisphenomenon. A significant increase in soybean yield was projected in Cameroon when simulatedwith a process-based crop model (CropSyst) coupled with two global climate models (GCMs) under
Agriculture 2020, 10, 593 3 of 23
different climate change scenarios [29]. The growing season of soybean is also projected to shortenby 2 days to 23 days [29]. Similarly, studies have shown that due to carbon fertilization of C3 plantssuch as soybean, there are tendencies that crop yield might increase especially under extremely highatmospheric CO2 concentration [13]. In contrast to the projected yield increase by [13], soybean yieldis predicted to reduce when simulated based on global climate models [25]. Still, there are severaluncertainties regarding soybean water and crop productivity globally.
Since rainfed soybean production is predominant in Ogun-Ona River Basin, it is becomingincreasingly difficult to grow it as climate change impacts on agriculture intensifies. However,will soybean perform optimally under various climate change scenarios in Ogun-Ona River Basin?With the current growing water demands and the threats of climate change, how will soybean behaveunder a changing climate? What will be the future water requirements of this crop? Will soybean yieldsincrease or decrease? These uncertainties pose great challenges to crop productivity, irrigation andwater allocation for agriculture. In order to provide more clarity, it is imperative to conduct morestudies to examine how soybean will respond to various locations since the impact of climate change isspatially distributed. Therefore, this study seeks to:
(1) Estimate the seasonal CWR, yield and CWP of soybean during the baseline period (1986–2015)within the study area based on different soil textures.
(2) Simulate the future seasonal CWR, yield and CWP of soybean for various soil textures underdifferent climate change scenarios (2021–2099).
(3) Compare the future seasonal CWR, yield and CWP of soybean for various soil textures to thebaseline period under different climate change scenarios.
2. Materials and Methods
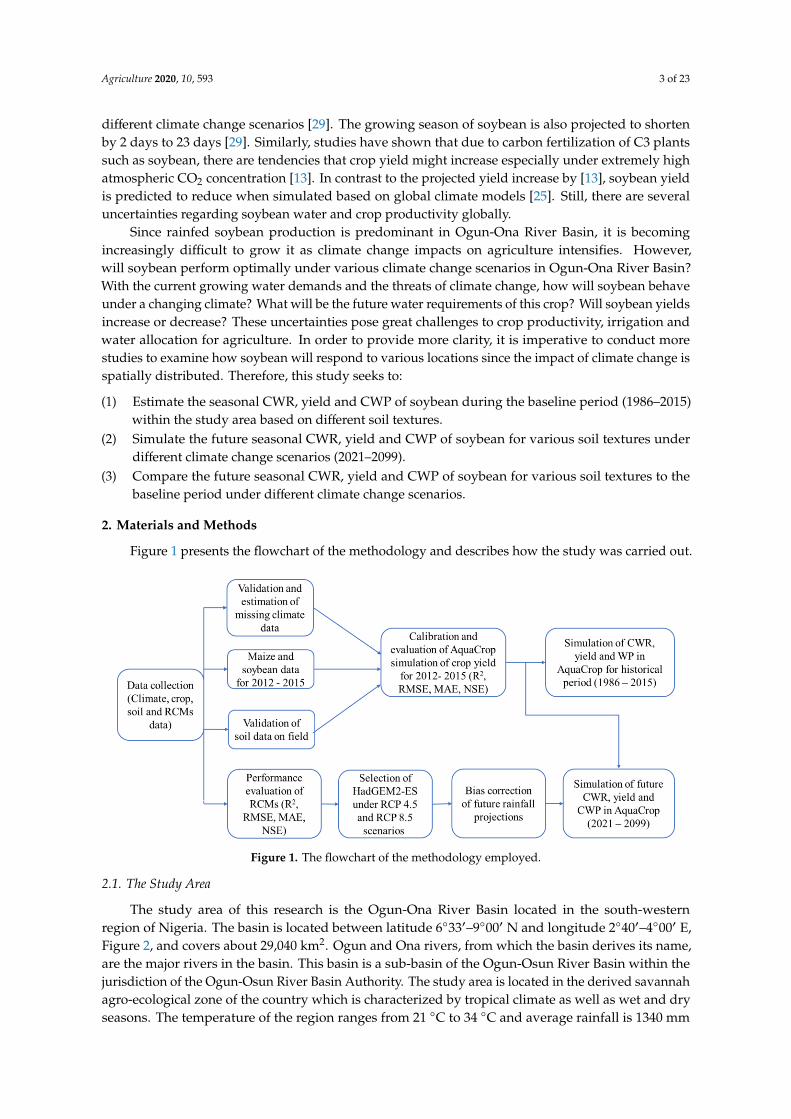
Figure 1 presents the flowchart of the methodology and describes how the study was carried out.
Agriculture 2020, 10, x FOR PEER REVIEW 3 of 24
atmospheric CO2 concentration [13]. In contrast to the projected yield increase by [13], soybean yield
is predicted to reduce when simulated based on global climate models [25]. Still, there are several
uncertainties regarding soybean water and crop productivity globally.
Since rainfed soybean production is predominant in Ogun-Ona River Basin, it is becoming
increasingly difficult to grow it as climate change impacts on agriculture intensifies. However, will
soybean perform optimally under various climate change scenarios in Ogun-Ona River Basin? With
the current growing water demands and the threats of climate change, how will soybean behave
under a changing climate? What will be the future water requirements of this crop? Will soybean
yields increase or decrease? These uncertainties pose great challenges to crop productivity, irrigation
and water allocation for agriculture. In order to provide more clarity, it is imperative to conduct more
studies to examine how soybean will respond to various locations since the impact of climate change
is spatially distributed. Therefore, this study seeks to:
(1) Estimate the seasonal CWR, yield and CWP of soybean during the baseline period (1986–2015)
within the study area based on different soil textures.
(2) Simulate the future seasonal CWR, yield and CWP of soybean for various soil textures under
different climate change scenarios (2021–2099).
(3) Compare the future seasonal CWR, yield and CWP of soybean for various soil textures to the
baseline period under different climate change scenarios.
2. Materials and Methods
Figure 1 presents the flowchart of the methodology and describes how the study was carried
out.
Figure 1. The flowchart of the methodology employed.
2.1. The Study Area
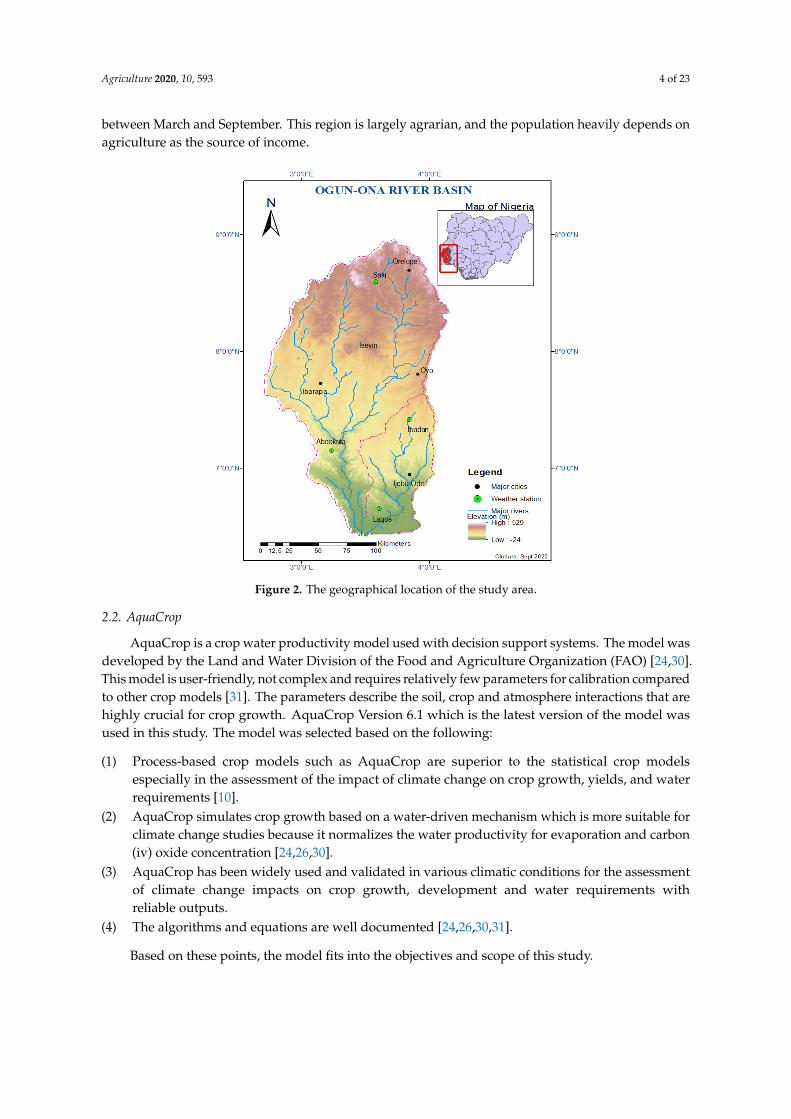
The study area of this research is the Ogun-Ona River Basin located in the south-western region
of Nigeria. The basin is located between latitude 6°33′–9°00′ N and longitude 2°40′–4°00′ E, Figure 2,
and covers about 29,040 km2. Ogun and Ona rivers, from which the basin derives its name, are the
major rivers in the basin. This basin is a sub-basin of the Ogun-Osun River Basin within the
jurisdiction of the Ogun-Osun River Basin Authority. The study area is located in the derived
savannah agro-ecological zone of the country which is characterized by tropical climate as well as
wet and dry seasons. The temperature of the region ranges from 21 °C to 34 °C and average rainfall
is 1340 mm between March and September. This region is largely agrarian, and the population
heavily depends on agriculture as the source of income.
Figure 1. The flowchart of the methodology employed.
2.1. The Study Area
The study area of this research is the Ogun-Ona River Basin located in the south-westernregion of Nigeria. The basin is located between latitude 6◦33′–9◦00′ N and longitude 2◦40′–4◦00′ E,Figure 2, and covers about 29,040 km2. Ogun and Ona rivers, from which the basin derives its name,are the major rivers in the basin. This basin is a sub-basin of the Ogun-Osun River Basin within thejurisdiction of the Ogun-Osun River Basin Authority. The study area is located in the derived savannahagro-ecological zone of the country which is characterized by tropical climate as well as wet and dryseasons. The temperature of the region ranges from 21 ◦C to 34 ◦C and average rainfall is 1340 mm
Agriculture 2020, 10, 593 4 of 23
between March and September. This region is largely agrarian, and the population heavily depends onagriculture as the source of income.Agriculture 2020, 10, x FOR PEER REVIEW 4 of 24
Figure 2. The geographical location of the study area.
2.2. AquaCrop
AquaCrop is a crop water productivity model used with decision support systems. The model
was developed by the Land and Water Division of the Food and Agriculture Organization (FAO)
[24,30]. This model is user-friendly, not complex and requires relatively few parameters for
calibration compared to other crop models [31]. The parameters describe the soil, crop and
atmosphere interactions that are highly crucial for crop growth. AquaCrop Version 6.1 which is the
latest version of the model was used in this study. The model was selected based on the following:
(1) Process-based crop models such as AquaCrop are superior to the statistical crop models
especially in the assessment of the impact of climate change on crop growth, yields, and water
requirements [10].
(2) AquaCrop simulates crop growth based on a water-driven mechanism which is more suitable
for climate change studies because it normalizes the water productivity for evaporation and
carbon (iv) oxide concentration [24,26,30].
(3) AquaCrop has been widely used and validated in various climatic conditions for the assessment
of climate change impacts on crop growth, development and water requirements with reliable
outputs.
(4) The algorithms and equations are well documented [24,26,30,31].
Based on these points, the model fits into the objectives and scope of this study.
Figure 2. The geographical location of the study area.
2.2. AquaCrop
AquaCrop is a crop water productivity model used with decision support systems. The model wasdeveloped by the Land and Water Division of the Food and Agriculture Organization (FAO) [24,30].This model is user-friendly, not complex and requires relatively few parameters for calibration comparedto other crop models [31]. The parameters describe the soil, crop and atmosphere interactions that arehighly crucial for crop growth. AquaCrop Version 6.1 which is the latest version of the model wasused in this study. The model was selected based on the following:
(1) Process-based crop models such as AquaCrop are superior to the statistical crop modelsespecially in the assessment of the impact of climate change on crop growth, yields, and waterrequirements [10].
(2) AquaCrop simulates crop growth based on a water-driven mechanism which is more suitable forclimate change studies because it normalizes the water productivity for evaporation and carbon(iv) oxide concentration [24,26,30].
(3) AquaCrop has been widely used and validated in various climatic conditions for the assessmentof climate change impacts on crop growth, development and water requirements withreliable outputs.
(4) The algorithms and equations are well documented [24,26,30,31].
Based on these points, the model fits into the objectives and scope of this study.
Agriculture 2020, 10, 593 5 of 23
2.2.1. Evapotranspiration, Crop Yield and Water Productivity
Reference evapotranspiration (ET0) is estimated in AquaCrop from inputted climate data usingthe Penman-Monteith equation [32] which has been reported as the most effective method of estimatingevapotranspiration [33]. CWR is estimated in the model as given in Equation (1).
ETc = Kc × ET0 (1)
Kc = Crop coefficient, describes the impacts of crop height, crop cover, canopy resistance, and soilevaporation. The value differs throughout the growing season; ETc = Crop evapotranspiration(mm/day).
In terms of calculating crop yield, AquaCrop uses the multiplication of biomass and harvest indexas given in Equation (2) [24,34].
Y = HI × B (2)
where: Y = Crop yield (kg/ha or t/ha), HI = Harvest index (fraction or percent), B = Biomass (t/haor kg/ha).
In the model, daily transpiration is calculated by multiplying the crop coefficient with ET0 andsoil coefficient as given by [30] in Equation (3).
Tr = Ks(KcTr.x ×CC∗)ET0 (3)
where Tr = Crop transpiration (mm/day), Ks = stress factor (Kssto or Ksaer) (fraction), CC * = adjustedgreen canopy cover (fraction), KcTr.x ×CC∗ = crop coefficient.
In estimating yield, the model automatically adjusts the harvest index to respond to temperaturechanges and water stress conditions which is very crucial for this study. The daily biomass productionin the model is estimated as given by [30] in Equation (4).
B = Ksb ×WP∗ ×∑ Tr
ET0(4)
where B = daily aboveground biomass (t/ha or kg/m2), Tr = daily crop transpiration (mm/day),ET0 = daily reference evapotranspiration (mm/day), WP* = water productivity of the crop varietynormalized for atmospheric CO2 concentration levels and evaporation (kg/m3), Ksb = Cold temperaturestress factor for biomass (fraction).
In AquaCrop, the modification coefficient for the atmospheric CO2 concentration is estimated byusing Equation (5) for the normalization of CO2 concentration which is essential for normalizing waterproductivity [24,30].
fCO2 =
(Ca
Ca,0
)1 + 0.000318× (Ca −Ca,0)
(5)
where fCO2 = Modification coefficient for CO2 (dimensionless), Ca = Atmospheric CO2 (µL/L),Ca,0 = Baseline CO2 recorded in 2000 at Mauna Loa Observatory Centre, Hawaii which is 369.47 µL/L.
Meanwhile, CWP is the ratio of crop yield to the quantity of water consumed by the crop during agrowing season, Equation (6) [9,31].
CWP =YieldETa
× 100 (6)
CWP = crop water productivity in kg/m3, Yield in t/ha and ETa in mm/season. ETa accountsfor water that is consumed and, in the model, it consists of soil evaporation and plant transpiration.The unit conversion factor is 100.
Agriculture 2020, 10, 593 6 of 23
In addition, when it rains, not all rainwater is available for crops. Some water losses occur throughrunoff and deep percolation. The amount of water from rainfall available for crops within the croproot zone after loses is known as effective rainfall. In AquaCrop, the United States Department forAgriculture (USDA, Washington, DC, USA) Soil Conservation method is used to estimate the effectiverainfall so as to consider water loss through runoff and deep percolation which are components ofwater balance. The formulas are given in Equations (7) and (8).
Pe f f =
[Pdec × (125− 0.6× Pdec)
125
]forP dec ≤ 250/3 mm (7)
Pe f f =(125
3
)+ 0.1× Pdecfor Pdec > 250/3 mm (8)
where Pe f f = Effective rainfall (mm/day), and Pdec = 10-day rainfall (mm/decadal).
2.2.2. Soil Water Balance
Soil water balance is an integral component of AquaCrop since the model operates on awater-driven mechanism with the biomass production linked with transpiration. The model simulatessoil water balance on a daily basis by adjusting the soil water content throughout a given soil profile [30].In order to cater for the fluctuations in soil water content such as incoming water fluxes (rainfallirrigation and capillary rise) and outgoing water fluxes (evaporation, runoff, transpiration and deeppercolation), the root zone of the soil is regarded as a reservoir [30]. Drainage and infiltration withinthe root zone are simulated by a series of equations in terms of the dependent variable (θ) through aunitless drainage factor usually obtained from Ksat [24]. It is also possible to consider groundwatermovement in soil water balance in areas where there is a shallow groundwater table to the root zone.
2.3. Data Collection
2.3.1. Climate Data
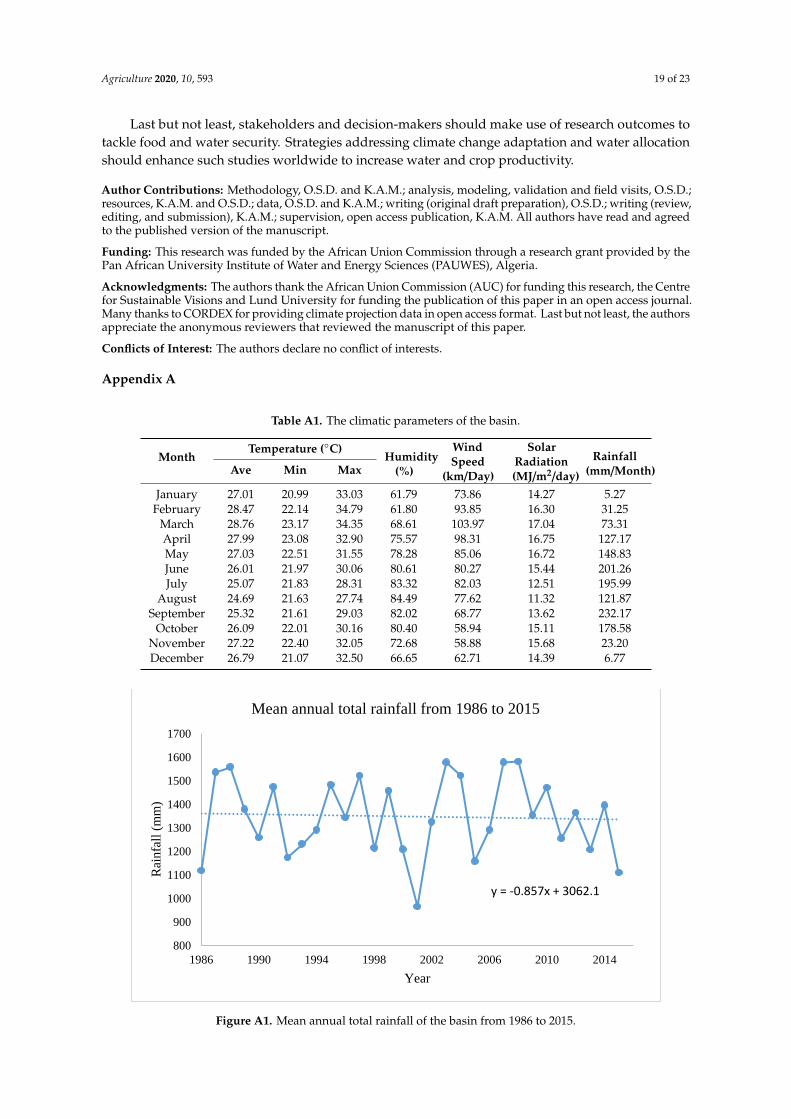
The climate data from 1976–2015 (40 years) of the basin were acquired from the NigerianMeteorological Agency (NIMET). The datasets of 1976–1985 (10 years) were only daily rainfall,maximum and minimum temperatures used for climate model evaluation while the datasets of1986–2015 (30 years) were daily rainfall, maximum and minimum temperatures, relative humidity,wind speed and solar radiation used for historical simulations. The mean monthly values and trendof the climatic parameters from 1986–2015 are shown in Table A1, Figures A1 and A2 in Annex.The figures reveal that the rainy season starts from April to July before a short dry period in Augustknown as August break. The peak is around June, July and September with around 200 mm while thelowest rainfall is usually in January and December with less than 10 mm. Meanwhile, the annual meantemperature of the basin is 26.7 ◦C. The months of February and March are usually the hottest periodswith a maximum temperature of 34.8 ◦C and 34.4 ◦C, respectively.
2.3.2. Soil Data
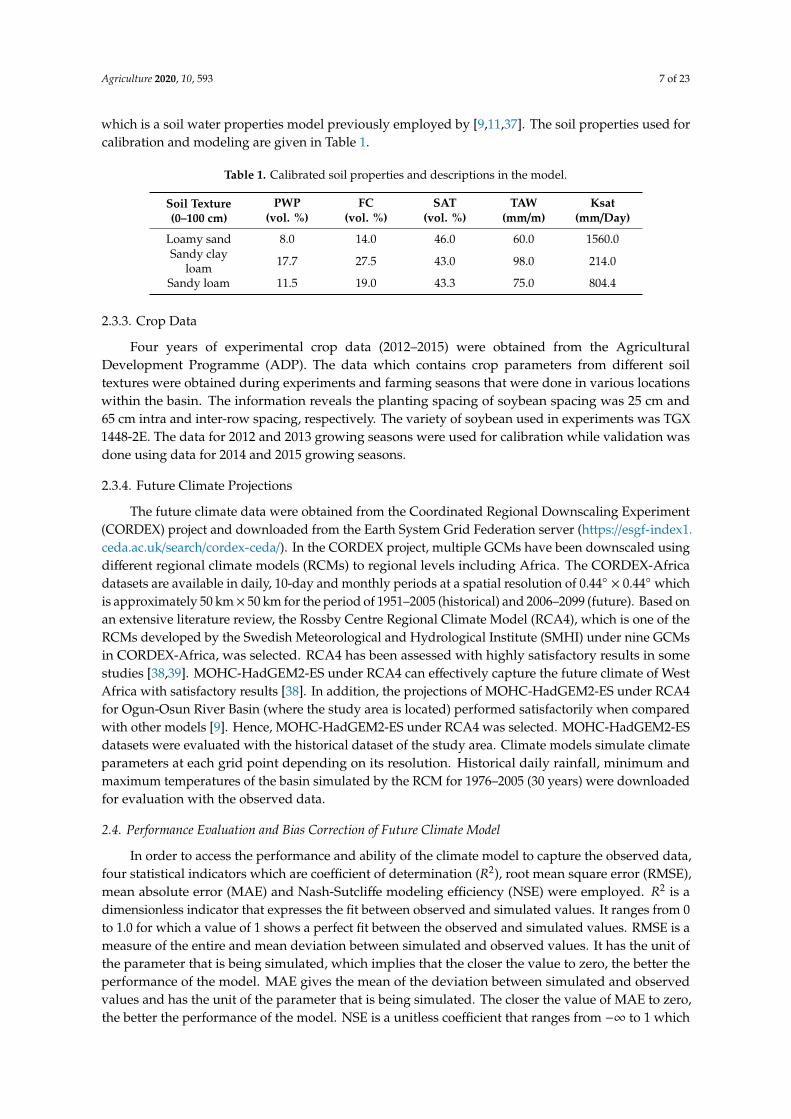
Soil physical and chemical properties of the basin were obtained from the Harmonised World SoilDatabase (HWSD) which has a resolution of 1 km (30 arcs second). The data was downloaded from theFAO website (http://www.fao.org/soils-portal/soil-survey/soil-maps-and-databases) [35]. The soil in thebasin is dominantly Ferric Luvisols and Lithosols [36]. The textures of the agricultural soils (0–100 cm)are predominantly sandy loam, loamy sand and sandy clay loam. The soil data was validated with dataobtained from the Ogun-Osun River Bain Authority and field experiments. Thereafter, the percentagesof sand, silt and clay particles were used to obtain the hydrological properties such as permanentwilting point (PWP), field capacity (FC), saturation (SAT), total available water (TAW) and hydraulicconductivity (Ksat) using SPAW model (Version 6.02) (https://hrsl.ba.ars.usda.gov/soilwater/index.htm)
which is a soil water properties model previously employed by [9,11,37]. The soil properties used forcalibration and modeling are given in Table 1.
Table 1. Calibrated soil properties and descriptions in the model.
Soil Texture(0–100 cm)
PWP FC SAT TAW Ksat(vol. %) (vol. %) (vol. %) (mm/m) (mm/Day)
Loamy sand 8.0 14.0 46.0 60.0 1560.0Sandy clay
loam 17.7 27.5 43.0 98.0 214.0
Sandy loam 11.5 19.0 43.3 75.0 804.4
2.3.3. Crop Data
Four years of experimental crop data (2012–2015) were obtained from the AgriculturalDevelopment Programme (ADP). The data which contains crop parameters from different soiltextures were obtained during experiments and farming seasons that were done in various locationswithin the basin. The information reveals the planting spacing of soybean spacing was 25 cm and65 cm intra and inter-row spacing, respectively. The variety of soybean used in experiments was TGX1448-2E. The data for 2012 and 2013 growing seasons were used for calibration while validation wasdone using data for 2014 and 2015 growing seasons.
2.3.4. Future Climate Projections
The future climate data were obtained from the Coordinated Regional Downscaling Experiment(CORDEX) project and downloaded from the Earth System Grid Federation server (https://esgf-index1.ceda.ac.uk/search/cordex-ceda/). In the CORDEX project, multiple GCMs have been downscaled usingdifferent regional climate models (RCMs) to regional levels including Africa. The CORDEX-Africadatasets are available in daily, 10-day and monthly periods at a spatial resolution of 0.44◦ × 0.44◦ whichis approximately 50 km× 50 km for the period of 1951–2005 (historical) and 2006–2099 (future). Based onan extensive literature review, the Rossby Centre Regional Climate Model (RCA4), which is one of theRCMs developed by the Swedish Meteorological and Hydrological Institute (SMHI) under nine GCMsin CORDEX-Africa, was selected. RCA4 has been assessed with highly satisfactory results in somestudies [38,39]. MOHC-HadGEM2-ES under RCA4 can effectively capture the future climate of WestAfrica with satisfactory results [38]. In addition, the projections of MOHC-HadGEM2-ES under RCA4for Ogun-Osun River Basin (where the study area is located) performed satisfactorily when comparedwith other models [9]. Hence, MOHC-HadGEM2-ES under RCA4 was selected. MOHC-HadGEM2-ESdatasets were evaluated with the historical dataset of the study area. Climate models simulate climateparameters at each grid point depending on its resolution. Historical daily rainfall, minimum andmaximum temperatures of the basin simulated by the RCM for 1976–2005 (30 years) were downloadedfor evaluation with the observed data.
2.4. Performance Evaluation and Bias Correction of Future Climate Model
In order to access the performance and ability of the climate model to capture the observed data,four statistical indicators which are coefficient of determination (R2), root mean square error (RMSE),mean absolute error (MAE) and Nash-Sutcliffe modeling efficiency (NSE) were employed. R2 is adimensionless indicator that expresses the fit between observed and simulated values. It ranges from 0to 1.0 for which a value of 1 shows a perfect fit between the observed and simulated values. RMSE is ameasure of the entire and mean deviation between simulated and observed values. It has the unit ofthe parameter that is being simulated, which implies that the closer the value to zero, the better theperformance of the model. MAE gives the mean of the deviation between simulated and observedvalues and has the unit of the parameter that is being simulated. The closer the value of MAE to zero,the better the performance of the model. NSE is a unitless coefficient that ranges from −∞ to 1 which
measures the general deviation between simulated and observed values. An efficiency of 1.0 reveals aperfect match between simulated and observed values. The closer the efficiency is to 1.0, the betterthe performance of the model. When NSE is less than zero, it means that the observed mean is abetter predictor.
The daily observed and simulated climatic data for the historical period of 1976–2005 were used forthe evaluation. The results of the evaluation as given in Table 2 reveals that HadGEM2-ES downscaledby RCA4 performed satisfactorily. The negative value of NSE for rainfall depicts that the observedmean is a better predictor than the model. In order to correct this and improve the performance of themodel, the rainfall dataset for HadGEM2-ES was bias-corrected.
Table 2. Statistical evaluation of HadGEM2-ES downscaled by RCA4 on historical data (1976–2005).
Minimum temperature 0.84 0.92 0.72 0.74Maximum temperature 0.85 0.89 0.68 0.75
The bias correction technique applied is Quantile Mapping (QM) with the gamma distributionmodel. The principle of the QM technique relies on adjusting the cumulative distribution functions(CDF) of the simulated historical GCM/RCM data based on observed historical data as given inEquation (9). This method matches the CDF of the simulated historical GCM data and the observedhistorical data together thereby correcting the bias (extremes, intensity and frequency) in the futureGCM data [7]. It has been proved that the quality of RCM data and shape of CDF is improved throughQM in previous studies [7,9,39,40]. QM also performed better than the change factor method thatwas tested in this study. Thus, daily historical observed and simulated rainfall data from 1976–2005(30 years) were used to bias correct the future simulated data (2021–2099) through QM.
y = Fobs−1 (FRC(x)), (9)
where y = bias-corrected future rainfall values, Fobs−1 = inverse of the CDF of the observed values,
FRCM = CDF of the historical RCM data.Hence, future daily rainfall (after bias correction), minimum and maximum temperatures of
the basin obtained from HadGEM2-ES (GCM) and RCA4 (RCM) for the period of 2021–2099 underRepresentative Concentration Pathway (RCP) 4.5 and 8.5 scenarios under the CORDEX-Africa projectwas used.
2.5. Calibration and Validation of AquaCrop
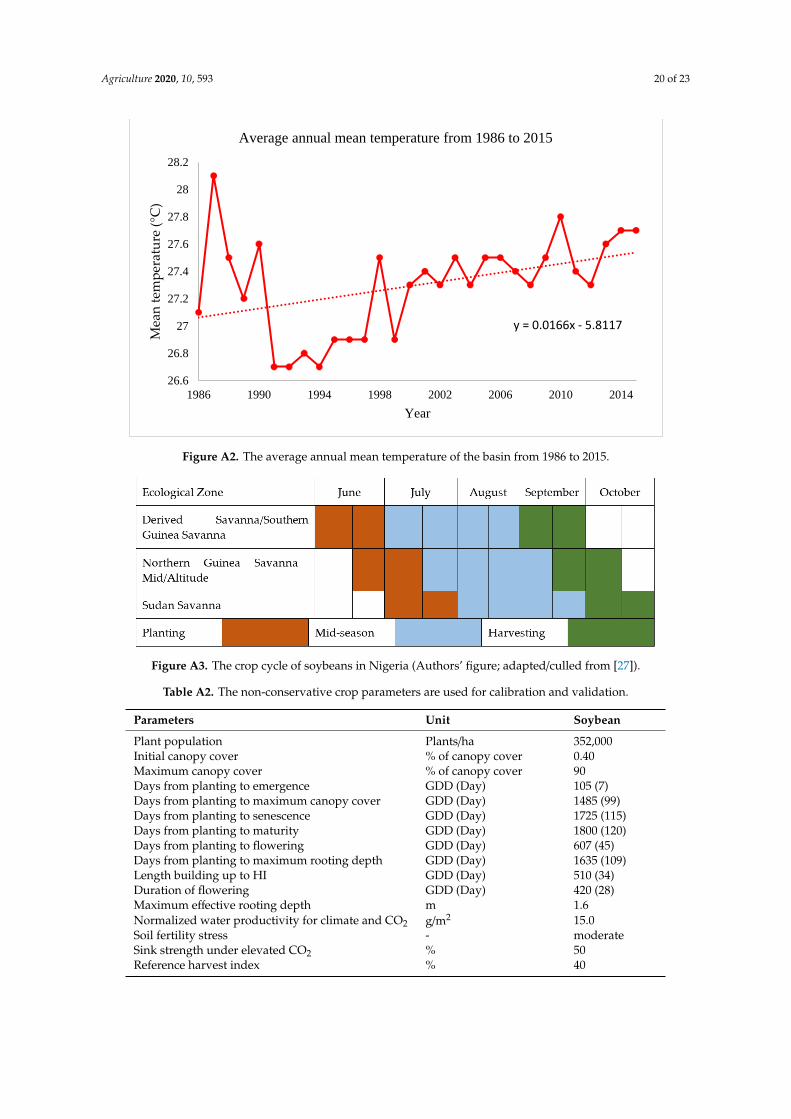
In the AquaCrop model, the planting date window was calibrated between 1–15 June which is theusual planting period of soybean within the basin. The crop cycle of soybean in Nigeria is provided inFigure A3 for a better understanding of its phenology. All the calibrated parameters and values usedare given in Table A2. The model was calibrated to automatically select a planting date based on theestablishment of rainfall (cumulative rainfall at least 40 mm) within each year according to the inputtedrainfall data and starts simulation on that date. This was done to emulate the planting styles of farmerswithin the study area who plants after the onset of rainfall within those planting periods. The initial soilconditions were set at field capacity since rainfed agriculture is simulated. Meanwhile, groundwaterintrusion has not been established on agricultural fields within the basin, thus, groundwater was notconsidered [9,15]. Soil infertility and weak weed management are common within the study. Hence,the soil fertility and weed management functions were both calibrated as moderate. In the model,soil fertility is moderate when it has 60% of the potential biomass production which corresponds to anitrogen rate of 60 kg/ha as shown in field experiments within the basin. Then, all the management
Agriculture 2020, 10, 593 9 of 23
files were set up as project files. Each field with similar soil texture and management practices weregrouped into single units to form projects under the historical period (1986–2015) and future period(2021–2099).
In order to assess the performance of AquaCrop, the four years of experimental data obtainedwere evaluated through R2, RMSE, MAE and NSE. The results show that the simulated yields matchwell with the observed yields. The average simulated and average observed soybean yields are 2.71and 2.69 t/ha respectively as shown in Table A3. Hence, satisfactory results obtained make the modelreliable and suitable for both historical and future climate conditions of the basin. A preliminarysensitivity analysis was done on the physical soil properties and found out that the model is moresensitive to FC and PWP than other properties of the soil. Validation of water fluxes could not bedone due to limited data but these validations have been done within the Ogun-Osun River Basin thatAquaCrop performs satisfactorily in simulating water fluxes of soybean within the region [9].
3. Results
3.1. Temporal Distribution of CWR, Yield and CWP in the Past Decades
The CWR, yield and CWP of rainfed soybean were simulated from 1986–2015 (30 years) on thesoil texture within the study area to estimate the changes in the trend of production and examinetemporal variability of these parameters. CWR, yield, and CWP were averaged over all points with thesame soil texture.
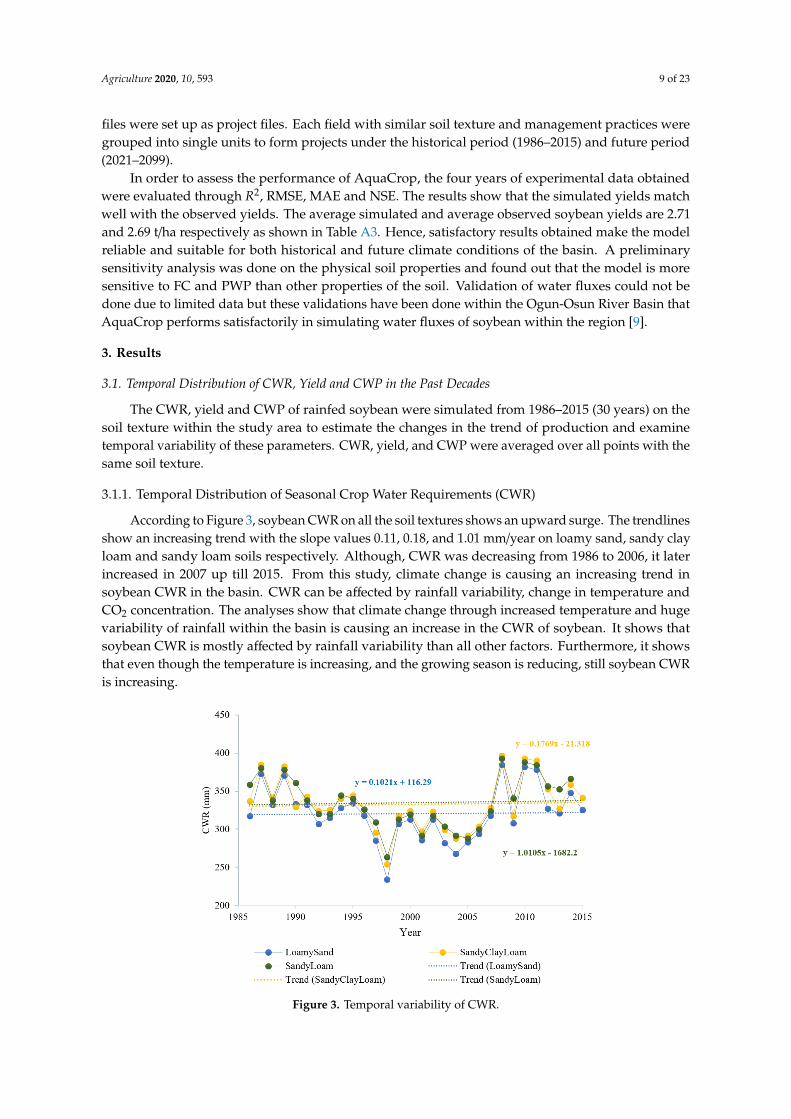
3.1.1. Temporal Distribution of Seasonal Crop Water Requirements (CWR)
According to Figure 3, soybean CWR on all the soil textures shows an upward surge. The trendlinesshow an increasing trend with the slope values 0.11, 0.18, and 1.01 mm/year on loamy sand, sandy clayloam and sandy loam soils respectively. Although, CWR was decreasing from 1986 to 2006, it laterincreased in 2007 up till 2015. From this study, climate change is causing an increasing trend insoybean CWR in the basin. CWR can be affected by rainfall variability, change in temperature andCO2 concentration. The analyses show that climate change through increased temperature and hugevariability of rainfall within the basin is causing an increase in the CWR of soybean. It shows thatsoybean CWR is mostly affected by rainfall variability than all other factors. Furthermore, it showsthat even though the temperature is increasing, and the growing season is reducing, still soybean CWRis increasing.
Agriculture 2020, 10, x FOR PEER REVIEW 9 of 24
In order to assess the performance of AquaCrop, the four years of experimental data obtained
were evaluated through R2, RMSE, MAE and NSE. The results show that the simulated yields match
well with the observed yields. The average simulated and average observed soybean yields are 2.71
and 2.69 t/ha respectively as shown in Table A3. Hence, satisfactory results obtained make the model
reliable and suitable for both historical and future climate conditions of the basin. A preliminary
sensitivity analysis was done on the physical soil properties and found out that the model is more
sensitive to FC and PWP than other properties of the soil. Validation of water fluxes could not be
done due to limited data but these validations have been done within the Ogun-Osun River Basin
that AquaCrop performs satisfactorily in simulating water fluxes of soybean within the region [9].
3. Results
3.1. Temporal Distribution of CWR, Yield and CWP in the Past Decades
The CWR, yield and CWP of rainfed soybean were simulated from 1986–2015 (30 years) on the
soil texture within the study area to estimate the changes in the trend of production and examine
temporal variability of these parameters. CWR, yield, and CWP were averaged over all points with
the same soil texture.
3.1.1. Temporal Distribution of Seasonal Crop Water Requirements (CWR)
According to Figure 3, soybean CWR on all the soil textures shows an upward surge. The
trendlines show an increasing trend with the slope values 0.11, 0.18, and 1.01 mm/year on loamy sand,
sandy clay loam and sandy loam soils respectively. Although, CWR was decreasing from 1986 to
2006, it later increased in 2007 up till 2015. From this study, climate change is causing an increasing
trend in soybean CWR in the basin. CWR can be affected by rainfall variability, change in temperature
and CO2 concentration. The analyses show that climate change through increased temperature and
huge variability of rainfall within the basin is causing an increase in the CWR of soybean. It shows
that soybean CWR is mostly affected by rainfall variability than all other factors. Furthermore, it
shows that even though the temperature is increasing, and the growing season is reducing, still
soybean CWR is increasing.
Figure 3. Temporal variability of CWR. Figure 3. Temporal variability of CWR.
Agriculture 2020, 10, 593 10 of 23
3.1.2. Temporal Distribution of Crop Yield
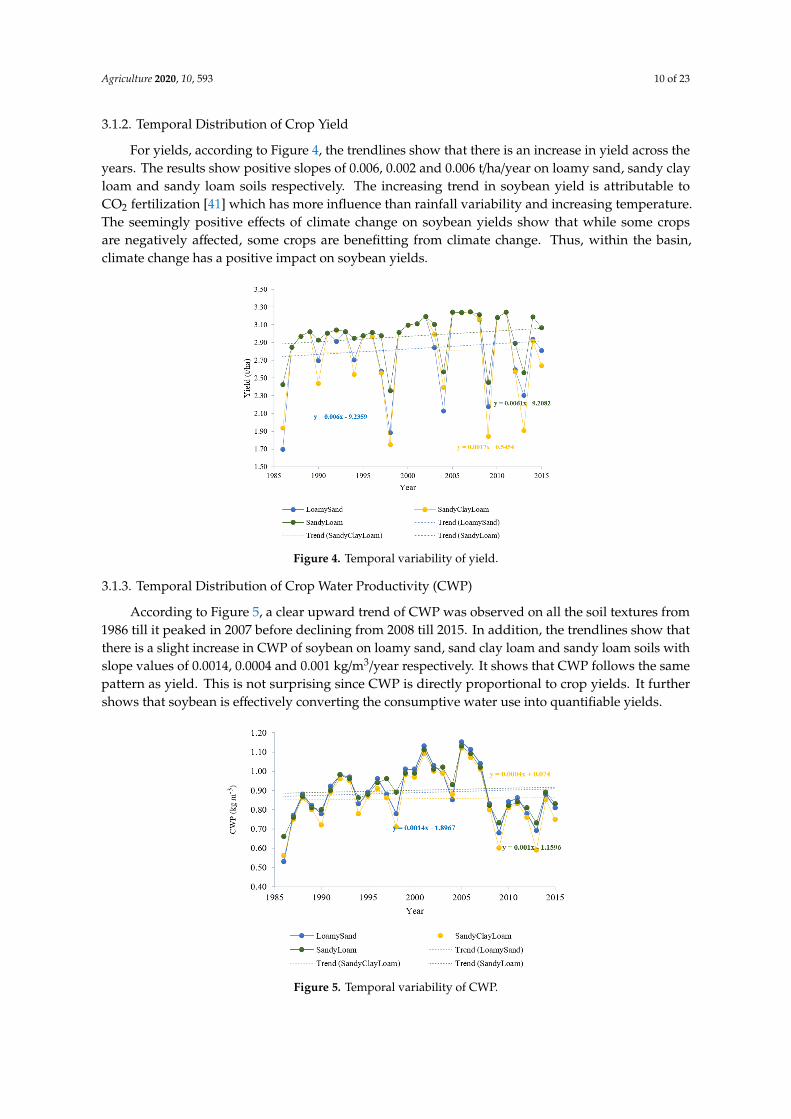
For yields, according to Figure 4, the trendlines show that there is an increase in yield across theyears. The results show positive slopes of 0.006, 0.002 and 0.006 t/ha/year on loamy sand, sandy clayloam and sandy loam soils respectively. The increasing trend in soybean yield is attributable toCO2 fertilization [41] which has more influence than rainfall variability and increasing temperature.The seemingly positive effects of climate change on soybean yields show that while some cropsare negatively affected, some crops are benefitting from climate change. Thus, within the basin,climate change has a positive impact on soybean yields.
Agriculture 2020, 10, x FOR PEER REVIEW 10 of 24
3.1.2. Temporal Distribution of Crop Yield
For yields, according to Figure 4, the trendlines show that there is an increase in yield across the
years. The results show positive slopes of 0.006, 0.002 and 0.006 t/ha/year on loamy sand, sandy clay
loam and sandy loam soils respectively. The increasing trend in soybean yield is attributable to CO2
fertilization [41] which has more influence than rainfall variability and increasing temperature. The
seemingly positive effects of climate change on soybean yields show that while some crops are
negatively affected, some crops are benefitting from climate change. Thus, within the basin, climate
change has a positive impact on soybean yields.
Figure 4. Temporal variability of yield.
3.1.3. Temporal Distribution of Crop Water Productivity (CWP)
According to Figure 5, a clear upward trend of CWP was observed on all the soil textures from
1986 till it peaked in 2007 before declining from 2008 till 2015. In addition, the trendlines show that
there is a slight increase in CWP of soybean on loamy sand, sand clay loam and sandy loam soils with
slope values of 0.0014, 0.0004 and 0.001 kg/m3/year respectively. It shows that CWP follows the same
pattern as yield. This is not surprising since CWP is directly proportional to crop yields. It further
shows that soybean is effectively converting the consumptive water use into quantifiable yields.
Figure 4. Temporal variability of yield.
3.1.3. Temporal Distribution of Crop Water Productivity (CWP)
According to Figure 5, a clear upward trend of CWP was observed on all the soil textures from1986 till it peaked in 2007 before declining from 2008 till 2015. In addition, the trendlines show thatthere is a slight increase in CWP of soybean on loamy sand, sand clay loam and sandy loam soils withslope values of 0.0014, 0.0004 and 0.001 kg/m3/year respectively. It shows that CWP follows the samepattern as yield. This is not surprising since CWP is directly proportional to crop yields. It furthershows that soybean is effectively converting the consumptive water use into quantifiable yields.
Agriculture 2020, 10, x FOR PEER REVIEW 11 of 24
Figure 5. Temporal variability of CWP.
3.2. Future Changes in Climatic Parameters, CWR, Yield and CWP under Different Climate
Change Scenarios
The future changes in rainfall, minimum and maximum temperatures for future periods of near
future (2021–2040), mid-century (2041–2070) and late-century (2071–2099) under RCP 4.5 and RCP
8.5 scenarios relative to mean of the baseline period (1986–2015) were estimated based on the
projections of HadGEM2-ES model. The analysis shows that the basin will experience a reduction in
annual rainfall across all scenarios and future periods except in the period of 2041–2070. From Table
3, under the RCP 4.5 scenario, annual rainfall will decrease by 10% by 2040, increase by 3% by 2070
and decrease by 8% by 2099 compared to the average of the baseline period. In addition, both
minimum and maximum temperatures will increase gradually from 2021 up to 2099 under both RCP
4.5 and RCP 8.5 scenarios. RCP 8.5 is expected to be generally hotter than RCP 4.5 since RCP 8.5. The
maximum temperature was projected to increase by 2.7 °C and 4.4 °C by the late century under RCP
4.5 and RCP 8.5 scenarios, respectively, compared to the average of the baseline period. Similarly,
minimum temperature is projected to increase by up to 2.4 °C and 4.2 °C by the late century under
RCP 4.5 and RCP 8.5 scenarios, respectively, compared to the average of the baseline period.
Table 3. Changes in rainfall, minimum and maximum temperatures for future periods under
Representative Concentration Pathway (RCP) 4.5 and 8.5 scenarios relative to mean of the baseline
Climate change is capable of significantly affecting agricultural production globally which is
expected to be temporally and spatially distributed. The future CWR, IWR, yield and CWP of soybean
Figure 5. Temporal variability of CWP.
Agriculture 2020, 10, 593 11 of 23
3.2. Future Changes in Climatic Parameters, CWR, Yield and CWP under Different Climate Change Scenarios
The future changes in rainfall, minimum and maximum temperatures for future periods of nearfuture (2021–2040), mid-century (2041–2070) and late-century (2071–2099) under RCP 4.5 and RCP 8.5scenarios relative to mean of the baseline period (1986–2015) were estimated based on the projections ofHadGEM2-ES model. The analysis shows that the basin will experience a reduction in annual rainfallacross all scenarios and future periods except in the period of 2041–2070. From Table 3, under the RCP4.5 scenario, annual rainfall will decrease by 10% by 2040, increase by 3% by 2070 and decrease by 8%by 2099 compared to the average of the baseline period. In addition, both minimum and maximumtemperatures will increase gradually from 2021 up to 2099 under both RCP 4.5 and RCP 8.5 scenarios.RCP 8.5 is expected to be generally hotter than RCP 4.5 since RCP 8.5. The maximum temperature wasprojected to increase by 2.7 ◦C and 4.4 ◦C by the late century under RCP 4.5 and RCP 8.5 scenarios,respectively, compared to the average of the baseline period. Similarly, minimum temperature isprojected to increase by up to 2.4 ◦C and 4.2 ◦C by the late century under RCP 4.5 and RCP 8.5 scenarios,respectively, compared to the average of the baseline period.
Table 3. Changes in rainfall, minimum and maximum temperatures for future periods underRepresentative Concentration Pathway (RCP) 4.5 and 8.5 scenarios relative to mean of the baselineperiod (1986–2015).
Climate change is capable of significantly affecting agricultural production globally which isexpected to be temporally and spatially distributed. The future CWR, IWR, yield and CWP of soybeanwere simulated for future periods of near future (2021–2040), mid-century (2041–2070) and late-century(2071–2099) under RCP 4.5 and RCP 8.5 scenarios based on the projections of HadGEM2-ES model.
3.2.1. Future Seasonal Crop Water Requirements (CWR)
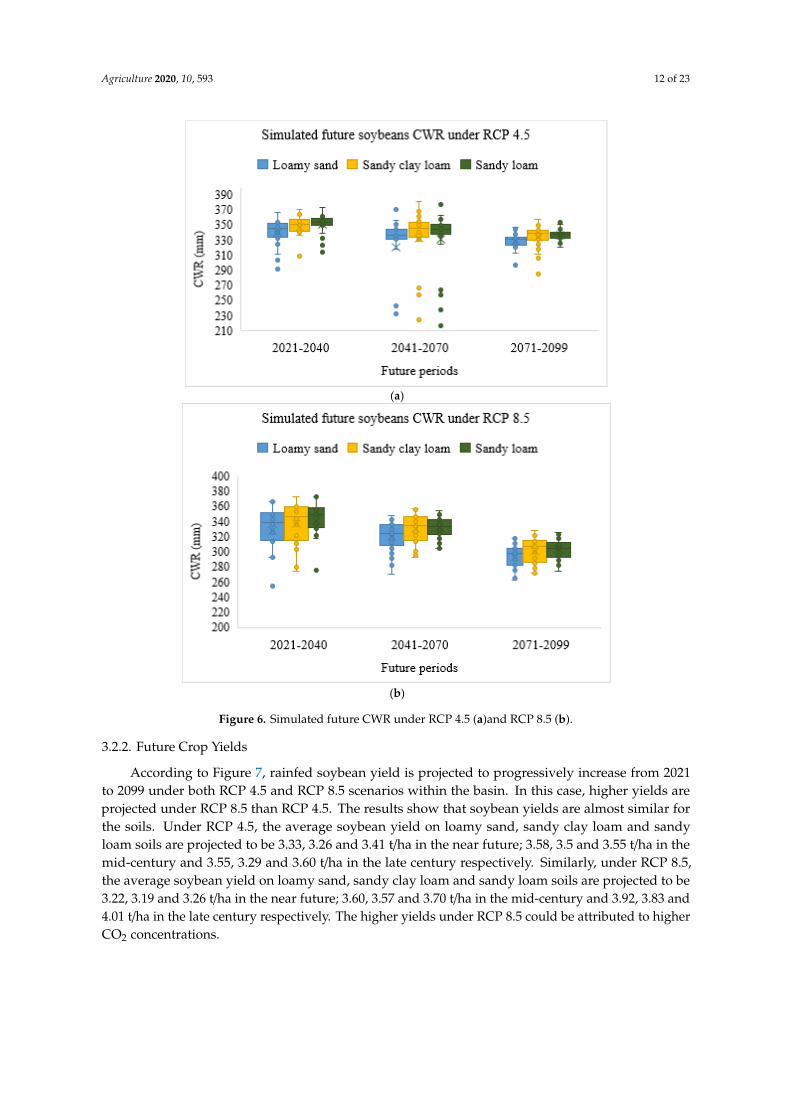
The simulations show that climate change (change in rainfall and temperature) will significantlyaffect soybean CWR. The CWR of soybean is projected to decrease gradually from 2021–2099 as shownin Figure 6. Under RCP 4.5, the average CWR of soybean on loamy sand, sandy clay loam and sandyloam soils are projected to be 340, 347 and 351 mm in the near future; 321, 332 and 330 mm in themid-century and 329, 334 and 337 mm in the late century respectively. Meanwhile, under RCP 8.5,CWR of soybean will reduce largely when compared with the results under RCP 4.5 in all futureperiods. Under RCP 8.5, the average CWR of soybean on loamy sand, sandy clay loam and sandyloam soils are projected to be 328, 337 and 341 mm in the near future; 320, 330 and 332 mm in themid-century as well as 293, 301 and 303 mm in the late century, respectively.
Agriculture 2020, 10, 593 12 of 23
Agriculture 2020, 10, x FOR PEER REVIEW 12 of 24
were simulated for future periods of near future (2021–2040), mid-century (2041–2070) and late-
century (2071–2099) under RCP 4.5 and RCP 8.5 scenarios based on the projections of HadGEM2-ES
model.
3.2.1. Future Seasonal Crop Water Requirements (CWR)
The simulations show that climate change (change in rainfall and temperature) will significantly
affect soybean CWR. The CWR of soybean is projected to decrease gradually from 2021–2099 as
shown in Figure 6. Under RCP 4.5, the average CWR of soybean on loamy sand, sandy clay loam and
sandy loam soils are projected to be 340, 347 and 351 mm in the near future; 321, 332 and 330 mm in
the mid-century and 329, 334 and 337 mm in the late century respectively. Meanwhile, under RCP
8.5, CWR of soybean will reduce largely when compared with the results under RCP 4.5 in all future
periods. Under RCP 8.5, the average CWR of soybean on loamy sand, sandy clay loam and sandy
loam soils are projected to be 328, 337 and 341 mm in the near future; 320, 330 and 332 mm in the
mid-century as well as 293, 301 and 303 mm in the late century, respectively.
According to Figure 7, rainfed soybean yield is projected to progressively increase from 2021to 2099 under both RCP 4.5 and RCP 8.5 scenarios within the basin. In this case, higher yields areprojected under RCP 8.5 than RCP 4.5. The results show that soybean yields are almost similar forthe soils. Under RCP 4.5, the average soybean yield on loamy sand, sandy clay loam and sandyloam soils are projected to be 3.33, 3.26 and 3.41 t/ha in the near future; 3.58, 3.5 and 3.55 t/ha in themid-century and 3.55, 3.29 and 3.60 t/ha in the late century respectively. Similarly, under RCP 8.5,the average soybean yield on loamy sand, sandy clay loam and sandy loam soils are projected to be3.22, 3.19 and 3.26 t/ha in the near future; 3.60, 3.57 and 3.70 t/ha in the mid-century and 3.92, 3.83 and4.01 t/ha in the late century respectively. The higher yields under RCP 8.5 could be attributed to higherCO2 concentrations.
Agriculture 2020, 10, 593 13 of 23
Agriculture 2020, 10, x FOR PEER REVIEW 13 of 24
3.2.2. Future Crop Yields
According to Figure 7, rainfed soybean yield is projected to progressively increase from 2021 to
2099 under both RCP 4.5 and RCP 8.5 scenarios within the basin. In this case, higher yields are
projected under RCP 8.5 than RCP 4.5. The results show that soybean yields are almost similar for
the soils. Under RCP 4.5, the average soybean yield on loamy sand, sandy clay loam and sandy loam
soils are projected to be 3.33, 3.26 and 3.41 t/ha in the near future; 3.58, 3.5 and 3.55 t/ha in the mid-
century and 3.55, 3.29 and 3.60 t/ha in the late century respectively. Similarly, under RCP 8.5, the
average soybean yield on loamy sand, sandy clay loam and sandy loam soils are projected to be 3.22,
3.19 and 3.26 t/ha in the near future; 3.60, 3.57 and 3.70 t/ha in the mid-century and 3.92, 3.83 and 4.01
t/ha in the late century respectively. The higher yields under RCP 8.5 could be attributed to higher
CO2 concentrations.
(a)
(b)
Figure 7. Simulated future yields under RCP 4.5 (a) and RCP 8.5 (b).
Figure 7. Simulated future yields under RCP 4.5 (a) and RCP 8.5 (b).
3.2.3. Future Crop Water Productivity (CWP)
The simulated future CWP show different variations for the future periods as well as underdifferent climate change scenarios. According to the simulations, there will be huge variability withinthe soil textures and the growing seasons. The simulations of soybean CWP under both RCP 4.5 andRCP 8 scenarios show an increasing trend in the future years as shown in Figure 8. Under RCP 4.5,the average CWP of soybean on loamy sand, sandy clay loam and sandy loam soils are projected to be0.99, 0.94 and 0.98 kg/m3 in the near future; 1.06, 1.02 and 1.05 kg/m3 in the mid-century and 1.09, 0.99and 1.08 kg/m3 in the late century respectively. Meanwhile, under RCP 8.5, the average CWP of soybeanon loamy sand, sandy clay loam and sandy loam soils are projected to be 0.94, 0.90 and 0.96 kg/m3
in the near future; 1.13, 1.12 and 1.13 kg/m3 in the mid-century and 1.35, 1.28 and 1.34 kg/m3 in thelate century respectively. The projected CWP also follows the same pattern as yields. Higher CWP isprojected under RCP 8.5 than RCP 4.5 due to simulated higher yields under this scenario.
Agriculture 2020, 10, 593 14 of 23
Agriculture 2020, 10, x FOR PEER REVIEW 14 of 24
3.2.3. Future Crop Water Productivity (CWP)
The simulated future CWP show different variations for the future periods as well as under
different climate change scenarios. According to the simulations, there will be huge variability within
the soil textures and the growing seasons. The simulations of soybean CWP under both RCP 4.5 and
RCP 8 scenarios show an increasing trend in the future years as shown in Figure 8. Under RCP 4.5,
the average CWP of soybean on loamy sand, sandy clay loam and sandy loam soils are projected to
be 0.99, 0.94 and 0.98 kg/m3 in the near future; 1.06, 1.02 and 1.05 kg/m3 in the mid-century and 1.09,
0.99 and 1.08 kg/m3 in the late century respectively. Meanwhile, under RCP 8.5, the average CWP of
soybean on loamy sand, sandy clay loam and sandy loam soils are projected to be 0.94, 0.90 and 0.96
kg/m3 in the near future; 1.13, 1.12 and 1.13 kg/m3 in the mid-century and 1.35, 1.28 and 1.34 kg/m3 in
the late century respectively. The projected CWP also follows the same pattern as yields. Higher CWP
is projected under RCP 8.5 than RCP 4.5 due to simulated higher yields under this scenario.
3.3. Temporal Changes in Future Seasonal CWR, Yield and CWP under Different Climate Change Scenarios forDifferent Soil Textures
The period of 1986–2015 was used as a baseline period to estimate the temporal changes inCWR, yield and CWP of rainfed soybean on different soil textures in three future periods of nearfuture (2021–2040), mid-century (2041–2070) and late-century (2071–2099) under RCP 4.5 and RCP8.5 scenarios.
3.3.1. Changes in Future Seasonal Crop Water Requirements (CWR)
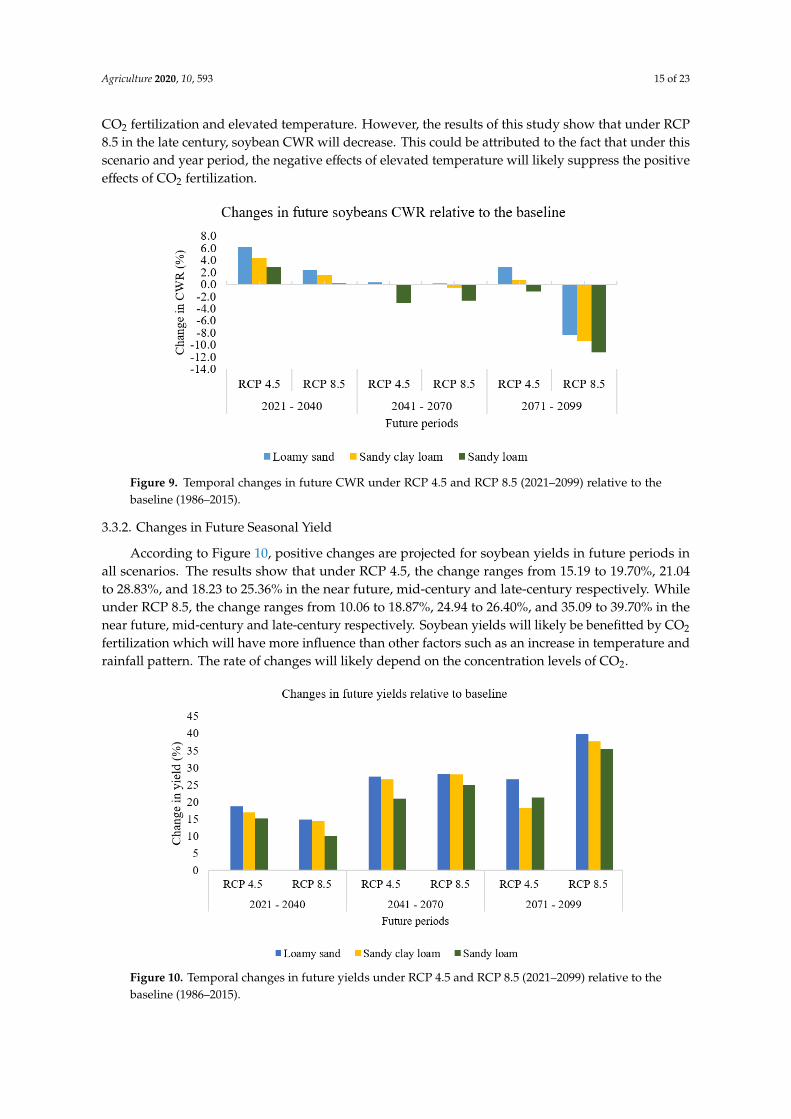
The future changes in soybean CWR are projected to fluctuate when compared with the averageof the baseline. According to Figure 9, under RCP 4.5, small increases ranging from 3.0 to 6% areprojected in the near future. In addition, under RCP 8.5, increase changes of about 2% are projectedin the near future, while in the mid-centuries, the change could be up to −3 depending on the soiltextures. However, under RCP 8.5 in the late-century, the highest changes which range from −11.25 to−8.37% are projected. Meanwhile, the increase in CWR is not unconnected to the combined effects of
Agriculture 2020, 10, 593 15 of 23
CO2 fertilization and elevated temperature. However, the results of this study show that under RCP8.5 in the late century, soybean CWR will decrease. This could be attributed to the fact that under thisscenario and year period, the negative effects of elevated temperature will likely suppress the positiveeffects of CO2 fertilization.
Agriculture 2020, 10, x FOR PEER REVIEW 15 of 24
3.3. Temporal Changes in Future Seasonal CWR, Yield and CWP under Different Climate Change Scenarios
for Different Soil Textures
The period of 1986–2015 was used as a baseline period to estimate the temporal changes in CWR,
yield and CWP of rainfed soybean on different soil textures in three future periods of near future
(2021–2040), mid-century (2041–2070) and late-century (2071–2099) under RCP 4.5 and RCP 8.5
scenarios.
3.3.1. Changes in Future Seasonal Crop Water Requirements (CWR)
The future changes in soybean CWR are projected to fluctuate when compared with the average
of the baseline. According to Figure 9, under RCP 4.5, small increases ranging from 3.0 to 6% are
projected in the near future. In addition, under RCP 8.5, increase changes of about 2% are projected
in the near future, while in the mid-centuries, the change could be up to −3 depending on the soil
textures. However, under RCP 8.5 in the late-century, the highest changes which range from −11.25
to −8.37% are projected. Meanwhile, the increase in CWR is not unconnected to the combined effects
of CO2 fertilization and elevated temperature. However, the results of this study show that under
RCP 8.5 in the late century, soybean CWR will decrease. This could be attributed to the fact that under
this scenario and year period, the negative effects of elevated temperature will likely suppress the
positive effects of CO2 fertilization.
Figure 9. Temporal changes in future CWR under RCP 4.5 and RCP 8.5 (2021–2099) relative to the
baseline (1986–2015).
3.3.2. Changes in Future Seasonal Yield
According to Figure 10, positive changes are projected for soybean yields in future periods in all
scenarios. The results show that under RCP 4.5, the change ranges from 15.19 to 19.70%, 21.04 to
28.83%, and 18.23 to 25.36% in the near future, mid-century and late-century respectively. While
under RCP 8.5, the change ranges from 10.06 to 18.87%, 24.94 to 26.40%, and 35.09 to 39.70% in the
near future, mid-century and late-century respectively. Soybean yields will likely be benefitted by
CO2 fertilization which will have more influence than other factors such as an increase in temperature
and rainfall pattern. The rate of changes will likely depend on the concentration levels of CO2.
Figure 9. Temporal changes in future CWR under RCP 4.5 and RCP 8.5 (2021–2099) relative to thebaseline (1986–2015).
3.3.2. Changes in Future Seasonal Yield
According to Figure 10, positive changes are projected for soybean yields in future periods inall scenarios. The results show that under RCP 4.5, the change ranges from 15.19 to 19.70%, 21.04to 28.83%, and 18.23 to 25.36% in the near future, mid-century and late-century respectively. Whileunder RCP 8.5, the change ranges from 10.06 to 18.87%, 24.94 to 26.40%, and 35.09 to 39.70% in thenear future, mid-century and late-century respectively. Soybean yields will likely be benefitted by CO2
fertilization which will have more influence than other factors such as an increase in temperature andrainfall pattern. The rate of changes will likely depend on the concentration levels of CO2.Agriculture 2020, 10, x FOR PEER REVIEW 16 of 24
Figure 10. Temporal changes in future yields under RCP 4.5 and RCP 8.5 (2021–2099) relative to the
baseline (1986–2015).
3.3.3. Changes in Future Crop Water Productivity (CWP)
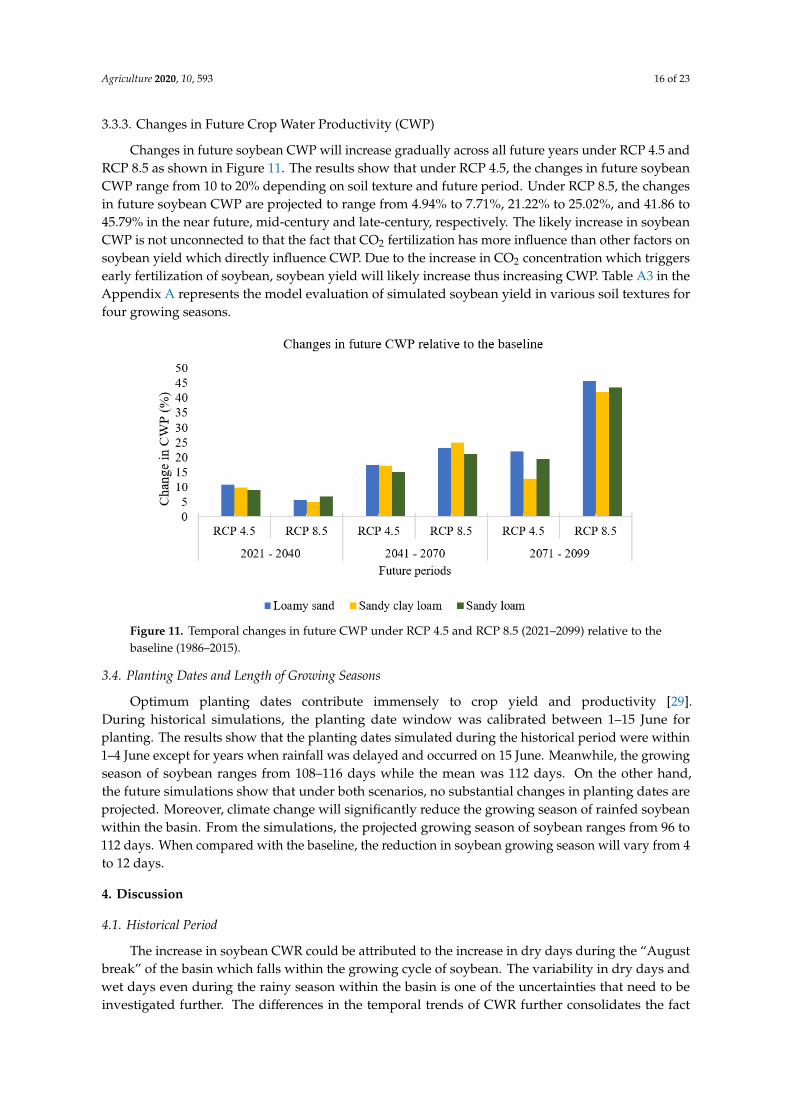
Changes in future soybean CWP will increase gradually across all future years under RCP 4.5
and RCP 8.5 as shown in Figure 11. The results show that under RCP 4.5, the changes in future
soybean CWP range from 10 to 20% depending on soil texture and future period. Under RCP 8.5, the
changes in future soybean CWP are projected to range from 4.94% to 7.71%, 21.22% to 25.02%, and
41.86 to 45.79% in the near future, mid-century and late-century, respectively. The likely increase in
soybean CWP is not unconnected to that the fact that CO2 fertilization has more influence than other
factors on soybean yield which directly influence CWP. Due to the increase in CO2 concentration
which triggers early fertilization of soybean, soybean yield will likely increase thus increasing CWP.
Table A3 in the Appendix A represents the model evaluation of simulated soybean yield in various
soil textures for four growing seasons.
Figure 11. Temporal changes in future CWP under RCP 4.5 and RCP 8.5 (2021–2099) relative to the
baseline (1986–2015).
Figure 10. Temporal changes in future yields under RCP 4.5 and RCP 8.5 (2021–2099) relative to thebaseline (1986–2015).
Agriculture 2020, 10, 593 16 of 23
3.3.3. Changes in Future Crop Water Productivity (CWP)
Changes in future soybean CWP will increase gradually across all future years under RCP 4.5 andRCP 8.5 as shown in Figure 11. The results show that under RCP 4.5, the changes in future soybeanCWP range from 10 to 20% depending on soil texture and future period. Under RCP 8.5, the changesin future soybean CWP are projected to range from 4.94% to 7.71%, 21.22% to 25.02%, and 41.86 to45.79% in the near future, mid-century and late-century, respectively. The likely increase in soybeanCWP is not unconnected to that the fact that CO2 fertilization has more influence than other factors onsoybean yield which directly influence CWP. Due to the increase in CO2 concentration which triggersearly fertilization of soybean, soybean yield will likely increase thus increasing CWP. Table A3 in theAppendix A represents the model evaluation of simulated soybean yield in various soil textures forfour growing seasons.
Agriculture 2020, 10, x FOR PEER REVIEW 16 of 24
Figure 10. Temporal changes in future yields under RCP 4.5 and RCP 8.5 (2021–2099) relative to the
baseline (1986–2015).
3.3.3. Changes in Future Crop Water Productivity (CWP)
Changes in future soybean CWP will increase gradually across all future years under RCP 4.5
and RCP 8.5 as shown in Figure 11. The results show that under RCP 4.5, the changes in future
soybean CWP range from 10 to 20% depending on soil texture and future period. Under RCP 8.5, the
changes in future soybean CWP are projected to range from 4.94% to 7.71%, 21.22% to 25.02%, and
41.86 to 45.79% in the near future, mid-century and late-century, respectively. The likely increase in
soybean CWP is not unconnected to that the fact that CO2 fertilization has more influence than other
factors on soybean yield which directly influence CWP. Due to the increase in CO2 concentration
which triggers early fertilization of soybean, soybean yield will likely increase thus increasing CWP.
Table A3 in the Appendix A represents the model evaluation of simulated soybean yield in various
soil textures for four growing seasons.
Figure 11. Temporal changes in future CWP under RCP 4.5 and RCP 8.5 (2021–2099) relative to the
baseline (1986–2015).
Figure 11. Temporal changes in future CWP under RCP 4.5 and RCP 8.5 (2021–2099) relative to thebaseline (1986–2015).
3.4. Planting Dates and Length of Growing Seasons
Optimum planting dates contribute immensely to crop yield and productivity [29].During historical simulations, the planting date window was calibrated between 1–15 June forplanting. The results show that the planting dates simulated during the historical period were within1–4 June except for years when rainfall was delayed and occurred on 15 June. Meanwhile, the growingseason of soybean ranges from 108–116 days while the mean was 112 days. On the other hand,the future simulations show that under both scenarios, no substantial changes in planting dates areprojected. Moreover, climate change will significantly reduce the growing season of rainfed soybeanwithin the basin. From the simulations, the projected growing season of soybean ranges from 96 to112 days. When compared with the baseline, the reduction in soybean growing season will vary from 4to 12 days.
4. Discussion
4.1. Historical Period
The increase in soybean CWR could be attributed to the increase in dry days during the “Augustbreak” of the basin which falls within the growing cycle of soybean. The variability in dry days andwet days even during the rainy season within the basin is one of the uncertainties that need to beinvestigated further. The differences in the temporal trends of CWR further consolidates the fact
Agriculture 2020, 10, 593 17 of 23
that there is a high inter-seasonal variability of water requirements across different regions [5,7,9].Consequently, these uncertainties need to be unraveled as this will go a long way in provoking breedingof climate-resilient varieties, sustainable policy formulation and implementations.
The increasing trend in yield confirms that soybean (C3 crop) has the tendency of producinghigher yields when subjected to increased temperature [13,26]. The increasing trend can, however,be attributed to elevated temperature and the slight increase of CO2 concentration. For CWP, the resultsstress the fact that soybean cultivated on sandy and loamy soils are productive and have higher waterproductivities [26]. Moreover, the CWP is increasing slightly which follows the pattern of soybeanyields. This shows the urgent need to improve crop yields and at the same time improve CWP foroptimum growth and production [42]. Therefore, the impact of climate change on CWP within thebasin is significantly based on the baseline period. In terms of planting dates, the simulated plantingdates are similar to the usual planting dates of the crops within the basin [27]. This further consolidatesthe fact that planting date is a huge factor that contributes to crop productivity. Delay in the onset ofrainfall could be challenging for farmers, thus delay or early planting dates could lead to low yieldsand productivity. Climate change has been projected to alter growing seasons [11], which will likelygive rise to quicker maturity of crops and could lead to bad quality of crops. It is worth noting that thesimulations show a gradual reduction in growing days occasioned by increased temperature and hugevariability in growing days as a result of climate variability.
4.2. Future Periods
For the future periods, under both scenarios, huge variability in CWR is projected to occur in theperiod of 2071–2099. This means that elevated temperature and increased CO2 concentration will affectCWR significantly. It is important to note that this study shows that the changes in future CWR underRCP 8.5 are somewhat different from the changes under RCP 4.5 due to increased CO2 concentrationunder RCP 8.5 compared with RCP 4.5. Even though CO2 fertilization which triggers early stomatalclosure is more significant for soybean (C3 crop) than maize and millet (C4 crops) [13,26], it will notreally affect soybean CWR within the basin except in the late-century under RCP 8.5. Similarly, the CWRof wheat, a C3 crop is also projected to decrease especially in the late-century despite temperatureincrease [43]. In addition, the consecutive dry and wet days during the growing season as projected bythe climate model could influence this factor as well. This highlights the fact that rainfall variabilityand patterns have huge impacts on crop growth and productivity [44].
In terms of future yields, the projected increase in yields can be attributed to carbon fertilization ofC3 plants such as soybean, which reveals that there will be a rapid increase in crop yield especially whensoybean yields were simulated on extremely high atmospheric CO2 concentration [13,29]. Similarly,an increase in soybean yields will likely range from 5.5 to 162% and 5 to 18% in Cameroon and WestAfrica respectively [13,29]. In contrast, soybean yield will likely decline in Sub-Saharan African [25].Moreover, the decline could be attributed to the GCM and crop models employed. The contradictoryresults in projected soybean yields further stress the fact that climate change impacts on soybean yieldsare temporal and spatially distributed as well as crop and GCM dependent. It confirms that whilesome crops will benefit from climate change, other crops will be affected negatively [7]. The resultsalso show that fluctuations in rainfall and elevated temperature will likely have a slight influence onfuture soybean yields within the basin. In other studies, the yields of wheat (C3 crop) are projected toincrease up to 13% [41] while rice (C3 crop) yield is projected to reduce by 10.36–14.36% [7]. Hence,it is still unclear if all C3 crops will be positively affected by climate change especially CO2 fertilizationand if the effects will be location-specific or not. Furthermore, in this case, the quality of soybean needsto be evaluated under elevated temperatures and increased CO2 concentration. Even though there is alikelihood of an increase in soybean yields, it is important to research on the quality of soybean underthese conditions. Achieving food security is not just about increased yields but improving the qualityof yields as well.
Agriculture 2020, 10, 593 18 of 23
Considering CWP, it is worthy to note that for each future period, soybean CWP under RCP 8.5is projected to be higher than that of RCP 4.5 which is attributable to CO2 fertilization. This trend isthe same as the future yields. In addition, the results show that as the temperature increases in thefuture years, soybean has the tendency of converting lesser crop consumptive water use into higheryields despite reduced growing seasons under both scenarios. This phenomenon can be attributed tothe claim that some C3 crops such as soybean are projected to have higher CWP under higher CO2
concentration due to the positive effect of carbon fertilization [13,26,29]. Similarly, wheat CWP willlikely increase by 14.6% [36] but CWP of another C3 crop, rice is expected to reduce by 28% under RCP8.5 in the late-century [7]. Notably, this study shows that the length of the soybean growing season isprojected to decrease. The highest decline in the growing season is projected in the late-century underRCP 8.5. However, there are still uncertainties about the effects of triggered fertilization and earlystomatal closure on the nutritional composition of crops.
Globally, food demand is increasing, hence, it is important to ensure high crop productivity.This will ensure adequate food production even sufficient for more export and will increase farmers’profits. Climate-smart agricultural practices such as soil conservation practices can help in improvingyields and CWP [42,45], thus they should be investigated under climate change scenarios. The use oforganic fertilizers, appropriate and suitable weed and pest management, cultivation of climate-resilientvarieties [9] and rainwater harvesting [46] should be encouraged by the stakeholders [9]. With theincreasing trend in temperature, most of the current crop varieties cannot withstand such elevatedtemperatures. Low yields have been recorded within Nigeria in recent times despite the ever-increasingdemand for food [20]. Hence, with the development of new crop varieties, food security could beachieved. Furthermore, another adaptation strategy that needs to be reinforced is climate informationservices [45]. Therefore, there is a need for more funding and monitoring of meteorological stations inNigeria. This will tremendously advance climate data accessibility and reliability.
Finally, it is important to state that this study was conducted with available, but limited datasuch that validation of water fluxes could not be done. Evidently, this paper forms the basis forextensive studies to be conducted that will investigate the spatial distribution of crop yield and waterrequirements using an ensemble of GCM within the basin and Nigeria at large.
5. Conclusions
The seasonal crop water requirements (CWR), crop yield and crop water productivity (CWP)of soybean in the Ogun-Ona River Basin in Nigeria based on the climate data of the baseline period(1986–2015) and future periods (2021–2099) were simulated. The study shows that soybean CWRand yield are temporarily increasing while CWP shows a slight increase. In addition, HadGEM2-ESdownscaled by RCA4 is capable of simulating the future climate of the region satisfactorily whilethe quantile mapping bias correction method performed satisfactorily in removing the biases in theprojected rainfall thus making it a reliable bias correction method. Just as the global temperature isexpected to continually rise, the climate projections of the region show that maximum temperaturewill increase by 4.4 ◦C by 2099 under RCP 8.5 while rainfall is projected to reduce by 10% in thefuture periods. The future scenarios show that changes in soybean CWR will range from 10 to −10%in the future periods under RCP 4.5 and RCP 8.5. CWR was found to be largely influenced bychanges in rainfall than temperature rise and increased CO2 concentration. The days of the growingseason of soybean will be shortened due to temperature rise. Moreover, soybean yield and CWP areprojected to have positive effects of climate change, hence increasing up to about 40% under RCP8.5. The soybean yield is significantly influenced by increasing CO2 concentration than other changesin climate parameters. The outcomes of this study certainly offer useful information that could beimplemented by stakeholders and policymakers to improve soybean productivity in Nigeria andAfrica at large.
Agriculture 2020, 10, 593 19 of 23
Last but not least, stakeholders and decision-makers should make use of research outcomes totackle food and water security. Strategies addressing climate change adaptation and water allocationshould enhance such studies worldwide to increase water and crop productivity.
Author Contributions: Methodology, O.S.D. and K.A.M.; analysis, modeling, validation and field visits, O.S.D.;resources, K.A.M. and O.S.D.; data, O.S.D. and K.A.M.; writing (original draft preparation), O.S.D.; writing (review,editing, and submission), K.A.M.; supervision, open access publication, K.A.M. All authors have read and agreedto the published version of the manuscript.
Funding: This research was funded by the African Union Commission through a research grant provided by thePan African University Institute of Water and Energy Sciences (PAUWES), Algeria.
Acknowledgments: The authors thank the African Union Commission (AUC) for funding this research, the Centrefor Sustainable Visions and Lund University for funding the publication of this paper in an open access journal.Many thanks to CORDEX for providing climate projection data in open access format. Last but not least, the authorsappreciate the anonymous reviewers that reviewed the manuscript of this paper.
Conflicts of Interest: The authors declare no conflict of interests.
Figure A1. Mean annual total rainfall of the basin from 1986 to 2015.
Figure A2. The average annual mean temperature of the basin from 1986 to 2015.
Figure A3. The crop cycle of soybeans in Nigeria (Authors’ figure; adapted/culled from [27]).
y = -0.857x + 3062.1
800
900
1000
1100
1200
1300
1400
1500
1600
1700
1986 1990 1994 1998 2002 2006 2010 2014
Rai
nfa
ll (
mm
)
Year
Mean annual total rainfall from 1986 to 2015
y = 0.0166x - 5.8117
26.6
26.8
27
27.2
27.4
27.6
27.8
28
28.2
1986 1990 1994 1998 2002 2006 2010 2014
Mea
n t
emp
erat
ure
(°C
)
Year
Average annual mean temperature from 1986 to 2015
Figure A1. Mean annual total rainfall of the basin from 1986 to 2015.
Agriculture 2020, 10, 593 20 of 23
Agriculture 2020, 10, x FOR PEER REVIEW 20 of 24
Figure A1. Mean annual total rainfall of the basin from 1986 to 2015.
Figure A2. The average annual mean temperature of the basin from 1986 to 2015.
Figure A3. The crop cycle of soybeans in Nigeria (Authors’ figure; adapted/culled from [27]).
y = -0.857x + 3062.1
800
900
1000
1100
1200
1300
1400
1500
1600
1700
1986 1990 1994 1998 2002 2006 2010 2014
Rai
nfa
ll (
mm
)
Year
Mean annual total rainfall from 1986 to 2015
y = 0.0166x - 5.8117
26.6
26.8
27
27.2
27.4
27.6
27.8
28
28.2
1986 1990 1994 1998 2002 2006 2010 2014
Mea
n t
emp
erat
ure
(°C
)
Year
Average annual mean temperature from 1986 to 2015
Figure A2. The average annual mean temperature of the basin from 1986 to 2015.
Agriculture 2020, 10, x FOR PEER REVIEW 20 of 24
Figure A1. Mean annual total rainfall of the basin from 1986 to 2015.
Figure A2. The average annual mean temperature of the basin from 1986 to 2015.
Figure A3. The crop cycle of soybeans in Nigeria (Authors’ figure; adapted/culled from [27]).
y = -0.857x + 3062.1
800
900
1000
1100
1200
1300
1400
1500
1600
1700
1986 1990 1994 1998 2002 2006 2010 2014
Rai
nfa
ll (
mm
)
Year
Mean annual total rainfall from 1986 to 2015
y = 0.0166x - 5.8117
26.6
26.8
27
27.2
27.4
27.6
27.8
28
28.2
1986 1990 1994 1998 2002 2006 2010 2014
Mea
n t
emp
erat
ure
(°C
)
Year
Average annual mean temperature from 1986 to 2015
Figure A3. The crop cycle of soybeans in Nigeria (Authors’ figure; adapted/culled from [27]).
Table A2. The non-conservative crop parameters are used for calibration and validation.
Parameters Unit Soybean
Plant population Plants/ha 352,000Initial canopy cover % of canopy cover 0.40Maximum canopy cover % of canopy cover 90Days from planting to emergence GDD (Day) 105 (7)Days from planting to maximum canopy cover GDD (Day) 1485 (99)Days from planting to senescence GDD (Day) 1725 (115)Days from planting to maturity GDD (Day) 1800 (120)Days from planting to flowering GDD (Day) 607 (45)Days from planting to maximum rooting depth GDD (Day) 1635 (109)Length building up to HI GDD (Day) 510 (34)Duration of flowering GDD (Day) 420 (28)Maximum effective rooting depth m 1.6Normalized water productivity for climate and CO2 g/m2 15.0Soil fertility stress - moderateSink strength under elevated CO2 % 50Reference harvest index % 40
Agriculture 2020, 10, 593 21 of 23
Table A3. Model evaluation of simulated soybean yield in various soil textures for four growing seasons.
1. Baarsch, F.; Granadillos, J.R.; Hare, W.; Knaus, M.; Krapp, M.; Schaeffer, M.; Lotze-Campen, H. The impact ofclimate change on incomes and convergence in Africa. World Dev. 2020, 126, 104699. [CrossRef]
2. Besada, H.; Werner, K. An assessment of the effects of Africa’s water crisis on food security and management.Int. J. Water Resour. Dev. 2015, 31, 120–133. [CrossRef]
3. Sylla, M.B.; Nikiema, P.M.; Gibba, P.; Kebe, I.; Klutse, N.A.B. Climate change over West Africa: Recent trendsand future projections. Adapt. Clim. Change Var. Rural West Afr. 2016, 25–40. [CrossRef]
4. FAO. The State of the World’s Land and Water Resources for Food and Agriculture: Managing Systems at Risk;Routledge: London, UK, 2016. [CrossRef]
5. FAO. Water for Sustainable Food and Agriculture. In A Report Produced for the G20 Presidency of Germany;FAO: Rome, Italy, 2017.
6. Rahman, M.A.; Haq, M.E.; Anjum, N. Potential crop water requirements of dry season boro rice underclimate change in north-east hydrological region of Bangladesh. Agric. Eng. Int. CIGR J. 2019, 21, 1–13.
7. Boonwichai, S.; Shrestha, S.; Babel, M.S.; Weesakul, S.; Datta, A. Climate change impacts on irrigation waterrequirement, crop water productivity and rice yield in the Songkhram River Basin, Thailand. J. Clean. Prod.2018, 198, 1157–1164. [CrossRef]
8. Masson-Delmotte, V.; Zhai, P.; Pörtner, D.; Roberts, J.; Skea, P.R.; Shukla, A.; Pirani, W.; Moufouma-Okia, C.;Péan, R.; Pidcock, S.; et al. (Eds.) Global Warming of 1.5 ◦C. An IPCC Special Report on the Impacts of GlobalWarming of 1.5◦C Above Pre-Industrial Levels and Related Global Greenhouse Gas Emission Pathways, in the Contextof Strengthening the Global Response to the Threat of Climate Change; World Meteorological Organization: Geneva,Switzerland, 2018; p. 32.
9. Durodola, O.S.; Mourad, K.A. Modelling Maize Yield and Water Requirements under Different ClimateChange Scenarios. Climate 2020, 8, 127. [CrossRef]
10. Basso, B.; Hyndman, D.W.; Kendall, A.D.; Grace, P.R.; Robertson, G.P. Can impacts of climate changeand agricultural adaptation strategies be accurately quantified if crop models are annually re-initialized?PLoS ONE 2015, 10, e0127333. [CrossRef]
11. Ding, Y.; Wang, W.; Song, R.; Shao, Q.; Jiao, X.; Xing, W. Modeling spatial and temporal variability of theimpact of climate change on rice irrigation water requirements in the middle and lower reaches of theYangtze River, China. Agric. Water Manag. 2017, 193, 89–101. [CrossRef]
12. Li, J.; Zhu, T.; Mao, X.; Adeloye, A.J. Modeling crop water consumption and water productivity in the middlereaches of Heihe River Basin. Comput. Electron. Agric. 2016, 123, 242–255. [CrossRef]
13. Roudier, P.; Sultan, B.; Quirion, P.; Berg, A. The impact of future climate change on West African crop yields:What does the recent literature say? Glob. Environ. Change 2011, 21, 1073–1083. [CrossRef]
14. Wang, J.; Liu, X.; Cheng, K.; Zhang, X.; Li, L.; Pan, G. Winter wheat water requirement and utilization efficiencyunder simulated climate change conditions: A Penman-Monteith model evaluation. Agric. Water Manag.2018, 197, 100–109. [CrossRef]
15. Adeboye, O.B.; Schultz, B.; Adekalu, K.O.; Prasad, K.C. Performance evaluation of AquaCrop in simulatingsoil water storage, yield, and water productivity of rainfed soybean (Glycine max L. merr) in Ile-Ife, Nigeria.Agric. Water Manag. 2019, 213, 1130–1146. [CrossRef]
16. Hula, M.A.; Udoh, J.C. An assessment of the impact of flood events in Makurdi, Nigeria. Civil. Environ. Res.2015, 7, 53–60.
17. Idowu, A.A.; Ayoola, S.O.; Opele, A.I.; Ikenweiwe, N.B. Impact of Climate Change in Nigeria.Iran. J. Energy Environ. 2011, 2, 145–152.
18. Durodola, O.S. The Impact of Climate Change Induced Extreme Events on Agriculture and Food Security:A Review on Nigeria. Agric. Sci. 2019, 10, 487–498. [CrossRef]
19. Idumah, F.O.; Mangodo, C.; Ighodaro, U.B.; Owombo, P.T. Climate Change and Food Production in Nigeria:Implication for Food Security in Nigeria. J. Agric. Sci. 2016, 8, 74. [CrossRef]
20. Olayide, O.E.; Tetteh, I.K.; Popoola, L. Differential impacts of rainfall and irrigation on agricultural productionin Nigeria: Any lessons for climate-smart agriculture? Agric. Water Manag. 2016, 178, 30–36. [CrossRef]
21. Mourad, K.A.; Gaese, H.; Jabarin, S.A. Economic value of tree fruit production in Jordan Valley from a virtualwater perspective. Water Resour. Manag. 2010, 24, 2021–2034. [CrossRef]
22. Mourad, K.A.; Berndtsson, R. Grapes as an alternative crop for water saving. In Grapes: Cultivation, Varietiesand Nutritional Uses; Murphy, R.P., Steifler, C.K., Eds.; Nova Science Publishers Inc.: London, UK, 2012;pp. 183–192.
23. Ewaid, S.H.; Abed, S.A.; Al-Ansari, N. Crop water requirements and irrigation schedules for some majorcrops in southern Iraq. Water 2019, 11, 756. [CrossRef]
24. Raes, D.; Steduto, P.; Hsiao, T.C.; Fereres, E. Aquacrop-The FAO crop model to simulate yield response towater: II. main algorithms and software description. Agron. J. 2009, 101, 438–447. [CrossRef]
25. Gbegbelegbe, S.; Alene, A.; Kamara, A.; Wiebe, K.; Manyong, V.; Abdoulaye, T.; Mkandawire, P. Ex-anteevaluation of promising soybean innovations for sub-Saharan Africa. Food Energy Secur. 2019, 8, 1–16.[CrossRef] [PubMed]
26. Steduto, P.; Hsiao, T.C.; Fereres, E.; Raes, D. Crop. Yield Response to Water; FAO Irrigation and Drainage:Rome, Italy, 2012.
27. Dugje, I.Y.; Omoigui, L.O.; Ekeleme, F.; Bandyopadhyay, R.; Lava Kumar, P.; Kamara, A.Y. Farmers’ Guide toSoybean Production in Northern Nigeria; International Institute of Tropical Agriculture: Ibadan, Nigeria, 2009.
28. Kumagai, E.; Kumagai, N.; Masuya, Y.; Shimono, H. Phenotypic Plasticity Conditions the Response ofSoybean Seed Yield to Elevated Atmospheric CO2 Concentration. Plant Physol. 2015, 169, 2021–2029.[CrossRef] [PubMed]
29. Tingem, M.; Rivington, M. Adaptation for crop agriculture to climate change in Cameroon: Turning on theheat. Mitig. Adapt. Strateg. Glob. Change 2009, 14, 153–168. [CrossRef]
31. Hsiao, T.C.; Heng, L.; Steduto, P.; Rojas-Lara, B.; Raes, D.; Fereres, E. Aquacrop-The FAO crop model to simulateyield response to water: III. Parameterization and testing for maize. Agron. J. 2009, 101, 448–459. [CrossRef]
32. Allen, R.G.; Pereira, L.S.; Raes, D.; Smith, M. Crop Evapotranspiration: Guidelines for Computing Crop WaterRequirements; FAO Irrigation and Drainage Paper: Rome, Italy, 1998.
33. Fisher, D.K.; Pringle, H.C. III Evaluation of alternative methods for estimating reference evapotranspiration.Agric. Sci. 2013, 4, 51–60. [CrossRef]
34. FAO. AquaCrop Training Handbook-Book I. Understanding AquaCrop; Food and Agriculture Organisation: Rome,Italy, 2017.
35. Fischer, G.; Nachtergaele, F.; Prieler, S.; van Velthuizen, H.T.; Verelst, L.; Wiberg, D. Harmonized world soildatabase v1.2. Glob. Agro Ecol. Zones Assess. Agric. 2008, 8, 10.
36. Sotona, T.; Salako, F.K.; Adesodun, J.K. Soil physical properties of selected soil series in relation to compaction anderosion on farmers’ fields at Abeokuta, southwestern Nigeria. Arch. Agron. Soil Sci. 2014, 60, 841–857. [CrossRef]
37. Luhunga, P.M. Assessment of the Impacts of Climate Change on Maize Production in the Southern andWestern Highlands Sub-agro Ecological Zones of Tanzania. Front. Environ. Sci. 2017, 5, 51. [CrossRef]
38. Akinsanola, A.A.; Ajayi, V.O.; Adejare, A.T.; Adeyeri, O.E.; Gbode, I.E.; Ogunjobi, K.O.; Abolude, A.T.Evaluation of rainfall simulations over West Africa in dynamically downscaled CMIP5 global circulationmodels. Theor. Appl. Climatol. 2018, 132, 437–450. [CrossRef]
39. Ayugi, B.; Tan, G.; Niu, R.; Babaousmail, H.; Ojara, M.; Wido, H.; Ongoma, V. Quantile Mapping BiasCorrection on Rossby Centre Regional Climate Models for Precipitation Analysis over Kenya, East Africa.Water 2020, 12, 801. [CrossRef]
40. Heo, J.H.; Ahn, H.; Shin, J.Y.; Kjeldsen, T.R.; Jeong, C. Probability distributions for a quantile mappingtechnique for a bias correction of precipitation data: A case study to precipitation data under climate change.Water 2019, 11, 1475. [CrossRef]
41. Liben, F.M.; Wortmann, C.S.; Yang, H.; Lindquist, J.L.; Tadesse, T.; Wegary, D. Crop model and weather datageneration evaluation for conservation agriculture in Ethiopia. Field Crops Res. 2018, 228, 122–134. [CrossRef]
42. Adeboye, O.B.; Schultz, B.; Adekalu, K.O.; Prasad, K. Soil water storage, yield, water productivity andtranspiration efficiency of soybean (Glyxine max L.Merr) as affected by soil surface management in Ile-Ife,Nigeria. Int. Soil Water Conserv. Res. 2017, 5, 141–150. [CrossRef]
43. Chattaraj, S.; Chakraborty, D.; Sehgal, V.K.; Paul, R.K.; Singh, S.D.; Daripa, A.; Pathak, H. Predicting theimpact of climate change on water requirement of wheat in the semi-arid Indo-Gangetic Plains of India.Agric. Ecosyst. Environ. 2014, 197, 174–183. [CrossRef]
44. Sultan, B.; Guan, K.; Kouressy, M.; Biasutti, M.; Piani, C.; Hammer, G.L.; Lobell, D.B. Robust features of futureclimate change impacts on sorghum yields in West Africa. Environ. Res. Lett. 2014, 9, 104006. [CrossRef]
45. Partey, S.T.; Zougmoré, R.B.; Ouédraogo, M.; Campbell, B.M. Developing climate-smart agriculture to faceclimate variability in West Africa: Challenges and lessons learnt. J. Clean. Prod. 2018, 187, 285–295. [CrossRef]
46. Durodola, O.S.; Bwambale, J.; Nabunya, V. Using every drop: Rainwater harvesting for food security inMbale, Uganda. Water Pract. Technol. 2020, 15, 295–310. [CrossRef]
Publisher’s Note: MDPI stays neutral with regard to jurisdictional claims in published maps and institutionalaffiliations.