COMPREHENSIVE DRINKING WATER SOURCE-TO-TAP ASSESSMENT GUIDELINE MODULE 7 CHARACTERIZE RISKS FROM SOURCE TO TAP 2010 Ministry of Healthy Living and Sport Multiple Barrier Approach Source Protection Treatment Water System Maintenance Water Quality Monitoring Operator Training Emergency Response Training
Transcript
COMPREHENSIVE DRINKING WATER
SOURCE-TO-TAP ASSESSMENT GUIDELINE
MODULE 7 CHARACTERIZE RISKS FROM SOURCE TO TAP
2010 Ministry of Healthy Living and Sport
Multiple Barrier
Approach
Source Protection
Treatment
Water System
Maintenance
Water Quality
Monitoring
Operator Training
Emergency Response Training
COMPREHENSIVE DRINKING WATER SOURCE-TO-TAP ASSESSMENT GUIDELINE
MODULE 7: CHARACTERIZE RISKS FROM SOURCE TO TAP ~ 2 ~
Comprehensive Drinking Water
Source-to-Tap Assessment Guideline Process
Here are the steps in the source-to-tap assessment process, through the Introduction and eight modules. Note that the Introduction should be read prior to undertaking any assessment.
COMPREHENSIVE DRINKING WATER SOURCE-TO-TAP ASSESSMENT GUIDELINE
MODULE 7: CHARACTERIZE RISKS FROM SOURCE TO TAP ~ 3 ~
TABLE OF CONTENTS 1. INTRODUCTION ............................................................................................................................... 5
2.1 EVALUATE THE ROBUSTNESS OF DRINKING WATER PROTECTION BARRIERS ............................................................................................................................... 7
2.3 EVALUATE THE WATER SUPPLY SYSTEM AS AN INTEGRATED WHOLE .................................................................................................................................. 19 2.3.1 STRENGTHS, WEAKNESSES, OPPORTUNITIES AND
THREATS (SWOT) ANALYSIS ....................................................................... 19 2.3.2 STATEMENT OF WATER SUPPLY SYSTEM PERFORMANCE .......... 20
7‐1. HINTS FOR EVALUATING THE STRENGTH AND RELIABILITY OF DRINKING WATER PROTECTION BARRIERS ............................................................................................ 7
7‐2. QUALITATIVE RISK ASSESSMENT DEFINITIONS ............................................................. 8 7‐3. COMMON REGULATORY VIOLATIONS UNDER THE DRINKING WATER
PROTECTION ACT ......................................................................................................................... 12 7‐4. EXAMPLES OF KEY WATER SUPPLY SYSTEM STRENGTHS ..................................... 19 7‐5. EXAMPLES OF MAJOR WATER SUPPLY SYSTEM WEAKNESSES ............................ 19 7‐6. EXAMPLES OF KEY OPPORTUNITIES FOR A WATER SUPPLY SYSTEM .............. 19 7‐7. EXAMPLES OF MAJOR THREATS TO A WATER SUPPLY SYSTEM .......................... 20 7‐8. INTEGRATED DRINKING WATER SOURCE‐TO‐TAP RISK ASSESSMENT
COMPREHENSIVE DRINKING WATER SOURCE-TO-TAP ASSESSMENT GUIDELINE
MODULE 7: CHARACTERIZE RISKS FROM SOURCE TO TAP ~ 5 ~
1. INTRODUCTION Every water system is vulnerable to some drinking water hazards. Aging distribution systems, pressures on the source, uncontrolled cross‐connections, and inadequate resources are some common hazards. The objectives of Modules 1 to 6 are to identify and describe hazards and vulnerabilities throughout the water supply system. The purpose of Module 7 is to bring together all the information on the water supply system—its hazards and vulnerabilities identified through Modules 1 to 6—into a comprehensive assessment of the major water supply elements and the system as an integrated whole. While the focus remains on the provision of safe drinking water, unrelated risks—such as operational, environmental or legal risks—should be noted outside this assessment. Module 7 is the focal point of the source‐to‐tap assessment process. It includes a structured approach for identifying the areas of greatest risk, and fostering an understanding of the strengths and weaknesses throughout a water supply system. Module 7 involves: 1. Evaluating individual drinking water protection barriers and the multiple barrier
(multibarrier) system as a whole. 2. Characterizing risk for each drinking water hazard identified in Modules 1 to 6. 3. Assessing the water supply system’s primary strengths, weaknesses, major threats, and
key opportunities for significantly improving drinking water protection. Evaluating the multiple barrier system is performed based on assessments of the existing barrier components in Modules 1 to 6. It involves assessing how strong and reliable each barrier is, and how robust the multiple barrier system is as a whole. Risk characterization is a process of assigning a risk level to each of the hazards to separate serious, imminent risks from those that are less significant. In a risk assessment it is important to distinguish between the concepts of hazard and risk. A hazard is an agent or situation with the potential for causing harm. Risk is the combination of the likelihood that a hazard will cause harm, and the expected magnitude and duration of the harm if it were to occur (NHMRC/ARMCANZ, 2001). When characterizing risk, it is often helpful to identify the value or endpoint of concern we are protecting. In the case of source‐to‐tap assessments in BC, the end point is a sufficient and reliable supply of safe and aesthetically acceptable water. Any event, condition, action or inaction that could threaten this end point is a hazard. The integrated water system evaluation synthesizes the information compiled in the source‐to‐tap assessment to identify strengths and weaknesses, major threats and opportunities, and evaluate the ability of a water supply system to reliably provide sufficient volumes of safe drinking water to its consumers. The results of Module 7 form the foundation for building a set of specific, prioritized actions to safeguard drinking water in Module 8.
COMPREHENSIVE DRINKING WATER SOURCE-TO-TAP ASSESSMENT GUIDELINE
MODULE 7: CHARACTERIZE RISKS FROM SOURCE TO TAP ~ 6 ~
In many cases, risks may be linked to one another. For example, a water system that lacks financial resources will likely have few staff and technical resources, which results in a lack of financial planning and fewer resources as time goes on. Some risks result in higher consequences when combined. For example, when a water system lacks treatment and has no emergency response plan, the risk to public health is increased. By identifying links between risks, a more informed picture can be developed for when risks are prioritized and recommendations for mitigation are developed. Risks that have linkages with one another should be should be recorded in the “Related Risks” column of the risk characterization table. All members of the assessment team should collectively be involved in Module 7 because it requires information synthesis and analysis from source to tap, and subjective professional judgements to be made. The participation and combined expertise of the entire source‐to‐tap assessment team will help balance biases, provide a more accurate and integrated assessment of risks, and produce more credible conclusions.
1.1 Module 7 Assessment Team A broad range of issues can exist in a water supply system from source to tap. As a result, comprehensive drinking water assessments require a multidisciplinary assessment team rather than a single assessor. Each module of the Comprehensive Drinking Water Source‐to‐Tap Assessment Guideline requires some specialized skills and a unique spectrum of knowledge related to water sources and systems. Collectively, the assessment team for Module 7 should have the knowledge and experience required for the modules being incorporated into the risk characterization process. See “Assessment Team” sections in each module used in the overall assessment.
Multiple Barrier
Approach
Source Protection
Treatment
Water System
Maintenance
Water Quality
Monitoring
Operator Training
Emergency Response Training
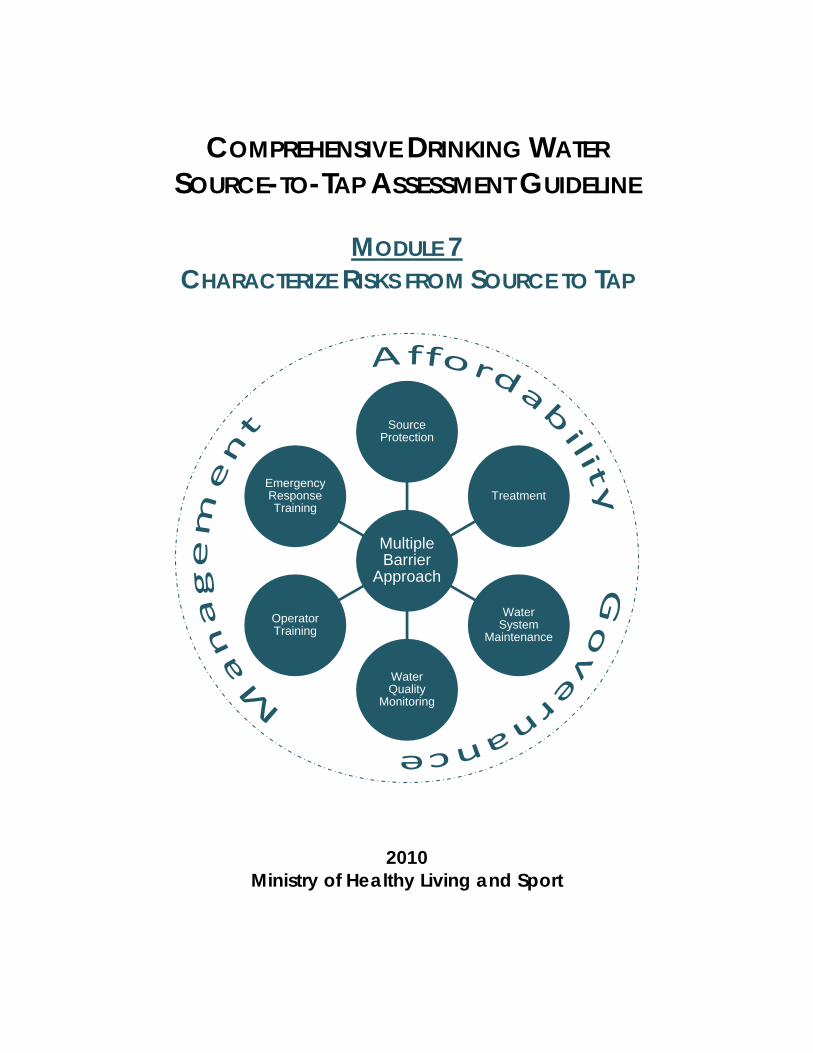
Figure 7-1. Diagram of the Multiple Barrier System of Drinking Water Protection
COMPREHENSIVE DRINKING WATER SOURCE-TO-TAP ASSESSMENT GUIDELINE
MODULE 7: CHARACTERIZE RISKS FROM SOURCE TO TAP ~ 7 ~
2. ASSESSMENT COMPONENTS
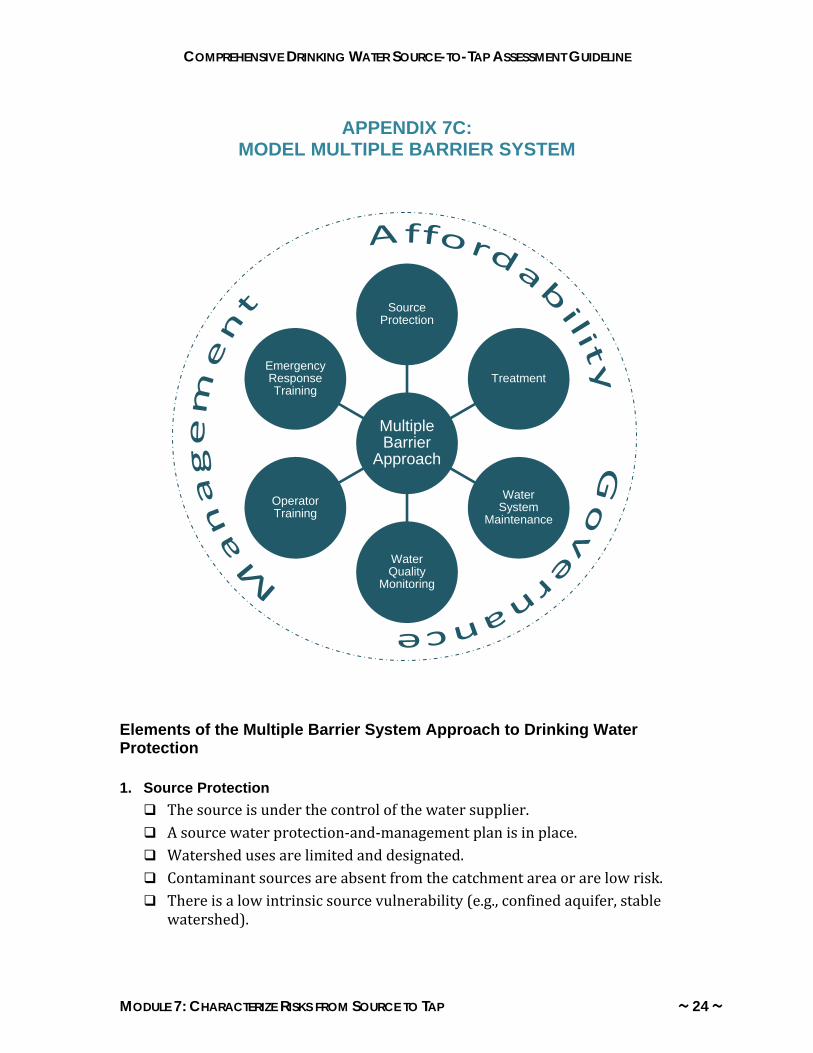
2.1. Evaluate the Robustness of Drinking Water Protection Barriers The multiple barrier system (Figure 7‐1) is comprised of the following six barriers: 1. Source protection. 2. Treatment. 3. Water system maintenance. 4. Water monitoring. 5. Operator training. 6. Emergency response planning. And three supporting mechanisms: 1. Sound water‐supply system management. 2. Affordability. 3. Effective governance.
Barriers represent a collection of preventative strategies to protect drinking water. The six barriers work in unison to increase safety and confidence in the system. For a multiple barrier system to be effective, all barriers should be present so that if one barrier fails, others are in place to compensate. Sound management, effective governance and affordability are the supporting mechanisms that make a robust multiple barrier system possible. The multiple barrier system can be thought of as a safety net: all barriers intertwined working to safeguard drinking water quality and quantity. Vulnerabilities in the system represent holes in the safety net. Some holes are small and some are large. The more holes there are, the greater the chance the safety net will fail. Evaluating the multiple barrier system reveals vulnerabilities that weaken the drinking water safety net. Evaluating the robustness of barriers and their supporting mechanisms in a water supply system involves assessing the strength and reliability of each barrier, and the multiple barrier system as
an integrated whole. Strength refers to the level of effectiveness of the barrier, while reliability indicates how dependable the barrier is. When evaluating barriers, either a
Box 7-1. Hints for Evaluating the Strength and Reliability of Drinking Water Protection Barriers Strength What protective/preventative measures form the barrier?
Are the measures effective? Are they enough?
In the professional opinion of the assessment team, how adequate is this set of measures in protecting the potability and availability of water.
What are the gaps in the barrier? Where are there deficiencies?
Reliability Have there been previous incidents where the barrier or its components have been ineffective in protecting drinking water?
Could the barrier be relied upon in most circumstances (e.g., 95% of the time)?
COMPREHENSIVE DRINKING WATER SOURCE-TO-TAP ASSESSMENT GUIDELINE
MODULE 7: CHARACTERIZE RISKS FROM SOURCE TO TAP ~ 8 ~
descriptive approach (see Box 7‐1) or a rating system developed by assessors may be used. Either way, conclusions should be substantiated by facts presented in the assessment report. A model multiple barrier system for drinking water protection is provided in Appendix 7C as a yardstick against which to evaluate each barrier. Understanding the robustness of drinking water protection barriers directly feeds into the risk assessment as it provides information to define the level of vulnerability to a hazard.
2.2. Assess Risk for Hazards/Vulnerabilities Identified in Modules 1 to 6
Approaches to risk characterization range from qualitative to semi‐quantitative and fully quantitative methods. As a minimum, assessment teams should use a qualitative risk characterization process, such as the one presented here or in Appendix 7D. The qualitative risk assessment shown in this section is simple enough even for small water supply systems to apply with professional assistance. Assessors may adapt the risk assessment framework as necessary, and depending on resources available and circumstances, more quantitative approaches may be appropriate.
Risk = Likelihood × Consequence Risk can be determined as the product of likelihood and consequence. Likelihood is the chance that a hazard will actually compromise drinking water quality or quantity, and pose a public health threat. Consequence is the combination of the severity, nature, and duration of an event, the proportion of the population affected, and type of health consequences. Box 7‐2 contains definitions of qualitative risk assessment terminology used in this section. Box 7-2. Qualitative Risk Assessment Definitions Hazard: An event, condition, action or inaction that may pose a threat to human health or a sustainable supply of water. Hazards are the agents of harm—events, conditions, actions, inactions—that have the potential to impact the safety or availability of the water supply. Consequence: The nature and degree of impacts if a hazard does occur. The measure of consequence helps us understand what the predicted nature, severity, duration, and extent of the impact this unabated threat could have on an unprotected water system. Likelihood: A timebound estimate of the probability that a harmful event, condition, action or inaction would occur and that negative impacts would result. Likelihood is a measure of the chance that a hazard would occur and cause harm within a defined time frame, such as 10, 15 or 25 years. For example, with all else being equal, existing hazards have a higher risk than hazards unlikely to occur over the next 10 years. Risk: The combination of the likelihood that a hazard will occur and cause harm, and the extent and degree of that harm.
COMPREHENSIVE DRINKING WATER SOURCE-TO-TAP ASSESSMENT GUIDELINE
MODULE 7: CHARACTERIZE RISKS FROM SOURCE TO TAP ~ 9 ~
In drinking water supply systems, the existence or absence of preventative or protective measures will influence the likelihood that a hazard will occur, and the extent and degree of resulting harm. In this simplified risk assessment, existing barriers need to be taken into consideration when assigning likelihood and consequence ratings. The modified risk assessment methodology presented in Appendix 7D estimates the risk posed by the hazard to an unprotected water supply system (unabated risk), as well as the overall risk a hazard poses considering the barriers in place to protect against the hazard (abated risk).
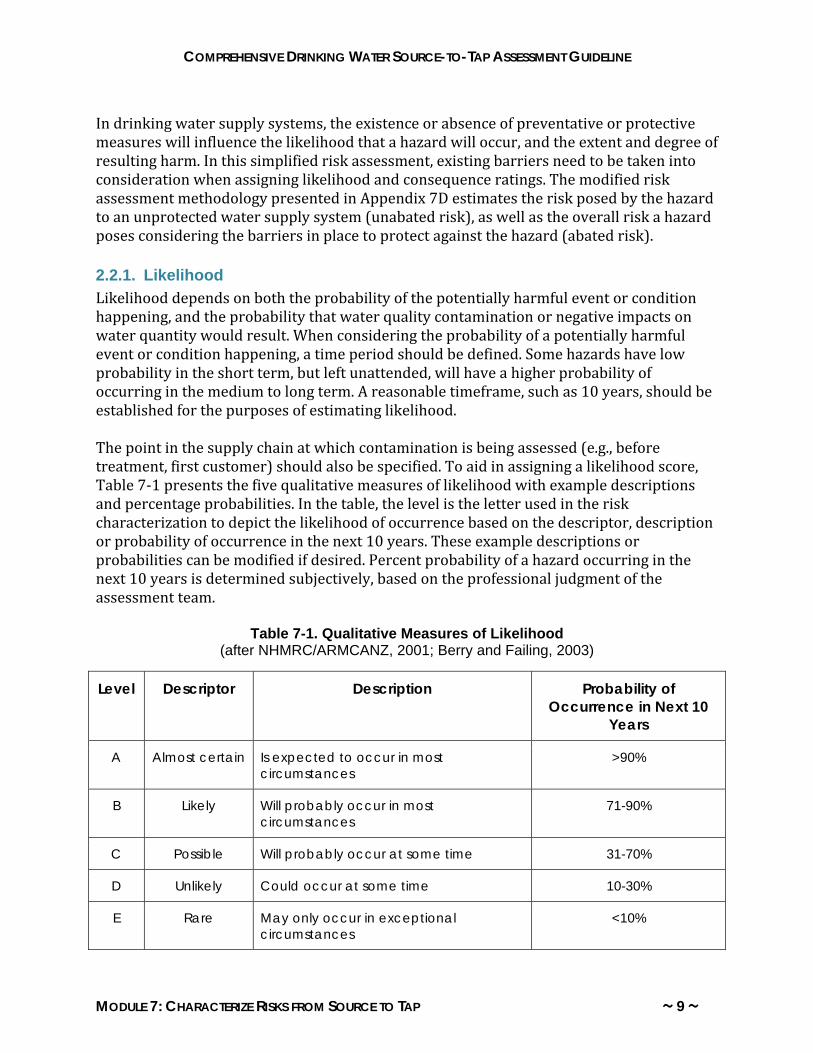
2.2.1. Likelihood Likelihood depends on both the probability of the potentially harmful event or condition happening, and the probability that water quality contamination or negative impacts on water quantity would result. When considering the probability of a potentially harmful event or condition happening, a time period should be defined. Some hazards have low probability in the short term, but left unattended, will have a higher probability of occurring in the medium to long term. A reasonable timeframe, such as 10 years, should be established for the purposes of estimating likelihood. The point in the supply chain at which contamination is being assessed (e.g., before treatment, first customer) should also be specified. To aid in assigning a likelihood score, Table 7‐1 presents the five qualitative measures of likelihood with example descriptions and percentage probabilities. In the table, the level is the letter used in the risk characterization to depict the likelihood of occurrence based on the descriptor, description or probability of occurrence in the next 10 years. These example descriptions or probabilities can be modified if desired. Percent probability of a hazard occurring in the next 10 years is determined subjectively, based on the professional judgment of the assessment team.
Table 7-1. Qualitative Measures of Likelihood (after NHMRC/ARMCANZ, 2001; Berry and Failing, 2003)
Level Descriptor Description Probability of Occurrence in Next 10
Years
A Almost certain Is expected to occur in most circumstances
>90%
B Likely Will probably occur in most circumstances
71-90%
C Possible Will probably occur at some time 31-70%
D Unlikely Could occur at some time 10-30%
E Rare May only occur in exceptional circumstances
<10%
COMPREHENSIVE DRINKING WATER SOURCE-TO-TAP ASSESSMENT GUIDELINE
MODULE 7: CHARACTERIZE RISKS FROM SOURCE TO TAP ~ 10 ~
2.2.2. Consequence If a drinking water hazard does manifest, the nature and potential degree of effects are estimated by measures of consequence. Impacts or consequences pertinent to the comprehensive source‐to‐tap assessment are: • Unacceptable1 water quality at point of intake (i.e., well or intake), after treatment,
anywhere in the distribution system or point of use. • Potential for acute or long‐term health impacts for water consumers. • Loss of or significant reduction in source water volume or source capacity. Descriptive measures of consequence are shown in Table 7‐2 as a guide to assigning scores. A number of aspects should be considered when evaluating the potential consequences of drinking water hazards. These components of consequence are listed below with questions that could be asked in estimating consequences: • Nature of the event/condition.
o Is the hazard a water quantity or quality issue? Is its cause natural or anthropogenic (caused by human activity)?
o If the hazard is a water quality issue, what is the nature of contaminant? Is it a pathogenic or chemical contaminant? Are there acute or chronic health effects associated with the contaminant?
• Severity of the impact.
o What is the expected magnitude of the contamination or water shortage? Is either contaminant dilution or attenuation an issue? How severe is the problem?
o What type of health effects could result? How serious are the potential health effects? Are the health effects likely to be immediate or appear over a longer period of time?
o What preventative strategies are in place to protect against this hazard? o What are the possible implications for the delivery of adequate safe drinking water?
• Duration.
o What is the estimated length of time of exposure to the hazard? • Proportion of population affected.
o What proportion of the population could be affected? o Could vulnerable customers such as hospitals, nursing homes and daycares be
affected?
1 Water quality is considered unacceptable if: microbiological standards in the Drinking Water Protection Regulation are exceeded; the Guidelines for Canadian Drinking Water Quality are exceeded; or it is problematic for treatment or distribution systems.
COMPREHENSIVE DRINKING WATER SOURCE-TO-TAP ASSESSMENT GUIDELINE
MODULE 7: CHARACTERIZE RISKS FROM SOURCE TO TAP ~ 11 ~
Table 7-2. Qualitative Measures of Consequence (after NHMRC/ARMCANZ, 2001)
Level Descriptor Description
1 Insignificant Insignificant impact, no illness, little disruption to normal operation, little or no increase in normal operating costs
2 Minor Minor impact for small population, mild illness moderately likely, some manageable operation disruption, small increase in operating costs
3 Moderate Minor impact for large population, mild to moderate illness probable, significant modification to normal operation but manageable, operating costs increase, increased monitoring
4 Major Major impact for small population, severe illness probable, systems significantly compromised and abnormal operation if at all, high-level monitoring required
5 Catastrophic Major impact for large population, severe illness probable, complete failure of systems
2.2.3. Risk Analysis Once likelihood and consequence scores are determined for a hazard, the risk analysis matrix (Table 7‐3) can be used to assign a risk level by finding the cell in the matrix corresponding to the likelihood and consequence scores.
Table 7-3. Qualitative Risk Analysis Matrix
Likelihood Consequences
1 Insignificant
2 Minor
3 Moderate
4 Major
5 Catastrophic
A (almost certain) Moderate High Very High Very High Very High
B (likely) Moderate High High Very High Very High
C (possible) Low Moderate High Very High Very High
D (unlikely) Low Low Moderate High Very High
E (rare) Low Low Moderate High High
For most water supply systems, few data are readily available to quantitatively support estimates of likelihood and consequence in a drinking water risk assessment, but risks need to be characterized based on the best available information. This may require the
COMPREHENSIVE DRINKING WATER SOURCE-TO-TAP ASSESSMENT GUIDELINE
MODULE 7: CHARACTERIZE RISKS FROM SOURCE TO TAP ~ 12 ~
subjective appraisal of hazards based on the collective professional experience of the assessors, which will mean that assumptions about hazards will have to be made. In cases where insufficient information is available to characterize hazards, expert judgment can be used to fill in data gaps about perceived risks. Regardless of the risk characterization method used in a given assessment, the selected approach must be documented in the assessment report—including process, limitations, uncertainty and assumptions made in characterizing risk.
2.2.4. Regulatory Requirements In some assessments, hazards may be identified in Modules 1 to 6 that are also violations of the water system’s operating permit, or provincial regulations under the Drinking Water Protection Act (see Box 7‐3), Water Act and Utilities Act. Failure to disinfect water from a surface supply is an example of this type of hazard. Regulatory violations need to be dealt with differently in Modules 7 and 8 than other types of hazards. In Module 7, risk characterization is not necessary for regulatory violations; they should be automatically given priority and corresponding corrective actions should be assigned to the “Immediate Action” category of recommendations in Module 8. Contact the DWO, public health engineer or regional district for information on local bylaws pertaining to water supply systems.
Box 7-3. Common Regulatory Violations under the Drinking Water Protection Act Treatment not provided for surface water or groundwater at risk of containing pathogens (DWPR s. 5).
Monitoring frequency for microbiological standards in Schedule A of DWPR not met (DWPR Schedule B).
Failure to comply with the terms and operating conditions of operating permit (DWPA s. 8[1(b)]).
No emergency response and contingency plan (DWPA s. 10; DWPR s. 13). Emergency response and contingency plan do not meet requirements as specified in Section 13 of the Drinking Water Protection Regulation: o Names and telephone numbers of water-supply system management personnel; drinking
water officer; medical health officer; public health inspector; and other agencies and officials specified by the DWO (DWPR s. 13 [2(a)]).
o The persons referred to above to be contacted in each type of emergency or abnormal operational circumstance (DWPR s. 13 [2(b)]).
o Steps to follow in the event of an emergency or abnormal operational circumstance (DWPR s. 13 [2(c)]).
o Protocols to follow for public notice if an immediate reporting standard is not met (DWPR s. 13 [2(d)]).
o Accessible to water supply system staff and a copy provided to DWO. Well at risk of flooding is not floodproofed (DWPA s. 16; DWPR s. 14).
COMPREHENSIVE DRINKING WATER SOURCE-TO-TAP ASSESSMENT GUIDELINE
MODULE 7: CHARACTERIZE RISKS FROM SOURCE TO TAP ~ 13 ~
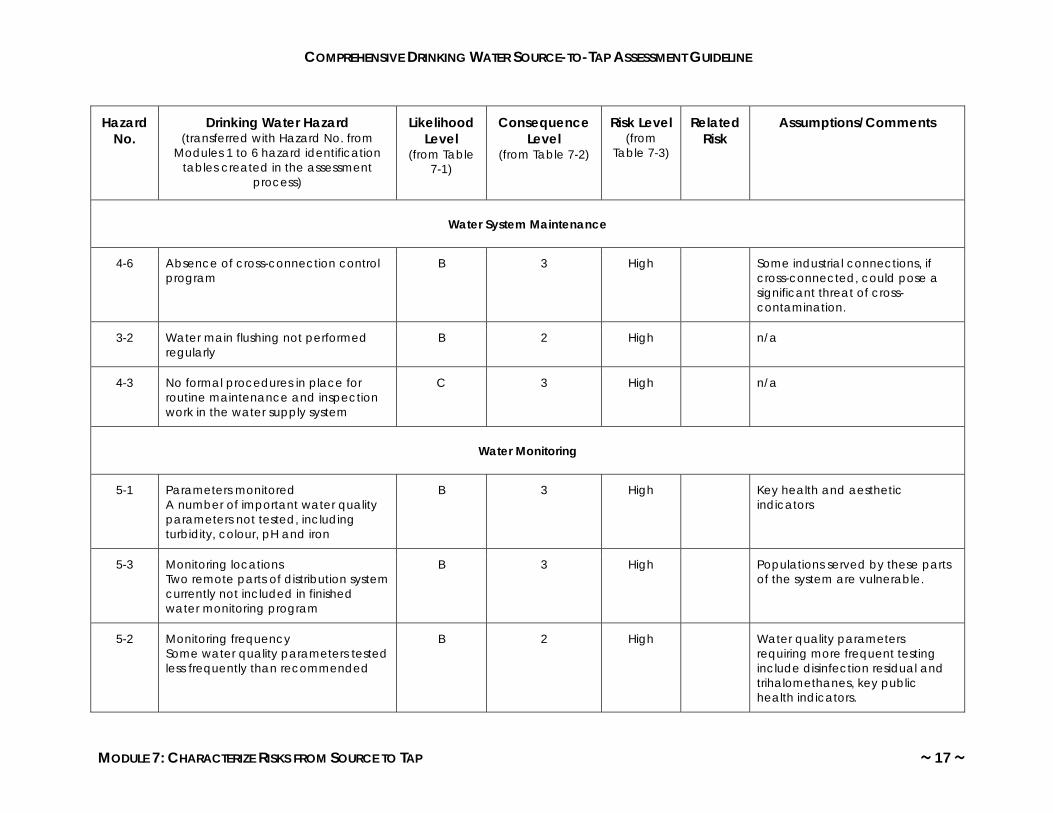
2.2.5. Risk Characterization Table Synthesis of key information in the source‐to‐tap assessment into a table or spreadsheet helps to conceptualize all the threats facing a water supply system simultaneously, providing a more comprehensive and integrated understanding of risks for informed decision making. A sample risk characterization table (Table 7‐4) is provided as a template for structuring the risk characterization data in the context of the multiple barrier approach. Each hazard is categorized by its associated barrier. For example, high turbidity in the source water is related to the source protection barrier. Leaking pipes are a hazard associated with the distribution system maintenance barrier. Linking hazards to drinking water barriers facilitates an analysis of the effectiveness and reliability of each of the barriers, which is a component of Module 7. To characterize risk, hazards identified in Modules 1 to 6 can be transferred from the hazard identification tables to the risk characterization table (Table 7‐4) and grouped according to barrier.
COMPREHENSIVE DRINKING WATER SOURCE-TO-TAP ASSESSMENT GUIDELINE
MODULE 7: CHARACTERIZE RISKS FROM SOURCE TO TAP ~ 14 ~
Table 7-4. Sample Risk Characterization Table
Hazard No.
Drinking Water Hazard (transferred with Hazard No. from
Modules 1 to 6 hazard identification tables created in the assessment
process)
Likelihood Level
(from Table 7-1)
Consequence Level
(from Table 7-2)
Risk Level (from
Table 7-3)
Related Risk
Assumptions/Comments
Source Protection
1-1 Single water source, lack of backup source
C 4 Very High A backup source is a contingency measure in case of drought, contamination, or loss of source. In situations where a backup source is required, the consequences of not having one are likely major.
1-5 Wildlife in watershed contribute pathogenic organisms
A 3 Very High Wildlife in the watershed will continually contribute pathogenic organisms to source water. The consequence of the impact will depend on the magnitude of the contamination and treatment barrier.
1-3 Raw water high in total organic carbon , which contributes to the formation of disinfection byproducts, such as trihalomethanes
A 2 High Creation of disinfection byproducts is a trade-off of chlorine disinfection. These byproducts can be reduced by minimizing the total organic carbon in the water being disinfected and the use of other treatment processes (e.g., coagulation). Other forms of disinfection (e.g., ozone, UV) could also be considered.
1-2 Physical and chemical water quality B 2 High Raw water quality monitoring can
COMPREHENSIVE DRINKING WATER SOURCE-TO-TAP ASSESSMENT GUIDELINE
MODULE 7: CHARACTERIZE RISKS FROM SOURCE TO TAP ~ 15 ~
Hazard No.
Drinking Water Hazard (transferred with Hazard No. from
Modules 1 to 6 hazard identification tables created in the assessment
process)
Likelihood Level
(from Table 7-1)
Consequence Level
(from Table 7-2)
Risk Level (from
Table 7-3)
Related Risk
Assumptions/Comments
parameters not tested in raw water indicate the need to modify treatment processes. If, for example, turbidity increases significantly, disinfection will be less effective and possibly result in the presence of viable pathogens in finished water.
1-4 Slope failure in watershed could impair source water quality
B 3 High Slope failures have occurred in the past in the watershed.
Contaminant Sources in Watershed
2-4 Sheep farm A 3 Very High The sheep farm is close to the water body, and runoff from the farm likely contains pathogens and nutrients.
2-3 Forest harvesting activities B 2 High Road building and harvesting may increase the suspended sediment load in the water, impairing water quality and reducing disinfection effectiveness.
2-1 Hiking and mountain biking trails B 2 High Some trails parallel the stream. No washroom facilities are provided for recreational users of the watershed.
2-5 Golf course C 2 Moderate Runoff from golf course likely contains nutrients and pesticides.
COMPREHENSIVE DRINKING WATER SOURCE-TO-TAP ASSESSMENT GUIDELINE
MODULE 7: CHARACTERIZE RISKS FROM SOURCE TO TAP ~ 16 ~
Hazard No.
Drinking Water Hazard (transferred with Hazard No. from
Modules 1 to 6 hazard identification tables created in the assessment
process)
Likelihood Level
(from Table 7-1)
Consequence Level
(from Table 7-2)
Risk Level (from
Table 7-3)
Related Risk
Assumptions/Comments
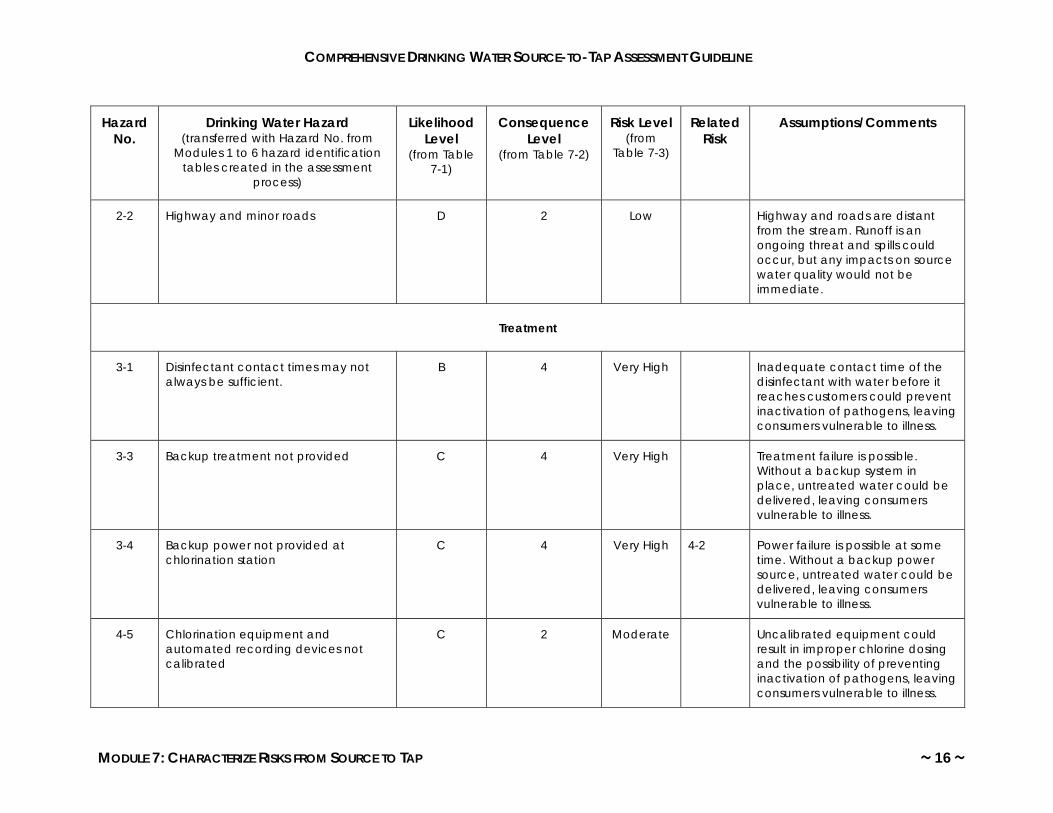
2-2 Highway and minor roads D 2 Low Highway and roads are distant from the stream. Runoff is an ongoing threat and spills could occur, but any impacts on source water quality would not be immediate.
Treatment
3-1 Disinfectant contact times may not always be sufficient.
B 4 Very High Inadequate contact time of the disinfectant with water before it reaches customers could prevent inactivation of pathogens, leaving consumers vulnerable to illness.
3-3 Backup treatment not provided C 4 Very High Treatment failure is possible. Without a backup system in place, untreated water could be delivered, leaving consumers vulnerable to illness.
3-4 Backup power not provided at chlorination station
C 4 Very High 4-2 Power failure is possible at some time. Without a backup power source, untreated water could be delivered, leaving consumers vulnerable to illness.
4-5 Chlorination equipment and automated recording devices not calibrated
C 2 Moderate Uncalibrated equipment could result in improper chlorine dosing and the possibility of preventing inactivation of pathogens, leaving consumers vulnerable to illness.
COMPREHENSIVE DRINKING WATER SOURCE-TO-TAP ASSESSMENT GUIDELINE
MODULE 7: CHARACTERIZE RISKS FROM SOURCE TO TAP ~ 17 ~
Hazard No.
Drinking Water Hazard (transferred with Hazard No. from
Modules 1 to 6 hazard identification tables created in the assessment
process)
Likelihood Level
(from Table 7-1)
Consequence Level
(from Table 7-2)
Risk Level (from
Table 7-3)
Related Risk
Assumptions/Comments
Water System Maintenance
4-6 Absence of cross-connection control program
B 3 High Some industrial connections, if cross-connected, could pose a significant threat of cross-contamination.
3-2 Water main flushing not performed regularly
B 2 High n/a
4-3 No formal procedures in place for routine maintenance and inspection work in the water supply system
C 3 High n/a
Water Monitoring
5-1 Parameters monitored A number of important water quality parameters not tested, including turbidity, colour, pH and iron
B 3 High Key health and aesthetic indicators
5-3 Monitoring locations Two remote parts of distribution system currently not included in finished water monitoring program
B 3 High Populations served by these parts of the system are vulnerable.
5-2 Monitoring frequency Some water quality parameters tested less frequently than recommended
B 2 High Water quality parameters requiring more frequent testing include disinfection residual and trihalomethanes, key public health indicators.
COMPREHENSIVE DRINKING WATER SOURCE-TO-TAP ASSESSMENT GUIDELINE
MODULE 7: CHARACTERIZE RISKS FROM SOURCE TO TAP ~ 18 ~
Hazard No.
Drinking Water Hazard (transferred with Hazard No. from
Modules 1 to 6 hazard identification tables created in the assessment
process)
Likelihood Level
(from Table 7-1)
Consequence Level
(from Table 7-2)
Risk Level (from
Table 7-3)
Related Risk
Assumptions/Comments
Operator Training
4-1 Two of four operators do not have adequate training for water system classification.
N/A N/A Very High REGULATORY INFRACTION. All operators must be trained to the appropriate level (DWPR s. 12).
Emergency Response Planning
4-2 Existing emergency response plan does not contain formal procedures for action in specific foreseeable emergency situations such as power failure, contamination of source, water main failure, forest fires, floods, earthquakes and others.
N/A N/A Very High 3-4 REGULATORY INFRACTION. The emergency response and contingency plan must include “the steps to follow in the event of an emergency or abnormal operational circumstance” [DWPR s. 13(2)].
Management, Governance and Affordability
6-1 Absence of a long-term capital expenditure plan
B 3 High A capital expenditure program ensures the water supplier can upgrade and replace supply elements as needed.
4-5 Security measures may be inadequate for the chlorination building with no security alarm.
D 3 Moderate A locked door is only the security measure employed. Sabotage could occur.
4-4 System of record keeping and documentation inadequate
D 2 Low n/a
COMPREHENSIVE DRINKING WATER SOURCE-TO-TAP ASSESSMENT GUIDELINE
MODULE 7: CHARACTERIZE RISKS FROM SOURCE TO TAP ~ 19 ~
2.3. Evaluate the Water Supply System as an Integrated Whole Understanding the results of the risk assessment in the context of the water supply system as a whole is critical to the creation of an effective risk management strategy. The purpose of this evaluation is to bring together the results of the assessment into a meaningful, synoptic, fact‐based integrated appraisal of how the water supply system is doing in meeting its objective of reliably providing sufficient volumes of safe drinking water now and into the future. This last aspect of the source‐to‐tap risk assessment provides a “bird’s‐eye view” of the water supply system, highlighting important areas of effectiveness and deficiency in drinking water protection. Assessors may use other methods to conduct an integrated evaluation of the water supply system, but a well known and useful approach for achieving this objective is to conduct a strengths, weaknesses, opportunities and threats (SWOT) analysis, as described below.
2.3.1. Strengths, Weaknesses, Opportunities and Threats (SWOT) Analysis Identify the major factors (strengths, weaknesses, opportunities and threats) with the greatest potential to influence drinking water quality and availability both at present and into the future. Strengths are the major assets of the water supply system, the areas where the water supply system is doing well. Highlighting strengths serves to recognize and encourage the positive aspects of the water supply system. Recommendations for supporting areas of strength in the water supply system will be included in Module 8. Weaknesses are fundamental deficiencies in the protective and preventative measures in the water supply system. They are areas where significant vulnerabilities exist and more attention is required. Recommendations on addressing these weaknesses will be made in Module 8. Opportunities are prospects for improvements to the safety or sustainability of the water supply. These
Box 7-4. Examples of Key Water Supply System Strengths
Effective and reliable treatment plant
Water source is a deep, confined aquifer with high productivity and low water withdrawals
Effective organizational structures support communication between water system operators and management for informed decision making /continuous improvement
Box 7-5. Examples of Major Water Supply System Weaknesses
No replacement and renewal plan No source protection plan in multiple use watershed
Water system operators lack required level of training
Box 7-6. Examples of Key Opportunities for a Water Supply System
Changes in governance Funding sources Available alternative water sources
COMPREHENSIVE DRINKING WATER SOURCE-TO-TAP ASSESSMENT GUIDELINE
MODULE 7: CHARACTERIZE RISKS FROM SOURCE TO TAP ~ 20 ~
opportunities will be capitalized on when developing recommended risk management strategies in Module 8. Threats are major hazards to the safety or sustainability of the drinking water supply. Strategies for minimizing and mitigating these threats are included in the recommendations in Module 8.
2.3.2. Statement of Water Supply System Performance An integrated assessment requires assessors to measure a water supply system by its ultimate objective: to reliably provide adequate volumes of water of acceptable quality to all its customers. As a team, review the information collected in the assessment, risk characterization, and multiple barrier system evaluation. Provide a statement about the water system’s historical performance, and an estimation of its present and future ability to supply adequate volumes of safe drinking water.
3. ASSESSMENT DOCUMENTATION AND REPORTING
3.1. Assessment Report The assessment report for Module 7 should contain at a minimum: 1. Descriptions of each barrier, identifying the individual components of the
barrier, and an evaluation of their individual and overall effectiveness and reliability.
2. A risk characterization table (see Table 7‐4 for an example) showing hazards, likelihood and consequence scores, risk levels, and assumptions categorized by drinking water barrier and ranked by risk level.
3. The risk assessment methodology, as well as the factual and scientific basis for the assessment, quality and weight of evidence, key assumptions and limitations, and sources of uncertainty. Identifying and separating value judgements from technical judgements is also required.
4. Overview of the major factors (e.g., SWOT) influencing the safety and availability of water at present and in the future.
5. A statement from the assessment team on the water supply system’s historical performance, and its ability to reliably supply adequate volumes of safe drinking water in the future.
Box 7-7. Examples of Major Threats to a Water Supply System
Aging and failing distribution pipes Water demand expected to exceed supply in five years
Residential development pressures in source area are impacting water quality and flows
COMPREHENSIVE DRINKING WATER SOURCE-TO-TAP ASSESSMENT GUIDELINE
MODULE 7: CHARACTERIZE RISKS FROM SOURCE TO TAP ~ 21 ~
APPENDIX 7A: MODULE 7 ASSESSMENT AT A GLANCE
Components Recommended
Methods Scope Documentation
and Reporting
1. Evaluate the robustness of the drinking water protection barriers and supporting mechanisms assessed in Modules 1 to 6.
• Describe or rate the strength and reliability of drinking water protection barriers and supporting mechanisms (see Box 7-1 and Appendix 7C).
• Using the professional judgment of the assessment team, collectively assess the robustness of the integrated multiple barrier system (including supporting mechanisms).
• Drinking water protection barriers assessed in Modules 1 to 6 (see Appendix 7C)
• Statements or ratings (supported by fact-based rationale) of the effectiveness and reliability of each barrier and supporting mechanism assessed, and of the multiple barrier system as a whole (where all modules in the Comprehensive Source-to-Tap Assessment Guideline are completed).
2. Estimate risk for hazards identified in Modules 1 to 6.
• Qualitative or quantitative risk assessment (see Section 2.2 and Appendix 7D for examples of qualitative risk assessments for drinking water supply systems).
• All hazards identified in Module 1 to 6 assessments (as identified in the Hazard Identification Table).
• Risk characterization table with: o Hazards o Likelihood,
consequence, and risk ratings
o Risk abatement measures in place
o Assumptions • Description of risk
assessment approach employed including: o Factual and
scientific basis o Quality and
weight of evidence
o Sources of uncertainty
COMPREHENSIVE DRINKING WATER SOURCE-TO-TAP ASSESSMENT GUIDELINE
MODULE 7: CHARACTERIZE RISKS FROM SOURCE TO TAP ~ 22 ~
Components Recommended Methods
Scope Documentation and Reporting
3. Evaluate the water supply system as an integrated whole.
• Identify major water supply system strengths, weaknesses, opportunities and threats.
• As an assessment team, review all the information collected throughout the assessment and evaluate the water supply system by its ultimate objective: to reliably provide adequate volumes of safe drinking water to all its customers in the present and future.
• All components assessed in Modules 1 to 6.
• Overview of the major factors (strengths, weaknesses, opportunities and threats) with the greatest potential to influence drinking water quality and availability both now and into the future.
• Provide a statement about the water system’s past performance, and an estimation of its present and future ability to supply adequate volumes of safe drinking water.
COMPREHENSIVE DRINKING WATER SOURCE-TO-TAP ASSESSMENT GUIDELINE
MODULE 7: CHARACTERIZE RISKS FROM SOURCE TO TAP ~ 23 ~
APPENDIX 7B: RECOMMENDED RESOURCES
Drinking Water Risk Management New Zealand Ministry of Health. 2005. A Framework on How to Prepare and Develop
Public Health Risk Management Plans for Drinkingwater Supplies. Wellington: Ministry of Health. http://www.moh.govt.nz/moh.nsf/0/CCA65C18B2E29251CC256A7900082B9C/$File/aframeworkfordevelopingaphrmp.pdf
NHMRC/ARMCANZ Co‐ordinating Group. 2001. Framework for Management of Drinking
Water Quality: A Preventive Strategy from Catchment to Consumer. National Health and Medical Research Council/Agriculture and Resource Management Council of Australia. http://www.nhmrc.gov.au/_files_nhmrc/file/publications/synopses/adwg_11_06_chapter_2.pdf .
Online Resources for Drinking Water Risk Management Actions British Columbia Water and Waste Association http://www.bcwwa.org/ Waterbucket http://www.waterbucket.ca/ Small Community Infrastructure Sustainability http://drinkingwater.smallcommunityinfrastructure.ca/index.asp Sustainable Infrastructure Society http://www.sustainis.org/ Water Supply Association of BC http://www.wsabc.com/ Canadian Water and Wastewater Association http://www.cwwa.ca/ BC Ground Water Association http://www.bcgwa.org/ Small Water Users Association of British Columbia http://www.smallwaterusers.com/ Coastal Water Suppliers Association http://www.cwsa.net/
COMPREHENSIVE DRINKING WATER SOURCE-TO-TAP ASSESSMENT GUIDELINE
MODULE 7: CHARACTERIZE RISKS FROM SOURCE TO TAP ~ 24 ~
APPENDIX 7C: MODEL MULTIPLE BARRIER SYSTEM
Elements of the Multiple Barrier System Approach to Drinking Water Protection 1. Source Protection
The source is under the control of the water supplier. A source water protection‐and‐management plan is in place. Watershed uses are limited and designated. Contaminant sources are absent from the catchment area or are low risk. There is a low intrinsic source vulnerability (e.g., confined aquifer, stable watershed).
Multiple Barrier
Approach
Source Protection
Treatment
Water System
Maintenance
Water Quality
Monitoring
Operator Training
Emergency Response Training
COMPREHENSIVE DRINKING WATER SOURCE-TO-TAP ASSESSMENT GUIDELINE
MODULE 7: CHARACTERIZE RISKS FROM SOURCE TO TAP ~ 25 ~
The integrity and location of the well/intake ensure the best‐quality source water is captured.
Source water quality is consistently good, with seasonal fluctuations that do not disrupt treatment systems.
Total water source capacity can supply current and projected water demand, taking into account the uncertainty associated with climate change and drought.
A backup (secondary) source is in position. Community and water users are aware of the impact of human activity on source water quality and quantity.
2. Treatment
Appropriate treatment technology is employed, based on source water type, quality and demand.
Treatment is effective at inactivating/removing pathogens and reducing other constituents such as minerals or chemicals of concern to acceptable concentrations.
The treatment system is reliable. It can be depended upon to produce high‐ quality finished water in all but exceptional circumstances.
Regular process monitoring and system maintenance are performed. An optimum disinfection residual is maintained throughout the system. Backup treatment is ready to be activated.
3. Water System Maintenance
The physical condition and integrity of water system components prevent contamination and water loss.
Routine inspection and maintenance programs are practised including: Leak detection. Valve and fire hydrant maintenance. Water main flushing and swabbing. Testing and calibrating automated monitoring systems.
Up‐to‐date operation and maintenance protocols are readily available in printed form.
Positive water pressure is maintained throughout the distribution system to prevent backsiphonage.
The water supplier can identify all water system assets and their location. Accurate and current maps of the water supply system are available. Locations of water main valves and curb stops on service lines are known. A backflow prevention and cross‐connection control program is in place.
COMPREHENSIVE DRINKING WATER SOURCE-TO-TAP ASSESSMENT GUIDELINE
MODULE 7: CHARACTERIZE RISKS FROM SOURCE TO TAP ~ 26 ~
Record‐keeping procedures are in place—documenting maintenance activities, operational procedures, process control, preventative strategies, monitoring and corrective actions.
Security systems are in place to safeguard water from unintentional contamination or sabotage.
Backup equipment and controls are in place and tested regularly. Proper disinfection and flushing procedures are used for all repairs and new construction.
A spare parts inventory is maintained. 4. Water Monitoring
Water quality monitoring is performed routinely for: Parameters, locations and frequency specified by the local health authority or in the operating permit.
Water system operations and performance. Source water quality and quantity monitoring is performed regularly Water volume in the system and demand are measured. Customer complaints are relatively few in number, documented and responded to appropriately.
Reporting of water monitoring results to health authorities and the public are carried out as required under the Drinking Water Protection Act.
5. Operator Training
Operators are trained to the appropriate level based on the Environmental Operators Certification Program (EOCP).
The supplier and operator are committed to ongoing training and learning 6. Emergency Response Planning
An emergency response plan is established including, at a minimum, the following elements:
An emergency contact list for the water system management and operators, as well as the drinking water officer, medical health officer and public health inspector.
Steps to follow in responding to each potential emergency situation or abnormal operational circumstance.
Protocols for public notice if an immediate reporting standard is not met. Maps of the water system.
Water system management and staff understand their roles and responsibilities in an emergency.
Contingency plans are in place.
COMPREHENSIVE DRINKING WATER SOURCE-TO-TAP ASSESSMENT GUIDELINE
MODULE 7: CHARACTERIZE RISKS FROM SOURCE TO TAP ~ 27 ~
Supporting Mechanisms: Effective Governance, Sound Management and Affordability Effective governance, sound management and affordability are the foundations supporting the multiple barrier approach to drinking water protection. Best practices in governance and management increase technical and financial capacity to enhance and strengthen barriers. 1. Governance and Accountability
The water supplier has an ongoing mandate to provide safe drinking water. The governance structure is appropriate for the water system, its service area and customers.
One person or entity is accountable for the provision of safe drinking water. The water supplier communicates with water users in a timely and appropriate manner about important drinking water information.
2. Management
The water supplier knows and understands all provincial regulations applicable to the operation and maintenance of the water system.
The multiple barrier approach is applied to source protection. A clear plan of organization and control exists among people responsible for the management and operation of the system.
Management and operations staff have clearly defined functions. Qualified staff are managing and administering the water service. An up‐to‐date capital works plan is established. The water purveyor has access to external technical and professional services such as:
The water supply system is assessed on a regular schedule. 3. Affordability
An up‐to‐date financial plan is in place. Planning is carried out for upgrades to improve water quality and sustainability.
The water‐pricing structure reflects the present and future needs of the water supply system.
Full‐cost accounting is applied to determine the full cost of supplying water. Adequate liability insurance coverage is in place.
COMPREHENSIVE DRINKING WATER SOURCE-TO-TAP ASSESSMENT GUIDELINE
MODULE 7: CHARACTERIZE RISKS FROM SOURCE TO TAP ~ 28 ~
APPENDIX 7D: INTEGRATED QUALITATIVE RISK ASSESSMENT PROCESS
FOR DRINKING WATER SUPPLY SYSTEMS
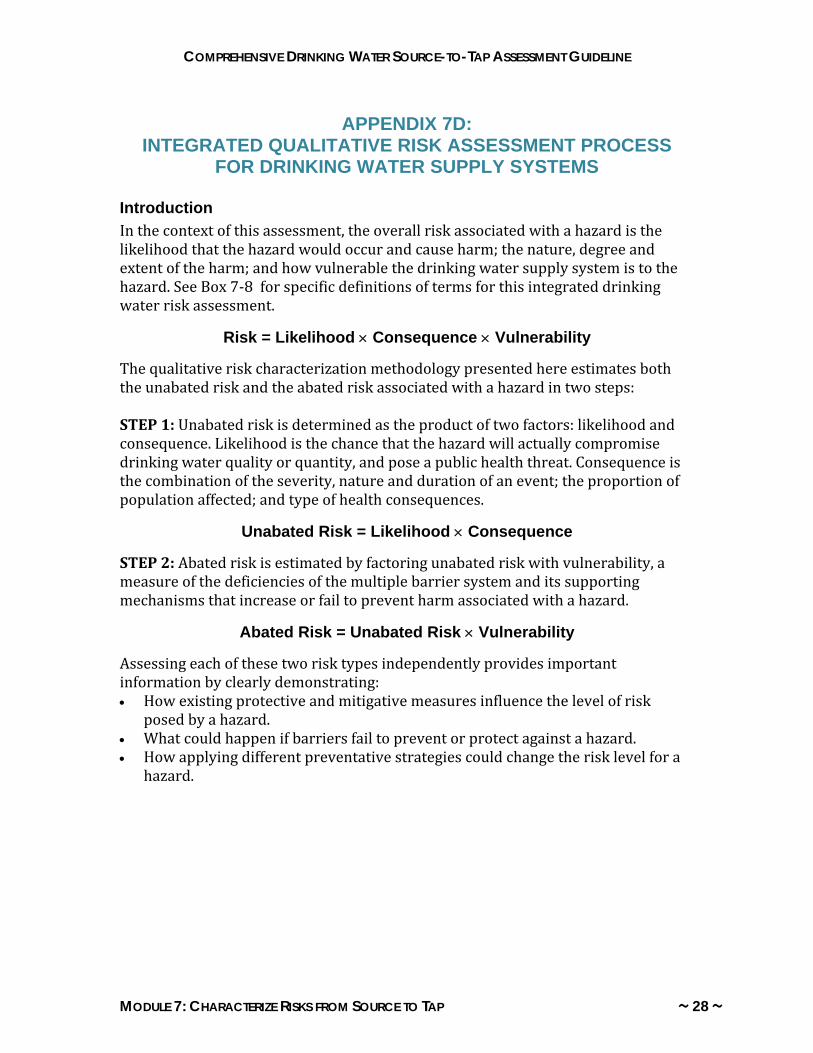
Introduction In the context of this assessment, the overall risk associated with a hazard is the likelihood that the hazard would occur and cause harm; the nature, degree and extent of the harm; and how vulnerable the drinking water supply system is to the hazard. See Box 7‐8 for specific definitions of terms for this integrated drinking water risk assessment.
Risk = Likelihood × Consequence × Vulnerability The qualitative risk characterization methodology presented here estimates both the unabated risk and the abated risk associated with a hazard in two steps: STEP 1: Unabated risk is determined as the product of two factors: likelihood and consequence. Likelihood is the chance that the hazard will actually compromise drinking water quality or quantity, and pose a public health threat. Consequence is the combination of the severity, nature and duration of an event; the proportion of population affected; and type of health consequences.
Unabated Risk = Likelihood × Consequence STEP 2: Abated risk is estimated by factoring unabated risk with vulnerability, a measure of the deficiencies of the multiple barrier system and its supporting mechanisms that increase or fail to prevent harm associated with a hazard.
Abated Risk = Unabated Risk × Vulnerability Assessing each of these two risk types independently provides important information by clearly demonstrating: • How existing protective and mitigative measures influence the level of risk
posed by a hazard. • What could happen if barriers fail to prevent or protect against a hazard. • How applying different preventative strategies could change the risk level for a
hazard.
COMPREHENSIVE DRINKING WATER SOURCE-TO-TAP ASSESSMENT GUIDELINE
MODULE 7: CHARACTERIZE RISKS FROM SOURCE TO TAP ~ 29 ~
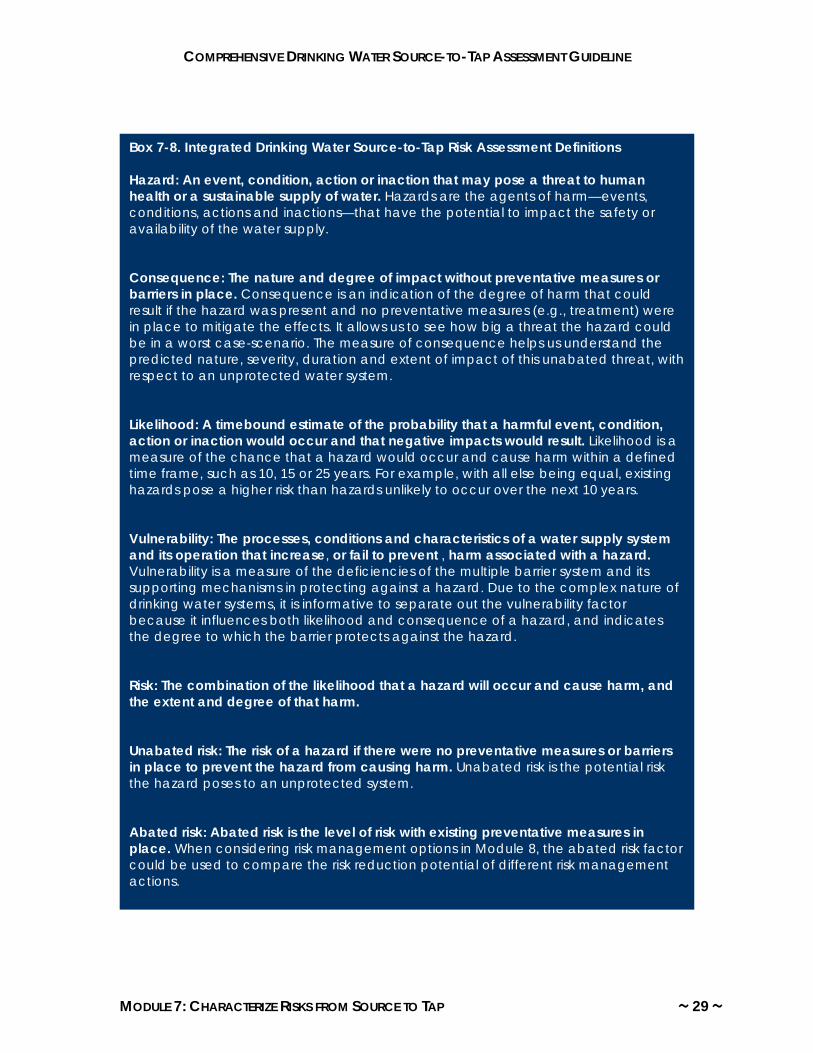
Box 7-8. Integrated Drinking Water Source-to-Tap Risk Assessment Definitions Hazard: An event, condition, action or inaction that may pose a threat to human health or a sustainable supply of water. Hazards are the agents of harm—events, conditions, actions and inactions—that have the potential to impact the safety or availability of the water supply. Consequence: The nature and degree of impact without preventative measures or barriers in place. Consequence is an indication of the degree of harm that could result if the hazard was present and no preventative measures (e.g., treatment) were in place to mitigate the effects. It allows us to see how big a threat the hazard could be in a worst case-scenario. The measure of consequence helps us understand the predicted nature, severity, duration and extent of impact of this unabated threat, with respect to an unprotected water system. Likelihood: A timebound estimate of the probability that a harmful event, condition, action or inaction would occur and that negative impacts would result. Likelihood is a measure of the chance that a hazard would occur and cause harm within a defined time frame, such as 10, 15 or 25 years. For example, with all else being equal, existing hazards pose a higher risk than hazards unlikely to occur over the next 10 years. Vulnerability: The processes, conditions and characteristics of a water supply system and its operation that increase, or fail to prevent , harm associated with a hazard. Vulnerability is a measure of the deficiencies of the multiple barrier system and its supporting mechanisms in protecting against a hazard. Due to the complex nature of drinking water systems, it is informative to separate out the vulnerability factor because it influences both likelihood and consequence of a hazard, and indicates the degree to which the barrier protects against the hazard. Risk: The combination of the likelihood that a hazard will occur and cause harm, and the extent and degree of that harm. Unabated risk: The risk of a hazard if there were no preventative measures or barriers in place to prevent the hazard from causing harm. Unabated risk is the potential risk the hazard poses to an unprotected system. Abated risk: Abated risk is the level of risk with existing preventative measures in place. When considering risk management options in Module 8, the abated risk factor could be used to compare the risk reduction potential of different risk management actions.
COMPREHENSIVE DRINKING WATER SOURCE-TO-TAP ASSESSMENT GUIDELINE
MODULE 7: CHARACTERIZE RISKS FROM SOURCE TO TAP ~ 30 ~
Assess the Unabated Risk for Each Hazard To assess a hazard’s degree of risk with respect to an unprotected drinking water system, the likelihood and consequence of a hazard are determined and factored together. See Section 2.2 of this module for descriptions and suggested qualitative measures of likelihood and consequence.
Unabated Risk = Likelihood × Consequence Unabated Risk Analysis Once likelihood and consequence scores are determined for a hazard, the risk analysis matrix (Table 7‐5) can be used to assign an unabated risk level by finding the cell in the matrix corresponding to the likelihood and consequence scores.
C (possible) Low Moderate High Very High Very High
D (unlikely) Low Low Moderate High Very High
E (rare) Low Low Moderate High High
Assess the Abated Risk for Each Hazard
The abated risk level for a hazard is the combination of its unabated risk and the vulnerability of the water supply system to the hazard. It represents the actual level of risk to the water supply system considering all existing factors. To determine the abated risk level, unabated risk and vulnerability are factored together in much the same way as likelihood and consequence for the unabated risk analysis.
Abated Risk = Unabated Risk × Vulnerability
Vulnerability The likelihood and consequences of drinking water hazards depend on the existence of preventative strategies that make up the multiple barrier system. Vulnerability refers to the processes, conditions and characteristics of a water supply system and its operation that increase, or fail to prevent, harm associated with a hazard.
COMPREHENSIVE DRINKING WATER SOURCE-TO-TAP ASSESSMENT GUIDELINE
MODULE 7: CHARACTERIZE RISKS FROM SOURCE TO TAP ~ 31 ~
Results of the multiple barrier system evaluation in this module’s Section 2.1 will aid the assigning of vulnerability ratings when the water supply system’s susceptibility to a particular hazard is being considered. Four general categories of vulnerability—low, moderate, high and very high—are used in this analysis example. However, other types of rating systems may be used as long as the criteria for each category are defined. The degree of vulnerability to a hazard should be evaluated based on the existing features and configuration of the water supply system. Assumptions about these barriers need to be clearly stated. Abated Risk Analysis Using the unabated risk level and vulnerability rating, the abated risk analysis matrix (Table 7‐6) can be used to assign the overall risk level by finding the cell in the matrix corresponding to the unabated risk and vulnerability scores. Note in Table 7‐6 that the abated risk cannot be higher than the unabated risk.


![TAP TAP Basics (Preparing for Success in a TAP School) [PSTS]](https://static.documents.pub/doc/80x56/56649eb25503460f94bb9499/tap-tap-basics-preparing-for-success-in-a-tap-school-psts.jpg)


