bass acclimated to elevated CO2 also had a reduced glu-cose response (relative to controls) following an acute CO2 exposure, indicating a reduced stress response to CO2 stressors. In addition, largemouth bass acclimated to ele-vated CO2 conditions required 50 % higher CO2 concentra-tions to illicit agitation behaviors and displayed prolonged burst swimming abilities in high CO2 environments relative to controls. Together, results demonstrate that largemouth bass exposed to chronic hypercarbia may possess a physi-ological advantage during periods of elevated CO2 relative to naïve fish, which may permit increased performance in hypercarbia.
Aquatic hypercarbia, or elevated dissolved carbon diox-ide (CO2), can be an environmental stressor for many aquatic organisms. While hypercarbia can occur naturally in the environment (e.g., coastal upwelling zones, estuarine waters) (Feely et al. 2008; Thomsen et al. 2010), anthro-pogenically driven hypercarbia is becoming increasingly problematic. Of particular concern is the expected increase in dissolved CO2 concentrations in the marine environ-ment driven by global climate change (Cooley and Doney 2009; Raven et al. 2005). Predicted levels of dissolved CO2 by the year 2300 (approximately, 1900 µatm) have been shown to impair the ability of larval and juvenile marine fishes to avoid predators, locate settlement and refuge, and respond to auditory cues, potentially resulting in population declines and failure to recruit (Dixson et al. 2010; Munday et al. 2009, 2010; Simpson et al. 2011). In addition, while
Abstract Aquatic hypercarbia, either naturally occurring or anthropogenically induced, can have extensive impacts on aquatic environments and resident organisms. While the impact of acute hypercarbia exposure on the behav-ior and physiology of fishes has been well studied, rela-tively little work has examined the physiological impact and acclimation capacity of fishes to chronic hypercarbia. To better understand the impacts of prolonged hypercar-bia exposure, largemouth bass were held at ambient CO2 (13 mg L−1) and elevated CO2 (31 mg L−1; ≈21,000 µatm) for 58 days. Following this acclimation period, fish were subjected to three separate, yet complementary, experi-ments: (1) acute hypercarbia challenge of 120 mg L−1 CO2 for 1 h to quantify physiological and molecular responses; (2) hypercarbia avoidance challenge to compare CO2 agi-tation and avoidance responses; and (3) swim performance challenge to quantify burst swimming performance. Accli-mation to 31 mg L−1 CO2 resulted in a significant constitu-tive upregulation of c-fos expression in erythrocytes, com-bined with significant constitutive expression of hsp70 in both gill and erythrocytes, relative to controls. Largemouth
the dynamics of CO2 in freshwater are variable and future climate-related changes are difficult to predict (Cole et al. 1994, 2007; Raymond et al. 2013), freshwater fishes can be subjected to aquatic hypercarbia through a number of potential mechanisms that include intensive aquaculture practices (Colt and Orwicz 1991; Kristensen et al. 2009) or novel chemical fish deterrents (Clingerman et al. 2007; Kates et al. 2012). For example, Blancheton (2000) sug-gests that CO2 concentrations below 40 mg L−1 should be safe for fish in aquaculture systems. Previous research has shown, however, that the health and condition of fish can be impacted by chronic exposure to approximately 20 mg L−1 CO2 (Fivelstad et al. 1999). Given that an increase in hyper-carbic environments in the future is likely (Feely et al. 2008), particularly in the marine environment, examining the impact of chronically elevated CO2 exposure in fishes is becoming increasingly important.
Aquatic organisms have a variety of mechanisms to respond to environmental stress related to aquatic hyper-carbia. More specifically, animals can display behavioral avoidance to escape poor water quality environments and potentially avoid the energetic cost necessary to inhabit suboptimal habitats (Kieffer and Cooke 2009). Similarly, animals can respond by altering molecular and physiologi-cal systems to maintain homeostasis and cope with the hypercarbic stressor (Barton 2002; McEwen and Wingfield 2003). This process initially starts through the activation of receptors and release of stress hormones (i.e., cortisol), which can lead to changes in the physiological processes involved in oxygen transport, metabolism, ion regulation, and eventually result in whole animal performance and behavioral modifications (Barton 2002). Finally, genetic mechanisms, such as the induction of heat shock protein 70 (hsp70) and c-fos transcripts, can allow these organisms to cope with chronic hypercarbia exposure (Dennis et al. 2014; Iwama et al. 2004; Rimoldi et al. 2009). For example, c-fos is one of the few gene transcripts that has been associ-ated with hypercarbia stress in fishes (Dennis et al. 2014; Rimoldi et al. 2009) and is believed to modify ventilatory behavior in response to elevated CO2 exposure (Rimoldi et al. 2009; Tankersley et al. 2002). Previous research has also shown that increased hsp70 transcript expression can occur following the exposure to a variety of environmental stressors, including increasing temperatures (Healy et al. 2010), seawater exposure (Niu et al. 2008), and elevated CO2 (Dennis et al. 2014), and is believed to preserve pro-tein function under these conditions (Iwama et al. 2004).
While the physiological (Bernier and Randall 1998; Brauner and Baker 2009; Perry and Gilmour 2006) and behavioral impacts (Dixson et al. 2010; Munday et al. 2009) of acute hypercarbia exposure on fishes have been well studied, relatively little work has been performed to define the physiological, behavioral, and performance impacts of
chronic hypercarbia exposure in fishes. Due to the threat of ocean acidification, current research focuses on the impact of chronic hypercarbia in marine fishes through the examination of acid–base status (Michaelidis et al. 2007; Petochi et al. 2011), ion regulation (Deigweiher et al. 2008; Melzner et al. 2009; Petochi et al. 2011), energy metabo-lism (Michaelidis et al. 2007; Santos et al. 2013), and stress (Petochi et al. 2011; Santos et al. 2013). Despite the quan-tity of research conducted on hypercarbia, few studies have examined how chronic CO2 exposure influences biologi-cally and ecologically important end points, such as swim-ming performance or avoidance responses (Melzner et al. 2009; Ross et al. 2001). Additionally, prolonged exposure of animals to sublethal environmental variation can impart reversible physiological and molecular alterations without changes to genotypes, defined as phenotypic plasticity, which may provide a selective advantage and/or benefit an animal’s ability to tolerate environmental stress (Leroi et al. 1994; Piersma and Drent 2003; Chevin et al. 2010). While previous studies have demonstrated phenotypic plastic-ity in fishes as a response to variables such as temperature (Angilletta 2009; Lurman et al. 2009) and hypoxia (Gaulke et al. 2014), few studies have examined this potential with hypercarbia, especially in terms of physiological and per-formance metrics. More importantly, freshwater ecosys-tems are predicted to experience an increase in dissolved CO2 associated with future climate change (Sobek et al. 2005; Hasler et al. 2016), and little information exists on the response of freshwater fishes to extended exposure to elevated CO2. Therefore, determining the impact of chronic hypercarbia exposure and subsequent acclimation capac-ity on largemouth bass will provide critical information on (1) how chronic hypercarbia exposure impacts fish, (2) if prolonged exposure to hypercarbia imparts physiological alterations that benefit an individual’s response to hyper-carbia, and (3) how freshwater species respond to chronic hypercarbia stress.
Largemouth bass are an ideal species to use to answer questions related to CO2 stressors in freshwater for the following reasons: (1) largemouth bass have been shown to be phenotypically plastic and can acclimate to a vari-ety of environmental stressors [i.e., hypoxia (Gaulke et al. 2014), water temperatures (Díaz et al. 2007)]; (2) previous research on acute physiological responses to hypercarbia has been performed on largemouth bass (Kates et al. 2012); (3) assessing the impact of chronic CO2 exposure may be useful for aquaculture managers rearing largemouth bass; and (4) largemouth bass are one of the most popular targets for recreational anglers in the USA, making them economi-cally important (US Department of the Interior 2011).
The objective of this study was to quantify the capac-ity of fish to acclimate to elevated CO2 environments. To accomplish this, juvenile largemouth bass were first held in
299J Comp Physiol B (2016) 186:297–311
1 3
either elevated CO2 or ambient CO2 conditions for 8 weeks. Following this acclimation period, largemouth bass were subjected to three separate, yet complementary, experi-ments to define their capacity to acclimate to elevated CO2. The first experiment quantified the impact of extended CO2 exposure on molecular and physiological disturbance in largemouth bass following acute hypercarbia exposure. The second study examined whether prolonged exposure to an elevated CO2 environment influenced thresholds of CO2 agitation or avoidance. The final study quantified swim per-formance of CO2-acclimated largemouth bass under control and hypercarbic conditions. Together, these three experi-ments provide valuable insight into the acclimation poten-tial and subsequent response to hypercarbic environments.
Materials and methods
Experimental animals
Juvenile largemouth bass were acquired from Logan Hol-low Fish Farm (Murphysboro, IL, USA) and delivered to the University of Illinois Aquatic Research Facility (Cham-paign, IL, USA) on September 8, 2013. Upon arrival at the research facility, fish were housed outdoors in round plastic tanks (1280 L, 1.7 m diameter) supplied with water from a 0.04 ha natural, earthen pond with abundant vegetation. Juvenile largemouth bass were fed pelleted food (Dense Culture Food, F2A, Pentair Aquatic Eco-Systems, Apopka, FL, USA) until satiation every other day, and solid waste was removed via siphoning. Fish were held for 3 weeks prior to start of the 8-week acclimation treatment. Across this initial outdoor holding period, water temperatures aver-aged 21.7 °C (±0.4 °C, standard error, SE) and dissolved oxygen averaged 8.0 mg L−1 (±0.1 mg L−1).
Acclimation treatments
Following the 3-week outdoor holding period, largemouth bass were carefully netted from the holding tank, meas-ured (total length in mm), weighed to the nearest 0.1 g, and transferred, at random, to one of two indoor acclima-tion tanks: ambient CO2 (L) or high CO2 (H). The L tank was aerated continuously with air stones attached to a com-pressed air blower, and a fountain pump in the tank ensured adequate water mixing. Solid wastes were removed from this tank by siphoning every other day, while nitrogenous waste removal was achieved by pumping water through a container of activated carbon and complete replace-ment of water every 6 days. Ammonia levels during the acclimation period did not exceed 1 ppm (mean ammo-nia = 0.2 ± 0.01 ppm) (kit #3351-02, LaMotte Company, Chestertown, MD, USA). Water quality measurements
were taken daily, and included temperature, dissolved oxy-gen (YSI 550A, Yellow Springs Instruments, Irvine, CA, USA), and pH (WTW pH 3310 meter with a SenTix 41 probe, Germany). Dissolved CO2 and total alkalinity (kit #2272700 and 2271900, Hach Company, Loveland, CO, USA) were quantified using a digital titrator (model 16900, Hach Company, Loveland, CO, USA). Dissolved CO2 con-centrations were 13 mg L−1 (±0.2 mg L−1) in the L tank. The H tank held fish at 31 mg L−1 CO2 (±0.6 mg L−1) by bubbling compressed CO2 gas into the tank. This level of CO2 was chosen for extended holding, as Kates et al. (2012) showed that acute exposure to 30 mg L−1 CO2 was sufficient to induce physiological alterations in adult large-mouth bass without impacting ventilation rate or inducing irregular activities (i.e., surface ventilations, coughing, loss of equilibrium), and, as such, the CO2 concentration used in the H treatment was chosen to maximize the likelihood of molecular/physiological acclimation. Concentrations of CO2 were held constant using a Pinpoint® pH controller (Pentair Aquatic Eco-Systems, Apopka, FL, USA), which regulated pH/CO2 levels using a pH probe connected to a solenoid valve attached to a tank of compressed CO2 gas. Dissolved CO2 concentrations were measured daily to con-firm that target CO2 concentrations were achieved. Aeration through the use of a blower was maintained in each tank to ensure that fish were not subjected to hypoxia (maintained at 8.5 ± 0.1 mg L−1 O2). Each acclimation tank was held at their respective dissolved CO2 concentration for 58 days, as previous research has shown 6–8 weeks was sufficient to induce plastic physiological changes to elevated CO2 alter-ing the activity of ion transport mechanisms in gills, as well as causing changes to plasma ion concentrations (Deigwei-her et al. 2008; Fivelstad et al. 2003).
Mean water quality measurements taken from the accli-mation tanks are presented in Table 1. Values for pCO2 were calculated using the program CO2calc (version 1.2.0, US Geological Survey, Reston, VA, USA) using water tem-perature, pH, and total alkalinity measurements (Robbins et al. 2010). The amount of time required to reach carbon-ate chemistry equilibrium within an open system can take as long as a few days (Riebesell et al. 2010), and, with the volume and rate of CO2 gas addition to the holding tanks, it was challenging to generate accurate pCO2 data. As such, the digital titrator was used as the main tool to quantify dis-solved CO2 and was used to standardize CO2 treatments between experiments. While pCO2 values are presented in Table 1, these data should be interpreted cautiously as water chemistry may not have been at equilibrium at the time of measurement. The temperature in the H tank (15.4 ± 0.2 °C) was not statistically different from the L tank (15.1 ± 0.2 °C) during the 58-day acclimation period (t test, t = 0.28, P > 0.05). The mean sizes of largemouth bass at the beginning of the acclimation period were not
300 J Comp Physiol B (2016) 186:297–311
1 3
statistically different across treatments: (L 148 ± 1.0 mm; H 148 ± 0.7 mm) (t test, t = 0.62, P > 0.05). Fish were withheld from supplemental food for at least 48 h prior to experimentation to ensure that food digestion would not impact molecular, physiological, or performance metrics.
Acute hypercarbia challenge
Following 58 days of acclimation, largemouth bass from both treatments were subjected to an acute hypercarbia challenge. Fish were carefully netted from the acclimation tanks and placed into individual opaque, sensory deprived containers (4.0 L per largemouth bass) continuously sup-plied with freshwater from a central basin. Water was allowed to overflow from each container and drain back into the central basin, creating a closed, recirculating sys-tem (Kates et al. 2012). The containers were sized appro-priately, contained an airstone for aeration, and were out-fitted with a tight-fitting lid to ensure that fish could not escape during the challenge. Fish were habituated to their containers for 24 h, while dissolved oxygen concentrations remained at 9.3 ± 0.1 mg L−1. Largemouth bass collected from the L tank were supplied with water at ambient CO2 conditions (14 ± 0.8 mg L−1 CO2) during this 24-h period, while fish collected from to the H tank were supplied with water at 32 ± 0.6 mg L−1 CO2. This experimental design (i.e., maintaining acclimation water quality conditions for baseline values) is similar to previous studies investigating the effect of extended holding in different water conditions on fish (Iwama and Heisler 1991; Logan and Somero 2011;
Melzner et al. 2009). Following this 24-h period, each con-tainer was randomly assigned to one of two treatments: (1) 1-h exposure to acclimation CO2 concentrations (i.e., control) or (2) 1-h exposure to 120 mg L−1 CO2. Exposure of fishes to CO2 concentrations of 120 mg L−1 have pre-viously been shown to induce behavioral (i.e., hypercarbia agitation and avoidance responses), reflex (i.e., ventilation and irregular activities), and physiological disturbances in adult largemouth bass (Kates et al. 2012), and 120 mg L−1 was therefore selected for the acute hypercarbia exposure, as it was expected to induce a molecular and physiological response in juvenile largemouth bass. Acute hypercarbia was achieved within 2 min by bubbling CO2 gas into the central basin and then pumping this water into specific con-tainers (Kates et al. 2012). Dissolved CO2 concentrations, presented in Table 1, were verified using a CO2 digital titra-tor using water samples taken from an extra test chamber within the system. Aeration was maintained throughout the trial to ensure fish were not exposed to hypoxic conditions (8.4 ± 0.1 mg L−1 O2). Fish exposed to ambient CO2 con-centrations (i.e., control treatment) remained undisturbed in their containers with no manipulation in water chemis-try. At the conclusion of the acute hypercarbia challenge, water flow was ceased, and test subjects were euthanized by an overdose of anesthetic [250 mg L−1 tricaine meth-anesulfonate (MS-222) buffered with 500 mg L−1 sodium bicarbonate].
Following cessation of ventilation, fish were measured and weighed, and blood was drawn from the caudal vas-culature using a 22-gauge needle and 1-mL syringe rinsed
Table 1 Water quality measurements at the conclusion of the 8-week acclimation period, acute hypercarbia challenge, and burst swim perfor-mance challenge
For the hypercarbia agitation and avoidance challenge, water quality parameters were taken during the 2-h acclimation period. Water quality measurements from tanks containing juvenile largemouth bass acclimated to ambient CO2 are designated by an L, while an H denotes water quality measurements taken from tanks containing CO2-acclimated largemouth bass. For the acute hypercarbia challenge and the swim perfor-mance challenge, water quality parameters were collected from four total treatments: LC control fish exposed to ambient CO2 water, LS control fish exposed to 120 mg L−1 CO2, HC CO2-acclimated fish exposed to control water, and HS CO2-acclimated fish exposed to 120 mg L−1 CO2
Temp (°C) Dissolved oxygen (mg L−1)
pH Total alkalinity (mg L−1)
Dissolved CO2 (mg L−1)
pCO2 (µatm)
Eight-week acclima-tion period
L 15.1 ± 0.2 L 8.5 ± 0.1 L 8.20 ± 0.02 L 147 ± 1 L 13 ± 0.2 L 1130 ± 42
H 15.4 ± 0.2 H 8.5 ± 0.1 H 6.93 ± 0.01 H 147 ± 1 H 31 ± 1 H 20,980 ± 711
with lithium heparin. To quantify hematocrit, whole blood was transferred to two 75-mm microhematocrit tubes (Drummond Scientific, Broomall, PA, USA) and spun for 2 min at 4400× gravity (g) in a microhematocrit centri-fuge (LW Scientific Zippocrit, Atlanta, GA). The remaining whole blood was centrifuged for 2 min at 2000g to separate red blood cells from plasma. Plasma was transferred to 1.5-mL microcentrifuge tubes, and then plasma and red blood cells were immediately stored in liquid nitrogen. Gill fila-ments, hereafter referred to as gill tissue, were excised and stored in a 1.5-mL microcentrifuge tube filled with 1 mL of RNAlater® (AM7021, Life Technologies, Grand Island, NY, USA). Tissue samples were refrigerated for 1–7 days and then stored at −80 °C. Water quality measurements were collected at the conclusion of each test subject’s chal-lenge to confirm that proper water chemistry conditions were achieved during the challenge and are presented in Table 1. The mean size of largemouth bass subjected to acute hypercarbia challenge was not statistically different across treatments: (LC 159 ± 2 mm; LS 157 ± 2 mm; HC 156 ± 2 mm; HS 157 ± 1 mm) (one-way analysis of vari-ance (ANOVA), F = 0.56, P = 0.64). Sample size for lar-gemouth bass subjected to acute hypercarbia challenge was N = 10 for fish acclimated to ambient CO2 and N = 9 for fish acclimated to 30 mg L−1 CO2.
Hypercarbia avoidance challenge
Prior to the 8-week acclimation, 24 largemouth bass were implanted with a passive integrated transponder tag (PIT tag) (TX1411SSL, VeriTeQ, Delray Beach, FL, USA) and allowed to recover for 1 week. Following this recovery period, individuals were subjected to an ‘initial’ hyper-carbia avoidance challenge. Quantification of hypercarbia agitation and avoidance parameters was performed using a ‘shuttle box’ choice arena (Loligo Inc., Hobro, Den-mark) (Serrano et al. 2010). Kates et al. (2012) provides a description of the ‘shuttle box’ choice arena, along with a general protocol for the hypercarbia avoidance challenge. Briefly, the hypercarbia avoidance challenge began by care-fully netting a PIT-tagged fish, confirmed through the use of a handheld electronic PIT tag reader (Pocket Reader EX, Biomark, Inc., Boise, ID, USA), and randomly placing the fish into one of the two ‘shuttle box’ holding tanks. Indi-viduals were allowed 2 h to habituate to the ‘shuttle box’. Upon completion of the acclimation period, the buffer chamber associated with the holding tank that contained the fish received a continuous addition of CO2, while the buffer chamber associated with the holding tank that did not con-tain the fish received a continuous addition of compressed air to strip CO2 from the water. During the addition of CO2, the time was recorded when the fish became agitated (i.e., surface ventilations, twitching, elevated/erratic swimming),
shuttled to the opposite holding tank via the tunnel, or lost equilibrium. Concurrently, water quality measurements were taken from water flowing into the buffer chamber. To avoid potential complications with residual CO2 that could influence results, behavioral data were only collected from a fish once, and behavioral trials concluded when a fish shuttled into the opposite holding tank. At the conclusion of the hypercarbia avoidance challenge, fish were removed from the system to be weighed and measured, and were then gently placed into one of the indoor holding tanks. PIT-tagged largemouth bass were then randomly assigned into one of the indoor acclimation tanks. The mean size of largemouth bass subjected to the ‘initial’ hypercarbia avoidance challenge was not statistically different across acclimation groups: (L 141 ± 2 mm; H 140 ± 1 mm) (t test, t = 0.77, P > 0.05).
Following the 58-day acclimation period, individual PIT-tagged largemouth bass were randomly selected and subjected to a ‘final’ hypercarbia avoidance challenge. The ‘final’ hypercarbia avoidance challenge was identi-cal to the ‘initial’ hypercarbia avoidance challenge, and fish ID # was read prior to the ‘final’ treatment to identify individuals allowing inter-trial comparisons. Initial water quality parameters during the 2-h acclimation period for fish subjected to the hypercarbia avoidance challenge are presented in Table 1. The size of largemouth bass subjected to the ‘final’ hypercarbia avoidance challenge did not dif-fer statistically across acclimation groups (L 153 ± 2 mm; H 150 ± 1 mm) (t test, t = 0.23, P > 0.05). The sample size for largemouth bass subjected to the ‘final’ hypercar-bia avoidance challenge was N = 12 for each acclimation group.
Swim performance challenge
Following the 8-week acclimation, largemouth bass were subjected to a burst swimming performance challenge, which was quantified using a swim tunnel respirometer (SW10160, Loligo Inc., Hobro, Denmark) (Melzner et al. 2009). Individual fish, randomly selected from the acclima-tion tanks, were weighed and measured (total length, width, and depth in mm), and then gently placed into the swimming chamber. Fish were allowed to habituate for 2 h at a water velocity of 0.5 body lengths per second (BL s−1), a duration of time that should allow recovery from handling stressors (Suski et al. 2007) and that has been used previously with studies of swimming performance in fishes (Gregory and Wood 1998). Ten minutes prior to the conclusion of the acclimation period, the ‘flush’ pump, which circulates water from the respirometer to the water bath, was turned off to isolate the swimming chamber from the external water bath. The individual was then randomly assigned to one of two swim performance challenges: (1) swim challenge at
302 J Comp Physiol B (2016) 186:297–311
1 3
acclimation CO2 or (2) swim challenge at 120 mg L−1 CO2. Hypercarbic conditions were achieved within 2 min by bub-bling compressed CO2 gas into the water bath. The ‘flush’ pump was activated 5 min later to expose the test subject to hypercarbia, and the target-dissolved CO2 concentrations were verified using the CO2 digital titrator. Fish subjected to ambient CO2 concentrations experienced an identical pro-cedure, except for the addition of CO2. Following the 2-h acclimation period, water velocity was steadily increased at a rate of 10 cm s−1 min−1 (Reidy et al. 1995), resulting in a burst swimming challenge. The burst swimming challenge was considered complete when the test subject became impinged on the back of the swimming chamber for 10 s, at which point the time and burst swimming velocity (BL s−1) was recorded. Upon conclusion of the swim performance challenge, individuals were euthanized and water quality measurements were taken from the external water bath and are presented in Table 1. The mean size of largemouth bass subjected to the burst swimming challenge was not statis-tically different across treatments: (LC 161 ± 2 mm; LS 158 ± 1 mm; HC 160 ± 2 mm; HS 158 ± 2 mm) (one-way ANOVA, F = 0.66, P = 0.58). The sample size for large-mouth bass subjected to the burst swimming challenge was N = 8 for all treatments.
Quantification of physiological parameters
Plasma cortisol was quantified using a commercially avail-able kit (ADI-900-071, Enzo Life Sciences Inc., Farm-ingdale, NY, USA). Plasma sodium concentrations were determined using a flame photometer (model 2655-00, Cole-Palmer Instrument Company, Chicago, IL, USA), while plasma chloride concentrations were quantified using a chloridometer (model 4435000, Lab-conco Corporation, Kansas City, MO, USA). Following the methods of Lowry and Passonneau (1972), plasma lactate and glucose concen-trations were determined enzymatically in a 96-well micro-plate and analyzed with a commercially available spec-trophotometer (Spectra Max Plus 384, model No. 05362, Molecular Devices, Union City, CA, USA).
Quantification of molecular parameters
All tissue samples, submerged in 1 mL of TRI Reagent (Ambion, Life Technologies, Grand Island, NY, USA), were homogenized for 1 min using a mechanical homog-enizer (Tissue-Tearor®, model No. 935370, Biospec Prod-ucts Inc., Bartlesville, OK, USA). Total RNA from red blood cells, hereafter referred to as erythrocytes, were isolated using an Ambion RiboPure Blood Kit (AM1928, Life Technologies, Grand Island, NY, USA) with the fol-lowing modifications to the protocol to maximize RNA integrity and quantity: (1) erythrocytes were thawed on ice, as RNAlater® was not utilized prior to storage in liq-uid nitrogen, and (2) Ambion DNase (AM1906, Life Tech-nologies, Grand Island, NY, USA) was applied to extracted RNA to eliminate any genomic DNA. Total RNA from gill tissue was isolated and extracted, using an Ambion RiboPure Kit (AM1924, Life Technologies, Grand Island, NY, USA), and then Ambion DNase was applied to remove any remaining genomic DNA. Following DNase treatment, a Nanodrop ND-1000 UV–Vis spectrophotometer (Peqlab, Erlangen, Germany) was used to quantify the yield and purity of the extracted RNA. The RNA integrity was con-firmed using gel electrophoresis. Extracted RNA was fro-zen at −80 °C. The synthesis of cDNA was accomplished using a High-Capacity cDNA Reverse Transcription kit (ABI No. 4374966, Life Technologies, Grand Island, NY, USA), such that 2 µg of total RNA was present in a reac-tion volume of 20 µL. An Eppendorf Mastercycler® Pro thermal cycler (Eppendorf, Hamburg, Germany) was used to run the following cDNA synthesis reaction: (1) 10 min at 25 °C to activate enzymes, (2) 2 h at 37 °C for incubation, and (3) 5 min at 85 °C to denature enzymes. All cDNA was then stored at −20 °C.
Juvenile largemouth bass qPCR primer sequences, melt-ing temperature, and fragment length information are pro-vided in Table 2. All qPCR reactions were performed using 1 µL of stock cDNA (diluted 1:25 using RNase-free water), 1 µL of each qPCR primer pair (1 µM concentration), 2 µL of RNase-free water, and 5 µL of RealMasterMix™ Fast
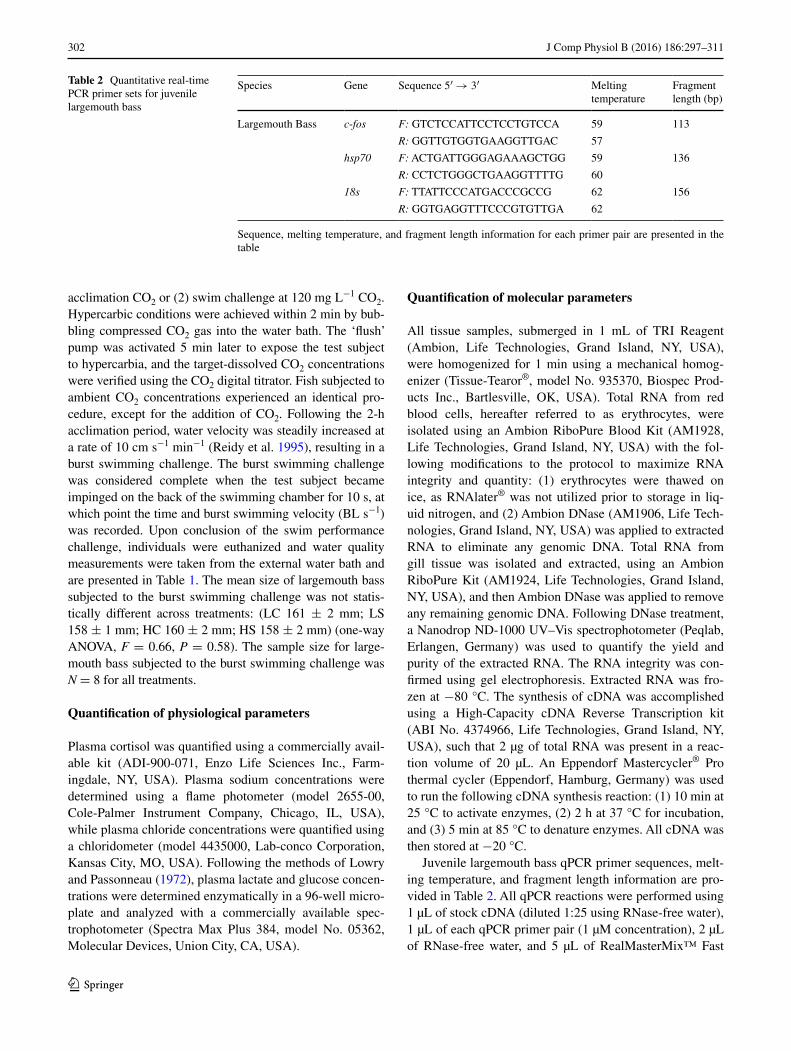
Table 2 Quantitative real-time PCR primer sets for juvenile largemouth bass
Sequence, melting temperature, and fragment length information for each primer pair are presented in the table
SYBR ROX kit (No. 2200840, 5 PRIME Inc., Gaithers-burg, MD, USA). An ABI 7900HT Fast Real-Time PCR System (Life Technologies, Grand Island, NY, USA) was utilized to conduct gene expression analyses using the following protocol: 1 cycle at 50 °C for 2 min, 1 cycle at 95 °C for 10 min, followed by 40 cycles at (1) 95 °C for 15 s and (2) 60 °C for 1 min. After the completion of these 40 cycles, all qPCR products underwent a melt curve anal-ysis (1 cycle at 95 °C for 15 s, 1 cycle at 60 °C for 15 s, and 1 cycle at 95 °C for 15 s) to confirm the presence of a single amplicon. Relative standard curves for the reference (18s) and all target (c-fos and hsp70) genes were created using several, highly induced samples to compare cDNA concentration to threshold cycle for each qPCR primer pair. Relative cDNA concentration was normalized using 18s, as mRNA concentrations of this reference gene remained con-stant across all treatments (ANOVA, P > 0.05). To detect potential genomic DNA contamination, an identical qPCR analysis was performed on the extracted RNA that had not been reverse-transcribed. Genomic DNA contamination was determined to be negligible if (1) at least 5 Cts differ-ence was observed between RT-positive and RT-negative samples (Mancebo et al. 2013), and (2) RT-negative and NTC samples were outside the detection limit of the stand-ard curve (Lewis et al. 2010).
Statistical analysis
Comparisons of physiological parameters in largemouth bass exposed to an acute hypercarbia challenge were per-formed using a two-way analysis of variance (ANOVA) with acclimation (H and L), acute exposure (acclimation CO2 and 120 mg L−1 CO2), and their interaction (acclima-tion × acute exposure) entered as fixed effects. If the inter-action term was significant, or if any of the main effects were significant, a Tukey–Kramer honestly significant differences (HSD) post hoc test was applied to separate means (Sokal and Rohlf 1995). Comparisons of stress gene expression in the gills and erythrocytes of largemouth bass exposed to an acute hypercarbia challenge were also made using a two-way ANOVA with acclimation, acute exposure, and their interaction entered as fixed effects. A Tukey–Kramer HSD post hoc test was applied to separate means where appropriate (Sokal and Rohlf 1995).
Comparisons of CO2 agitation and avoidance responses of largemouth bass subjected to the hypercarbia avoidance challenge were performed using a two-way ANOVA with test period (initial or final), acclimation, and their interac-tion (test period × acclimation) entered as fixed effects, while fish identification number was entered as a random effect. A Tukey–Kramer HSD post hoc test was again used to separate means where appropriate (Sokal and Rohlf 1995).
Comparisons of burst swimming performance (i.e., burst swimming velocity and time until exhaustion) in large-mouth bass exposed to an acute hypercarbia challenge were made using a two-way ANOVA with acclimation, acute exposure, and their interaction entered as fixed effects, fol-lowed by a Tukey–Kramer HSD post hoc test to separate means (Sokal and Rohlf 1995).
For all experiments, data were log transformed, if nec-essary, to meet assumptions of normality and homogeneity of variances (Zar 1984). A visual analysis of fitted residu-als, using a normal probability plot (Anscombe and Tukey 1963), was used to assess normality, while Hartley’s Fmax test (Hartley 1950), combined with visual inspection of the distribution of fitted residuals, were used to assess the homogeneity of variances. A two-way Kruskal–Wallis test (Sokal and Rohlf 1995; Zar 1984) was performed in lieu of a two-way ANOVA if either normality or homogeneity of variance assumptions were violated. If the interaction term, or any of the main effects, were significant, a Steel–Dwass all-pair multiple comparison test was applied to separate means (Douglas and Michael 1991). All means are reported as ±SE where appropriate. Two-way Kruskal–Wallis test and Hartley’s Fmax test calculations were accomplished by hand using Zar (1984) as a template, while all other statisti-cal analyses were performed using the JMP version 9.0.2 (SAS Institute Inc., Cary, NC, USA). All tests were run at a significance level (α) of 0.05.
Results
Following a 1-h exposure to 120 mg L−1 CO2, c-fos tran-scripts in the gill tissue of largemouth bass exhibited a 25-fold and 29-fold up-regulation, for fish in the ambient CO2 and elevated CO2 acclimation group, respectively, rel-ative to controls (Fig. 1a; Table 3). Largemouth bass in the group acclimated to elevated CO2 also had approximately threefold higher constitutive expression of c-fos mRNA in erythrocytes compared to fish in the ambient CO2 group (Fig. 1a; Table 3). Concentrations of hsp70 transcripts in both gill tissue and erythrocytes for largemouth bass accli-mated to elevated CO2 were twofold and five- to eightfold greater (respectively) than largemouth bass held at ambient CO2 (Fig. 1b; Table 3).
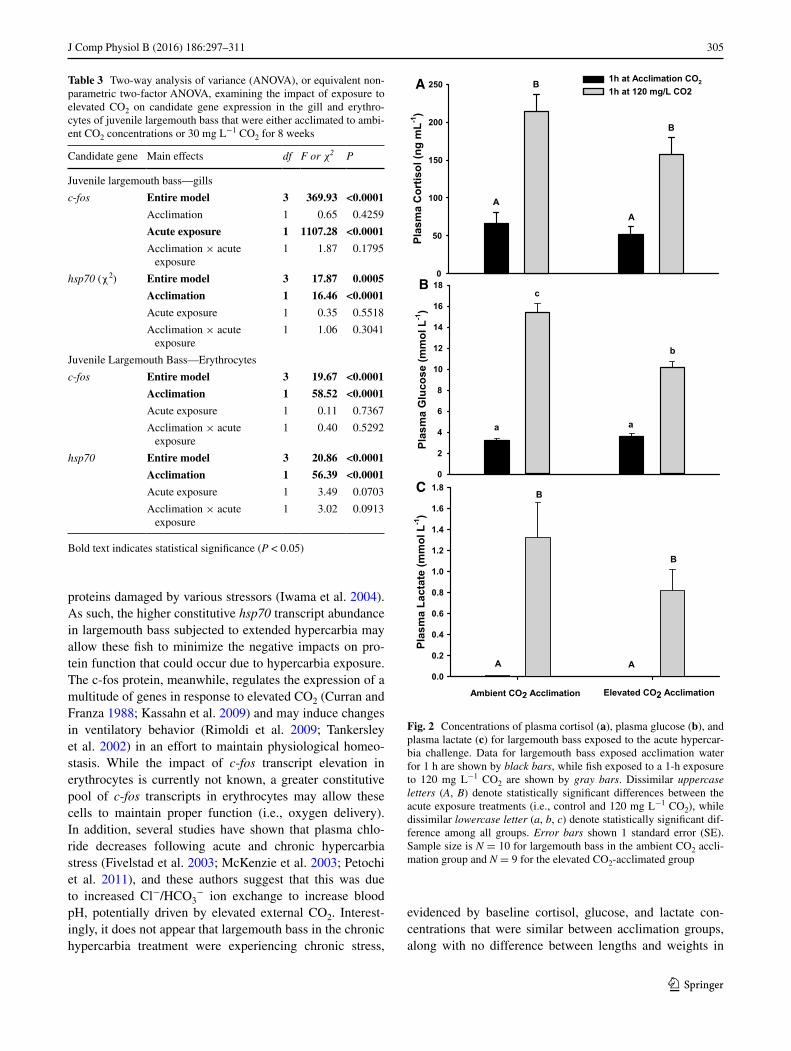
One-hour exposure to 120 mg L−1 CO2 caused a three-fold increase in plasma cortisol concentrations for large-mouth bass, regardless of the acclimation group (Fig. 2a; Table 4). One-hour exposure to 120 mg L−1 CO2 also resulted in a fivefold increase in plasma glucose in fish acclimated to ambient CO2, but only a threefold increase in fish acclimated to 30 mg L−1 (Fig. 2b; Table 4). Regard-less of the acclimation group, largemouth bass exposed to 120 mg L−1 CO2 for 1 h experienced increased plasma
304 J Comp Physiol B (2016) 186:297–311
1 3
lactate concentrations (Fig. 2c; Table 4). Plasma sodium concentrations did not differ between acclimation groups or the acute exposure treatments (Tables 4, 5). Largemouth bass acclimated to elevated CO2 showed a 5 % reduc-tion in plasma chloride compared to fish acclimated to ambient CO2 (Tables 4, 5). Similarly, an acute exposure to 120 mg L−1 CO2 resulted in a 5 % decrease in plasma chloride concentrations relative to controls (Tables 4, 5).
Regardless of the acclimation group, largemouth bass exposed to an acute hypercarbia stressor showed a signifi-cant increase in hematocrit (Tables 4, 5).
Exposure of largemouth bass to elevated CO2 within the shuttle box induced an agitation response, followed by active CO2 avoidance as animals left the area of high CO2. More specifically, largemouth bass acclimated to ambient CO2 displayed agitation responses at approxi-mately 60 mg L−1 CO2, while largemouth bass acclimated to elevated CO2 did not display agitated responses until 105 mg L−1 (Fig. 3a; Table 6). This difference in agitation responses between acclimation groups was driven by the twofold increase in CO2 concentration necessary to induce agitation in largemouth bass that were exposed to elevated CO2 for 8 weeks. Largemouth bass acclimated to elevated CO2 in the ‘final’ time period also required a greater CO2 concentration to display an active avoidance response (approximately 160 mg L−1 CO2) relative to fish in the ‘initial’ time period (approximately, 110 mg L−1 CO2); however, this difference was not statistically significant (Fig. 3b; Table 6). Exposure of largemouth bass to elevated CO2 within the swim tunnel resulted in a reduction of burst swimming performance, but only for fish that remained at ambient CO2 concentrations during acclimation. More specifically, exposure to 120 mg L−1 CO2 resulted in lar-gemouth bass acclimated to ambient CO2 exhibiting a threefold decrease in the duration of the swimming trial (Fig. 4a) and a twofold decrease in burst swimming veloc-ity (Fig. 4b) relative to largemouth bass exposed to con-trol conditions or elevated CO2-acclimated largemouth bass subjected to 120 mg L−1 CO2 (duration: F[3] = 8.42, P = 0.0004; velocity: F[3] = 8.97, P = 0.0003).
Discussion
An 8-week exposure to 30 mg L−1 CO2 induced a number of alterations to molecular and physiological parameters in juvenile largemouth bass. More specifically, largemouth bass acclimated to an elevated CO2 environment had con-stitutively higher expression of c-fos mRNA in eryth-rocytes, along with elevated hsp70 gill and erythrocyte mRNA, compared to control fish. In addition, largemouth bass acclimated to elevated CO2 exhibited plasma chlo-ride concentration reductions of approximately 5 % rela-tive to largemouth bass acclimated to ambient CO2. Previ-ous studies on a wide range of organisms have shown that prolonged exposure of individuals to altered environmental conditions can induce plastic changes to biological prop-erties, a process commonly known as phenotypic plastic-ity (Chevin et al. 2010). Heat shock protein transcripts are typically induced to maintain homeostasis within a cell by facilitating folding of nascent proteins, as well as repairing
A
B
Fig. 1 Tissue-specific relative mRNA expression for c-fos (a) and hsp70 (b) in largemouth bass exposed to an acute hypercarbia chal-lenge. Relative mRNA expression for gill tissue is shown by black bars, while erythrocyte mRNA expression is shown by gray bars. Four groups of fish were subjected to the acute hypercarbia chal-lenge: control fish exposed to ambient water for 1 h, CO2-acclimated fish exposed to acclimation water (30 mg L−1 CO2) for 1 h, control fish exposed to 120 mg L−1 CO2 for 1 h, and CO2-acclimated fish exposed to 120 mg L−1 CO2 for 1 h. Dissimilar uppercase letters (A, B) denote statistically significant differences between the acute exposure treatments (i.e., control and 120 mg L−1 CO2), while dis-similar Greek letters (α, β) denote statistically significant differences between the acclimation groups. Data are mean ± SE, calculated rel-ative to the expression of the reference gene (i.e., 18s). For clarity, data are expressed relative to the mean of ambient CO2-acclimated largemouth bass exposed to ambient water for 1 h. The sample size is N = 10 for largemouth bass in the ambient CO2 acclimation group and N = 9 for the elevated CO2-acclimated group
305J Comp Physiol B (2016) 186:297–311
1 3
proteins damaged by various stressors (Iwama et al. 2004). As such, the higher constitutive hsp70 transcript abundance in largemouth bass subjected to extended hypercarbia may allow these fish to minimize the negative impacts on pro-tein function that could occur due to hypercarbia exposure. The c-fos protein, meanwhile, regulates the expression of a multitude of genes in response to elevated CO2 (Curran and Franza 1988; Kassahn et al. 2009) and may induce changes in ventilatory behavior (Rimoldi et al. 2009; Tankersley et al. 2002) in an effort to maintain physiological homeo-stasis. While the impact of c-fos transcript elevation in erythrocytes is currently not known, a greater constitutive pool of c-fos transcripts in erythrocytes may allow these cells to maintain proper function (i.e., oxygen delivery). In addition, several studies have shown that plasma chlo-ride decreases following acute and chronic hypercarbia stress (Fivelstad et al. 2003; McKenzie et al. 2003; Petochi et al. 2011), and these authors suggest that this was due to increased Cl−/HCO3
− ion exchange to increase blood pH, potentially driven by elevated external CO2. Interest-ingly, it does not appear that largemouth bass in the chronic hypercarbia treatment were experiencing chronic stress,
evidenced by baseline cortisol, glucose, and lactate con-centrations that were similar between acclimation groups, along with no difference between lengths and weights in
Table 3 Two-way analysis of variance (ANOVA), or equivalent non-parametric two-factor ANOVA, examining the impact of exposure to elevated CO2 on candidate gene expression in the gill and erythro-cytes of juvenile largemouth bass that were either acclimated to ambi-ent CO2 concentrations or 30 mg L−1 CO2 for 8 weeks
Bold text indicates statistical significance (P < 0.05)
Candidate gene Main effects df F or χ2 P
Juvenile largemouth bass—gills
c-fos Entire model 3 369.93 <0.0001
Acclimation 1 0.65 0.4259
Acute exposure 1 1107.28 <0.0001
Acclimation × acute exposure
1 1.87 0.1795
hsp70 (χ2) Entire model 3 17.87 0.0005
Acclimation 1 16.46 <0.0001
Acute exposure 1 0.35 0.5518
Acclimation × acute exposure
1 1.06 0.3041
Juvenile Largemouth Bass—Erythrocytes
c-fos Entire model 3 19.67 <0.0001
Acclimation 1 58.52 <0.0001
Acute exposure 1 0.11 0.7367
Acclimation × acute exposure
1 0.40 0.5292
hsp70 Entire model 3 20.86 <0.0001
Acclimation 1 56.39 <0.0001
Acute exposure 1 3.49 0.0703
Acclimation × acute exposure
1 3.02 0.0913
A
B
C
Fig. 2 Concentrations of plasma cortisol (a), plasma glucose (b), and plasma lactate (c) for largemouth bass exposed to the acute hypercar-bia challenge. Data for largemouth bass exposed acclimation water for 1 h are shown by black bars, while fish exposed to a 1-h exposure to 120 mg L−1 CO2 are shown by gray bars. Dissimilar uppercase letters (A, B) denote statistically significant differences between the acute exposure treatments (i.e., control and 120 mg L−1 CO2), while dissimilar lowercase letter (a, b, c) denote statistically significant dif-ference among all groups. Error bars shown 1 standard error (SE). Sample size is N = 10 for largemouth bass in the ambient CO2 accli-mation group and N = 9 for the elevated CO2-acclimated group
306 J Comp Physiol B (2016) 186:297–311
1 3
the two groups. Other studies that have acclimated fishes to an elevated CO2 environment have shown similar results, such as Santos et al. (2013) and Petochi et al. (2011), who
showed that European sea bass acclimated for 45–60 days exposure to hypercarbia did not have elevated plasma cor-tisol, glucose, or lactate compared to control fish. Together, results from the current study clearly demonstrate that juvenile largemouth bass have the capacity to acclimate to an elevated CO2 environment, with alterations to a number of molecular and physiological parameters occurring.
Largemouth bass from both acclimation groups exhib-ited several molecular and physiological changes across a number of stress pathways following an acute hypercarbia exposure. More specifically, largemouth bass c-fos gill tran-scripts were upregulated nearly 30-fold following exposure to 120 mg L−1 CO2. In addition, plasma cortisol, glucose, lactate, and hematocrit increased in largemouth bass fol-lowing exposure to acute hypercarbia, while plasma chlo-ride concentrations decreased approximately 5 % in fish exposed to 120 mg L−1 CO2. The physiological response of fishes to an acute hypercarbia exposure has been well stud-ied, and includes an initial elevation in blood pCO2, reduc-tion in blood pH, and a subsequent increase in bicarbonate (HCO3
−) to increase blood pH to basal levels [reviewed in (Brauner and Baker 2009; Perry and Gilmour 2006)]. The ventilation frequency of fishes (Perry and Gilmour 2006), along with elevations of stress indicators (i.e., plasma cortisol and glucose) (Bernier and Randall 1998; Iwama et al. 1989), have also been shown to be impacted by acute hypercarbia exposure. Secondary responses to stress, such as increasing plasma glucose and lactate concentrations (Barton 2002; Wendelaar Bonga 1997), have been observed in rainbow trout (Bernier and Randall 1998) and large-mouth bass (Kates et al. 2012) following acute hypercarbia exposure. Increasing plasma glucose concentrations associ-ated with stress response can help fuel aerobic tissues, such as heart or gills, that are under stress (Wendelaar Bonga 1997), while elevations in plasma lactate concentrations may signal decreasing tissue oxygen supply as lactate is produced when tissues switch from aerobic to anaerobic metabolism (Bernier and Randall 1998). Hematocrit con-centrations have also been shown to increase approximately
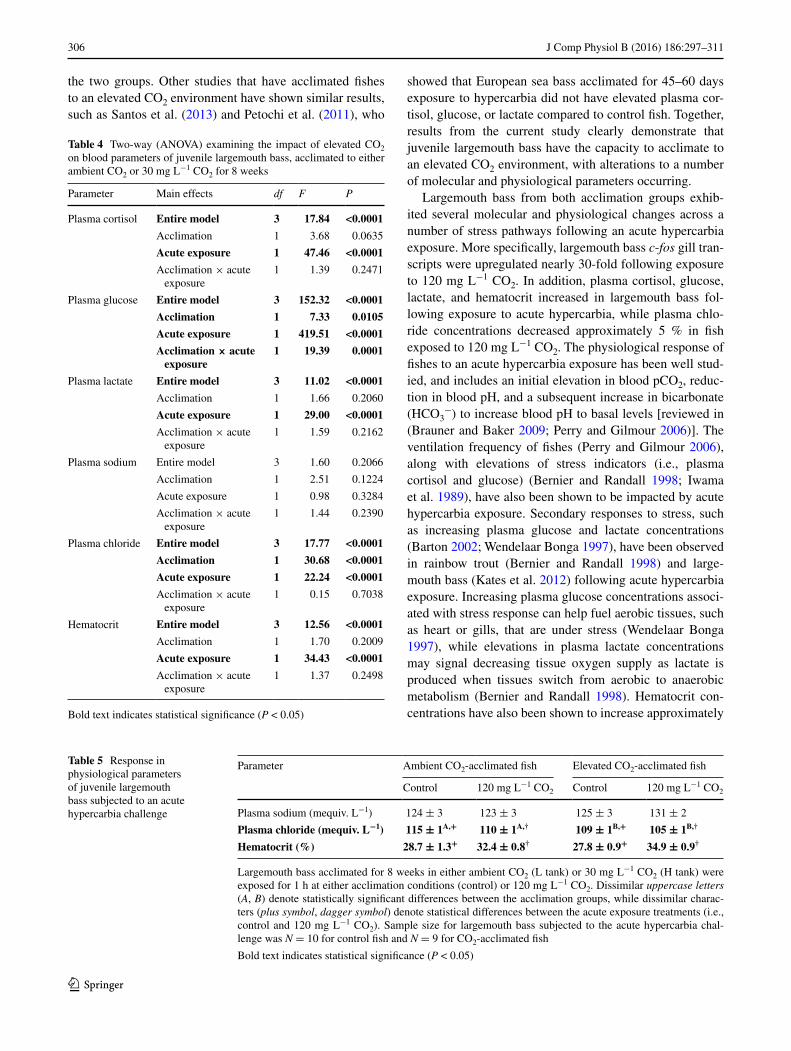
Table 4 Two-way (ANOVA) examining the impact of elevated CO2 on blood parameters of juvenile largemouth bass, acclimated to either ambient CO2 or 30 mg L−1 CO2 for 8 weeks
Bold text indicates statistical significance (P < 0.05)
Parameter Main effects df F P
Plasma cortisol Entire model 3 17.84 <0.0001
Acclimation 1 3.68 0.0635
Acute exposure 1 47.46 <0.0001
Acclimation × acute exposure
1 1.39 0.2471
Plasma glucose Entire model 3 152.32 <0.0001
Acclimation 1 7.33 0.0105
Acute exposure 1 419.51 <0.0001
Acclimation × acute exposure
1 19.39 0.0001
Plasma lactate Entire model 3 11.02 <0.0001
Acclimation 1 1.66 0.2060
Acute exposure 1 29.00 <0.0001
Acclimation × acute exposure
1 1.59 0.2162
Plasma sodium Entire model 3 1.60 0.2066
Acclimation 1 2.51 0.1224
Acute exposure 1 0.98 0.3284
Acclimation × acute exposure
1 1.44 0.2390
Plasma chloride Entire model 3 17.77 <0.0001
Acclimation 1 30.68 <0.0001
Acute exposure 1 22.24 <0.0001
Acclimation × acute exposure
1 0.15 0.7038
Hematocrit Entire model 3 12.56 <0.0001
Acclimation 1 1.70 0.2009
Acute exposure 1 34.43 <0.0001
Acclimation × acute exposure
1 1.37 0.2498
Table 5 Response in physiological parameters of juvenile largemouth bass subjected to an acute hypercarbia challenge
Largemouth bass acclimated for 8 weeks in either ambient CO2 (L tank) or 30 mg L−1 CO2 (H tank) were exposed for 1 h at either acclimation conditions (control) or 120 mg L−1 CO2. Dissimilar uppercase letters (A, B) denote statistically significant differences between the acclimation groups, while dissimilar charac-ters (plus symbol, dagger symbol) denote statistical differences between the acute exposure treatments (i.e., control and 120 mg L−1 CO2). Sample size for largemouth bass subjected to the acute hypercarbia chal-lenge was N = 10 for control fish and N = 9 for CO2-acclimated fish
Bold text indicates statistical significance (P < 0.05)
Parameter Ambient CO2-acclimated fish Elevated CO2-acclimated fish
30 % following an acute exposure to 30 mg L−1 CO2 for European sea bass and largemouth bass (Kates et al. 2012; Petochi et al. 2011), similar to the 12–25 % increase observed in the current study, with the authors suggesting that increased hematocrit levels improve oxygen transport during acute hypercarbia exposure. It is currently unknown whether hematocrit levels in this study were elevated due
to the release of additional red blood cells from the spleen or swelling of the existing blood cells. As such, additional research is necessary to determine whether increased hema-tocrit in largemouth bass exposed to CO2 actually improved their oxygen transport capability by releasing more blood cells. Brauner et al. (2000), along with Petochi et al. (2011), also observed reductions in plasma Cl− following hypercarbia exposure in Atlantic salmon and European sea bass, respectively, and the authors suggested this was due to the elevated activity of Cl−/HCO3
− exchangers allow-ing the uptake of HCO3
− from the external environment in exchange for plasma Cl− to buffer further reductions in blood pH. In addition to these plasma parameters, c-fos gill transcripts were also induced following an acute expo-sure to 120 mg L−1 CO2. Rimoldi et al. (2009) exposed European sea bass for 1 h at 70 mg L−1 CO2 and found that brain c-fos transcripts doubled in hypercarbia treated fish compared to control fishes, and the authors suggested that this increased c-fos expression may be involved in the ventilatory response to hypercarbia. Therefore, the results of this current study clearly demonstrate that exposure of largemouth bass to 120 mg L−1 CO2 for 1-h period caused alterations in molecular and physiological parameters, likely due to disruption in acid–base regulation.
Acclimation to an elevated CO2 environment for 8 weeks impacted a number of behavioral and physiological responses in juvenile largemouth bass. More specifically, CO2-acclimated largemouth bass required 50 % higher CO2 compared to ambient CO2-acclimated fishes during shuttle box trials and, while not statistically significant, largemouth bass acclimated to 30 mg L−1 CO2 tolerated a greater CO2 concentration (160 mg L−1) prior to display-ing active avoidance by voluntarily shuttling to the other compartment of the shuttle box. Molecular and physiologi-cal alterations that occurred during hypercarbia acclima-tion may have increased the capacity of largemouth bass to respond to an additional elevated CO2 stressor, such as the hypercarbia avoidance challenge. For example, the reduced concentration of plasma glucose in largemouth bass accli-mated to 30 mg L−1 CO2 relative to control fish follow-ing exposure to an acute hypercarbia stressor suggests that this type of stressor is not as energetically demanding for fish that have been acclimated to an elevated CO2 environ-ment, as glucose is released as secondary stress parameter that fuels aerobic tissues (Barton 2002; Wendelaar Bonga 1997), thus potentially allowing elevated CO2-acclimated fish to withstand hypercarbia challenges of greater intensity before inducing behavioral responses to hypercarbia stress. Elevated hematocrit levels shown in CO2-acclimated large-mouth bass following exposure to 120 mg L−1 CO2 may have improved oxygen uptake and transport (Wells 2009), which was potentially impacted by reductions in plasma pH due to acute hypercarbia exposure (Bernier and Randall
A
B
Fig. 3 Concentration of CO2 at which largemouth bass displayed either an agitated activity (i.e., surface ventilation, twitching, or erratic/elevated swimming) (a) or active avoidance of CO2 by mov-ing out of a high CO2 environment to a lower CO2 environment (b) during the course of the hypercarbia avoidance challenge. Two groups of fish were subjected to an ‘initial’ hypercarbia avoidance challenge (i.e., before an 8-week exposure to acclimation CO2 conditions). Fol-lowing 58 days of acclimation, these fish were subjected to a ‘final’ hypercarbia avoidance challenge (i.e., after an 8-week exposure to acclimation CO2 conditions). Dissimilar Greek letters (α, β) denote statistically significant differences between the acclimation groups. For box plots, the top and bottom of the box represent the 75th and 25th percentiles (respectively), while the horizontal line within the box represents the median; whiskers (error bars) above and below the box represent the 90th and 10th percentiles. Sample size for lar-gemouth bass subjected to the ‘initial’ and ‘final’ hypercarbia avoid-ance challenge was N = 12 for the ambient CO2 and elevated CO2-acclimated group
308 J Comp Physiol B (2016) 186:297–311
1 3
1998). Improved oxygen update and transport may allow CO2-acclimated fishes to display agitation and avoidance responses at greater CO2 concentrations. Additionally, con-stitutively elevated hsp70 transcripts in the CO2-acclimated group likely conferred a greater ability for oxygen uptake and transport in erythrocytes of CO2-acclimated large-mouth bass relative to control fish, as greater heat shock
protein transcript expression may allow proteins within erythrocytes to function properly under acute stressors (Iwama et al. 2004; Wells 2009). Interestingly, the con-centration of CO2 that induced avoidance was not statisti-cally different between the acclimation groups, suggesting that there may be a potential CO2 threshold at which fishes choose to swim away from elevated CO2 zones, independ-ent of acclimation history; research with multiple CO2 acclimation concentrations will be necessary to definitively address this hypothesis. Therefore, the results of the cur-rent study clearly demonstrate that CO2-acclimated fish have increased tolerance to additional hypercarbic stress-ors relative to naïve fish, possibly driven by physiological changes following acclimation; however, these changes did not influence the avoidance response.
Burst swimming performance (i.e., time until exhaustion, burst swimming velocity) of CO2-acclimated largemouth bass was not impacted by prolonged exposure to 30 mg L−1 CO2; however, largemouth bass acclimated to a high CO2 environ-ment were able to maintain swimming performance following an acute hypercarbia stressor, unlike control fish. Physiologi-cal alterations (i.e., decrease in plasma chloride) that occurred in largemouth bass following acclimation to the elevated CO2 environment likely allowed these fish to maintain swim-ming performance following exposure to 120 mg L−1 CO2 compared to control fish. Similar conclusions were reached in previous studies of European eel (Anguilla Anguilla) and Atlantic cod (McKenzie et al. 2003; Melzner et al. 2009), as both of these species showed no reduction in locomotory per-formance following extended hypercarbia exposure. Dahlberg et al. (1968) subjected juvenile largemouth bass to 50 mg L−1 CO2 and found that swimming speed was not impacted; however, a similar exposure in juvenile coho salmon (Onco-rhynchus kisutch) resulted in a depressed swimming perfor-mance. Thus, an improved ability to regulate plasma anions in response to hypercarbia acclimation likely allows elevated CO2-acclimated largemouth bass to maintain blood pH and blood PO2 compared to naïve largemouth bass, potentially providing a mechanism to explain how CO2-acclimated fish maintained burst swimming speed following acute exposure to 120 mg L−1 CO2 compared to control fish that experienced a reduction in burst swimming velocity.
Table 6 Two-way analysis of variance (ANOVA), with fish identification number was entered as a random effect, examining the CO2 agitation and avoidance response of juvenile largemouth bass before and after the 8-week acclimation period
Bold text indicates statistical significance (P < 0.05)
Parameter Main effects df F P
CO2 concentration-induced agitation Test period 1 1.81 0.1907
Acclimation 1 5.81 0.0236
Test period × acclimation 1 3.65 0.0677
CO2 concentration-induced avoidance Test period 1 1.72 0.1961
Acclimation 1 0.05 0.8272
Test period × acclimation 1 0.05 0.8208
A
B
Fig. 4 Time of exhaustion (a) and burst swimming velocity (b) at the conclusion of the burst swim performance challenge for largemouth bass acclimated to two different CO2 concentrations. Largemouth bass exposed to acclimation water are shown by black bars, while fish exposed to 120 mg L−1 CO2 are shown by gray bars. Dissimi-lar lowercase letters (a, b) denote statistically significant difference among the four groups. Data are shown at mean ± SE. Eight large-mouth bass is the sample size for each group
309J Comp Physiol B (2016) 186:297–311
1 3
This study can provide insight into how aquatic organ-isms might acclimate to chronic hypercarbic conditions and continue to thrive. Elevated dissolved CO2 concen-trations occur naturally in both freshwater and marine environments, especially in estuarine waters and coastal upwelling zones (Feely et al. 2008; Thomsen et al. 2010), while global climate change, resulting in increasing water temperature, elevated pCO2, and decreased pH levels, is of particular ecological and economic concern (Cooley and Doney 2009; Raven et al. 2005). Should fishes be exposed to elevated concentrations of CO2 for extended periods, results from the current study suggest that they would experience alterations in molecular (e.g., elevated c-fos and hsp70 transcripts) and physiological (e.g., reductions of plasma chloride) parameters, which could result in free-swimming fishes that display improved tolerance (e.g., reduced stress response, greater CO2 concentrations nec-essary to induce behavioral responses) and performance (e.g., sustained burst swimming speed) within hypercarbic environments). While the CO2 pressure used for acclima-tion in the current study (≈21,000 µatm) is approximately ten times greater than the expected rise in CO2 levels for marine environments predicted by the year 2300 (Caldeira and Wickett 2003), pCO2 levels freshwater environments are much more dynamic and variable, and can naturally reach levels that are tenfold higher than present-day atmos-pheric concentrations (Cole et al. 1994; Telmer and Veizer 1999) making the use of such concentrations realistic and applicable. The concentrations of CO2 used in the cur-rent study are also useful to researchers looking to define the acclimation capacity of fishes to hypercarbic environ-ments, and the ecologically significant physiological and behavioral alterations documented in this study can be useful for researchers studying the impact and acclimation capacity of fishes to chronic hypercarbia exposure (Heuer and Grosell 2014). In addition to elevated CO2 resulting from climate change, hypercarbic conditions in aquacul-ture can be created by an overabundance of fish within tanks (Colt and Orwicz 1991; Kristensen et al. 2009) and can be a serious issue for fish farmers and aquaculture managers. Hatchery-reared fish that have acclimated to elevated CO2 conditions in rearing tanks may also experi-ence challenges when released into the wild, compounding the negative impacts that hatchery fish can have on natu-ral fish populations (Araki and Schmid 2010). Exposure to elevated CO2, even for as short as 4–11 days, has also been shown to influence predator avoidance (Dixson et al. 2010) and homing (Munday et al. 2009) in marine fishes. In addition, the potential for CO2 to influence the move-ment of free-swimming fishes has been examined (Cling-erman et al. 2007; Kates et al. 2012). In particular, Kates et al. (2012) demonstrated that elevated CO2 influenced the movement of invasive Asian carp (Hypophthalmichthys
sp.), which showed potential for a field-implemented CO2 chemical barrier to deter the movement of invasive fishes. While the results of this study show that fish have the capacity to acclimate to elevated CO2 environments, CO2-acclimated fish still choose to avoid areas of high CO2 at concentrations near 160 mg L−1, suggesting that a CO2 barrier still has potential to influence movement of fishes acclimated to hypercarbia. Finally, it is currently not known if the changes observed in this study are reversible (plastic) and if animals would return to control phenotypes following a return to ambient CO2 levels. As hypercarbic environments become more prevalent due to global cli-mate change, knowledge of the capacity for aquatic organ-isms to acclimate to elevated CO2, as well as the resulting impact on physiological and behavioral traits, will be of vital importance for conservation managers.
Acknowledgments This work was supported by the Illinois Depart-ment of Natural Resources through funds provided by the USEPA’s Great Lakes Restoration Initiative (GLRI). Partial funding was also provided by the USFWS Federal Aid in Sport Fish Restoration Project F-69-R. We would like to thank Greg King and Jennifer Shen for field and laboratory assistance. Dr. Zachary A. Cheviron and Dr. Anthony C. Yannarell provided excellent comments on this manuscript. All work performed in this study conformed to the guidelines established by the Institutional Animal Care and Use Committee (IACUC) of the University of Illinois (Protocol # 13123).
References
Angilletta MJ (2009) Thermal adaptation: a theoretical and empirical synthesis. Oxford University Press, Oxford
Anscombe FJ, Tukey JW (1963) The examination and analysis of residuals. Technometrics 5:141–160
Araki H, Schmid C (2010) Is hatchery stocking a help or harm?: evi-dence, limitations and future directions in ecological and genetic surveys. Aquaculture 308:S2–S11
Barton BA (2002) Stress in fishes: a diversity of responses with par-ticular reference to changes in circulating corticosteroids. Integr Comp Biol 42:517–525
Bernier NJ, Randall DJ (1998) Carbon dioxide anaesthesia in rainbow trout: effects of hypercapnic level and stress on induction and recovery from anaesthetic treatment. J Fish Biol 52:621–637
Blancheton JP (2000) Developments in recirculation systems for Mediterranean fish species. Aquacult Eng 22:17–31
Brauner C, Baker D (2009) Patterns of acid–base regulation during exposure to hypercarbia in fishes. In: Cardio-respiratory control in vertebrates. Springer, Berlin, p 43–63
Brauner CJ, Seidelin M, Madsen SS, Jensen FB (2000) Effects of freshwater hyperoxia and hypercapnia and their influences on subsequent seawater transfer in Atlantic salmon (Salmo salar) smolts. Can J Fish Aquat Sci 57:2054–2064
Caldeira K, Wickett ME (2003) Oceanography: anthropogenic carbon and ocean pH. Nature 425:365
Chevin L, Lande R, Mace GM (2010) Adaptation, plasticity, and extinction in a changing environment: towards a predictive the-ory. PLoS Biol 8:e1000357
Clingerman J, Bebak J, Mazik PM, Summerfelt ST (2007) Use of avoidance response by rainbow trout to carbon dioxide for fish self-transfer between tanks. Aquacult Eng 37:234–251
310 J Comp Physiol B (2016) 186:297–311
1 3
Cole JJ, Caraco NF, Kling GW, Kratz TK (1994) Carbon diox-ide supersaturation in the surface waters of lakes. Science 265:1568–1570
Cole JJ, Prairie YT, Caraco NF, McDowell WH, Tranvik LJ, Striegl RG, Duarte CM, Kortelainen P, Downing JA, Middelburg JJ (2007) Plumbing the global carbon cycle: integrating inland waters into the terrestrial carbon budget. Ecosystems 10:172–185
Colt J, Orwicz K (1991) Modeling production capacity of aquatic cul-ture systems under freshwater conditions. Aquacult Eng 10:1–29
Cooley SR, Doney SC (2009) Anticipating ocean acidification’s eco-nomic consequences for commercial fisheries. Environ Res Let 4:024007
Curran T, Franza BR Jr (1988) Fos and Jun: the AP-1 connection. Cell 55:395–397
Dahlberg ML, Shumway DL, Doudoroff P (1968) Influence of dis-solved oxygen and carbon dioxide on swimming performance of largemouth bass and coho salmon. J Fish Res Board Can 25:49–70
Deigweiher K, Koschnick N, Portner HO, Lucassen M (2008) Accli-mation of ion regulatory capacities in gills of marine fish under environmental hypercapnia. Am J Physiol Regul Integr Comp Physiol 295:R1660–R1670
Dennis CE III, Kates DF, Noatch MR, Suski CD (2014) Molecular responses of fishes to elevated carbon dioxide. Comp Biochem Physiol A. doi:10.1016/j.cbpa.2014.05.013
Díaz F, Re AD, González RA, Sánchez LN, Leyva G, Valenzuela F (2007) Temperature preference and oxygen consumption of the largemouth bass Micropterus salmoides (Lacepede) acclimated to different temperatures. Aquacult Res 38:1387–1394
Dixson DL, Munday PL, Jones GP (2010) Ocean acidification dis-rupts the innate ability of fish to detect predator olfactory cues. Ecol Lett 13:68–75
Douglas CE, Michael FA (1991) On distribution-free multiple com-parisons in the one-way analysis of variance. Commun Stat The-ory Methods 20:127–139
Feely RA, Sabine CL, Hernandez-Ayon JM, Ianson D, Hales B (2008) Evidence for upwelling of corrosive “acidified” water onto the continental shelf. Science 320:1490–1492
Fivelstad S, Olsen AB, Kløften H, Ski H, Stefansson S (1999) Effects of carbon dioxide on Atlantic salmon (Salmo salar L.) smolts at constant pH in bicarbonate rich freshwater. Aquaculture 178:171–187
Fivelstad S, Olsen AB, Åsgård T, Baeverfjord G, Rasmussen T, Vin-dheim T, Stefansson S (2003) Long-term sublethal effects of carbon dioxide on Atlantic salmon smolts (Salmo salar L.): ion regulation, haematology, element composition, nephrocalcinosis and growth parameters. Aquaculture 215:301–319
Gaulke GL, Dennis CE III, Wahl DH, Suski CD (2014) Acclima-tion to a low oxygen environment alters the hematology of lar-gemouth bass (Micropterus salmoides). Fish Physiol Biochem 40:129–140
Gregory TR, Wood CM (1998) Individual variation and interrelation-ships between swimming performance, growth rate, and feeding in juvenile rainbow trout (Oncorhynchus mykiss). Can J Fish Aquat Sci 55:1583–1590
Hartley HO (1950) The maximum F-ratio as a short-cut test for het-erogeneity of variance. Biometrika 37:308–312
Hasler CT, Butman D, Jeffrey JD, Suski CD (2016) Freshwater biota and rising pCO2? Ecol Lett 19:98–108
Healy TM, Tymchuk WE, Osborne EJ, Schulte PM (2010) Heat shock response of killifish (Fundulus heteroclitus): candidate gene and heterologous microarray approaches. Physiol Genom 41:171–184
Heuer RM, Grosell M (2014) Physiological impacts of elevated carbon dioxide and ocean acidification on fish. Am J Physiol 307:R1061–R1084
Iwama GK, Heisler N (1991) Effect of environmental water salinity on acid-base regulation during environmental hypercapnia in the rainbow trout (Oncorhynchus mykiss). J Exp Biol 158:1–18
Iwama GK, McGeer JC, Pawluk MP (1989) The effects of five fish anaesthetics on acid–base balance, hematocrit, blood gases, cor-tisol, and adrenaline in rainbow trout. Can J Zool 67:2065–2073
Iwama GK, Afonso LO, Todgham A, Ackerman P, Nakano K (2004) Are hsps suitable for indicating stressed states in fish? J Exp Biol 207:15–19
Kassahn KS, Crozier RH, Pörtner HO, Caley MJ (2009) Animal per-formance and stress: responses and tolerance limits at different levels of biological organisation. Biol Rev 84:277–292
Kates D, Dennis C, Noatch MR, Suski CD, MacLatchy D (2012) Responses of native and invasive fishes to carbon dioxide: poten-tial for a nonphysical barrier to fish dispersal. Can J Fish Aquat Sci 69:1748–1759
Kieffer J, Cooke S (2009) Physiology and organismal performance of centrarchids. In: Cooke SJ, Philipp DP (eds) Centrarchid fishes: diversity, biology, and conservation. Wiley, West Sussex, pp 207–263
Kristensen T, Åtland Å, Rosten T, Urke H, Rosseland B (2009) Important influent-water quality parameters at freshwater pro-duction sites in two salmon producing countries. Aquacult Eng 41:53–59
Leroi AM, Bennett AF, Lenski RE (1994) Temperature acclimation and competitive fitness: an experimental test of the beneficial acclimation assumption. Proc Natl Acad Sci USA 91:1917–1921
Lewis JM, Hori TS, Rise ML, Walsh PJ, Currie S (2010) Transcriptome responses to heat stress in the nucleated red blood cells of the rain-bow trout (Oncorhynchus mykiss). Physiol Genom 42:361–373
Logan CA, Somero GN (2011) Effects of thermal acclimation on transcriptional responses to acute heat stress in the eurythermal fish Gillichthys mirabilis (Cooper). Am J Physiol Regul Integr Comp Physiol 300:R1373–R1383
Lowry O, Passonneau J (1972) A flexible system of enzymatic analy-sis. Academic, New York
Lurman GJ, Bock CH, Poertner H (2009) Thermal acclimation to 4 or 10 C imparts minimal benefit on swimming performance in Atlantic cod (Gadus morhua L.). J Comp Physiol B 179:623–633
Mancebo MJ, Ceballos FC, Pérez-Maceira J, Aldegunde M (2013) Hypothalamic neuropeptide Y (NPY) gene expression is not affected by central serotonin in the rainbow trout (Oncorhynchus mykiss). Comp Biochem Physiol A 166:186–190
McEwen BS, Wingfield JC (2003) The concept of allostasis in biol-ogy and biomedicine. Horm Behav 43:2–15
McKenzie DJ, Piccolella M, Dalla Valle AZ, Taylor EW, Bolis CL, Steffensen JF (2003) Tolerance of chronic hypercapnia by the European eel Anguilla anguilla. J Exp Biol 206:1717–1726
Melzner F, Göbel S, Langenbuch M, Gutowska MA, Pörtner H, Luca-ssen M (2009) Swimming performance in Atlantic Cod (Gadus morhua) following long-term (4–12 months) acclimation to ele-vated seawater PCO2. Aquat Toxicol 92:30–37
Michaelidis B, Spring A, Pörtner HO (2007) Effects of long-term acclimation to environmental hypercapnia on extracellular acid–base status and metabolic capacity in Mediterranean fish Sparus aurata. Mar Biol 150:1417–1429
Munday PL, Dixson DL, Donelson JM, Jones GP, Pratchett MS, Devitsina GV, Doving KB (2009) Ocean acidification impairs olfactory discrimination and homing ability of a marine fish. Proc Natl Acad Sci USA 106:1848–1852
Munday PL, Dixson DL, McCormick MI, Meekan M, Ferrari MC, Chivers DP (2010) Replenishment of fish populations is threatened by ocean acidification. Proc Natl Acad Sci USA 107:12930–12934
plasma osmolarity increases upon salinity transfer in rain-bow trout (Oncorhynchus mykiss). Comp Biochem Physiol C 148:437–444
Perry S, Gilmour K (2006) Acid–base balance and CO2 excretion in fish: unanswered questions and emerging models. Resp Physiol Neurobiol 154:199–215
Petochi T, Di Marco P, Priori A, Finoia M, Mercatali I, Marino G (2011) Coping strategy and stress response of European sea bass Dicentrarchus labrax to acute and chronic environmental hyper-capnia under hyperoxic conditions. Aquaculture 315:312–320
Piersma T, Drent J (2003) Phenotypic flexibility and the evolution of organismal design. Trends Ecol Evol 18:228–233
Raven J, Caldeira K, Elderfield H, Hoegh-Guldberg O, Liss P, Riebe-sell U, Shepherd J, Turley C, Watson A (2005) Ocean acidifica-tion due to increasing atmospheric carbon dioxide. The Royal Society. The Clyvedon Press Ltd., Cardiff
Raymond PA, Hartmann J, Lauerwald R, Sobek S, McDonald C, Hoover M, Butman D, Striegl R, Mayorga E, Humborg C (2013) Global carbon dioxide emissions from inland waters. Nature 503:355–359
Reidy S, Nelson J, Tang Y, Kerr S (1995) Post-exercise metabolic rate in Atlantic cod and its dependence upon the method of exhaus-tion. J Fish Biol 47:377–386
Riebesell U, Fabry VJ, Hansson L, Gattuso J (2010) Guide to best practices for ocean acidification research and data reporting. Publications Office of the European Union Luxembourg
Rimoldi S, Terova G, Brambilla F, Bernardini G, Gornati R, Saroglia M (2009) Molecular characterization and expression analysis of Na+/H+ exchanger (NHE)-1 and c-Fos genes in sea bass (Dicen-trarchus labrax, L) exposed to acute and chronic hypercapnia. J Exp Mar Biol Ecol 375:32–40
Robbins L, Hansen M, Kleypas J, Meylan S (2010) CO2calc—a user-friendly seawater carbon calculator for Windows, Max OS X, and iOS (iPhone). US Geol Surv, Open-File Rep 1280
Ross RM, Krise WF, Redell LA, Bennett RM (2001) Effects of dis-solved carbon dioxide on the physiology and behavior of fish in artificial streams. Environ Toxicol 16:84–95
Santos G, Schrama J, Capelle J, Rombout J, Verreth J (2013) Effects of dissolved carbon dioxide on energy metabolism and stress
responses in European seabass (Dicentrarchus labrax). Aquacult Res 44:1370–1382
Serrano X, Grosell M, Serafy J (2010) Salinity selection and prefer-ence of the grey snapper Lutjanus griseus: field and laboratory observations. J Fish Biol 76:1592–1608
Simpson SD, Munday PL, Wittenrich ML, Manassa R, Dixson DL, Gagliano M, Yan HY (2011) Ocean acidification erodes crucial auditory behaviour in a marine fish. Biol Lett 7:917–920
Sobek S, Tranvik LJ, Cole JJ (2005) Temperature independence of carbon dioxide supersaturation in global lakes. Glob Biogeo-chem Cy 19:GB2003
Sokal RR, Rohlf FJ (1995) Biometry. Freeman and Company, New York
Suski CD, Cooke SJ, Tufts BL (2007) Failure of low velocity swim-ming to enhance recovery from exhaustive exercise in lar-gemouth bass (Micropterus salmoides). Phys Biochem Zool 80:78–87
Tankersley CG, Haxhiu MA, Gauda EB (2002) Differential CO2-induced c-fos gene expression in the nucleus tractus solitarii of inbred mouse strains. J Appl Physiol 92:1277–1284
Telmer K, Veizer J (1999) Carbon fluxes, pCO2 and substrate weath-ering in a large northern river basin, Canada: carbon isotope per-spectives. Chem Geol 159(1–4):61–86
Thomsen J, Gutowska M, Saphörster J, Heinemann A, Trübenbach K, Fietzke J, Hiebenthal C, Eisenhauer A, Körtzinger A, Wahl M (2010) Calcifying invertebrates succeed in a naturally CO2-rich coastal habitat but are threatened by high levels of future acidifi-cation. Biogeosciences 7:3879–3891
US Department of the Interior, US Fish and Wildlife Service, and US Department of Commerce, US Census Bureau (2011) 2011 National survey of fishing, hunting, and wildlife-associated rec-reation. Washington, DC
Wells RM (2009) Blood-gas transport and hemoglobin function: adaptations for functional and environmental hypoxia. Fish Physiol 27:255–299
Wendelaar Bonga SE (1997) The stress response in fish. Physiol Rev 77:591–625
Zar JH (1984) Biostatistical analysis. Prentice Hall, USA