Inter-Sensor Validation of NDVI time series from AVHRR, SPOT-Vegetation, SeaWIFS, MODIS, and LandSAT ETM+. Molly E. Brown + Jorge E. Pinzon + Jeffery T. Morisette x Kamel Didan* Compton J. Tucker x + SSAI, NASA Goddard Space Flight Center * Soil, Water and Environmental Sciences - PowerPoint PPT Presentation
1 Molly E. Brown, PhD Dec 15, 2004 AGU Inter-Sensor Validation of NDVI time series from AVHRR, SPOT-Vegetation, SeaWIFS, MODIS, and LandSAT ETM+ Molly E. Brown + Jorge E. Pinzon + Jeffery T. Morisette x Kamel Didan* Compton J. Tucker x + SSAI, NASA Goddard Space Flight Center * Soil, Water and Environmental Sciences Greenbelt, MD 20771 University of Arizona x NASA Goddard Space Flight Center Greenbelt, MD 20771
Transcript
1Molly E. Brown, PhDDec 15, 2004 AGU
Inter-Sensor Validation of NDVI time series from
AVHRR, SPOT-Vegetation, SeaWIFS,
MODIS, and LandSAT ETM+ Molly E. Brown +
Jorge E. Pinzon+
Jeffery T. Morisettex
Kamel Didan*
Compton J. Tuckerx
+ SSAI, NASA Goddard Space Flight Center * Soil, Water and Environmental Sciences
Greenbelt, MD 20771 University of Arizona
xNASA Goddard Space Flight Center
Greenbelt, MD 20771
Dec 15, 2004 AGU Molly E. Brown, PhD 2
Overview• Data used in study
– Global NDVI datasets, LandSAT ETM+ for comparison
• Methods– Spectral, spatial and temporal considerations– Global 1 degree datasets– CEOS sites and drought locations
• Results • Discussion – data continuity from AVHRR
through MODIS to VIIRS
Dec 15, 2004 AGU Molly E. Brown, PhD 3
VIS/NIR/SWIR Band Comparison
AVHRR
SeaWiFS
VGT
MODIS
Differences in spectral range will necessitate increased processing in AVHRR and SPOT due to water vapor sensitivity.
Dec 15, 2004 AGU Molly E. Brown, PhD 4
DataSensor Data Source Spatial
ResolutionTime
domain
Temporal Resolution
AVHRR GIMMS NDVIg
Pinzon et al (2005)
8000 m
1 degree
81-04
280 mon
15 day
monthly
SPOT VGT
FAS-GIMMS, VITO
Achard, F. et al. (1992)
1000 m
1 degree
98-04
67 mon
10 day
monthly
MODIS
NDVI
MODIS-Land, University of Arizona (K.Didan)
Huete, A. et al. (2002)
~5000 m, 500m
1 degree
00-04
52 mon
16 day
monthly
SeaWIFS SeaWIFS / GSFC / GIMMS
Tucker et al (2002)
4633 m
1 degree
97-02
62 mon
monthly
LandSAT CEOS website
Morisette et al (2004)
30 m 1-9 scenes
periodic
Dec 15, 2004 AGU Molly E. Brown, PhD 5
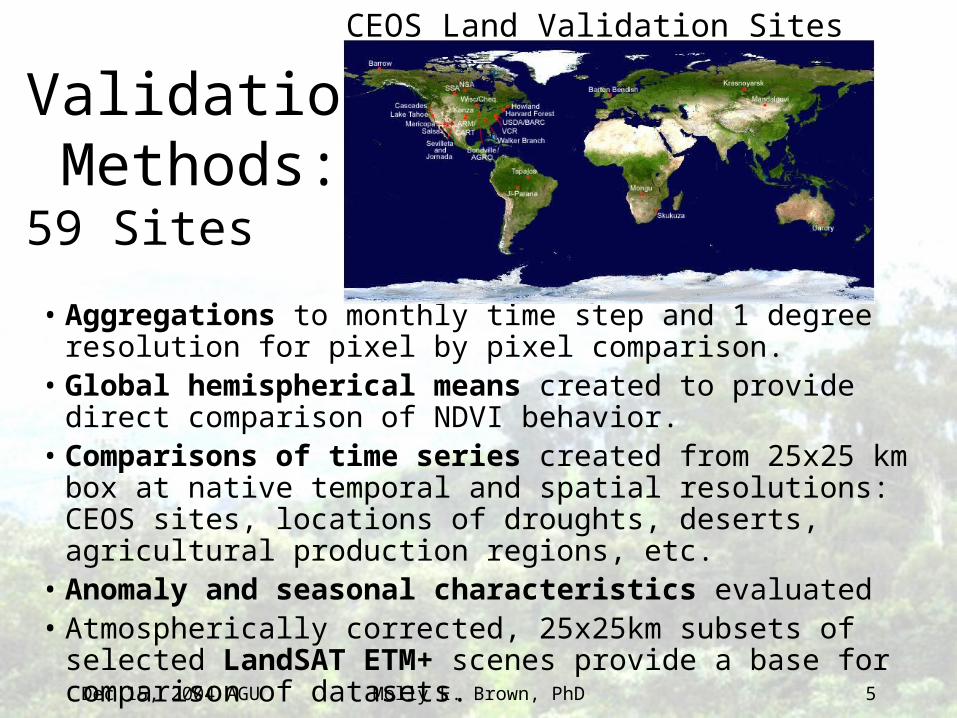
Validation Methods:59 Sites
• Aggregations to monthly time step and 1 degree resolution for pixel by pixel comparison.
• Global hemispherical means created to provide direct comparison of NDVI behavior.
• Comparisons of time series created from 25x25 km box at native temporal and spatial resolutions: CEOS sites, locations of droughts, deserts, agricultural production regions, etc.
• Anomaly and seasonal characteristics evaluated• Atmospherically corrected, 25x25km subsets of selected LandSAT
ETM+ scenes provide a base for comparison of datasets.
CEOS Land Validation Sites
Dec 15, 2004 AGU Molly E. Brown, PhD 6
Maps of NDVI correlation at 1degree
Dec 15, 2004 AGU Molly E. Brown, PhD 7
Global averages show that
•Four sensors have similar signals.
•Improvements in AVHRR NDVI have reduced many differences between the sensors, enabling a direct comparison between the records:
•Longer base means for anomaly•Multiple data sources for NDVI•More work to be done for data integration to be operational
Dec 15, 2004 AGU Molly E. Brown, PhD 8
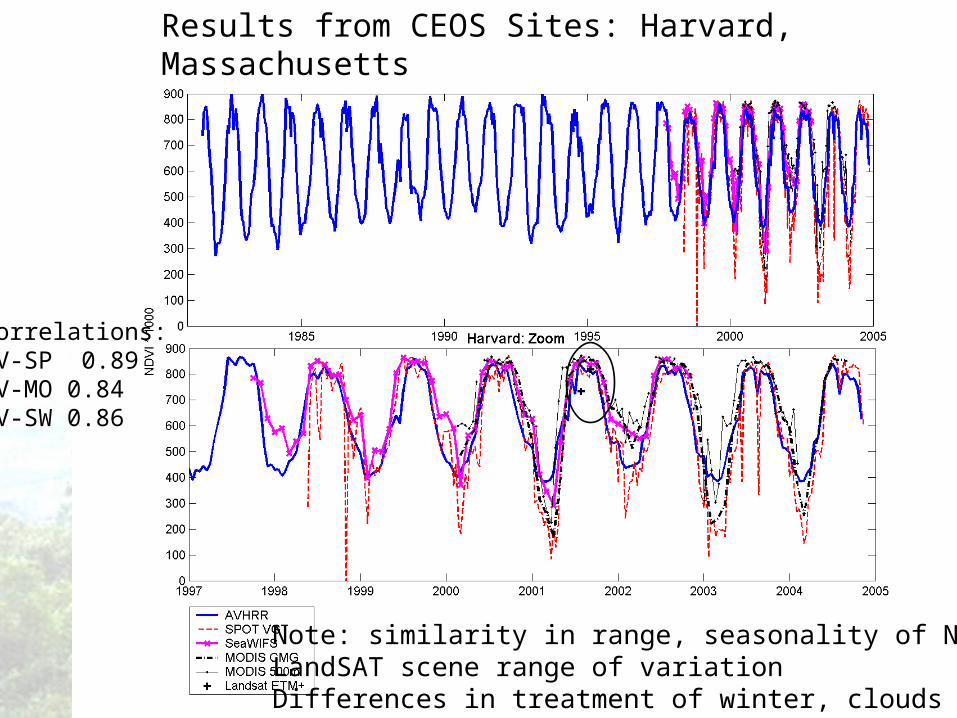
Note: similarity in range, seasonality of NDVILandSAT scene range of variation Differences in treatment of winter, clouds
Correlations:AV-SP 0.89AV-MO 0.84AV-SW 0.86
Results from CEOS Sites: Harvard, Massachusetts
Dec 15, 2004 AGU Molly E. Brown, PhD 9
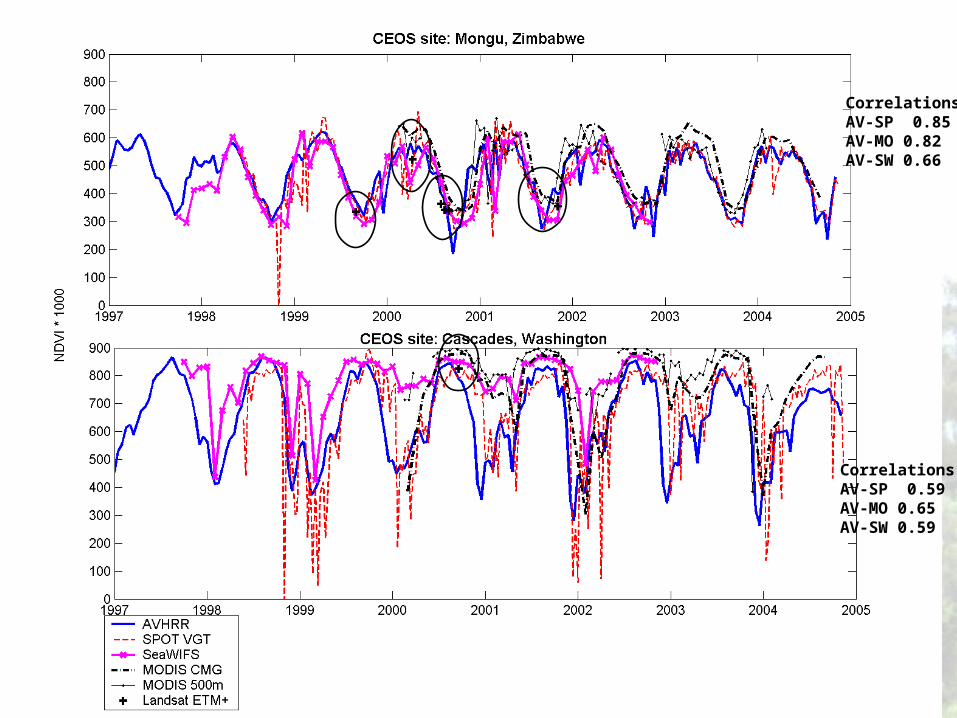
Correlations:AV-SP 0.59AV-MO 0.65AV-SW 0.59
Correlations:AV-SP 0.85AV-MO 0.82AV-SW 0.66
Dec 15, 2004 AGU Molly E. Brown, PhD 10
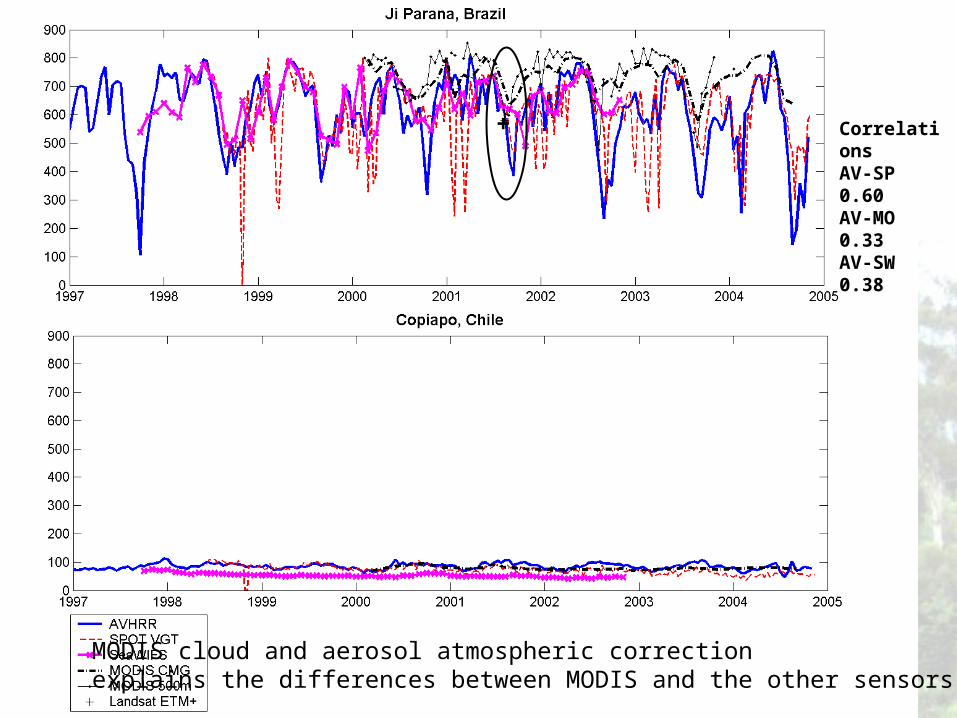
MODIS cloud and aerosol atmospheric correction explains the differences between MODIS and the other sensors.
CorrelationsAV-SP 0.60AV-MO 0.33AV-SW 0.38
+
Dec 15, 2004 AGU Molly E. Brown, PhD 11
Anomaly Time Series: Drought Detection
Dec 15, 2004 AGU Molly E. Brown, PhD 12
Conclusions• Many lessons have been learned from the creation of a
consistent NDVI record from AVHRR– How to integrate sensors with different gains (NOAA
7-14 and NOAA 16-17)– Overcome sensor limitations to reduce clouds, reduce
noise and improve image coherence• More work to be done on further integrating the records of
AVHRR, MODIS, SPOT, SeaWIFS to maximize their various strengths, minimizing their weaknesses
• AVHRR – MODIS – VIIRS data continuity will be required to maximize length of record to answer important science questions
Dec 15, 2004 AGU Molly E. Brown, PhD 13
• Thanks go to Brad Doorn, Assaf Anyamba and Jennifer Small for providing the SPOT data, Gene Feldman, Norman Kuring and Jacques Descloitres for the monthly global SeaWIFS data.
http://daac.gsfc.nasa.gov/data/dataset/SEAWIFS_LAND– MODIS: http://edcdaac.usgs.gov/modis/dataproducts.asp– SPOT VGT: http://free.vgt.vito.be/– Subsets of SPOT, AVHRR, MODIS tiles, and Landsat ETM+
data at CEOS sites: http://landval.gsfc.nasa.gov/MODIS/index.php