68
MONETARY POLICY REPORT WITH FINANCIAL STABILITY ASSESSMENT 2 | 21 JUNE
MONETARY POLICY REPORTWITH FINANCIAL STABILITY ASSESSMENT
2|21 JUNE

The Monetary Policy Report with financial stability assessment is published four times a year, in March, June, September and December. The Report assesses the interest rate outlook and forms the basis for Norges Bank’s advice on the level of the countercyclical capital buffer. The Report includes projections of developments in the Norwegian and global economy.
Editor: Øystein Olsen
Contents
MONETARY POLICY ASSESSMENT 5
PART 1: MONETARY POLICY Lower infection rates, higher vaccination coverage and gradual reopening 11
1 THE GLOBAL ECONOMY 13
2 FINANCIAL CONDITIONS 172.1 Interest rates 172.2 Krone exchange rate 19
3 NORWEGIAN ECONOMY 213.1 Economic developments 213.2 Costs and prices 31Prospects for a marked rise in consumption 36The climate transition boosts mainland business investment 39Stronger interest rate effect on house prices 42
4 MONETARY POLICY ANALYSIS 454.1 Objectives and recent developments 454.2 New information and assessments 464.3 Decomposition of changes in the rate path 48Neutral real interest rate estimate still close to zero 50
PART 2: FINANCIAL STABILITY
5 FINANCIAL STABILITY ASSESSMENT – DECISION BASIS FOR THE COUNTERCYCLICAL CAPITAL BUFFER 525.1 Access to credit 525.2 Financial imbalances 535.3 Banks 59Higher demand for larger dwellings in the Oslo area in 2020 62
ANNEXTables with projections 65
This Monetary Policy Report is based on information in the period to 11 June 2021, with the exception of Monetary policy assessment, which is based on information in the period to the Committee’s meeting on 16 June 2021. The Report was published on 17 June 2021 and is available at www.norges-bank.no.
NORGES BANK MONETARY POLICY REPORT 2/2021
Monetary policy in NorwayOBJECTIVESMonetary policy shall maintain monetary stability by keeping inflation low and stable. The operational target of monetary policy shall be annual consumer price inflation of close to 2% over time. Inflation targeting shall be forward-looking and flexible so that it can contribute to high and stable output and employment and to countering the build-up of financial imbalances. Monetary policy objectives and trade-offs are discussed in a box on page 51.
IMPLEMENTATIONNorges Bank sets its policy rate with the aim of stabilising inflation around the target in the medium term. The horizon will depend on the shocks to which the economy is exposed and the effects on the outlook for inflation and the real economy. In its conduct of monetary policy, Norges Bank takes into account indicators of underlying consumer price inflation.
DECISION PROCESSThe policy rate is set by Norges Bank’s Monetary Policy and Financial Stability Committee. Policy rate decisions are normally taken at the Committee’s monetary policy meetings. The Committee holds eight monetary policy meetings per year. The Monetary Policy Report is published four times a year in connection with four of the monetary policy meetings. Prior to publication, several seminars and meet-ings are held at which analyses are presented to the Committee and economic developments, the balance of risks and the monetary policy stance are deliberated. On the basis of the analyses and deliberations, the Committee assesses future interest rate developments. The final policy rate decision is made on the day prior to the publication of the Report. The Committee’s assessment of the economic outlook and monetary policy is presented in “Monetary policy assessment” in the Monetary Policy Report.
REPORTINGNorges Bank places emphasis on transparency in its monetary policy communication. The Bank reports on the conduct of monetary policy in its Annual Report. The assessments on which interest rate setting is based are published regularly in the Monetary Policy Report and elsewhere.
Countercyclical capital bufferThe objective of the countercyclical capital buffer is to bolster banks’ resilience and to lessen the ampli-fying effects of bank lending during downturns. The Ministry of Finance sets the level of the buffer four times a year. Norges Bank draws up a decision basis and provides advice to the Ministry regarding the level of the buffer. The advice is submitted to the Ministry of Finance in connection with the publication of Norges Bank’s Monetary Policy Report. The advice is published when the Ministry of Finance has made its decision. Norges Bank will recommend that the buffer rate should be increased when financial imbal-ances are building up or have built up. The buffer rate may be reduced in the event of an economic down-turn and large bank losses, with a view to mitigating the procyclical effects of tighter bank lending. The buffer rate shall ordinarily be between 0% and 2.5% of banks’ risk-weighted assets, but in special circum-stances may be set higher.
Decision-making process for Monetary Policy Report 2/21At its meetings on 28 May and 8 June, the Committee discussed the economic outlook, the monetary policy stance and the buffer rate. On 16 June, the Committee made its decision on the policy rate and approved its advice to the Ministry of Finance on the buffer rate, on the basis of the deliberations and a recommendation from Norges Bank staff.
4
NORGES BANK MONETARY POLICY REPORT 2/2021
Monetary policy assessment
Activity in the Norwegian economy has picked up after the sharp fall in spring 2020, but higher Covid infection rates and stricter measures to contain it held back the recovery at the beginning of 2021. Since the March 2021 Monetary Policy Report, infection rates have declined and the pace of vaccination has accelerated. The authorities have begun a gradual reopening of society, and unemployment has fallen. Further easing of Covid-related restrictions will help a return to more normal economic conditions. This suggests that it will soon be appropriate to raise the policy rate from its current level.
Norges Bank’s Monetary Policy and Financial Stability Committee decided to keep the policy rate unchanged at 0% at the monetary policy meeting on 16 June. In the Committee’s current assessment of the outlook and balance of risks, the policy rate will most likely be raised in September.
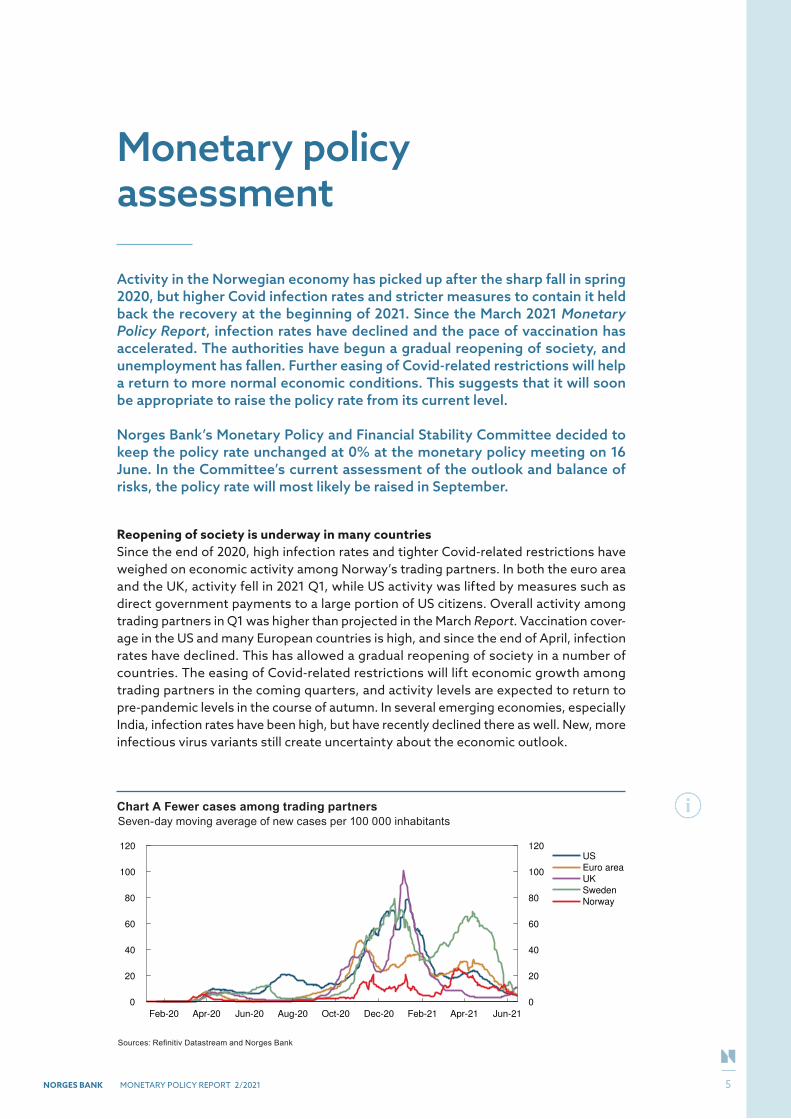
Reopening of society is underway in many countriesSince the end of 2020, high infection rates and tighter Covid-related restrictions have weighed on economic activity among Norway’s trading partners. In both the euro area and the UK, activity fell in 2021 Q1, while US activity was lifted by measures such as direct government payments to a large portion of US citizens. Overall activity among trading partners in Q1 was higher than projected in the March Report. Vaccination cover-age in the US and many European countries is high, and since the end of April, infection rates have declined. This has allowed a gradual reopening of society in a number of countries. The easing of Covid-related restrictions will lift economic growth among trading partners in the coming quarters, and activity levels are expected to return to pre-pandemic levels in the course of autumn. In several emerging economies, especially India, infection rates have been high, but have recently declined there as well. New, more infectious virus variants still create uncertainty about the economic outlook.
Chart A Fewer cases among trading partnersSeven-day moving average of new cases per 100 000 inhabitants
Feb-20 Apr-20 Jun-20 Aug-20 Oct-20 Dec-20 Feb-21 Apr-21 Jun-21
0
20
40
60
80
100
120
0
20
40
60
80
100
120US
Euro area
UK
Sweden
Norway
Sources: Refinitiv Datastream and Norges Bank
5
NORGES BANK MONETARY POLICY REPORT 2/2021
MONETARY POLICY ASSESSMENT
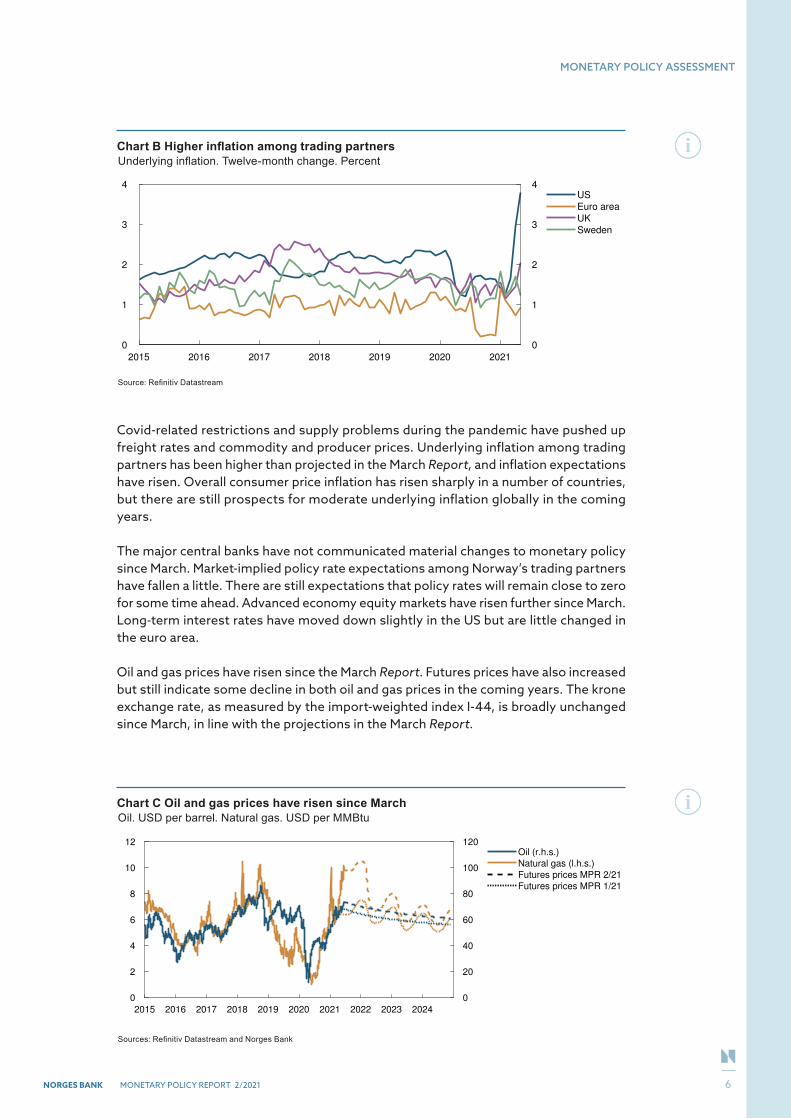
Covid-related restrictions and supply problems during the pandemic have pushed up freight rates and commodity and producer prices. Underlying inflation among trading partners has been higher than projected in the March Report, and inflation expectations have risen. Overall consumer price inflation has risen sharply in a number of countries, but there are still prospects for moderate underlying inflation globally in the coming years.
The major central banks have not communicated material changes to monetary policy since March. Market-implied policy rate expectations among Norway’s trading partners have fallen a little. There are still expectations that policy rates will remain close to zero for some time ahead. Advanced economy equity markets have risen further since March. Long-term interest rates have moved down slightly in the US but are little changed in the euro area.
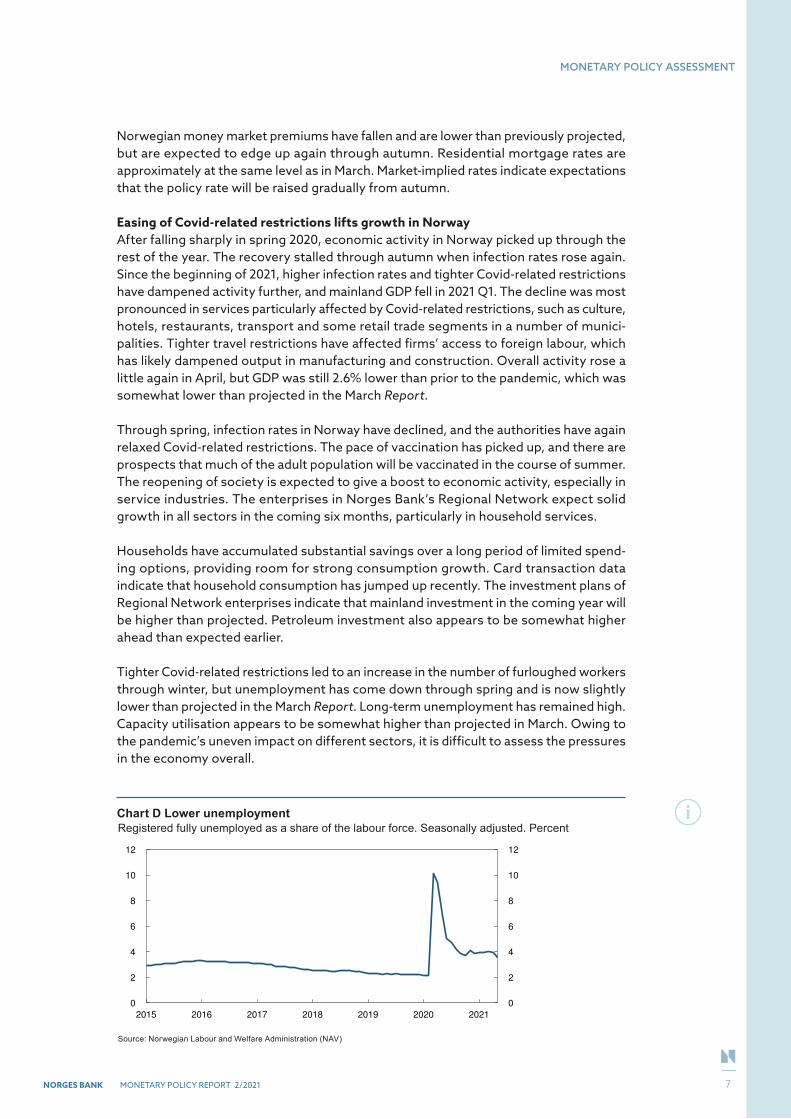
Oil and gas prices have risen since the March Report. Futures prices have also increased but still indicate some decline in both oil and gas prices in the coming years. The krone exchange rate, as measured by the import-weighted index I-44, is broadly unchanged since March, in line with the projections in the March Report.
Chart B Higher inflation among trading partnersUnderlying inflation. Twelve-month change. Percent
2015 2016 2017 2018 2019 2020 2021
0
1
2
3
4
0
1
2
3
4
US
Euro area
UK
Sweden
Source: Refinitiv Datastream
Chart C Oil and gas prices have risen since MarchOil. USD per barrel. Natural gas. USD per MMBtu
2015 2016 2017 2018 2019 2020 2021 2022 2023 2024
0
2
4
6
8
10
12
0
20
40
60
80
100
120Oil (r.h.s.)
Natural gas (l.h.s.)
Futures prices MPR 2/21
Futures prices MPR 1/21
Sources: Refinitiv Datastream and Norges Bank
6
NORGES BANK MONETARY POLICY REPORT 2/2021
MONETARY POLICY ASSESSMENT
Norwegian money market premiums have fallen and are lower than previously projected, but are expected to edge up again through autumn. Residential mortgage rates are approximately at the same level as in March. Market-implied rates indicate expectations that the policy rate will be raised gradually from autumn.
Easing of Covid-related restrictions lifts growth in NorwayAfter falling sharply in spring 2020, economic activity in Norway picked up through the rest of the year. The recovery stalled through autumn when infection rates rose again. Since the beginning of 2021, higher infection rates and tighter Covid-related restrictions have dampened activity further, and mainland GDP fell in 2021 Q1. The decline was most pronounced in services particularly affected by Covid-related restrictions, such as culture, hotels, restaurants, transport and some retail trade segments in a number of munici-palities. Tighter travel restrictions have affected firms’ access to foreign labour, which has likely dampened output in manufacturing and construction. Overall activity rose a little again in April, but GDP was still 2.6% lower than prior to the pandemic, which was somewhat lower than projected in the March Report.
Through spring, infection rates in Norway have declined, and the authorities have again relaxed Covid-related restrictions. The pace of vaccination has picked up, and there are prospects that much of the adult population will be vaccinated in the course of summer. The reopening of society is expected to give a boost to economic activity, especially in service industries. The enterprises in Norges Bank’s Regional Network expect solid growth in all sectors in the coming six months, particularly in household services.
Households have accumulated substantial savings over a long period of limited spend-ing options, providing room for strong consumption growth. Card transaction data indicate that household consumption has jumped up recently. The investment plans of Regional Network enterprises indicate that mainland investment in the coming year will be higher than projected. Petroleum investment also appears to be somewhat higher ahead than expected earlier.
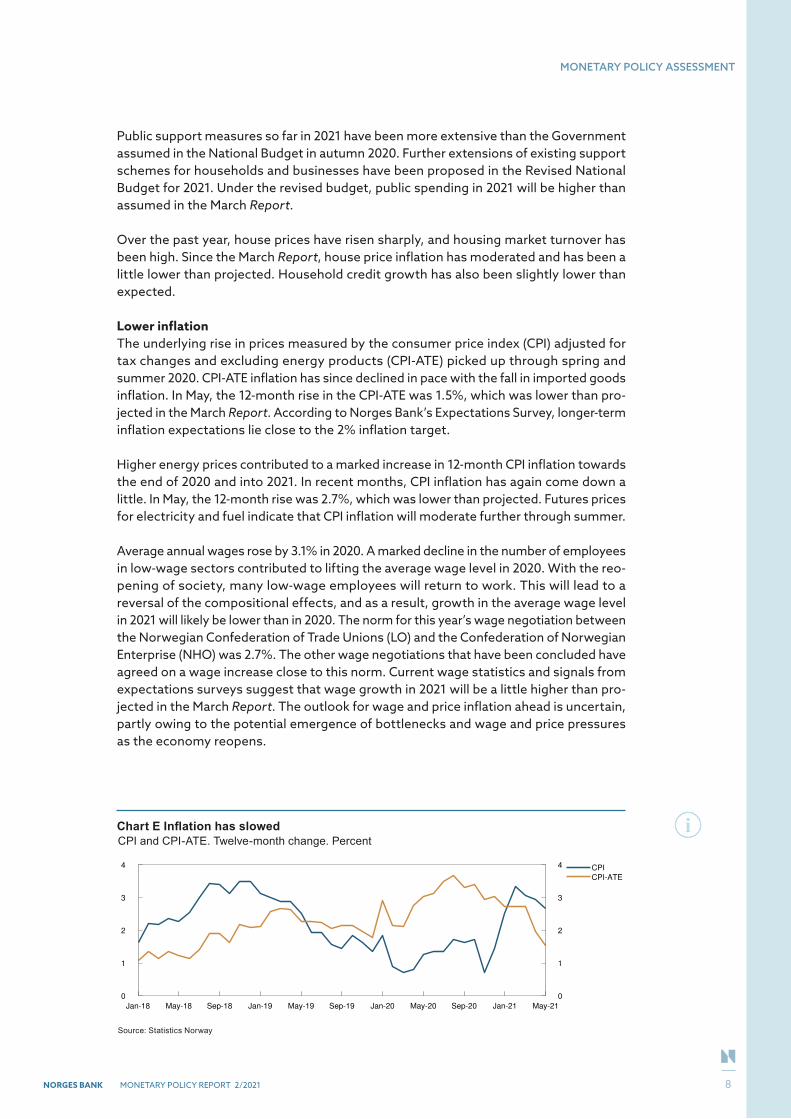
Tighter Covid-related restrictions led to an increase in the number of furloughed workers through winter, but unemployment has come down through spring and is now slightly lower than projected in the March Report. Long-term unemployment has remained high. Capacity utilisation appears to be somewhat higher than projected in March. Owing to the pandemic’s uneven impact on different sectors, it is difficult to assess the pressures in the economy overall.
Chart D Lower unemploymentRegistered fully unemployed as a share of the labour force. Seasonally adjusted. Percent
2015 2016 2017 2018 2019 2020 2021
0
2
4
6
8
10
12
0
2
4
6
8
10
12fakeLegend1
Source: Norwegian Labour and Welfare Administration (NAV)
7
NORGES BANK MONETARY POLICY REPORT 2/2021
MONETARY POLICY ASSESSMENT
Public support measures so far in 2021 have been more extensive than the Government assumed in the National Budget in autumn 2020. Further extensions of existing support schemes for households and businesses have been proposed in the Revised National Budget for 2021. Under the revised budget, public spending in 2021 will be higher than assumed in the March Report.
Over the past year, house prices have risen sharply, and housing market turnover has been high. Since the March Report, house price inflation has moderated and has been a little lower than projected. Household credit growth has also been slightly lower than expected.
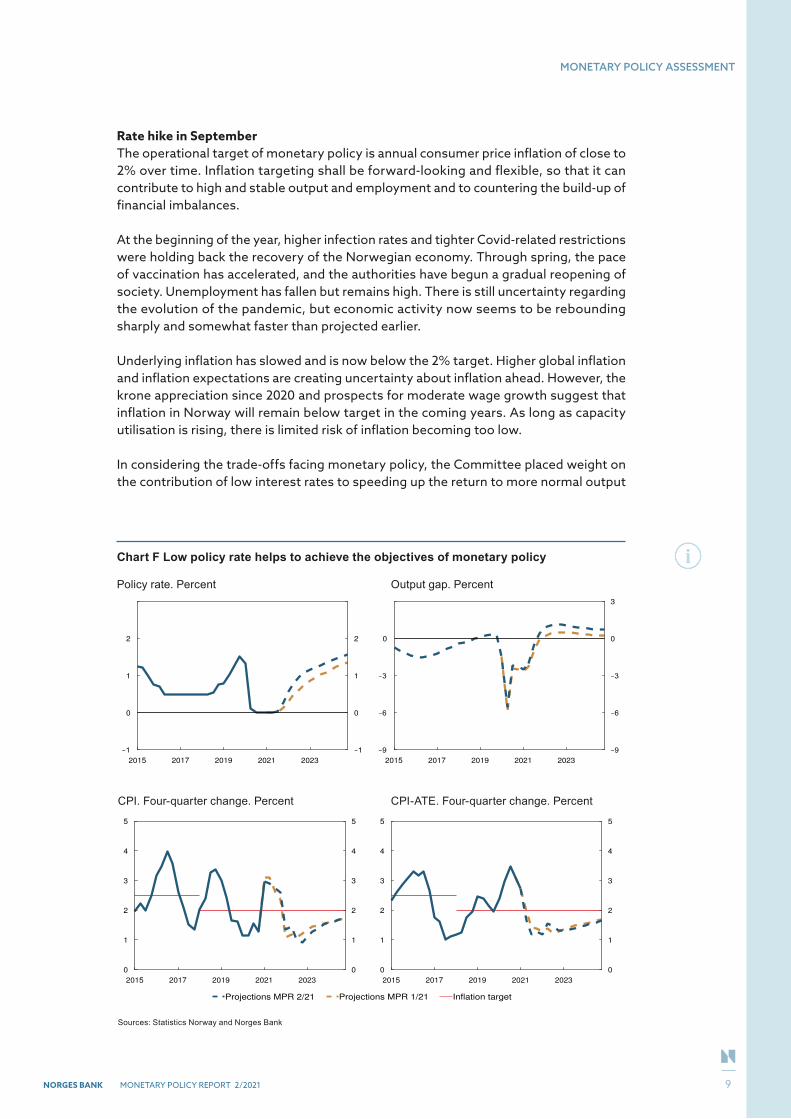
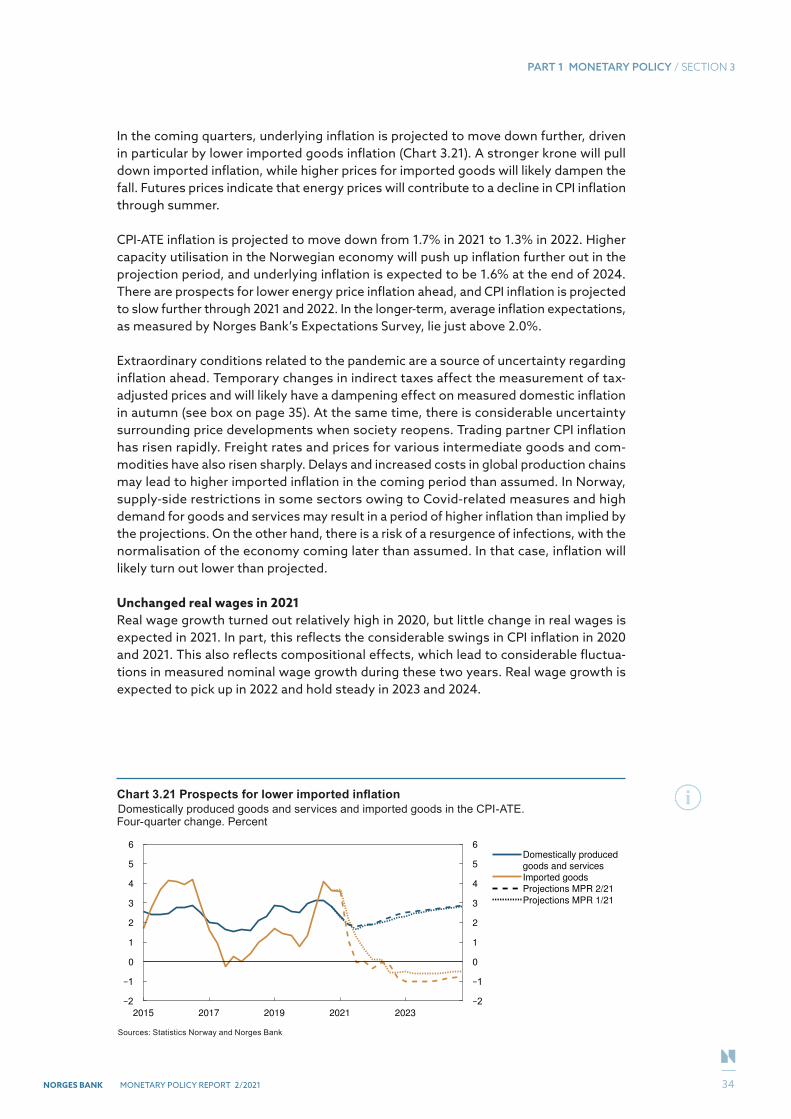
Lower inflationThe underlying rise in prices measured by the consumer price index (CPI) adjusted for tax changes and excluding energy products (CPI-ATE) picked up through spring and summer 2020. CPI-ATE inflation has since declined in pace with the fall in imported goods inflation. In May, the 12-month rise in the CPI-ATE was 1.5%, which was lower than pro-jected in the March Report. According to Norges Bank’s Expectations Survey, longer-term inflation expectations lie close to the 2% inflation target.
Higher energy prices contributed to a marked increase in 12-month CPI inflation towards the end of 2020 and into 2021. In recent months, CPI inflation has again come down a little. In May, the 12-month rise was 2.7%, which was lower than projected. Futures prices for electricity and fuel indicate that CPI inflation will moderate further through summer.
Average annual wages rose by 3.1% in 2020. A marked decline in the number of employees in low-wage sectors contributed to lifting the average wage level in 2020. With the reo-pening of society, many low-wage employees will return to work. This will lead to a reversal of the compositional effects, and as a result, growth in the average wage level in 2021 will likely be lower than in 2020. The norm for this year’s wage negotiation between the Norwegian Confederation of Trade Unions (LO) and the Confederation of Norwegian Enterprise (NHO) was 2.7%. The other wage negotiations that have been concluded have agreed on a wage increase close to this norm. Current wage statistics and signals from expectations surveys suggest that wage growth in 2021 will be a little higher than pro-jected in the March Report. The outlook for wage and price inflation ahead is uncertain, partly owing to the potential emergence of bottlenecks and wage and price pressures as the economy reopens.
Chart E Inflation has slowedCPI and CPI-ATE. Twelve-month change. Percent
Jan-18 May-18 Sep-18 Jan-19 May-19 Sep-19 Jan-20 May-20 Sep-20 Jan-21 May-21
0
1
2
3
4
0
1
2
3
4 CPI
CPI-ATE
Source: Statistics Norway
8
NORGES BANK MONETARY POLICY REPORT 2/2021
MONETARY POLICY ASSESSMENT
Rate hike in SeptemberThe operational target of monetary policy is annual consumer price inflation of close to 2% over time. Inflation targeting shall be forward-looking and flexible, so that it can contribute to high and stable output and employment and to countering the build-up of financial imbalances.
At the beginning of the year, higher infection rates and tighter Covid-related restrictions were holding back the recovery of the Norwegian economy. Through spring, the pace of vaccination has accelerated, and the authorities have begun a gradual reopening of society. Unemployment has fallen but remains high. There is still uncertainty regarding the evolution of the pandemic, but economic activity now seems to be rebounding sharply and somewhat faster than projected earlier.
Underlying inflation has slowed and is now below the 2% target. Higher global inflation and inflation expectations are creating uncertainty about inflation ahead. However, the krone appreciation since 2020 and prospects for moderate wage growth suggest that inflation in Norway will remain below target in the coming years. As long as capacity utilisation is rising, there is limited risk of inflation becoming too low.
In considering the trade-offs facing monetary policy, the Committee placed weight on the contribution of low interest rates to speeding up the return to more normal output
Chart F Low policy rate helps to achieve the objectives of monetary policy Policy rate. Percent Output gap. Percent
2015 2017 2019 2021 2023
0
1
2
0
1
2
2015 2017 2019 2021 2023
0 0
3 The output gap measures the percentage deviation between mainland GDP and estimated potential mainland GDP. CPI-ATE: CPI adjusted for tax changes and
CPI. Four-quarter change. Percent CPI-ATE. Four-quarter change. Percent
2015 2017 2019 2021 2023
0
1
2
3
4
5
0
1
2
3
4
5
2015 2017 2019 2021 2023
0
1
2
3
4
5
0
1
2
3
4
5
2015 2017 2019 2021 2023
0
1
2
3
4
5
0
1
2
3
4
5
Projections MPR 2/21 Projections MPR 1/21 Inflation target
2015 2017 2019 2021 2023
0
1
2
3
4
5
0
1
2
3
4
5
Sources: Statistics Norway and Norges Bank
9
NORGES BANK MONETARY POLICY REPORT 2/2021
MONETARY POLICY ASSESSMENT
and employment levels. This reduces the risk of unemployment becoming entrenched at a high level and helps return inflation towards the target. At the same time, a long period of low interest rates increases the risk of a build-up of financial imbalances. The Committee placed weight on the marked rise in house prices since spring 2020 but noted that house price inflation has recently moderated somewhat.
In the Committee’s assessment, the overall outlook and balance of risks imply a contin-ued expansionary monetary policy stance. Further easing of Covid-related restrictions will help a return to more normal economic conditions. This suggests that it will soon be appropriate to raise the policy rate from the current level.
The policy rate forecast implies a gradual rate rise from autumn 2021. The rate path is slightly higher than in the March Report. Capacity utilisation is projected to exceed a normal level towards the end of 2021. Unemployment is projected to decline further and return to pre-pandemic levels in the course of 2022. Underlying inflation is projected to edge down over the next half-year, before rising to 1.6% towards the end of 2024. If the economic outlook changes, the policy rate forecast will also be adjusted.
The Committee decided unanimously to keep the policy rate unchanged at 0%. In the Committee’s current assessment of the outlook and balance of risks, the policy rate will most likely be raised in September.
Øystein OlsenIda Wolden BacheIngvild AlmåsJeanette Fjære Lindkjenn (absent)
16 June 2021
10
NORGES BANK MONETARY POLICY REPORT 2/2021
PART 1 MONETARY POLICY
LOWER INFECTION RATES, HIGHER VACCINATION COVERAGE AND GRADUAL REOPENING
Global infection rates have edged lower in recent weeks. Infection rates in Norway are now clearly lower than at the peak in March, and the reopening of society is underway. The near-term economic outlook for Norway and its trading partners will largely depend on the pace of further reopening. This Special Feature provides a further account of the key assumptions regarding infection rates, vaccination and Covid-related restrictions underlying the economic projections in this Report. To the extent possible, the assump-tions rely on projections from the health authorities and signals from other government bodies.
No new infection peaks in 2021Infection rates in Norway have fallen sharply since the end of March. As restrictions are eased, there may be periods of temporarily higher infection rates. Nevertheless, it is assumed that no outbreaks will occur that require a retightening of national Covid-related restrictions, even if some restrictions may be tightened locally.
The number of hospitalisations has long tracked developments in infection rates relatively closely. As younger age groups are vaccinated, hospitalisations will likely decline inde-pendently of infection rates. This means that the gradual reopening of society could continue, even in the face of somewhat higher infection rates.
The number of new cases has fallen in the US, euro area and Sweden since the end of April. Infection rates in the UK are still low, but the spread of the Delta variant has led to higher infection rates in recent weeks. Nevertheless, major outbreaks elsewhere in the world have led to higher-than-expected total infection rates. Declining infection rates are expected ahead, broadly in line with the assumptions in the March Report.
Vaccination coverage on the riseSo far, about 35% of the Norwegian population has received a first vaccine dose, and risk groups are now nearly all fully vaccinated. It is assumed that everyone aged 18 and over will have been offered a first dose by mid-August, well in line with the assumptions in the March Report. At the same time, it appears that fully vaccinating the adult popu-lation will take somewhat longer than expected earlier. The assessment of the vaccina-tion outlook is based on the moderate scenario published by the Norwegian Institute of Public Health (NIPH) on 28 May and new information about vaccine deliveries up to and including 11 June.
The projections in the March Report assumed the use of the AstraZeneca and Janssen vaccines, which have now been removed from the national vaccination programme. On the other hand, Norway is receiving more doses of the Pfizer vaccine than expected. A number of studies suggest that the mRNA vaccines (Pfizer and Moderna) provide a greater degree of protection after one dose than the AstraZeneca and Janssen vaccines with a full course. Studies also document adequate protection against transmission. The vaccination programme envisaged in this Report is assumed to have about the same transmission-reducing effect as the vaccination programme projected in the March Report.
For Norway’s advanced economy trading partners, it is assumed that the adult popula-tion will be vaccinated in the course of autumn 2021, the same as assumed in the March
PART 1: MONETARY POLICY
11
NORGES BANK MONETARY POLICY REPORT 2/2021
PART 1 MONETARY POLICY
Report. On the other hand, in emerging economies, there are prospects that vaccination will take longer than previously expected.
Gradual reopeningCovid-related restrictions were tightened both locally and nationally in response to the resurgence in infection rates in March. In April, the Government launched a national plan to reopen society in phases, conditioned on developments in infection rates, disease burden and vaccination coverage. On 27 May, the Government implemented phase 2 of the reopening plan. Many local restrictions have also been eased, and more shops and restaurants have reopened. Except for somewhat tighter entry restrictions and an exten-sion of the recommendation to work from home, the level of restrictions has been broadly as expected in March.
Further normalisation is assumed through summer, with the final phase (phase 4) of the national reopening plan beginning by the end of August. In line with signals from the authorities, some restrictions on international travel and large cultural events are still expected until the end of the year. The assessments of the pace of reopening for the latter half of 2021 are little changed from March.
Among Norway’s advanced economy trading partners, Covid-related restrictions overall have been somewhat tighter than assumed in the March Report, but most countries are now reopening. Gradual normalisation is assumed through summer, with an easing of restrictions following broadly the same path as assumed in the March Report.
Continued substantial uncertaintyThere is still substantial global uncertainty surrounding infection rates and the pace of vaccination, and hence the phasing-out of Covid-related restrictions. High infection rates in many places, combined with low vaccination coverage, imply a persistent risk of new outbreaks. New variants of the virus may also result in a surge in infection rates in advanced economies and a reimposition of restrictions. Even though existing vaccines have so far proved effective against new variants, it cannot be ruled out that today’s vaccines will be less effective against potential novel strains.
Nevertheless, in Norway and a number of other Western countries, the outlook for the latter half of 2021 is somewhat less clouded than in March. Both infection rates and the pace of vaccination have been broadly as expected, and the range of possible near-term outcomes has narrowed. In addition, the vaccines have so far proved to provide adequate protection against transmission.
12
NORGES BANK MONETARY POLICY REPORT 2/2021
1 The global economy
Owing to high Covid-19 (Covid) infection rates and strict Covid-related restric-tions in many countries, economic activity among Norway’s trading partners stagnated in winter. Vaccination and an easing of Covid-related restrictions are expected to boost growth among trading partners in the quarters ahead. GDP will likely have returned to pre-pandemic levels in the course of autumn. Overall consumer price inflation has risen sharply in many countries, but there are still prospects for moderate underlying inflation in the years ahead. Market-implied rates indicate expectations of very low interest rates among trading partners for some time ahead.
Vaccination and easing of Covid-related restrictions lift growth Trading-partner GDP growth was weak at the end of 2020, and the level of activity was approximately unchanged in winter. Last autumn’s strict Covid-related restrictions were largely retained in 2021 Q1. Businesses in the food service and hotel sectors, among others, had to remain closed in most European countries, and in many places curfews were maintained and public events banned. In the euro area and the UK, GDP fell between 2020 Q4 and 2021 Q1, although less than projected in the March Monetary Policy Report. US growth gained momentum on the back of direct government payments to a large number of households in March. Overall trading partner GDP growth in 2021 Q1 was stronger than projected in the March Report.
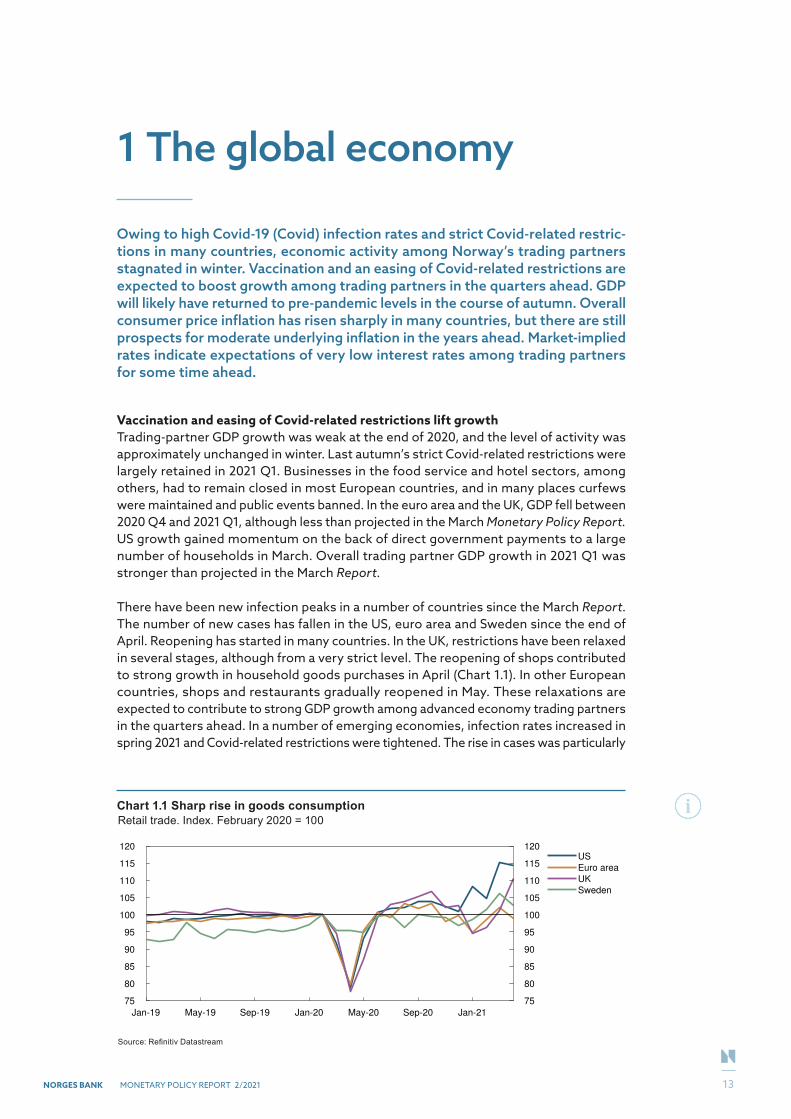
There have been new infection peaks in a number of countries since the March Report. The number of new cases has fallen in the US, euro area and Sweden since the end of April. Reopening has started in many countries. In the UK, restrictions have been relaxed in several stages, although from a very strict level. The reopening of shops contributed to strong growth in household goods purchases in April (Chart 1.1). In other European countries, shops and restaurants gradually reopened in May. These relaxations are expected to contribute to strong GDP growth among advanced economy trading partners in the quarters ahead. In a number of emerging economies, infection rates increased in spring 2021 and Covid-related restrictions were tightened. The rise in cases was particularly
Chart 1.1 Sharp rise in goods consumptionRetail trade. Index. February 2020 = 100
Jan-19 May-19 Sep-19 Jan-20 May-20 Sep-20 Jan-21
75
80
85
90
95
100
105
110
115
120
75
80
85
90
95
100
105
110
115
120US
Euro area
UK
Sweden
Source: Refinitiv Datastream
PART 1: MONETARY POLICY
13
PART 1 MONETARY POLICY / SECTION 1
NORGES BANK MONETARY POLICY REPORT 2/2021
high in India, and the healthcare system came under intense pressure. In recent weeks, infection rates in India have fallen.
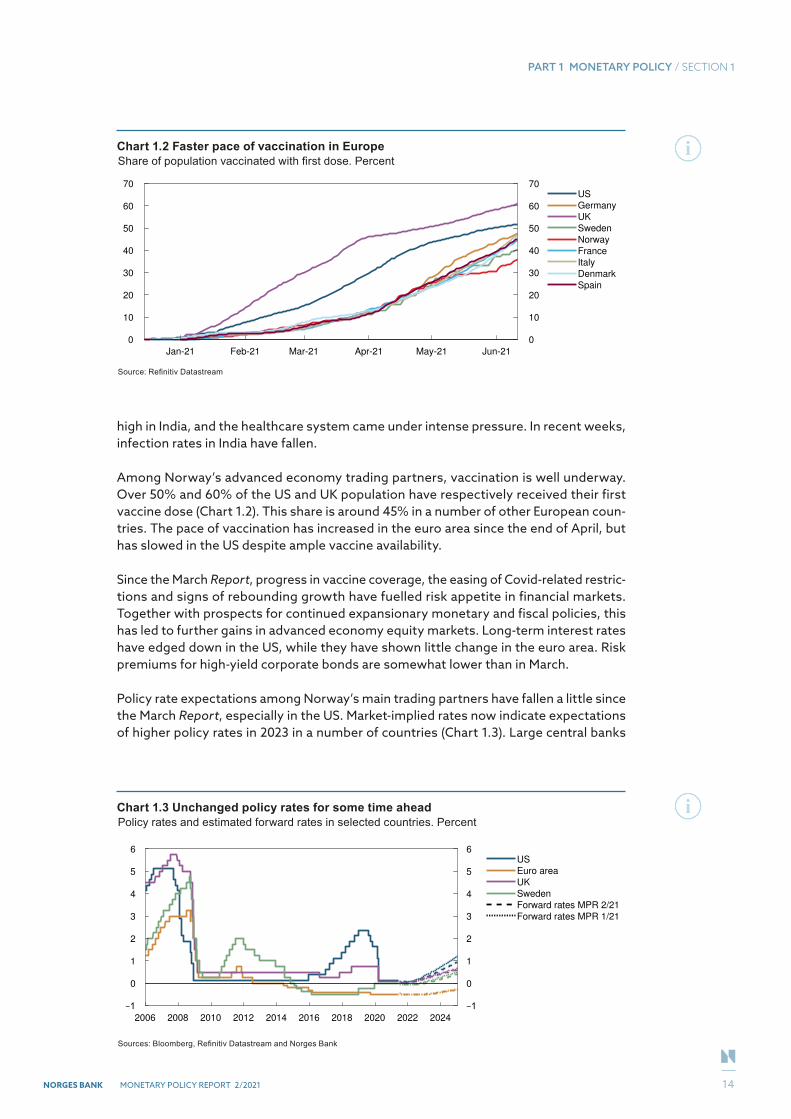
Among Norway’s advanced economy trading partners, vaccination is well underway. Over 50% and 60% of the US and UK population have respectively received their first vaccine dose (Chart 1.2). This share is around 45% in a number of other European coun-tries. The pace of vaccination has increased in the euro area since the end of April, but has slowed in the US despite ample vaccine availability.
Since the March Report, progress in vaccine coverage, the easing of Covid-related restric-tions and signs of rebounding growth have fuelled risk appetite in financial markets. Together with prospects for continued expansionary monetary and fiscal policies, this has led to further gains in advanced economy equity markets. Long-term interest rates have edged down in the US, while they have shown little change in the euro area. Risk premiums for high-yield corporate bonds are somewhat lower than in March.
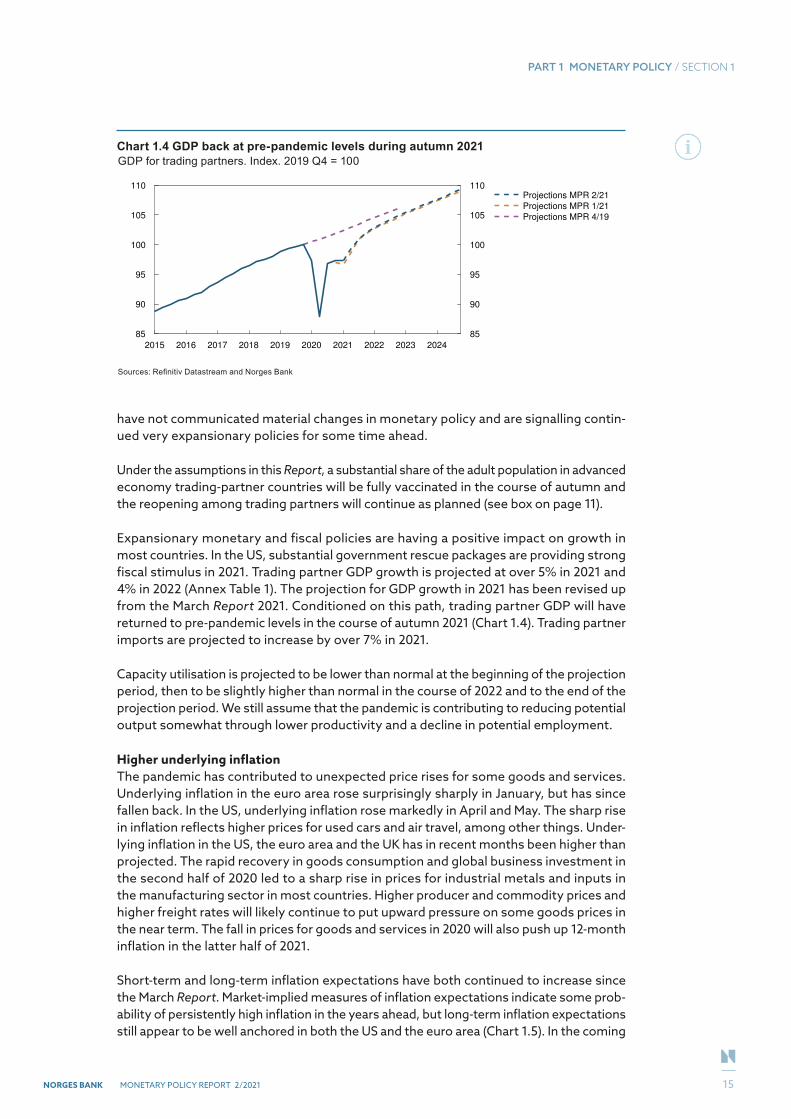
Policy rate expectations among Norway’s main trading partners have fallen a little since the March Report, especially in the US. Market-implied rates now indicate expectations of higher policy rates in 2023 in a number of countries (Chart 1.3). Large central banks
Chart 1.2 Faster pace of vaccination in EuropeShare of population vaccinated with first dose. Percent
Jan-21 Feb-21 Mar-21 Apr-21 May-21 Jun-21
0
10
20
30
40
50
60
70
0
10
20
30
40
50
60
70US
Germany
UK
Sweden
Norway
France
Italy
Denmark
Spain
Source: Refinitiv Datastream
Chart 1.3 Unchanged policy rates for some time aheadPolicy rates and estimated forward rates in selected countries. Percent
2006 2008 2010 2012 2014 2016 2018 2020 2022 2024
0
1
2
3
4
5
6
0
1
2
3
4
5
6
US
Euro area
UK
Sweden
Forward rates MPR 2/21
Forward rates MPR 1/21
Sources: Bloomberg, Refinitiv Datastream and Norges Bank
14
PART 1 MONETARY POLICY / SECTION 1
NORGES BANK MONETARY POLICY REPORT 2/2021
have not communicated material changes in monetary policy and are signalling contin-ued very expansionary policies for some time ahead.
Under the assumptions in this Report, a substantial share of the adult population in advanced economy trading-partner countries will be fully vaccinated in the course of autumn and the reopening among trading partners will continue as planned (see box on page 11).
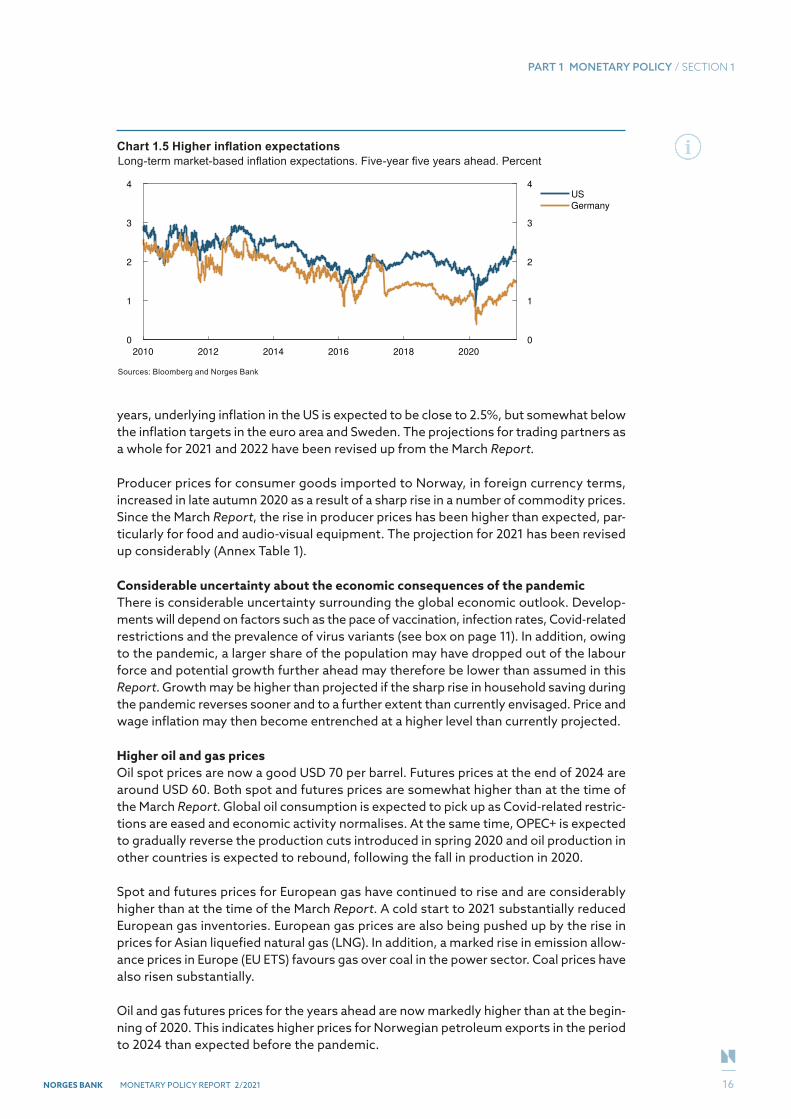
Expansionary monetary and fiscal policies are having a positive impact on growth in most countries. In the US, substantial government rescue packages are providing strong fiscal stimulus in 2021. Trading partner GDP growth is projected at over 5% in 2021 and 4% in 2022 (Annex Table 1). The projection for GDP growth in 2021 has been revised up from the March Report 2021. Conditioned on this path, trading partner GDP will have returned to pre-pandemic levels in the course of autumn 2021 (Chart 1.4). Trading partner imports are projected to increase by over 7% in 2021.
Capacity utilisation is projected to be lower than normal at the beginning of the projection period, then to be slightly higher than normal in the course of 2022 and to the end of the projection period. We still assume that the pandemic is contributing to reducing potential output somewhat through lower productivity and a decline in potential employment.
Higher underlying inflation The pandemic has contributed to unexpected price rises for some goods and services. Underlying inflation in the euro area rose surprisingly sharply in January, but has since fallen back. In the US, underlying inflation rose markedly in April and May. The sharp rise in inflation reflects higher prices for used cars and air travel, among other things. Under-lying inflation in the US, the euro area and the UK has in recent months been higher than projected. The rapid recovery in goods consumption and global business investment in the second half of 2020 led to a sharp rise in prices for industrial metals and inputs in the manufacturing sector in most countries. Higher producer and commodity prices and higher freight rates will likely continue to put upward pressure on some goods prices in the near term. The fall in prices for goods and services in 2020 will also push up 12-month inflation in the latter half of 2021.
Short-term and long-term inflation expectations have both continued to increase since the March Report. Market-implied measures of inflation expectations indicate some prob-ability of persistently high inflation in the years ahead, but long-term inflation expectations still appear to be well anchored in both the US and the euro area (Chart 1.5). In the coming
Chart 1.4 GDP back at pre-pandemic levels during autumn 2021GDP for trading partners. Index. 2019 Q4 = 100
2015 2016 2017 2018 2019 2020 2021 2022 2023 2024
85
90
95
100
105
110
85
90
95
100
105
110Projections MPR 2/21
Projections MPR 1/21
Projections MPR 4/19
Sources: Refinitiv Datastream and Norges Bank
15
PART 1 MONETARY POLICY / SECTION 1
NORGES BANK MONETARY POLICY REPORT 2/2021
years, underlying inflation in the US is expected to be close to 2.5%, but somewhat below the inflation targets in the euro area and Sweden. The projections for trading partners as a whole for 2021 and 2022 have been revised up from the March Report.
Producer prices for consumer goods imported to Norway, in foreign currency terms, increased in late autumn 2020 as a result of a sharp rise in a number of commodity prices. Since the March Report, the rise in producer prices has been higher than expected, par-ticularly for food and audio-visual equipment. The projection for 2021 has been revised up considerably (Annex Table 1).
Considerable uncertainty about the economic consequences of the pandemic There is considerable uncertainty surrounding the global economic outlook. Develop-ments will depend on factors such as the pace of vaccination, infection rates, Covid-related restrictions and the prevalence of virus variants (see box on page 11). In addition, owing to the pandemic, a larger share of the population may have dropped out of the labour force and potential growth further ahead may therefore be lower than assumed in this Report. Growth may be higher than projected if the sharp rise in household saving during the pandemic reverses sooner and to a further extent than currently envisaged. Price and wage inflation may then become entrenched at a higher level than currently projected.
Higher oil and gas prices Oil spot prices are now a good USD 70 per barrel. Futures prices at the end of 2024 are around USD 60. Both spot and futures prices are somewhat higher than at the time of the March Report. Global oil consumption is expected to pick up as Covid-related restric-tions are eased and economic activity normalises. At the same time, OPEC+ is expected to gradually reverse the production cuts introduced in spring 2020 and oil production in other countries is expected to rebound, following the fall in production in 2020.
Spot and futures prices for European gas have continued to rise and are considerably higher than at the time of the March Report. A cold start to 2021 substantially reduced European gas inventories. European gas prices are also being pushed up by the rise in prices for Asian liquefied natural gas (LNG). In addition, a marked rise in emission allow-ance prices in Europe (EU ETS) favours gas over coal in the power sector. Coal prices have also risen substantially.
Oil and gas futures prices for the years ahead are now markedly higher than at the begin-ning of 2020. This indicates higher prices for Norwegian petroleum exports in the period to 2024 than expected before the pandemic.
Chart 1.5 Higher inflation expectationsLong-term market-based inflation expectations. Five-year five years ahead. Percent
2010 2012 2014 2016 2018 2020
0
1
2
3
4
0
1
2
3
4
US
Germany
Sources: Bloomberg and Norges Bank
16
NORGES BANK MONETARY POLICY REPORT 2/2021
2 Financial conditions
Interest rates on loans to households and corporations are at historically low levels. Residential mortgage rates have shown little change in recent months while interest rates on loans to corporations have declined due to lower money market premiums. From the latter half of 2021, lending rates are projected to move up in pace with a rise in the policy rate.
The krone exchange rate is broadly unchanged since the March 2021 Monetary Policy Report. The krone is projected to appreciate in the period ahead.
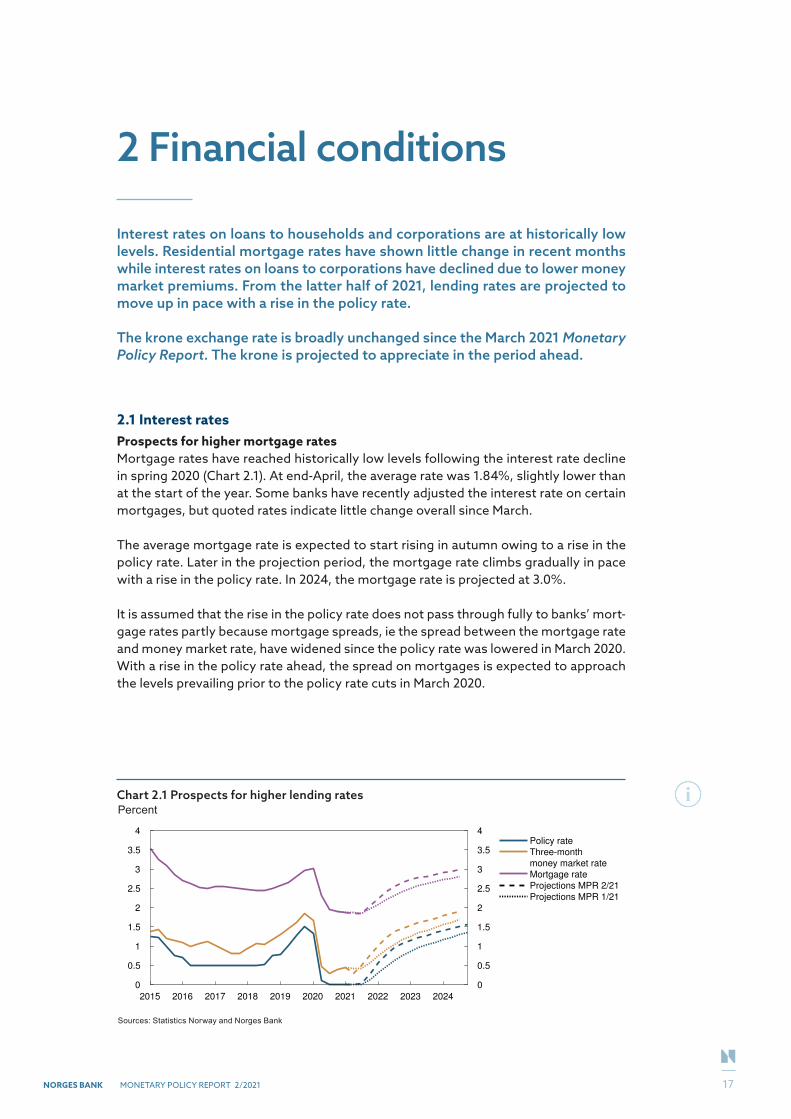
2.1 Interest ratesProspects for higher mortgage ratesMortgage rates have reached historically low levels following the interest rate decline in spring 2020 (Chart 2.1). At end-April, the average rate was 1.84%, slightly lower than at the start of the year. Some banks have recently adjusted the interest rate on certain mortgages, but quoted rates indicate little change overall since March.
The average mortgage rate is expected to start rising in autumn owing to a rise in the policy rate. Later in the projection period, the mortgage rate climbs gradually in pace with a rise in the policy rate. In 2024, the mortgage rate is projected at 3.0%.
It is assumed that the rise in the policy rate does not pass through fully to banks’ mort-gage rates partly because mortgage spreads, ie the spread between the mortgage rate and money market rate, have widened since the policy rate was lowered in March 2020. With a rise in the policy rate ahead, the spread on mortgages is expected to approach the levels prevailing prior to the policy rate cuts in March 2020.
Chart 2.1 Prospects for higher lending ratesPercent
2015 2016 2017 2018 2019 2020 2021 2022 2023 2024
0
0.5
1
1.5
2
2.5
3
3.5
4
0
0.5
1
1.5
2
2.5
3
3.5
4Policy rate
Three-month
money market rate
Mortgage rate
Projections MPR 2/21
Projections MPR 1/21
Sources: Statistics Norway and Norges Bank
17
PART 1 MONETARY POLICY / SECTION 2
NORGES BANK MONETARY POLICY REPORT 2/2021
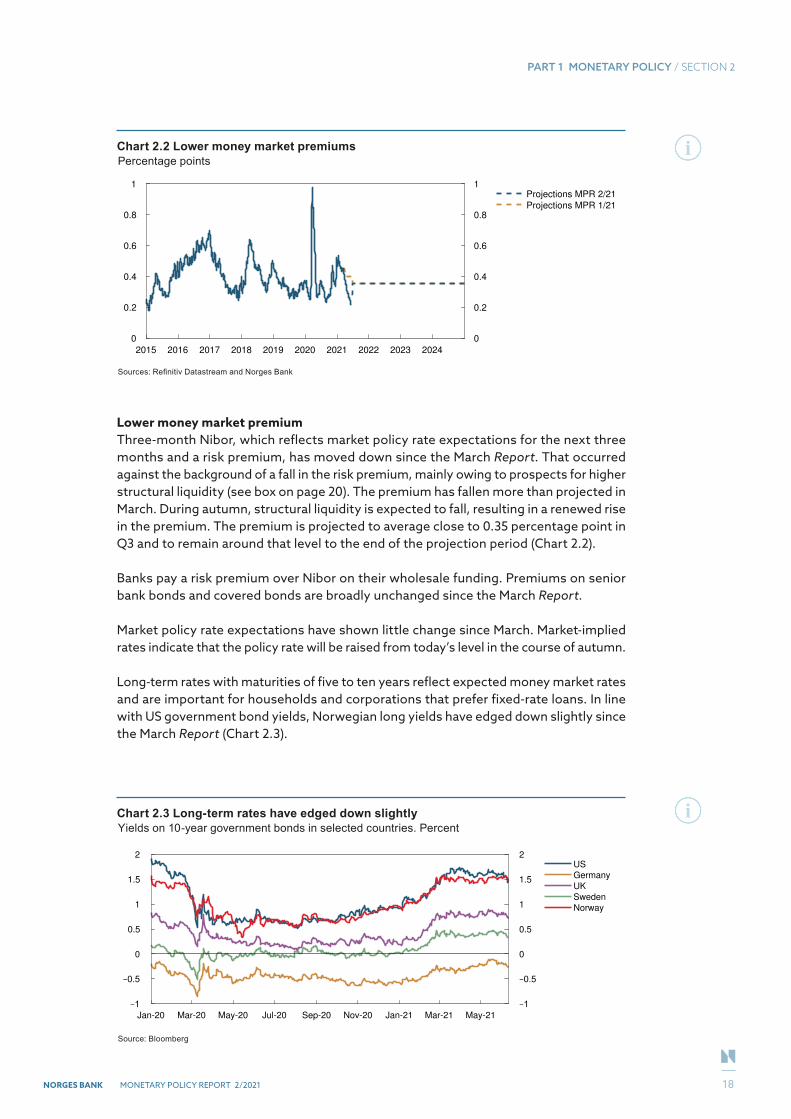
Lower money market premiumThree-month Nibor, which reflects market policy rate expectations for the next three months and a risk premium, has moved down since the March Report. That occurred against the background of a fall in the risk premium, mainly owing to prospects for higher structural liquidity (see box on page 20). The premium has fallen more than projected in March. During autumn, structural liquidity is expected to fall, resulting in a renewed rise in the premium. The premium is projected to average close to 0.35 percentage point in Q3 and to remain around that level to the end of the projection period (Chart 2.2).
Banks pay a risk premium over Nibor on their wholesale funding. Premiums on senior bank bonds and covered bonds are broadly unchanged since the March Report.
Market policy rate expectations have shown little change since March. Market-implied rates indicate that the policy rate will be raised from today’s level in the course of autumn.
Long-term rates with maturities of five to ten years reflect expected money market rates and are important for households and corporations that prefer fixed-rate loans. In line with US government bond yields, Norwegian long yields have edged down slightly since the March Report (Chart 2.3).
Chart 2.2 Lower money market premiumsPercentage points
2015 2016 2017 2018 2019 2020 2021 2022 2023 2024
0
0.2
0.4
0.6
0.8
1
0
0.2
0.4
0.6
0.8
1Projections MPR 2/21
Projections MPR 1/21
Sources: Refinitiv Datastream and Norges Bank
Chart 2.3 Long-term rates have edged down slightlyYields on 10-year government bonds in selected countries. Percent
Jan-20 Mar-20 May-20 Jul-20 Sep-20 Nov-20 Jan-21 Mar-21 May-21
0
0.5
1
1.5
2
0
0.5
1
1.5
2US
Germany
UK
Sweden
Norway
Source: Bloomberg
18
PART 1 MONETARY POLICY / SECTION 2
NORGES BANK MONETARY POLICY REPORT 2/2021
Banks’ interest rates on loans to corporations are normally linked to three-month Nibor. Against the background of the decline in the money market rate, interest rates on cor-porate loans both from banks and the bond market have also declined since March. Risk premiums on new corporate bond issues are broadly unchanged since March.
Another source of corporate funding is the equity market. Like equity indexes in many other countries, the benchmark index on Oslo Børs declined markedly in spring 2020, followed by advances to historically high levels through autumn 2020 and winter 2021. Since the March Report, the Oslo Børs benchmark index has advanced further.
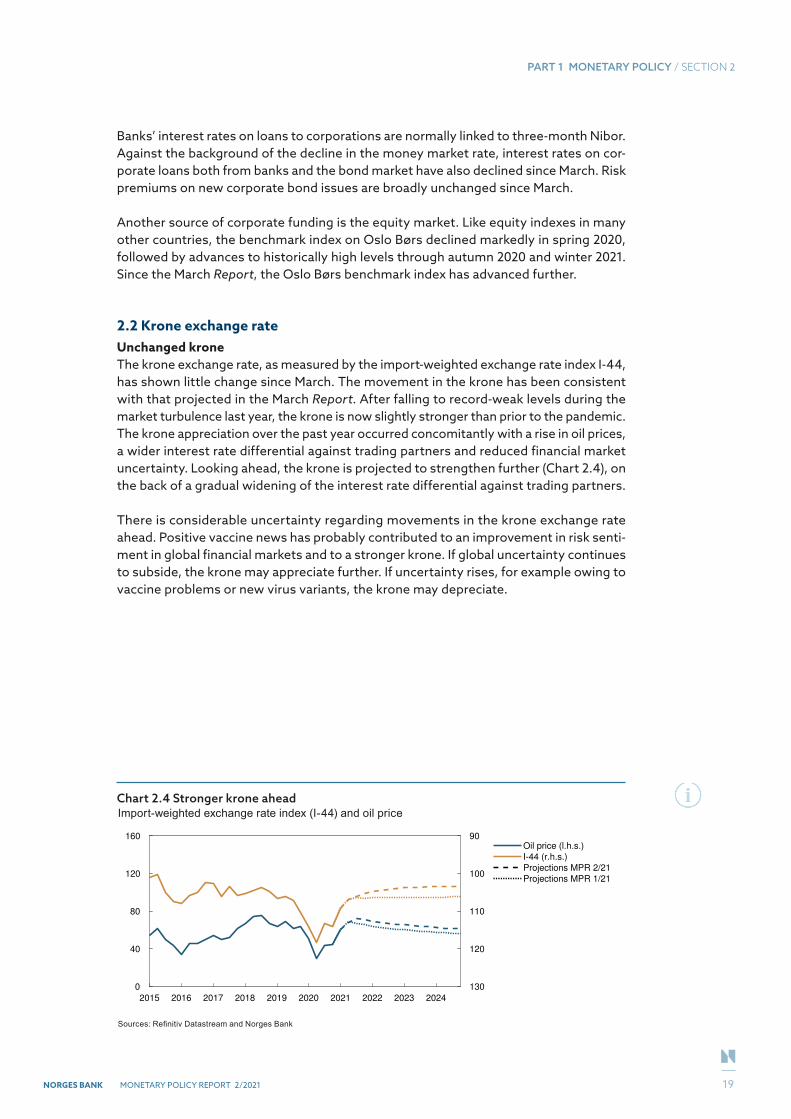
2.2 Krone exchange rateUnchanged kroneThe krone exchange rate, as measured by the import-weighted exchange rate index I-44, has shown little change since March. The movement in the krone has been consistent with that projected in the March Report. After falling to record-weak levels during the market turbulence last year, the krone is now slightly stronger than prior to the pandemic. The krone appreciation over the past year occurred concomitantly with a rise in oil prices, a wider interest rate differential against trading partners and reduced financial market uncertainty. Looking ahead, the krone is projected to strengthen further (Chart 2.4), on the back of a gradual widening of the interest rate differential against trading partners.
There is considerable uncertainty regarding movements in the krone exchange rate ahead. Positive vaccine news has probably contributed to an improvement in risk senti-ment in global financial markets and to a stronger krone. If global uncertainty continues to subside, the krone may appreciate further. If uncertainty rises, for example owing to vaccine problems or new virus variants, the krone may depreciate.
Chart 2.4 Stronger krone aheadImport-weighted exchange rate index (I-44) and oil price
2015 2016 2017 2018 2019 2020 2021 2022 2023 2024
0
40
80
120
160
130
120
110
100
90Oil price (l.h.s.)
I-44 (r.h.s.)
Projections MPR 2/21
Projections MPR 1/21
Sources: Refinitiv Datastream and Norges Bank
19
PART 1 MONETARY POLICY / SECTION 2
NORGES BANK MONETARY POLICY REPORT 2/2021
STRUCTURAL LIQUIDITYStructural liquidity is the level of reserves in the banking system before Norges Bank conducts market operations to supply or withdraw reserves. Structural liquidity is pri-marily determined by transactions in and out of the government’s account with Norges Bank. When private agents pay direct and indirect taxes to the government, or when the government issues government securities, reserves are transferred from the banks’ accounts with the central bank to the government’s account with the central bank, reducing the quantity of reserves in the banking system. Reserves increase in the oppo-site case, ie when the government transfers money to the public, for example wages, benefits and other transfers, and when government securities mature.
Norges Bank conducts market operations, so-called F-loans and F-deposits, to counter-act daily variations in structural liquidity with a view to maintaining the reserves in the banking system at around NOK 35bn daily.1 Ahead of periods of lower structural liquid-ity, banks may nevertheless prefer to procure NOK at longer maturities, resulting in an increase in demand for NOK in the FX swap market. Nibor is designed in a way whereby an increase in the cost of NOK funding via the FX swap market translates into a higher money market premium. On the other hand, when there are prospects for higher struc-tural liquidity, the cost of NOK funding in the FX swap market will fall, which results in a lower money market premium, as has recently been the case.
1 See “Norges Bank’s liquidity policy: Principles and design”, Norges Bank Papers 3/21 (publication forthcoming).
20
NORGES BANK MONETARY POLICY REPORT 2/2021
3 Norwegian economy
Tighter Covid-related restrictions led to a fall in mainland GDP in 2021 Q1 and a rise in unemployment. Infection rates have since come down, and the author-ities have begun a gradual reopening of society. Recently, unemployment has fallen substantially.
There is still uncertainty surrounding the economic recovery ahead, but given how the pandemic now seems to be evolving, economic activity is expected to show a strong rebound in the coming months. Household consumption will likely rise sharply ahead, and capacity utilisation is projected to return to a normal level in the course of autumn. There are prospects that unemployment will continue to fall in the period to autumn 2022 and remain low until the end of the projection period.
Underlying inflation has slowed in recent months and is now below the inflation target. The reopening is creating uncertainty about price and wage inflation ahead, but price inflation is likely to slow further into 2022. Inflation is expected to pick up again further ahead and is projected to reach 1.6% at the end of 2024.
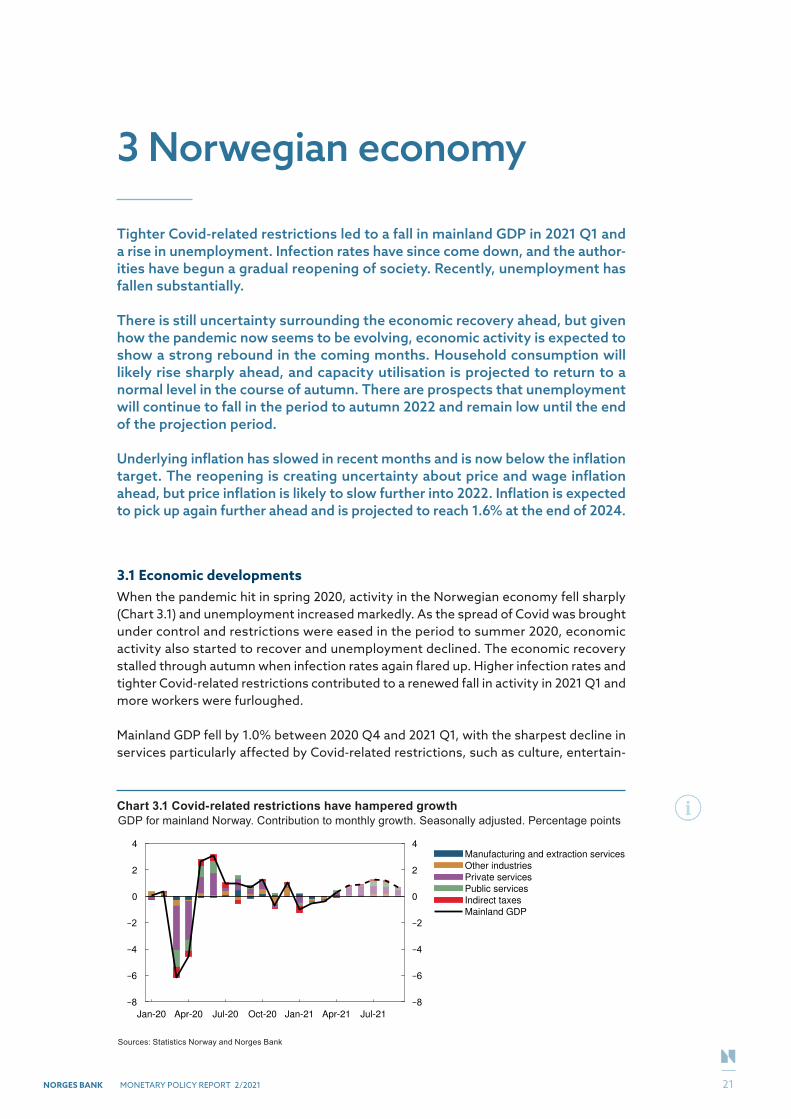
3.1 Economic developmentsWhen the pandemic hit in spring 2020, activity in the Norwegian economy fell sharply (Chart 3.1) and unemployment increased markedly. As the spread of Covid was brought under control and restrictions were eased in the period to summer 2020, economic activity also started to recover and unemployment declined. The economic recovery stalled through autumn when infection rates again flared up. Higher infection rates and tighter Covid-related restrictions contributed to a renewed fall in activity in 2021 Q1 and more workers were furloughed.
Mainland GDP fell by 1.0% between 2020 Q4 and 2021 Q1, with the sharpest decline in services particularly affected by Covid-related restrictions, such as culture, entertain-
Chart 3.1 Covid-related restrictions have hampered growthGDP for mainland Norway. Contribution to monthly growth. Seasonally adjusted. Percentage points
Jan-20 Apr-20 Jul-20 Oct-20 Jan-21 Apr-21 Jul-21
0
2
4
0
2
4Manufacturing and extraction services
Other industries
Private services
Public services
Indirect taxes
Mainland GDP
Sources: Statistics Norway and Norges Bank
21
PART 1 MONETARY POLICY / SECTION 3
NORGES BANK MONETARY POLICY REPORT 2/2021
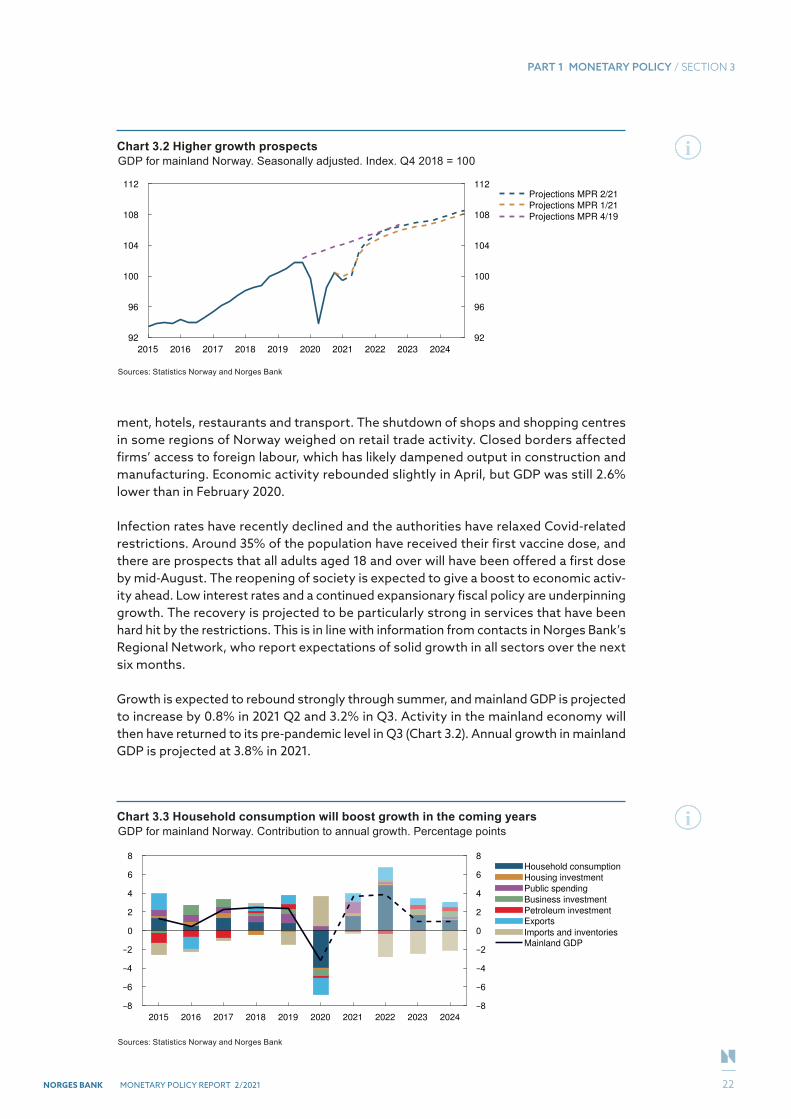
ment, hotels, restaurants and transport. The shutdown of shops and shopping centres in some regions of Norway weighed on retail trade activity. Closed borders affected firms’ access to foreign labour, which has likely dampened output in construction and manufacturing. Economic activity rebounded slightly in April, but GDP was still 2.6% lower than in February 2020.
Infection rates have recently declined and the authorities have relaxed Covid-related restrictions. Around 35% of the population have received their first vaccine dose, and there are prospects that all adults aged 18 and over will have been offered a first dose by mid-August. The reopening of society is expected to give a boost to economic activ-ity ahead. Low interest rates and a continued expansionary fiscal policy are underpinning growth. The recovery is projected to be particularly strong in services that have been hard hit by the restrictions. This is in line with information from contacts in Norges Bank’s Regional Network, who report expectations of solid growth in all sectors over the next six months.
Growth is expected to rebound strongly through summer, and mainland GDP is projected to increase by 0.8% in 2021 Q2 and 3.2% in Q3. Activity in the mainland economy will then have returned to its pre-pandemic level in Q3 (Chart 3.2). Annual growth in mainland GDP is projected at 3.8% in 2021.
Chart 3.2 Higher growth prospectsGDP for mainland Norway. Seasonally adjusted. Index. Q4 2018 = 100
2015 2016 2017 2018 2019 2020 2021 2022 2023 2024
92
96
100
104
108
112
92
96
100
104
108
112Projections MPR 2/21
Projections MPR 1/21
Projections MPR 4/19
Sources: Statistics Norway and Norges Bank
Chart 3.3 Household consumption will boost growth in the coming yearsGDP for mainland Norway. Contribution to annual growth. Percentage points
2015 2016 2017 2018 2019 2020 2021 2022 2023 2024
0
2
4
6
8
0
2
4
6
8Household consumption Housing investment Public spending Business investment Petroleum investment Exports
Imports and inventories Mainland GDP
Sources: Statistics Norway and Norges Bank
22
PART 1 MONETARY POLICY / SECTION 3
NORGES BANK MONETARY POLICY REPORT 2/2021
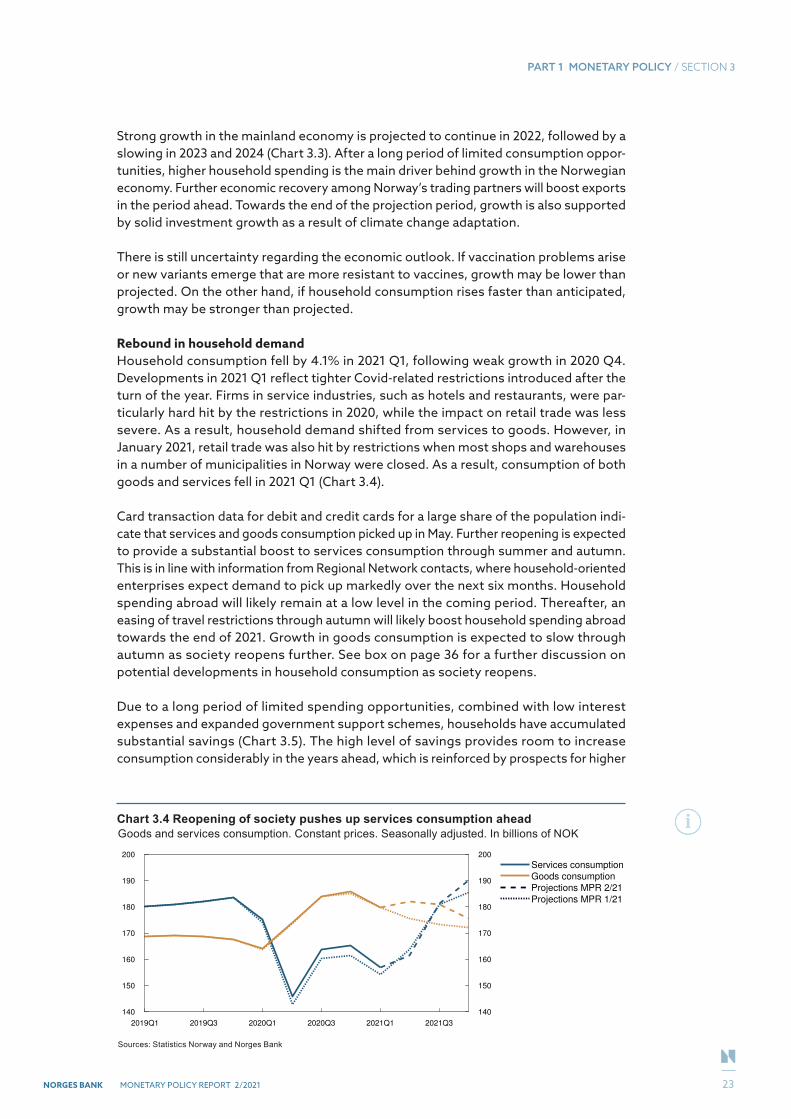
Strong growth in the mainland economy is projected to continue in 2022, followed by a slowing in 2023 and 2024 (Chart 3.3). After a long period of limited consumption oppor-tunities, higher household spending is the main driver behind growth in the Norwegian economy. Further economic recovery among Norway’s trading partners will boost exports in the period ahead. Towards the end of the projection period, growth is also supported by solid investment growth as a result of climate change adaptation.
There is still uncertainty regarding the economic outlook. If vaccination problems arise or new variants emerge that are more resistant to vaccines, growth may be lower than projected. On the other hand, if household consumption rises faster than anticipated, growth may be stronger than projected.
Rebound in household demandHousehold consumption fell by 4.1% in 2021 Q1, following weak growth in 2020 Q4. Developments in 2021 Q1 reflect tighter Covid-related restrictions introduced after the turn of the year. Firms in service industries, such as hotels and restaurants, were par-ticularly hard hit by the restrictions in 2020, while the impact on retail trade was less severe. As a result, household demand shifted from services to goods. However, in January 2021, retail trade was also hit by restrictions when most shops and warehouses in a number of municipalities in Norway were closed. As a result, consumption of both goods and services fell in 2021 Q1 (Chart 3.4).
Card transaction data for debit and credit cards for a large share of the population indi-cate that services and goods consumption picked up in May. Further reopening is expected to provide a substantial boost to services consumption through summer and autumn. This is in line with information from Regional Network contacts, where household-oriented enterprises expect demand to pick up markedly over the next six months. Household spending abroad will likely remain at a low level in the coming period. Thereafter, an easing of travel restrictions through autumn will likely boost household spending abroad towards the end of 2021. Growth in goods consumption is expected to slow through autumn as society reopens further. See box on page 36 for a further discussion on potential developments in household consumption as society reopens.
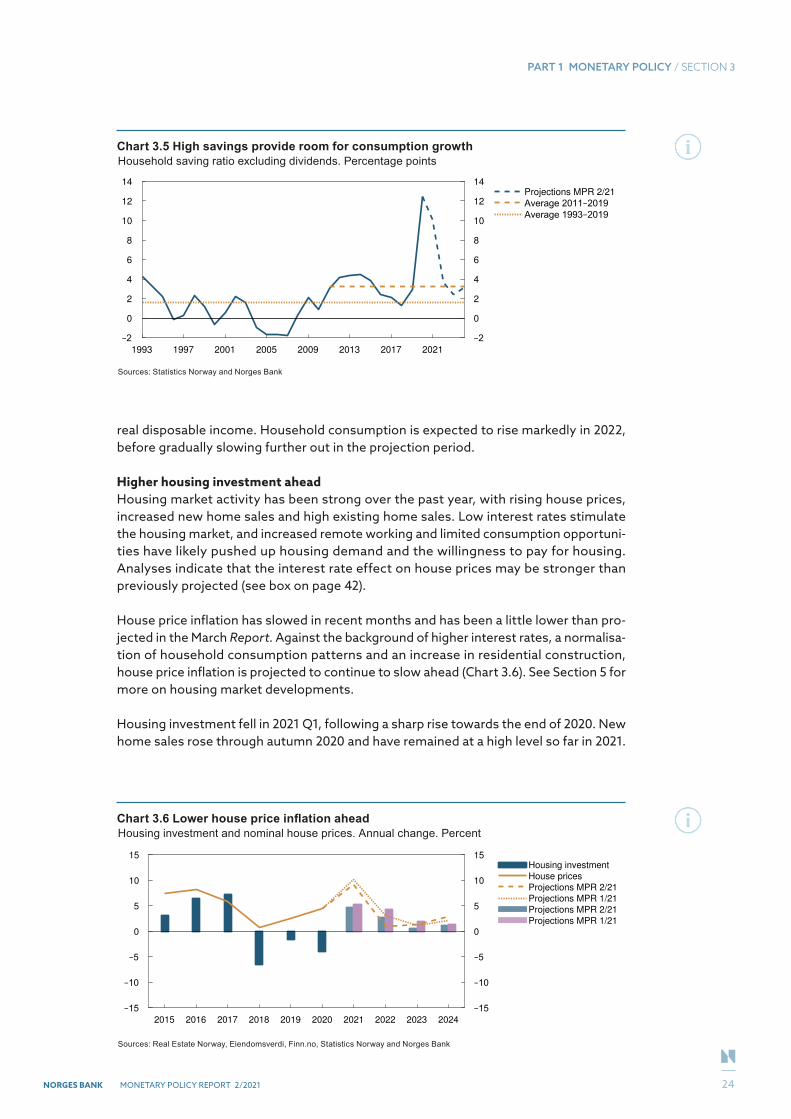
Due to a long period of limited spending opportunities, combined with low interest expenses and expanded government support schemes, households have accumulated substantial savings (Chart 3.5). The high level of savings provides room to increase consumption considerably in the years ahead, which is reinforced by prospects for higher
Chart 3.4 Reopening of society pushes up services consumption aheadGoods and services consumption. Constant prices. Seasonally adjusted. In billions of NOK
2019Q1 2019Q3 2020Q1 2020Q3 2021Q1 2021Q3
140
150
160
170
180
190
200
140
150
160
170
180
190
200
Services consumption
Goods consumption
Projections MPR 2/21
Projections MPR 1/21
Sources: Statistics Norway and Norges Bank
23
PART 1 MONETARY POLICY / SECTION 3
NORGES BANK MONETARY POLICY REPORT 2/2021
real disposable income. Household consumption is expected to rise markedly in 2022, before gradually slowing further out in the projection period.
Higher housing investment aheadHousing market activity has been strong over the past year, with rising house prices, increased new home sales and high existing home sales. Low interest rates stimulate the housing market, and increased remote working and limited consumption opportuni-ties have likely pushed up housing demand and the willingness to pay for housing. Analyses indicate that the interest rate effect on house prices may be stronger than previously projected (see box on page 42).
House price inflation has slowed in recent months and has been a little lower than pro-jected in the March Report. Against the background of higher interest rates, a normalisa-tion of household consumption patterns and an increase in residential construction, house price inflation is projected to continue to slow ahead (Chart 3.6). See Section 5 for more on housing market developments.
Housing investment fell in 2021 Q1, following a sharp rise towards the end of 2020. New home sales rose through autumn 2020 and have remained at a high level so far in 2021.
Chart 3.5 High savings provide room for consumption growthHousehold saving ratio excluding dividends. Percentage points
1993 1997 2001 2005 2009 2013 2017 2021
0
2
4
6
8
10
12
14
0
2
4
6
8
10
12
14Projections MPR 2/21
Sources: Statistics Norway and Norges Bank
Chart 3.6 Lower house price inflation aheadHousing investment and nominal house prices. Annual change. Percent
2015 2016 2017 2018 2019 2020 2021 2022 2023 2024
0
5
10
15
0
5
10
15Housing investment
House prices
Projections MPR 2/21
Projections MPR 1/21
Projections MPR 2/21
Projections MPR 1/21
Sources: Real Estate Norway, Eiendomsverdi, Finn.no, Statistics Norway and Norges Bank
24
PART 1 MONETARY POLICY / SECTION 3
NORGES BANK MONETARY POLICY REPORT 2/2021
The high level of new home sales is expected to push up residential construction and housing investment ahead.
Prospects for higher business investmentThe pandemic has had a severe impact on many sectors and has led to a decline in the willingness and ability of many firms to invest. Mainland business investment fell by over 6% in 2020, and investment edged down further in 2021 Q1. Access to public support and loan schemes has eased uncertainties and compensated firms for loss of income during the lockdowns over the past year. This may have curbed the decline in investment. With a return to more normal economic conditions, the public support schemes are assumed to be phased out in the course of autumn.
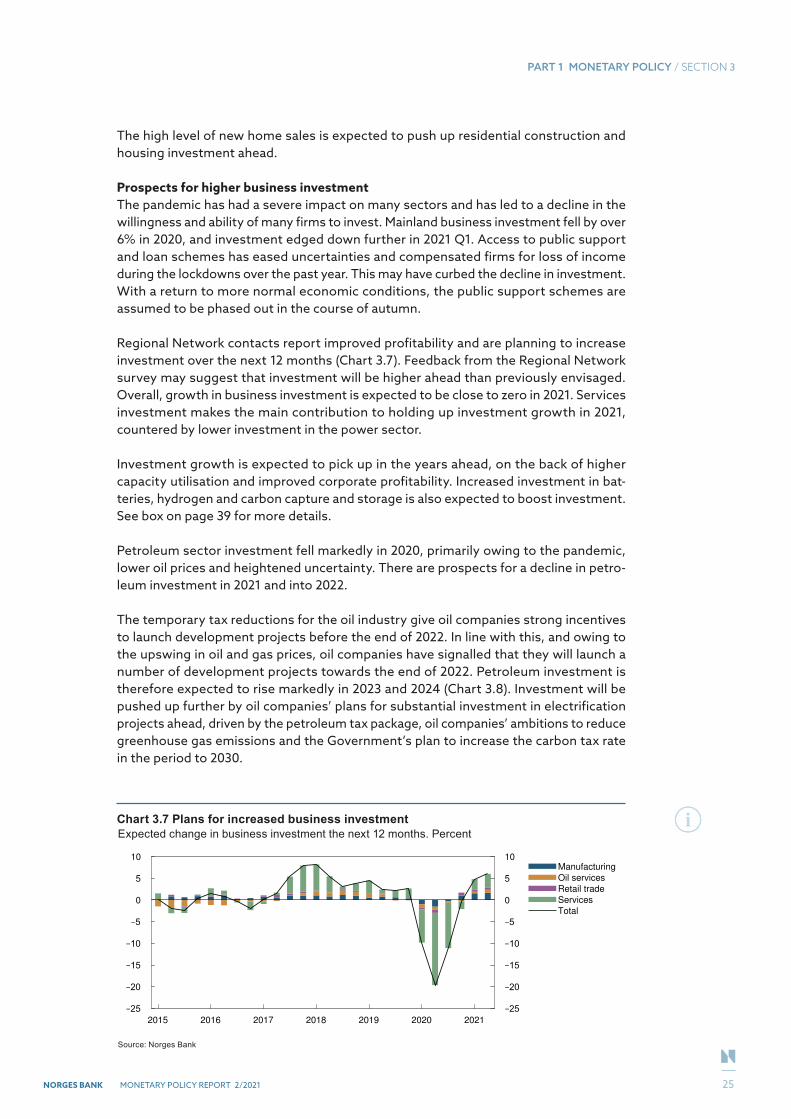
Regional Network contacts report improved profitability and are planning to increase investment over the next 12 months (Chart 3.7). Feedback from the Regional Network survey may suggest that investment will be higher ahead than previously envisaged. Overall, growth in business investment is expected to be close to zero in 2021. Services investment makes the main contribution to holding up investment growth in 2021, countered by lower investment in the power sector.
Investment growth is expected to pick up in the years ahead, on the back of higher capacity utilisation and improved corporate profitability. Increased investment in bat-teries, hydrogen and carbon capture and storage is also expected to boost investment. See box on page 39 for more details.
Petroleum sector investment fell markedly in 2020, primarily owing to the pandemic, lower oil prices and heightened uncertainty. There are prospects for a decline in petro-leum investment in 2021 and into 2022.
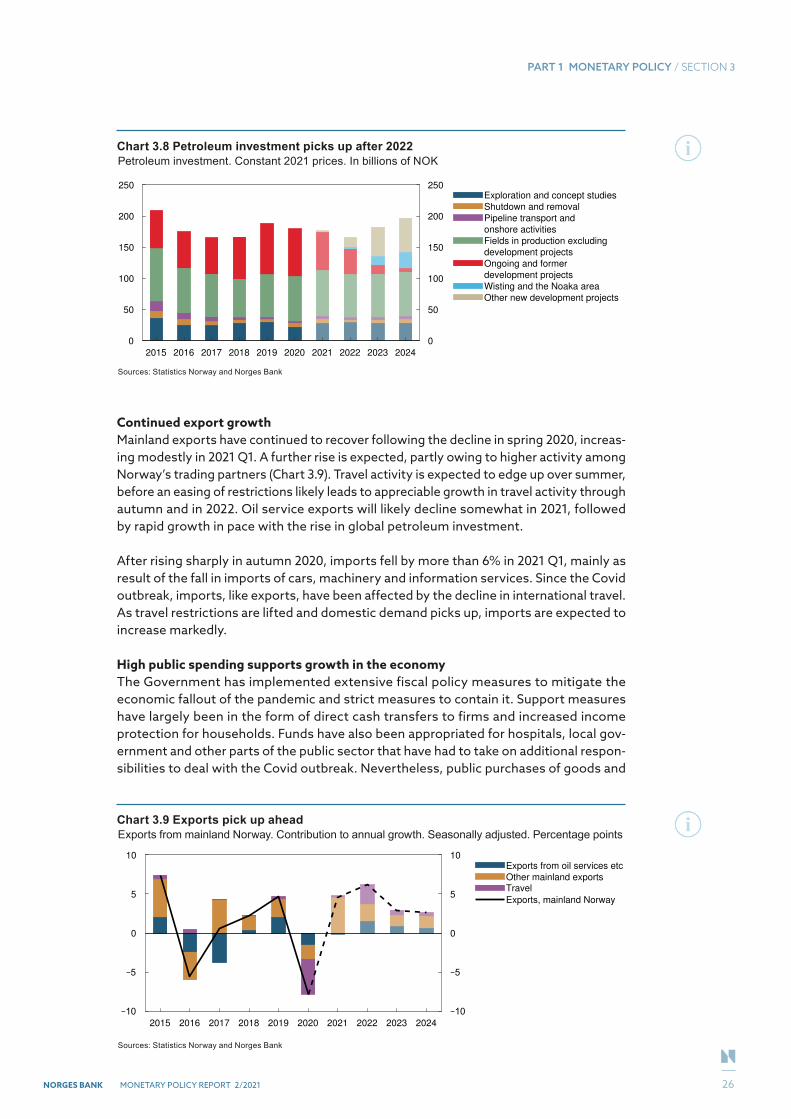
The temporary tax reductions for the oil industry give oil companies strong incentives to launch development projects before the end of 2022. In line with this, and owing to the upswing in oil and gas prices, oil companies have signalled that they will launch a number of development projects towards the end of 2022. Petroleum investment is therefore expected to rise markedly in 2023 and 2024 (Chart 3.8). Investment will be pushed up further by oil companies’ plans for substantial investment in electrification projects ahead, driven by the petroleum tax package, oil companies’ ambitions to reduce greenhouse gas emissions and the Government’s plan to increase the carbon tax rate in the period to 2030.
Chart 3.7 Plans for increased business investmentExpected change in business investment the next 12 months. Percent
2015 2016 2017 2018 2019 2020 2021
0
5
10
0
5
10Manufacturing
Oil services
Retail trade
Services
Total
Source: Norges Bank
25
PART 1 MONETARY POLICY / SECTION 3
NORGES BANK MONETARY POLICY REPORT 2/2021
Continued export growthMainland exports have continued to recover following the decline in spring 2020, increas-ing modestly in 2021 Q1. A further rise is expected, partly owing to higher activity among Norway’s trading partners (Chart 3.9). Travel activity is expected to edge up over summer, before an easing of restrictions likely leads to appreciable growth in travel activity through autumn and in 2022. Oil service exports will likely decline somewhat in 2021, followed by rapid growth in pace with the rise in global petroleum investment.
After rising sharply in autumn 2020, imports fell by more than 6% in 2021 Q1, mainly as result of the fall in imports of cars, machinery and information services. Since the Covid outbreak, imports, like exports, have been affected by the decline in international travel. As travel restrictions are lifted and domestic demand picks up, imports are expected to increase markedly.
High public spending supports growth in the economyThe Government has implemented extensive fiscal policy measures to mitigate the economic fallout of the pandemic and strict measures to contain it. Support measures have largely been in the form of direct cash transfers to firms and increased income protection for households. Funds have also been appropriated for hospitals, local gov-ernment and other parts of the public sector that have had to take on additional respon-sibilities to deal with the Covid outbreak. Nevertheless, public purchases of goods and
Chart 3.8 Petroleum investment picks up after 2022Petroleum investment. Constant 2021 prices. In billions of NOK
2015 2016 2017 2018 2019 2020 2021 2022 2023 2024
0
50
100
150
200
250
0
50
100
150
200
250Exploration and concept studies
Shutdown and removal
Pipeline transport and
onshore activities
Fields in production excluding
development projects
Ongoing and former
development projects
Wisting and the Noaka area
Other new development projects
Sources: Statistics Norway and Norges Bank
Chart 3.9 Exports pick up aheadExports from mainland Norway. Contribution to annual growth. Seasonally adjusted. Percentage points
2015 2016 2017 2018 2019 2020 2021 2022 2023 2024
0
5
10
0
5
10Exports from oil services etc Other mainland exports Travel
Exports, mainland Norway
Sources: Statistics Norway and Norges Bank
26
PART 1 MONETARY POLICY / SECTION 3
NORGES BANK MONETARY POLICY REPORT 2/2021
services have accounted for a smaller share of the support measures than during the 2008–2009 financial crisis. Various public services, such as health and care services, culture and education have also had to reduce their provision of services owing to the lockdowns over the past year. As a result, growth in public sector demand was fairly low in 2020 despite higher public spending.
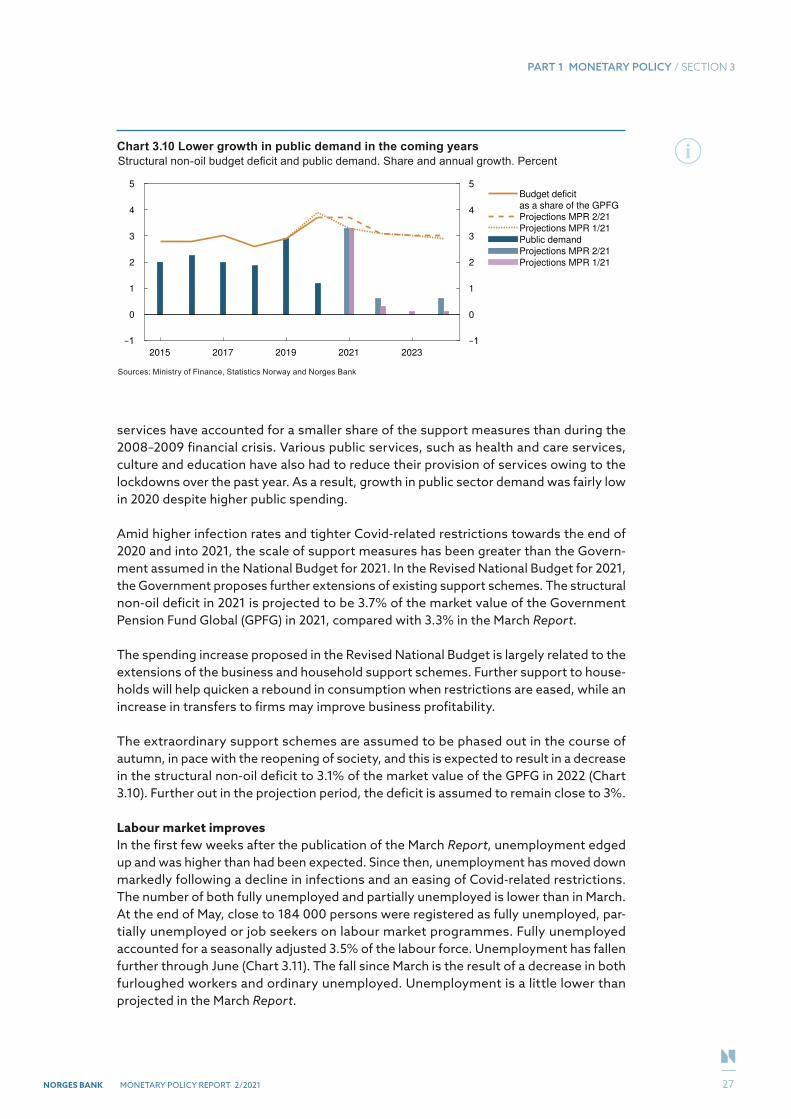
Amid higher infection rates and tighter Covid-related restrictions towards the end of 2020 and into 2021, the scale of support measures has been greater than the Govern-ment assumed in the National Budget for 2021. In the Revised National Budget for 2021, the Government proposes further extensions of existing support schemes. The structural non-oil deficit in 2021 is projected to be 3.7% of the market value of the Government Pension Fund Global (GPFG) in 2021, compared with 3.3% in the March Report.
The spending increase proposed in the Revised National Budget is largely related to the extensions of the business and household support schemes. Further support to house-holds will help quicken a rebound in consumption when restrictions are eased, while an increase in transfers to firms may improve business profitability.
The extraordinary support schemes are assumed to be phased out in the course of autumn, in pace with the reopening of society, and this is expected to result in a decrease in the structural non-oil deficit to 3.1% of the market value of the GPFG in 2022 (Chart 3.10). Further out in the projection period, the deficit is assumed to remain close to 3%.
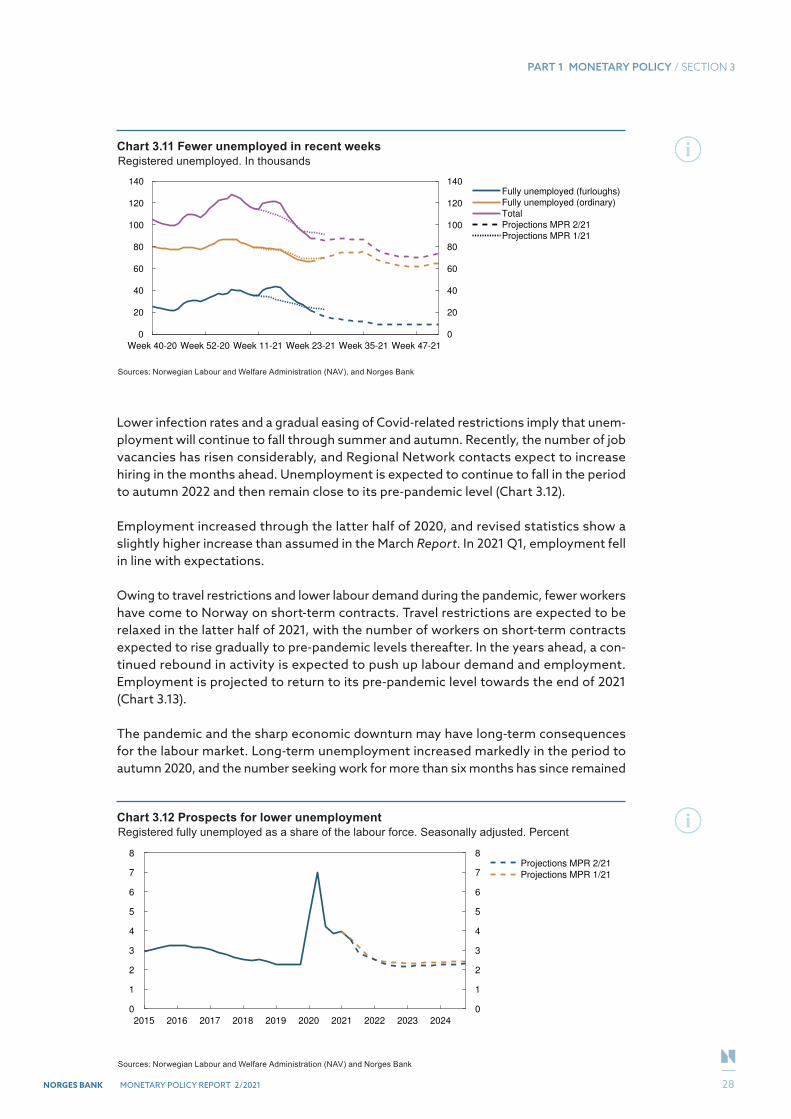
Labour market improvesIn the first few weeks after the publication of the March Report, unemployment edged up and was higher than had been expected. Since then, unemployment has moved down markedly following a decline in infections and an easing of Covid-related restrictions. The number of both fully unemployed and partially unemployed is lower than in March. At the end of May, close to 184 000 persons were registered as fully unemployed, par-tially unemployed or job seekers on labour market programmes. Fully unemployed accounted for a seasonally adjusted 3.5% of the labour force. Unemployment has fallen further through June (Chart 3.11). The fall since March is the result of a decrease in both furloughed workers and ordinary unemployed. Unemployment is a little lower than projected in the March Report.
Chart 3.10 Lower growth in public demand in the coming yearsStructural non-oil budget deficit and public demand. Share and annual growth. Percent
2015 2017 2019 2021 2023
0
1
2
3
4
5
0
1
2
3
4
5Budget deficit
as a share of the GPFG
Projections MPR 2/21
Projections MPR 1/21
Public demand
Projections MPR 2/21
Projections MPR 1/21
Sources: Ministry of Finance, Statistics Norway and Norges Bank
27
PART 1 MONETARY POLICY / SECTION 3
NORGES BANK MONETARY POLICY REPORT 2/2021
Lower infection rates and a gradual easing of Covid-related restrictions imply that unem-ployment will continue to fall through summer and autumn. Recently, the number of job vacancies has risen considerably, and Regional Network contacts expect to increase hiring in the months ahead. Unemployment is expected to continue to fall in the period to autumn 2022 and then remain close to its pre-pandemic level (Chart 3.12).
Employment increased through the latter half of 2020, and revised statistics show a slightly higher increase than assumed in the March Report. In 2021 Q1, employment fell in line with expectations.
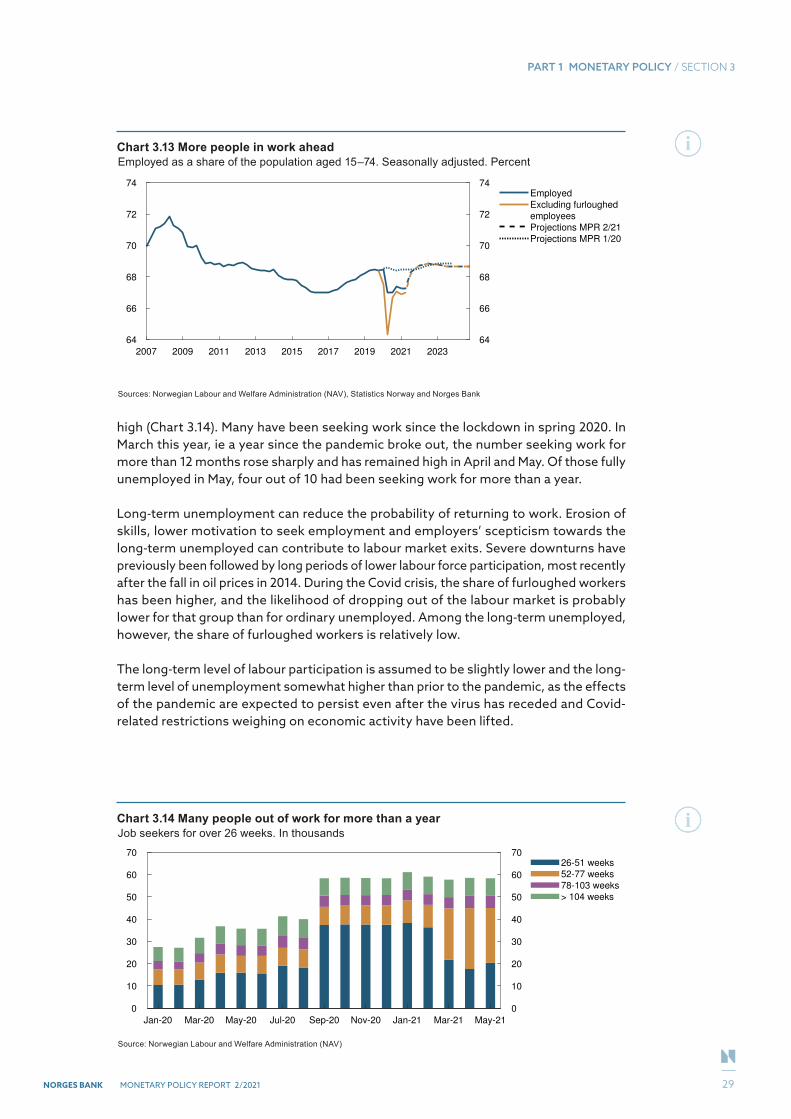
Owing to travel restrictions and lower labour demand during the pandemic, fewer workers have come to Norway on short-term contracts. Travel restrictions are expected to be relaxed in the latter half of 2021, with the number of workers on short-term contracts expected to rise gradually to pre-pandemic levels thereafter. In the years ahead, a con-tinued rebound in activity is expected to push up labour demand and employment. Employment is projected to return to its pre-pandemic level towards the end of 2021 (Chart 3.13).
The pandemic and the sharp economic downturn may have long-term consequences for the labour market. Long-term unemployment increased markedly in the period to autumn 2020, and the number seeking work for more than six months has since remained
Chart 3.11 Fewer unemployed in recent weeksRegistered unemployed. In thousands
Week 40-20 Week 52-20 Week 11-21 Week 23-21 Week 35-21 Week 47-21
0
20
40
60
80
100
120
140
0
20
40
60
80
100
120
140Fully unemployed (furloughs)
Fully unemployed (ordinary)
Total
Projections MPR 2/21
Projections MPR 1/21
Sources: Norwegian Labour and Welfare Administration (NAV), and Norges Bank
Chart 3.12 Prospects for lower unemploymentRegistered fully unemployed as a share of the labour force. Seasonally adjusted. Percent
Sources: Norwegian Labour and Welfare Administration (NAV) and Norges Bank
2015 2016 2017 2018 2019 2020 2021 2022 2023 2024
0
1
2
3
4
5
6
7
8
0
1
2
3
4
5
6
7
8Projections MPR 2/21
Projections MPR 1/21
28
PART 1 MONETARY POLICY / SECTION 3
NORGES BANK MONETARY POLICY REPORT 2/2021
high (Chart 3.14). Many have been seeking work since the lockdown in spring 2020. In March this year, ie a year since the pandemic broke out, the number seeking work for more than 12 months rose sharply and has remained high in April and May. Of those fully unemployed in May, four out of 10 had been seeking work for more than a year.
Long-term unemployment can reduce the probability of returning to work. Erosion of skills, lower motivation to seek employment and employers’ scepticism towards the long-term unemployed can contribute to labour market exits. Severe downturns have previously been followed by long periods of lower labour force participation, most recently after the fall in oil prices in 2014. During the Covid crisis, the share of furloughed workers has been higher, and the likelihood of dropping out of the labour market is probably lower for that group than for ordinary unemployed. Among the long-term unemployed, however, the share of furloughed workers is relatively low.
The long-term level of labour participation is assumed to be slightly lower and the long-term level of unemployment somewhat higher than prior to the pandemic, as the effects of the pandemic are expected to persist even after the virus has receded and Covid-related restrictions weighing on economic activity have been lifted.
Chart 3.13 More people in work aheadEmployed as a share of the population aged 15–74. Seasonally adjusted. Percent
Sources: Norwegian Labour and Welfare Administration (NAV), Statistics Norway and Norges Bank
2007 2009 2011 2013 2015 2017 2019 2021 2023
64
66
68
70
72
74
64
66
68
70
72
74Employed
Excluding furloughed
employees
Projections MPR 2/21
Projections MPR 1/20
Chart 3.14 Many people out of work for more than a yearJob seekers for over 26 weeks. In thousands
Jan-20 Mar-20 May-20 Jul-20 Sep-20 Nov-20 Jan-21 Mar-21 May-21
0
10
20
30
40
50
60
70
0
10
20
30
40
50
60
7026-51 weeks
52-77 weeks
78-103 weeks
> 104 weeks
Source: Norwegian Labour and Welfare Administration (NAV)
29
PART 1 MONETARY POLICY / SECTION 3
NORGES BANK MONETARY POLICY REPORT 2/2021
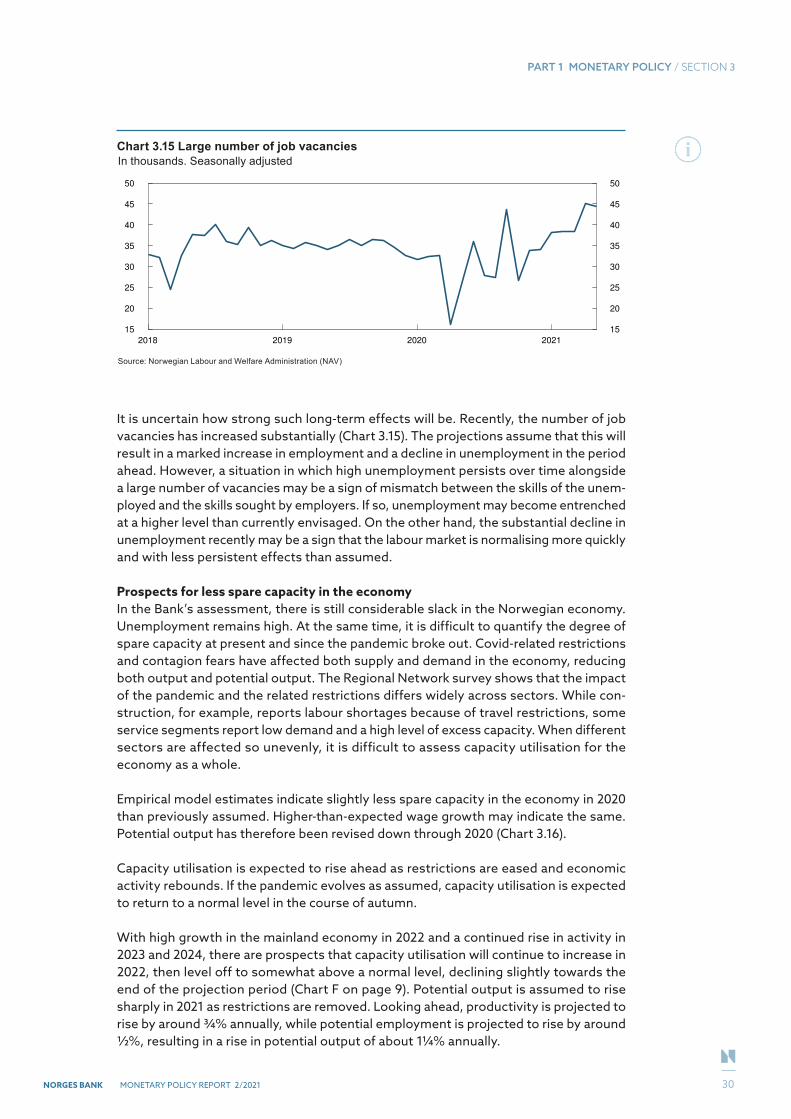
It is uncertain how strong such long-term effects will be. Recently, the number of job vacancies has increased substantially (Chart 3.15). The projections assume that this will result in a marked increase in employment and a decline in unemployment in the period ahead. However, a situation in which high unemployment persists over time alongside a large number of vacancies may be a sign of mismatch between the skills of the unem-ployed and the skills sought by employers. If so, unemployment may become entrenched at a higher level than currently envisaged. On the other hand, the substantial decline in unemployment recently may be a sign that the labour market is normalising more quickly and with less persistent effects than assumed.
Prospects for less spare capacity in the economyIn the Bank’s assessment, there is still considerable slack in the Norwegian economy. Unemployment remains high. At the same time, it is difficult to quantify the degree of spare capacity at present and since the pandemic broke out. Covid-related restrictions and contagion fears have affected both supply and demand in the economy, reducing both output and potential output. The Regional Network survey shows that the impact of the pandemic and the related restrictions differs widely across sectors. While con-struction, for example, reports labour shortages because of travel restrictions, some service segments report low demand and a high level of excess capacity. When different sectors are affected so unevenly, it is difficult to assess capacity utilisation for the economy as a whole.
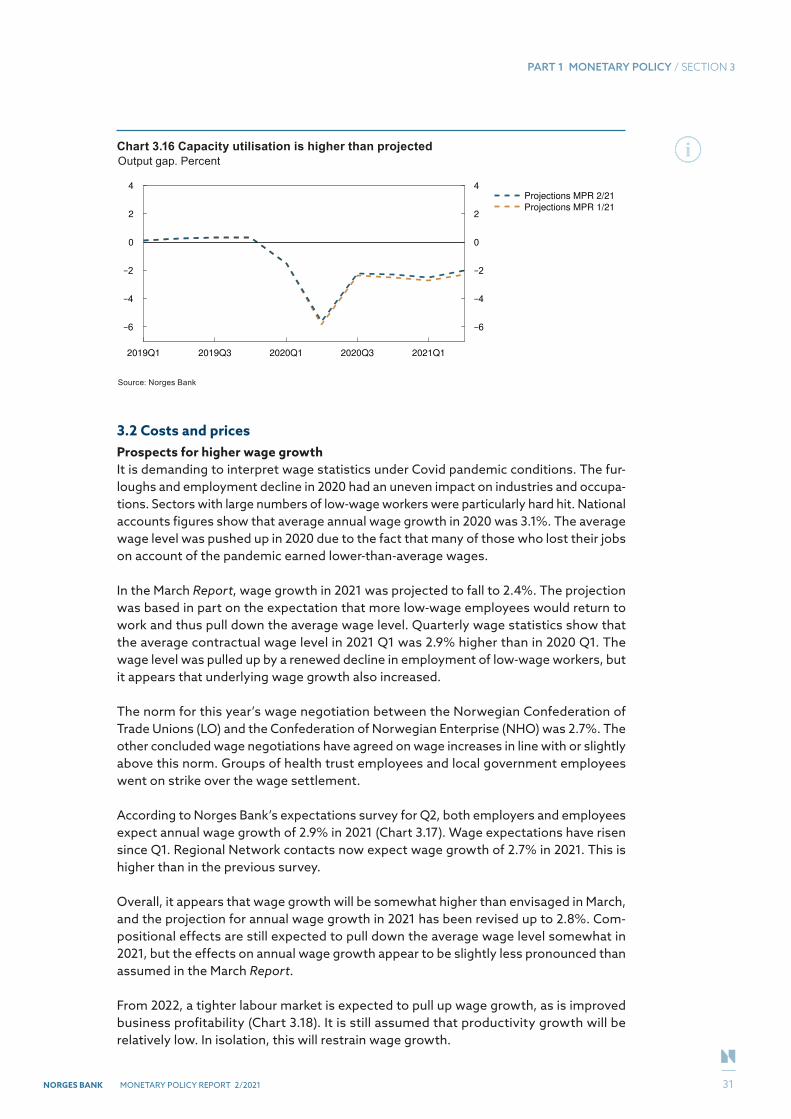
Empirical model estimates indicate slightly less spare capacity in the economy in 2020 than previously assumed. Higher-than-expected wage growth may indicate the same. Potential output has therefore been revised down through 2020 (Chart 3.16).
Capacity utilisation is expected to rise ahead as restrictions are eased and economic activity rebounds. If the pandemic evolves as assumed, capacity utilisation is expected to return to a normal level in the course of autumn.
With high growth in the mainland economy in 2022 and a continued rise in activity in 2023 and 2024, there are prospects that capacity utilisation will continue to increase in 2022, then level off to somewhat above a normal level, declining slightly towards the end of the projection period (Chart F on page 9). Potential output is assumed to rise sharply in 2021 as restrictions are removed. Looking ahead, productivity is projected to rise by around ¾% annually, while potential employment is projected to rise by around ½%, resulting in a rise in potential output of about 1¼% annually.
Chart 3.15 Large number of job vacanciesIn thousands. Seasonally adjusted
2018 2019 2020 2021
15
20
25
30
35
40
45
50
15
20
25
30
35
40
45
50
Source: Norwegian Labour and Welfare Administration (NAV)
30
PART 1 MONETARY POLICY / SECTION 3
NORGES BANK MONETARY POLICY REPORT 2/2021
3.2 Costs and pricesProspects for higher wage growthIt is demanding to interpret wage statistics under Covid pandemic conditions. The fur-loughs and employment decline in 2020 had an uneven impact on industries and occupa-tions. Sectors with large numbers of low-wage workers were particularly hard hit. National accounts figures show that average annual wage growth in 2020 was 3.1%. The average wage level was pushed up in 2020 due to the fact that many of those who lost their jobs on account of the pandemic earned lower-than-average wages.
In the March Report, wage growth in 2021 was projected to fall to 2.4%. The projection was based in part on the expectation that more low-wage employees would return to work and thus pull down the average wage level. Quarterly wage statistics show that the average contractual wage level in 2021 Q1 was 2.9% higher than in 2020 Q1. The wage level was pulled up by a renewed decline in employment of low-wage workers, but it appears that underlying wage growth also increased.
The norm for this year’s wage negotiation between the Norwegian Confederation of Trade Unions (LO) and the Confederation of Norwegian Enterprise (NHO) was 2.7%. The other concluded wage negotiations have agreed on wage increases in line with or slightly above this norm. Groups of health trust employees and local government employees went on strike over the wage settlement.
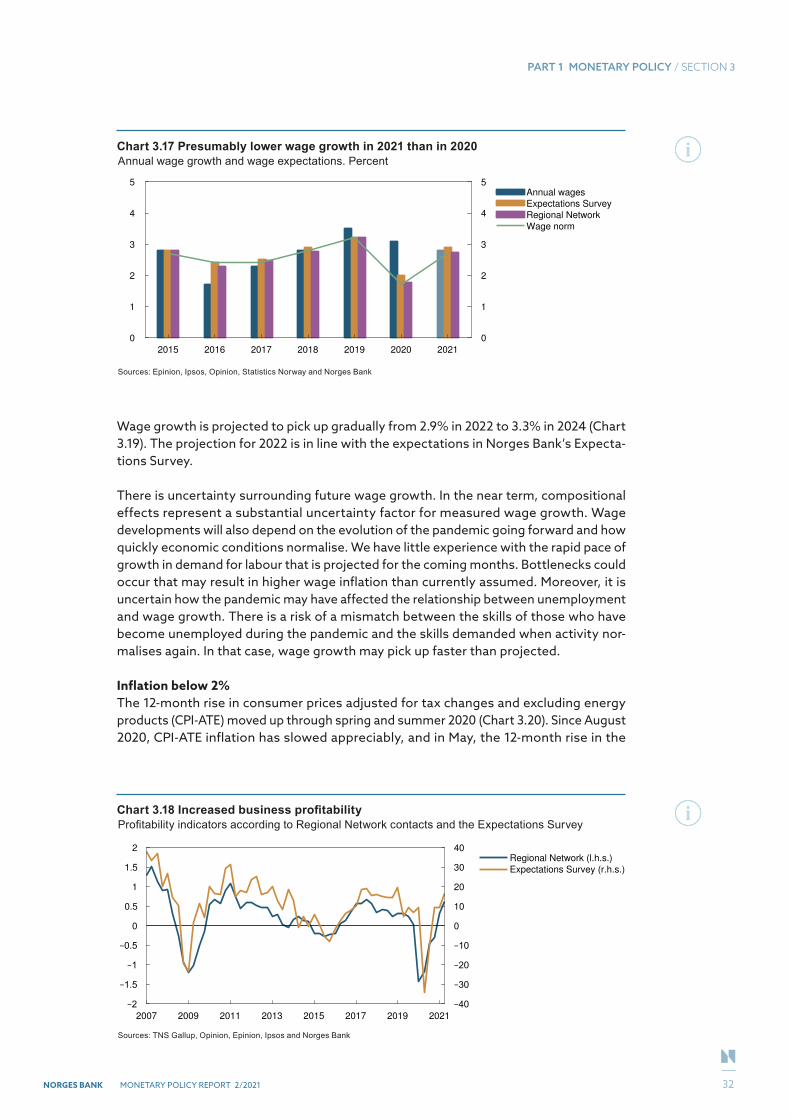
According to Norges Bank’s expectations survey for Q2, both employers and employees expect annual wage growth of 2.9% in 2021 (Chart 3.17). Wage expectations have risen since Q1. Regional Network contacts now expect wage growth of 2.7% in 2021. This is higher than in the previous survey.
Overall, it appears that wage growth will be somewhat higher than envisaged in March, and the projection for annual wage growth in 2021 has been revised up to 2.8%. Com-positional effects are still expected to pull down the average wage level somewhat in 2021, but the effects on annual wage growth appear to be slightly less pronounced than assumed in the March Report.
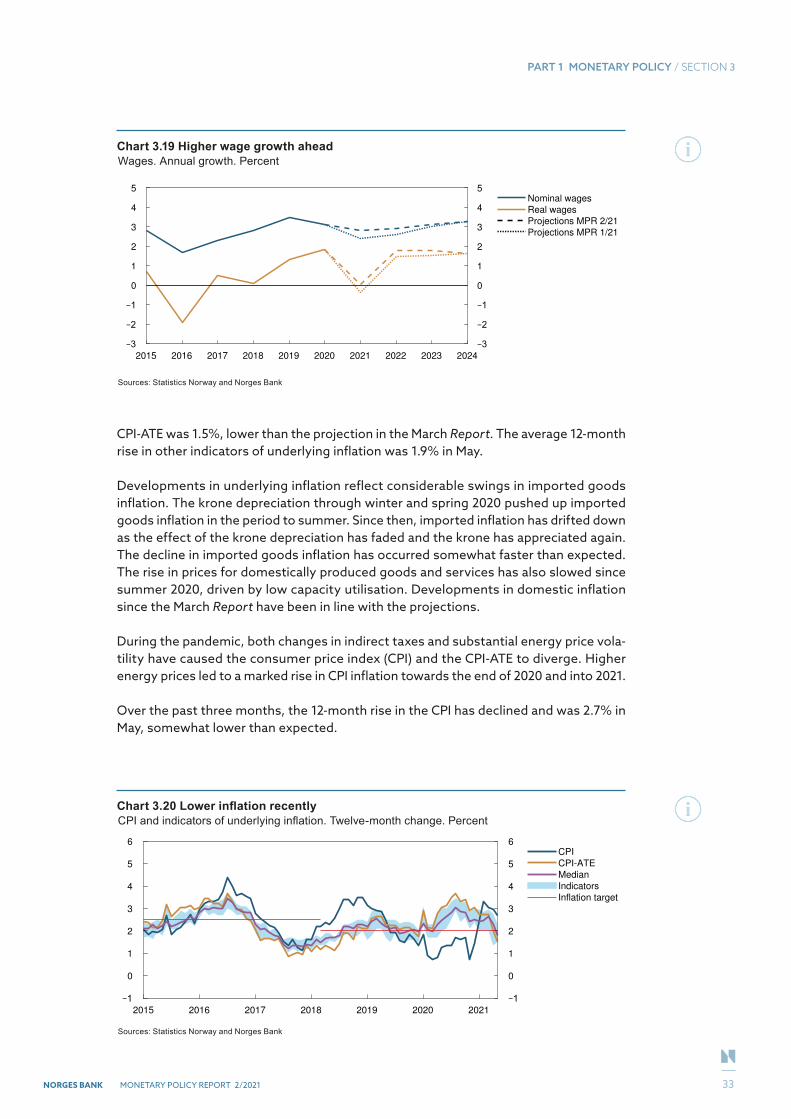
From 2022, a tighter labour market is expected to pull up wage growth, as is improved business profitability (Chart 3.18). It is still assumed that productivity growth will be relatively low. In isolation, this will restrain wage growth.
Chart 3.16 Capacity utilisation is higher than projectedOutput gap. Percent
2019Q1 2019Q3 2020Q1 2020Q3 2021Q1
0
2
4
0
2
4Projections MPR 2/21
Projections MPR 1/21
Source: Norges Bank
31
PART 1 MONETARY POLICY / SECTION 3
NORGES BANK MONETARY POLICY REPORT 2/2021
Wage growth is projected to pick up gradually from 2.9% in 2022 to 3.3% in 2024 (Chart 3.19). The projection for 2022 is in line with the expectations in Norges Bank’s Expecta-tions Survey.
There is uncertainty surrounding future wage growth. In the near term, compositional effects represent a substantial uncertainty factor for measured wage growth. Wage developments will also depend on the evolution of the pandemic going forward and how quickly economic conditions normalise. We have little experience with the rapid pace of growth in demand for labour that is projected for the coming months. Bottlenecks could occur that may result in higher wage inflation than currently assumed. Moreover, it is uncertain how the pandemic may have affected the relationship between unemployment and wage growth. There is a risk of a mismatch between the skills of those who have become unemployed during the pandemic and the skills demanded when activity nor-malises again. In that case, wage growth may pick up faster than projected.
Inflation below 2%The 12-month rise in consumer prices adjusted for tax changes and excluding energy products (CPI-ATE) moved up through spring and summer 2020 (Chart 3.20). Since August 2020, CPI-ATE inflation has slowed appreciably, and in May, the 12-month rise in the
Chart 3.17 Presumably lower wage growth in 2021 than in 2020Annual wage growth and wage expectations. Percent
2015 2016 2017 2018 2019 2020 2021
0
1
2
3
4
5
0
1
2
3
4
5Annual wages
Expectations Survey
Regional Network
Wage norm
Sources: Epinion, Ipsos, Opinion, Statistics Norway and Norges Bank
Chart 3.18 Increased business profitabilityProfitability indicators according to Regional Network contacts and the Expectations Survey
2007 2009 2011 2013 2015 2017 2019 2021
0
0.5
1
1.5
2
0
10
20
30
40Regional Network (l.h.s.)
Expectations Survey (r.h.s.)
Sources: TNS Gallup, Opinion, Epinion, Ipsos and Norges Bank
32
PART 1 MONETARY POLICY / SECTION 3
NORGES BANK MONETARY POLICY REPORT 2/2021
CPI-ATE was 1.5%, lower than the projection in the March Report. The average 12-month rise in other indicators of underlying inflation was 1.9% in May.
Developments in underlying inflation reflect considerable swings in imported goods inflation. The krone depreciation through winter and spring 2020 pushed up imported goods inflation in the period to summer. Since then, imported inflation has drifted down as the effect of the krone depreciation has faded and the krone has appreciated again. The decline in imported goods inflation has occurred somewhat faster than expected. The rise in prices for domestically produced goods and services has also slowed since summer 2020, driven by low capacity utilisation. Developments in domestic inflation since the March Report have been in line with the projections.
During the pandemic, both changes in indirect taxes and substantial energy price vola-tility have caused the consumer price index (CPI) and the CPI-ATE to diverge. Higher energy prices led to a marked rise in CPI inflation towards the end of 2020 and into 2021.
Over the past three months, the 12-month rise in the CPI has declined and was 2.7% in May, somewhat lower than expected.
Chart 3.19 Higher wage growth aheadWages. Annual growth. Percent
2015 2016 2017 2018 2019 2020 2021 2022 2023 2024
0
1
2
3
4
5
0
1
2
3
4
5Nominal wages
Real wages
Projections MPR 2/21
Projections MPR 1/21
Sources: Statistics Norway and Norges Bank
Chart 3.20 Lower inflation recentlyCPI and indicators of underlying inflation. Twelve-month change. Percent
2015 2016 2017 2018 2019 2020 2021
0
1
2
3
4
5
6
0
1
2
3
4
5
6CPI
CPI-ATE
Median
Indicators
Inflation target
Sources: Statistics Norway and Norges Bank
33
PART 1 MONETARY POLICY / SECTION 3
NORGES BANK MONETARY POLICY REPORT 2/2021
In the coming quarters, underlying inflation is projected to move down further, driven in particular by lower imported goods inflation (Chart 3.21). A stronger krone will pull down imported inflation, while higher prices for imported goods will likely dampen the fall. Futures prices indicate that energy prices will contribute to a decline in CPI inflation through summer.
CPI-ATE inflation is projected to move down from 1.7% in 2021 to 1.3% in 2022. Higher capacity utilisation in the Norwegian economy will push up inflation further out in the projection period, and underlying inflation is expected to be 1.6% at the end of 2024. There are prospects for lower energy price inflation ahead, and CPI inflation is projected to slow further through 2021 and 2022. In the longer-term, average inflation expectations, as measured by Norges Bank’s Expectations Survey, lie just above 2.0%.
Extraordinary conditions related to the pandemic are a source of uncertainty regarding inflation ahead. Temporary changes in indirect taxes affect the measurement of tax-adjusted prices and will likely have a dampening effect on measured domestic inflation in autumn (see box on page 35). At the same time, there is considerable uncertainty surrounding price developments when society reopens. Trading partner CPI inflation has risen rapidly. Freight rates and prices for various intermediate goods and com-modities have also risen sharply. Delays and increased costs in global production chains may lead to higher imported inflation in the coming period than assumed. In Norway, supply-side restrictions in some sectors owing to Covid-related measures and high demand for goods and services may result in a period of higher inflation than implied by the projections. On the other hand, there is a risk of a resurgence of infections, with the normalisation of the economy coming later than assumed. In that case, inflation will likely turn out lower than projected.
Unchanged real wages in 2021Real wage growth turned out relatively high in 2020, but little change in real wages is expected in 2021. In part, this reflects the considerable swings in CPI inflation in 2020 and 2021. This also reflects compositional effects, which lead to considerable fluctua-tions in measured nominal wage growth during these two years. Real wage growth is expected to pick up in 2022 and hold steady in 2023 and 2024.
Chart 3.21 Prospects for lower imported inflationDomestically produced goods and services and imported goods in the CPI-ATE. Four-quarter change. Percent
2015 2017 2019 2021 2023
0
1
2
3
4
5
6
0
1
2
3
4
5
6Domestically produced
goods and services
Imported goods
Projections MPR 2/21
Projections MPR 1/21
Sources: Statistics Norway and Norges Bank
34
PART 1 MONETARY POLICY / SECTION 3
NORGES BANK MONETARY POLICY REPORT 2/2021
MEASURING PRICES DURING THE COVID PANDEMICThrough the pandemic, Statistics Norway has estimated the rise in prices for services that have been virtually unavailable owing to Covid-related restrictions. In May, around 2.2% of the basis for weighting the consumer price index (CPI) was extrapolated, based on either seasonal variations or the total CPI. As an economic support measure, the low rate of value-added tax (VAT) on goods and services was temporarily reduced from 12% to 6% from 1 April 2020. This applied to passenger transport and accommodation, and admission to cinemas, sports events, amusement parks and adventure centres. The VAT reduction has likely affected measured inflation. If businesses have reduced their retail prices less than implied by the reduction in the VAT rate in isolation, the tax-adjusted price level will have risen, all else equal. In the Revised National Budget, the Government has proposed raising VAT back to 12% from 1 October. If businesses do not increase their prices correspondingly, the measured tax-adjusted price level will in isolation be lower than if VAT had remained unchanged.
35
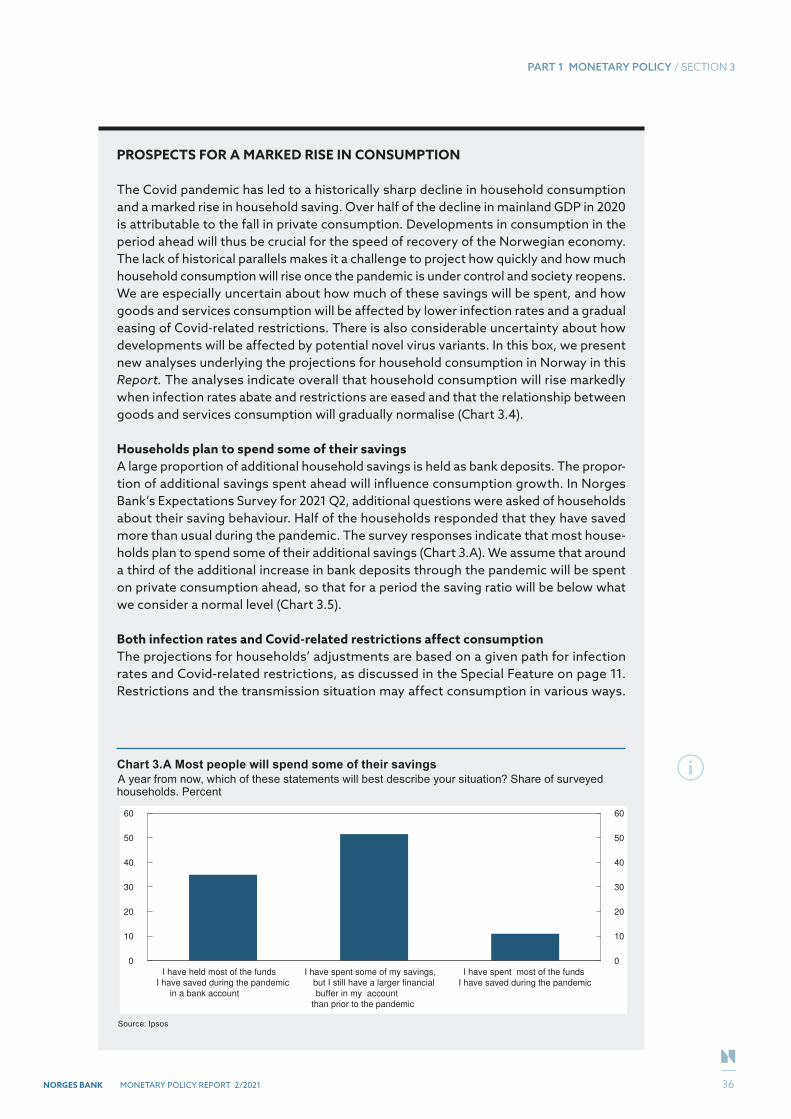
PART 1 MONETARY POLICY / SECTION 3
NORGES BANK MONETARY POLICY REPORT 2/2021
PROSPECTS FOR A MARKED RISE IN CONSUMPTION
The Covid pandemic has led to a historically sharp decline in household consumption and a marked rise in household saving. Over half of the decline in mainland GDP in 2020 is attributable to the fall in private consumption. Developments in consumption in the period ahead will thus be crucial for the speed of recovery of the Norwegian economy. The lack of historical parallels makes it a challenge to project how quickly and how much household consumption will rise once the pandemic is under control and society reopens. We are especially uncertain about how much of these savings will be spent, and how goods and services consumption will be affected by lower infection rates and a gradual easing of Covid-related restrictions. There is also considerable uncertainty about how developments will be affected by potential novel virus variants. In this box, we present new analyses underlying the projections for household consumption in Norway in this Report. The analyses indicate overall that household consumption will rise markedly when infection rates abate and restrictions are eased and that the relationship between goods and services consumption will gradually normalise (Chart 3.4).
Households plan to spend some of their savingsA large proportion of additional household savings is held as bank deposits. The propor-tion of additional savings spent ahead will influence consumption growth. In Norges Bank’s Expectations Survey for 2021 Q2, additional questions were asked of households about their saving behaviour. Half of the households responded that they have saved more than usual during the pandemic. The survey responses indicate that most house-holds plan to spend some of their additional savings (Chart 3.A). We assume that around a third of the additional increase in bank deposits through the pandemic will be spent on private consumption ahead, so that for a period the saving ratio will be below what we consider a normal level (Chart 3.5).
Both infection rates and Covid-related restrictions affect consumption The projections for households’ adjustments are based on a given path for infection rates and Covid-related restrictions, as discussed in the Special Feature on page 11. Restrictions and the transmission situation may affect consumption in various ways.
Chart 3.A Most people will spend some of their savingsA year from now, which of these statements will best describe your situation? Share of surveyed households. Percent
I have held most of the funds
I have saved during the pandemic
in a bank account
I have spent some of my savings,
but I still have a larger financial
buffer in my account
than prior to the pandemic
I have spent most of the funds
I have saved during the pandemic
0
10
20
30
40
50
60
0
10
20
30
40
50
60
Source: Ipsos
36
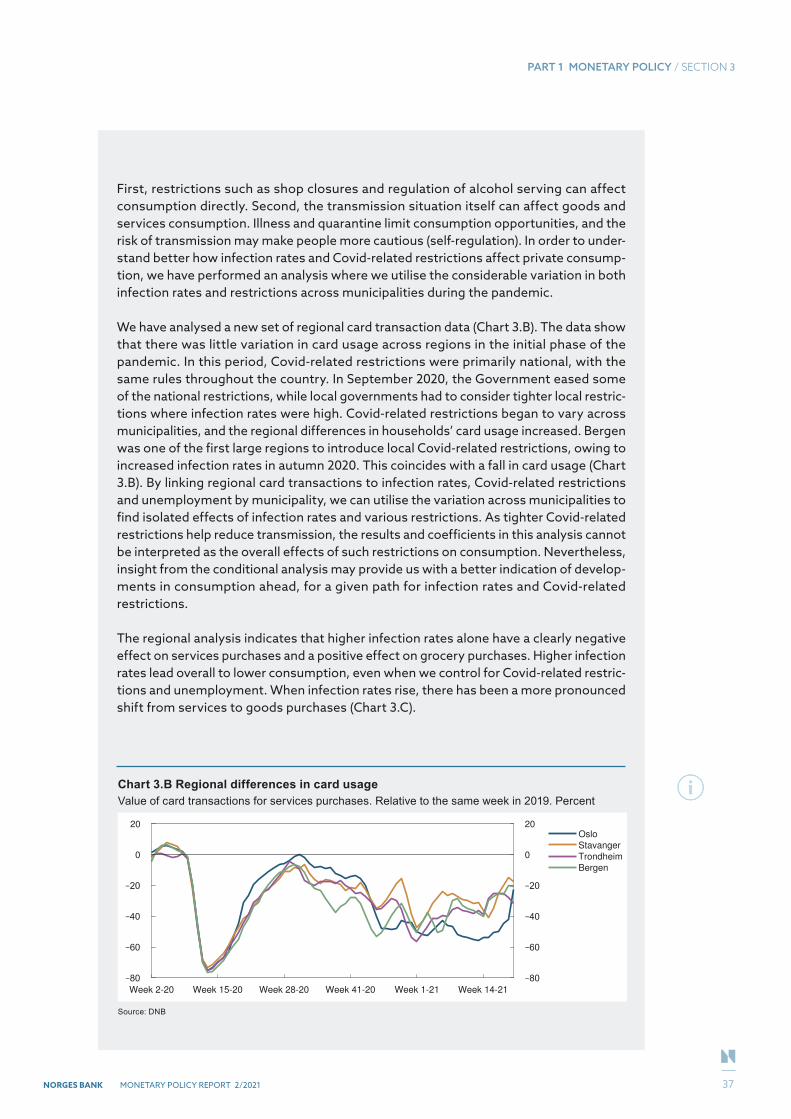
PART 1 MONETARY POLICY / SECTION 3
NORGES BANK MONETARY POLICY REPORT 2/2021
First, restrictions such as shop closures and regulation of alcohol serving can affect consumption directly. Second, the transmission situation itself can affect goods and services consumption. Illness and quarantine limit consumption opportunities, and the risk of transmission may make people more cautious (self-regulation). In order to under-stand better how infection rates and Covid-related restrictions affect private consump-tion, we have performed an analysis where we utilise the considerable variation in both infection rates and restrictions across municipalities during the pandemic.
We have analysed a new set of regional card transaction data (Chart 3.B). The data show that there was little variation in card usage across regions in the initial phase of the pandemic. In this period, Covid-related restrictions were primarily national, with the same rules throughout the country. In September 2020, the Government eased some of the national restrictions, while local governments had to consider tighter local restric-tions where infection rates were high. Covid-related restrictions began to vary across municipalities, and the regional differences in households’ card usage increased. Bergen was one of the first large regions to introduce local Covid-related restrictions, owing to increased infection rates in autumn 2020. This coincides with a fall in card usage (Chart 3.B). By linking regional card transactions to infection rates, Covid-related restrictions and unemployment by municipality, we can utilise the variation across municipalities to find isolated effects of infection rates and various restrictions. As tighter Covid-related restrictions help reduce transmission, the results and coefficients in this analysis cannot be interpreted as the overall effects of such restrictions on consumption. Nevertheless, insight from the conditional analysis may provide us with a better indication of develop-ments in consumption ahead, for a given path for infection rates and Covid-related restrictions.
The regional analysis indicates that higher infection rates alone have a clearly negative effect on services purchases and a positive effect on grocery purchases. Higher infection rates lead overall to lower consumption, even when we control for Covid-related restric-tions and unemployment. When infection rates rise, there has been a more pronounced shift from services to goods purchases (Chart 3.C).
Chart 3.B Regional differences in card usageValue of card transactions for services purchases. Relative to the same week in 2019. Percent
Week 2-20 Week 15-20 Week 28-20 Week 41-20 Week 1-21 Week 14-21
0
20
0
20Oslo
Stavanger
Trondheim
Bergen
Source: DNB
37
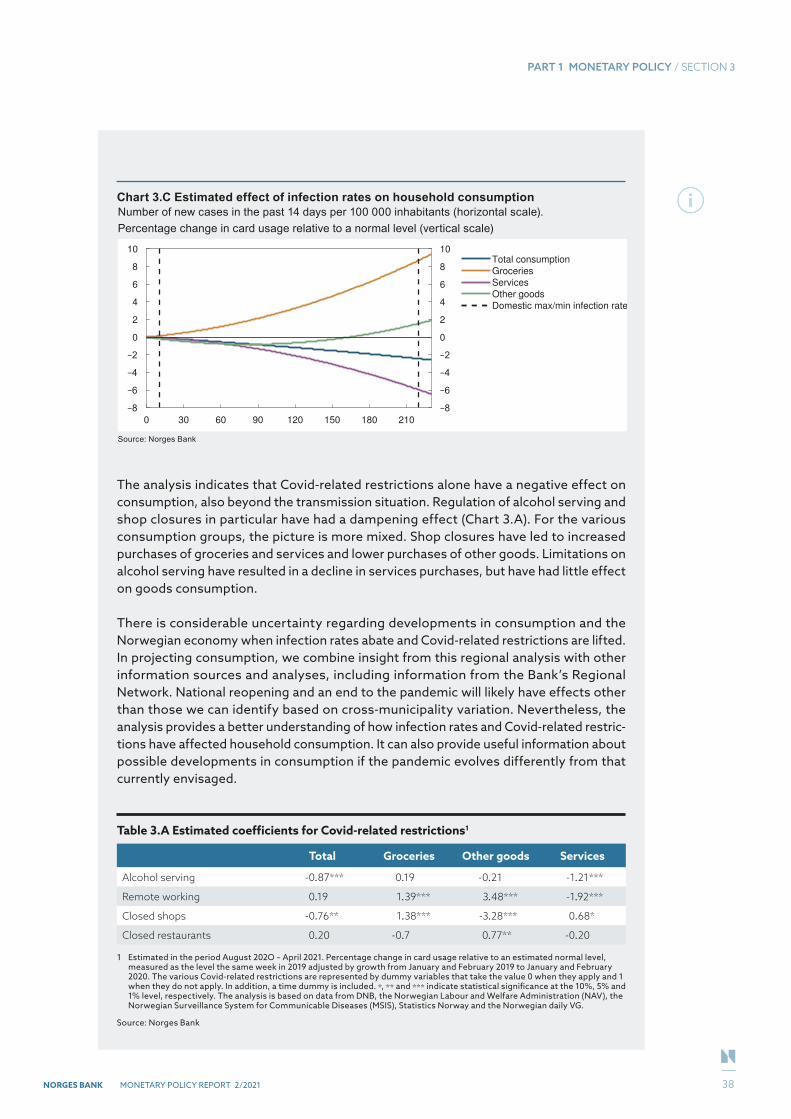
PART 1 MONETARY POLICY / SECTION 3
NORGES BANK MONETARY POLICY REPORT 2/2021
The analysis indicates that Covid-related restrictions alone have a negative effect on consumption, also beyond the transmission situation. Regulation of alcohol serving and shop closures in particular have had a dampening effect (Chart 3.A). For the various consumption groups, the picture is more mixed. Shop closures have led to increased purchases of groceries and services and lower purchases of other goods. Limitations on alcohol serving have resulted in a decline in services purchases, but have had little effect on goods consumption.
There is considerable uncertainty regarding developments in consumption and the Norwegian economy when infection rates abate and Covid-related restrictions are lifted. In projecting consumption, we combine insight from this regional analysis with other information sources and analyses, including information from the Bank’s Regional Network. National reopening and an end to the pandemic will likely have effects other than those we can identify based on cross-municipality variation. Nevertheless, the analysis provides a better understanding of how infection rates and Covid-related restric-tions have affected household consumption. It can also provide useful information about possible developments in consumption if the pandemic evolves differently from that currently envisaged.
Chart 3.C Estimated effect of infection rates on household consumptionNumber of new cases in the past 14 days per 100 000 inhabitants (horizontal scale).Percentage change in card usage relative to a normal level (vertical scale)
0 30 60 90 120 150 180 210
0
2
4
6
8
10
0
2
4
6
8
10Total consumption
Groceries
Services
Other goods
Domestic max/min infection rate
Source: Norges Bank
Table 3.A Estimated coefficients for Covid-related restrictions1
Total Groceries Other goods Services
Alcohol serving -0.87*** 0.19 -0.21 -1.21***
Remote working 0.19 1.39*** 3.48*** -1.92***
Closed shops -0.76** 1.38*** -3.28*** 0.68*
Closed restaurants 0.20 -0.7 0.77** -0.20
1 Estimated in the period August 202O – April 2021. Percentage change in card usage relative to an estimated normal level, measured as the level the same week in 2019 adjusted by growth from January and February 2019 to January and February 2020. The various Covid-related restrictions are represented by dummy variables that take the value 0 when they apply and 1 when they do not apply. In addition, a time dummy is included. *, ** and *** indicate statistical significance at the 10%, 5% and 1% level, respectively. The analysis is based on data from DNB, the Norwegian Labour and Welfare Administration (NAV), the Norwegian Surveillance System for Communicable Diseases (MSIS), Statistics Norway and the Norwegian daily VG.
Source: Norges Bank
38
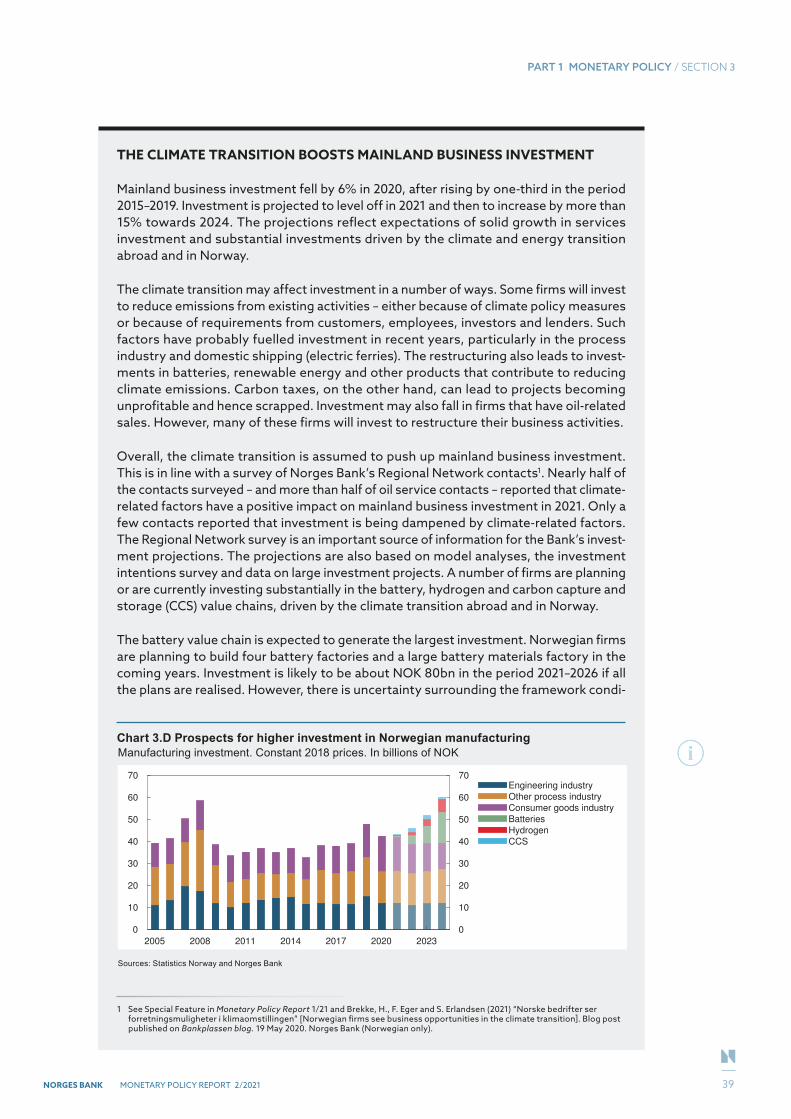
PART 1 MONETARY POLICY / SECTION 3
NORGES BANK MONETARY POLICY REPORT 2/2021
THE CLIMATE TRANSITION BOOSTS MAINLAND BUSINESS INVESTMENT
Mainland business investment fell by 6% in 2020, after rising by one-third in the period 2015–2019. Investment is projected to level off in 2021 and then to increase by more than 15% towards 2024. The projections reflect expectations of solid growth in services investment and substantial investments driven by the climate and energy transition abroad and in Norway.
The climate transition may affect investment in a number of ways. Some firms will invest to reduce emissions from existing activities – either because of climate policy measures or because of requirements from customers, employees, investors and lenders. Such factors have probably fuelled investment in recent years, particularly in the process industry and domestic shipping (electric ferries). The restructuring also leads to invest-ments in batteries, renewable energy and other products that contribute to reducing climate emissions. Carbon taxes, on the other hand, can lead to projects becoming unprofitable and hence scrapped. Investment may also fall in firms that have oil-related sales. However, many of these firms will invest to restructure their business activities.
Overall, the climate transition is assumed to push up mainland business investment. This is in line with a survey of Norges Bank’s Regional Network contacts1. Nearly half of the contacts surveyed – and more than half of oil service contacts – reported that climate-related factors have a positive impact on mainland business investment in 2021. Only a few contacts reported that investment is being dampened by climate-related factors. The Regional Network survey is an important source of information for the Bank’s invest-ment projections. The projections are also based on model analyses, the investment intentions survey and data on large investment projects. A number of firms are planning or are currently investing substantially in the battery, hydrogen and carbon capture and storage (CCS) value chains, driven by the climate transition abroad and in Norway.
The battery value chain is expected to generate the largest investment. Norwegian firms are planning to build four battery factories and a large battery materials factory in the coming years. Investment is likely to be about NOK 80bn in the period 2021–2026 if all the plans are realised. However, there is uncertainty surrounding the framework condi-
1 See Special Feature in Monetary Policy Report 1/21 and Brekke, H., F. Eger and S. Erlandsen (2021) “Norske bedrifter ser forretningsmuligheter i klimaomstillingen” [Norwegian firms see business opportunities in the climate transition]. Blog post published on Bankplassen blog. 19 May 2020. Norges Bank (Norwegian only).
Chart 3.D Prospects for higher investment in Norwegian manufacturingManufacturing investment. Constant 2018 prices. In billions of NOK
2005 2008 2011 2014 2017 2020 2023
0
10
20
30
40
50
60
70
0
10
20
30
40
50
60
70Engineering industry
Other process industry
Consumer goods industry
Batteries
Hydrogen
CCS
Sources: Statistics Norway and Norges Bank
39
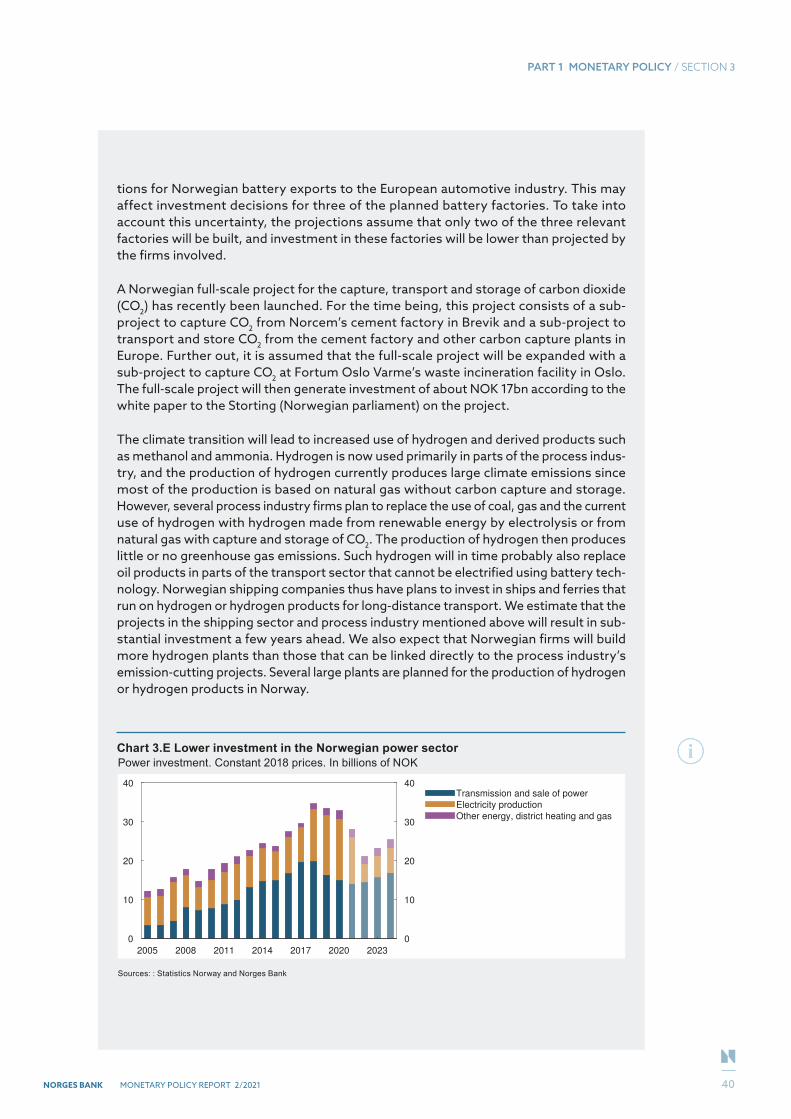
PART 1 MONETARY POLICY / SECTION 3
NORGES BANK MONETARY POLICY REPORT 2/2021
tions for Norwegian battery exports to the European automotive industry. This may affect investment decisions for three of the planned battery factories. To take into account this uncertainty, the projections assume that only two of the three relevant factories will be built, and investment in these factories will be lower than projected by the firms involved.
A Norwegian full-scale project for the capture, transport and storage of carbon dioxide (CO2) has recently been launched. For the time being, this project consists of a sub-project to capture CO2 from Norcem’s cement factory in Brevik and a sub-project to transport and store CO2 from the cement factory and other carbon capture plants in Europe. Further out, it is assumed that the full-scale project will be expanded with a sub-project to capture CO2 at Fortum Oslo Varme’s waste incineration facility in Oslo. The full-scale project will then generate investment of about NOK 17bn according to the white paper to the Storting (Norwegian parliament) on the project.
The climate transition will lead to increased use of hydrogen and derived products such as methanol and ammonia. Hydrogen is now used primarily in parts of the process indus-try, and the production of hydrogen currently produces large climate emissions since most of the production is based on natural gas without carbon capture and storage. However, several process industry firms plan to replace the use of coal, gas and the current use of hydrogen with hydrogen made from renewable energy by electrolysis or from natural gas with capture and storage of CO2. The production of hydrogen then produces little or no greenhouse gas emissions. Such hydrogen will in time probably also replace oil products in parts of the transport sector that cannot be electrified using battery tech-nology. Norwegian shipping companies thus have plans to invest in ships and ferries that run on hydrogen or hydrogen products for long-distance transport. We estimate that the projects in the shipping sector and process industry mentioned above will result in sub-stantial investment a few years ahead. We also expect that Norwegian firms will build more hydrogen plants than those that can be linked directly to the process industry’s emission-cutting projects. Several large plants are planned for the production of hydrogen or hydrogen products in Norway.
Chart 3.E Lower investment in the Norwegian power sectorPower investment. Constant 2018 prices. In billions of NOK
2005 2008 2011 2014 2017 2020 2023
0
10
20
30
40
0
10
20
30
40Transmission and sale of power
Electricity production
Other energy, district heating and gas
Sources: : Statistics Norway and Norges Bank
40
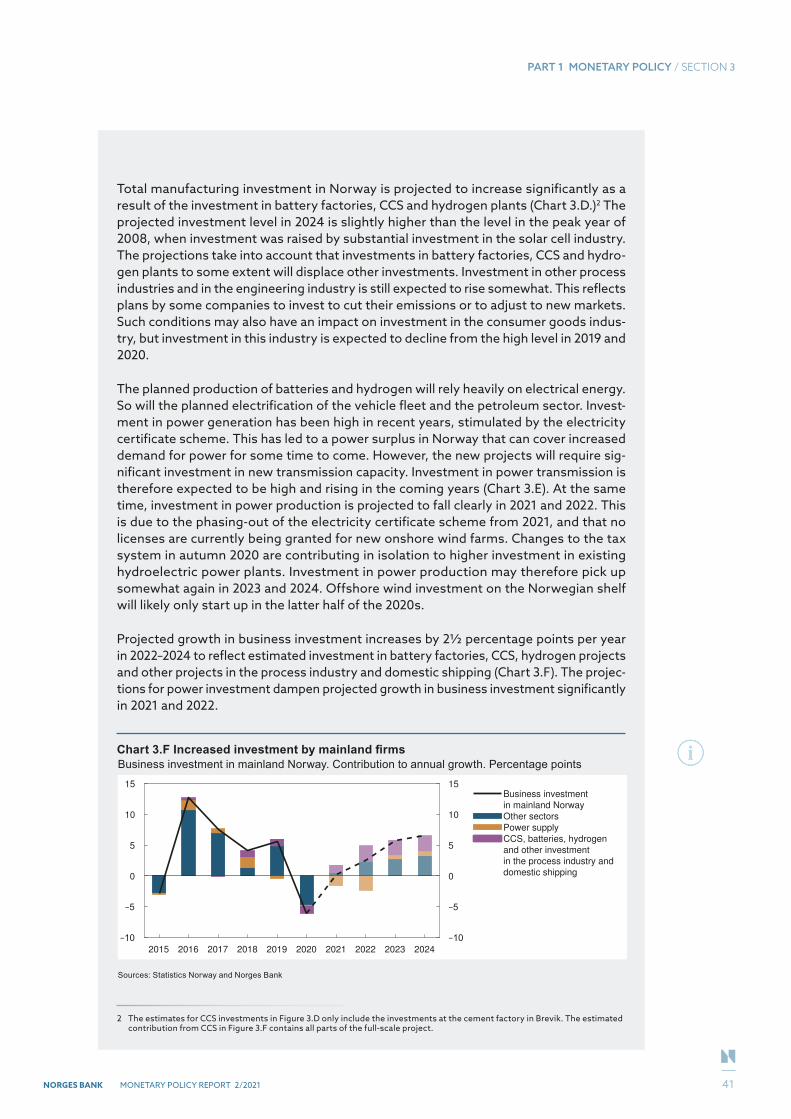
PART 1 MONETARY POLICY / SECTION 3
NORGES BANK MONETARY POLICY REPORT 2/2021
Total manufacturing investment in Norway is projected to increase significantly as a result of the investment in battery factories, CCS and hydrogen plants (Chart 3.D.)2 The projected investment level in 2024 is slightly higher than the level in the peak year of 2008, when investment was raised by substantial investment in the solar cell industry. The projections take into account that investments in battery factories, CCS and hydro-gen plants to some extent will displace other investments. Investment in other process industries and in the engineering industry is still expected to rise somewhat. This reflects plans by some companies to invest to cut their emissions or to adjust to new markets. Such conditions may also have an impact on investment in the consumer goods indus-try, but investment in this industry is expected to decline from the high level in 2019 and 2020.
The planned production of batteries and hydrogen will rely heavily on electrical energy. So will the planned electrification of the vehicle fleet and the petroleum sector. Invest-ment in power generation has been high in recent years, stimulated by the electricity certificate scheme. This has led to a power surplus in Norway that can cover increased demand for power for some time to come. However, the new projects will require sig-nificant investment in new transmission capacity. Investment in power transmission is therefore expected to be high and rising in the coming years (Chart 3.E). At the same time, investment in power production is projected to fall clearly in 2021 and 2022. This is due to the phasing-out of the electricity certificate scheme from 2021, and that no licenses are currently being granted for new onshore wind farms. Changes to the tax system in autumn 2020 are contributing in isolation to higher investment in existing hydroelectric power plants. Investment in power production may therefore pick up somewhat again in 2023 and 2024. Offshore wind investment on the Norwegian shelf will likely only start up in the latter half of the 2020s.
Projected growth in business investment increases by 2½ percentage points per year in 2022–2024 to reflect estimated investment in battery factories, CCS, hydrogen projects and other projects in the process industry and domestic shipping (Chart 3.F). The projec-tions for power investment dampen projected growth in business investment significantly in 2021 and 2022.
2 The estimates for CCS investments in Figure 3.D only include the investments at the cement factory in Brevik. The estimated contribution from CCS in Figure 3.F contains all parts of the full-scale project.
Chart 3.F Increased investment by mainland firmsBusiness investment in mainland Norway. Contribution to annual growth. Percentage points
2015 2016 2017 2018 2019 2020 2021 2022 2023 2024
0
5
10
15
0
5
10
15Business investment
in mainland Norway
Other sectors
Power supply
CCS, batteries, hydrogen
and other investment
in the process industry and
domestic shipping
Sources: Statistics Norway and Norges Bank
41
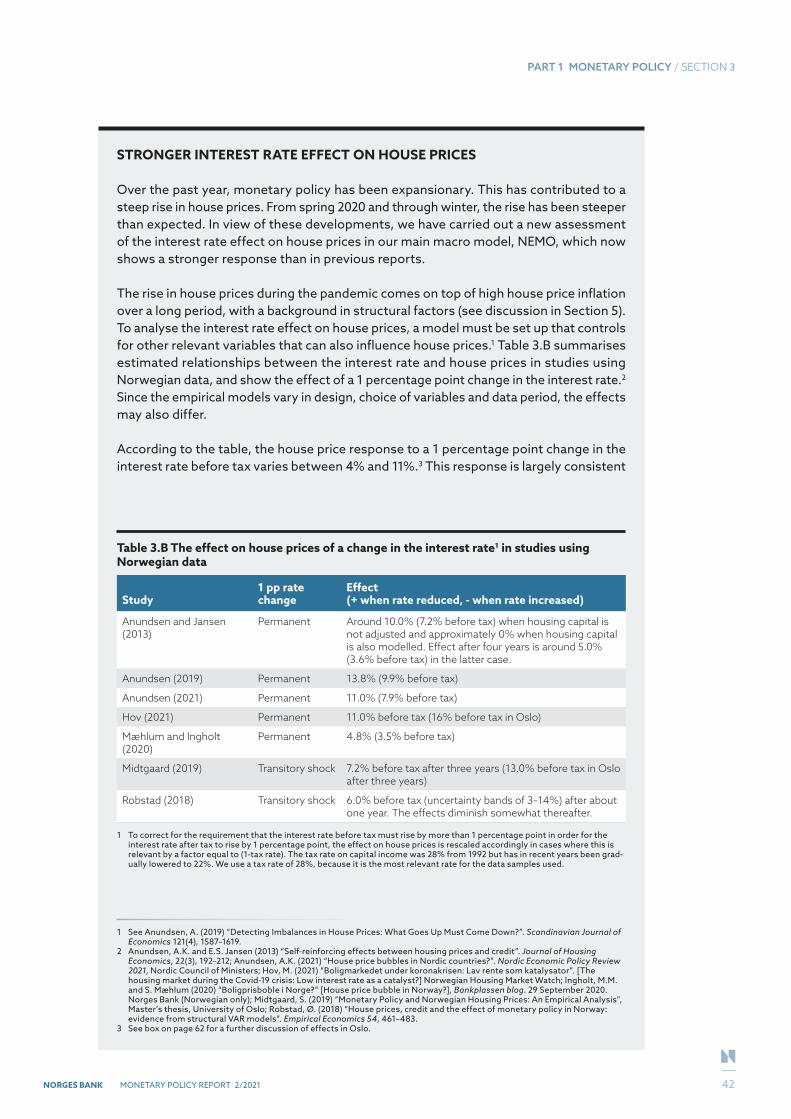
PART 1 MONETARY POLICY / SECTION 3
NORGES BANK MONETARY POLICY REPORT 2/2021
STRONGER INTEREST RATE EFFECT ON HOUSE PRICES
Over the past year, monetary policy has been expansionary. This has contributed to a steep rise in house prices. From spring 2020 and through winter, the rise has been steeper than expected. In view of these developments, we have carried out a new assessment of the interest rate effect on house prices in our main macro model, NEMO, which now shows a stronger response than in previous reports.
The rise in house prices during the pandemic comes on top of high house price inflation over a long period, with a background in structural factors (see discussion in Section 5). To analyse the interest rate effect on house prices, a model must be set up that controls for other relevant variables that can also influence house prices.1 Table 3.B summarises estimated relationships between the interest rate and house prices in studies using Norwegian data, and show the effect of a 1 percentage point change in the interest rate.2 Since the empirical models vary in design, choice of variables and data period, the effects may also differ.
According to the table, the house price response to a 1 percentage point change in the interest rate before tax varies between 4% and 11%.3 This response is largely consistent
1 See Anundsen, A. (2019) “Detecting Imbalances in House Prices: What Goes Up Must Come Down?”. Scandinavian Journal of Economics 121(4), 1587–1619.
2 Anundsen, A.K. and E.S. Jansen (2013) “Self-reinforcing effects between housing prices and credit”. Journal of Housing Economics, 22(3), 192–212; Anundsen, A.K. (2021) “House price bubbles in Nordic countries?”. Nordic Economic Policy Review 2021, Nordic Council of Ministers; Hov, M. (2021) “Boligmarkedet under koronakrisen: Lav rente som katalysator”. [The housing market during the Covid-19 crisis: Low interest rate as a catalyst?] Norwegian Housing Market Watch; Ingholt, M.M. and S. Mæhlum (2020) “Boligprisboble i Norge?” [House price bubble in Norway?], Bankplassen blog. 29 September 2020. Norges Bank (Norwegian only); Midtgaard, S. (2019) “Monetary Policy and Norwegian Housing Prices: An Empirical Analysis”, Master’s thesis, University of Oslo; Robstad, Ø. (2018) “House prices, credit and the effect of monetary policy in Norway: evidence from structural VAR models”. Empirical Economics 54, 461–483.
3 See box on page 62 for a further discussion of effects in Oslo.
Table 3.B The effect on house prices of a change in the interest rate1 in studies using Norwegian data
Study1 pp rate change
Effect (+ when rate reduced, - when rate increased)
Anundsen and Jansen (2013)
Permanent Around 10.0% (7.2% before tax) when housing capital is not adjusted and approximately 0% when housing capital is also modelled. Effect after four years is around 5.0% (3.6% before tax) in the latter case.
Anundsen (2019) Permanent 13.8% (9.9% before tax)
Anundsen (2021) Permanent 11.0% (7.9% before tax)
Hov (2021) Permanent 11.0% before tax (16% before tax in Oslo)
Mæhlum and Ingholt (2020)
Permanent 4.8% (3.5% before tax)
Midtgaard (2019) Transitory shock 7.2% before tax after three years (13.0% before tax in Oslo after three years)
Robstad (2018) Transitory shock 6.0% before tax (uncertainty bands of 3–14%) after about one year. The effects diminish somewhat thereafter.
1 To correct for the requirement that the interest rate before tax must rise by more than 1 percentage point in order for the interest rate after tax to rise by 1 percentage point, the effect on house prices is rescaled accordingly in cases where this is relevant by a factor equal to (1-tax rate). The tax rate on capital income was 28% from 1992 but has in recent years been grad-ually lowered to 22%. We use a tax rate of 28%, because it is the most relevant rate for the data samples used.
42
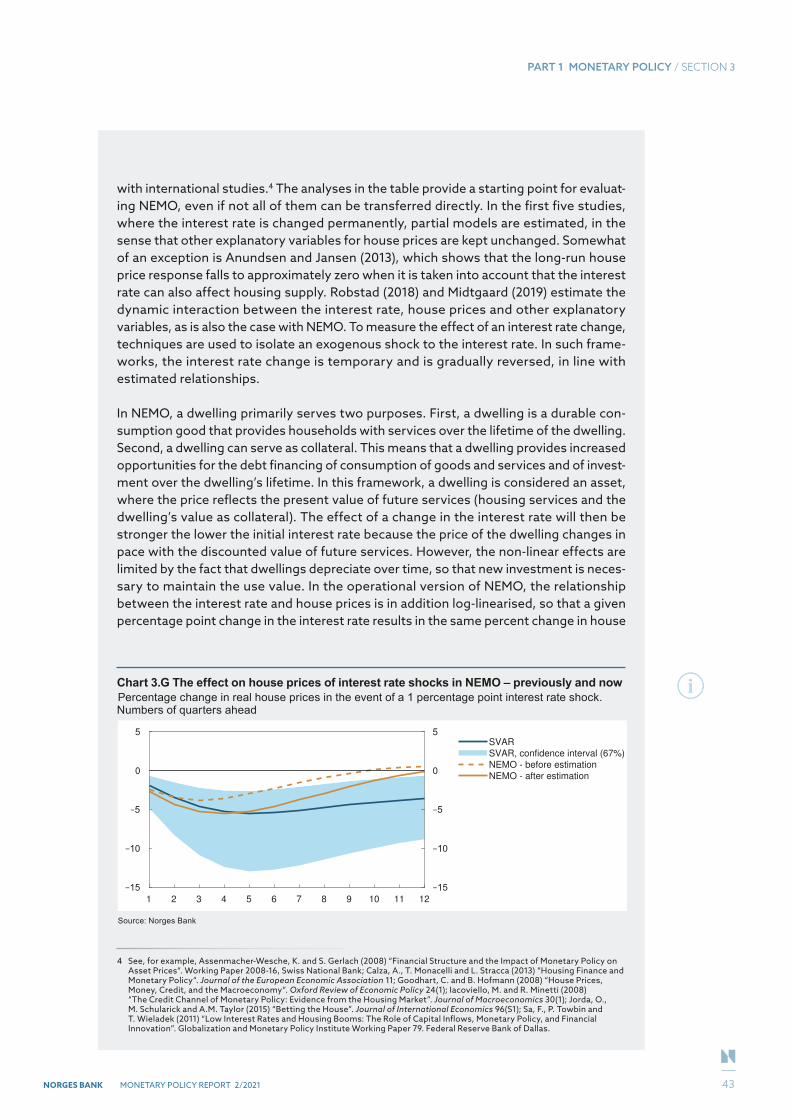
PART 1 MONETARY POLICY / SECTION 3
NORGES BANK MONETARY POLICY REPORT 2/2021
with international studies.4 The analyses in the table provide a starting point for evaluat-ing NEMO, even if not all of them can be transferred directly. In the first five studies, where the interest rate is changed permanently, partial models are estimated, in the sense that other explanatory variables for house prices are kept unchanged. Somewhat of an exception is Anundsen and Jansen (2013), which shows that the long-run house price response falls to approximately zero when it is taken into account that the interest rate can also affect housing supply. Robstad (2018) and Midtgaard (2019) estimate the dynamic interaction between the interest rate, house prices and other explanatory variables, as is also the case with NEMO. To measure the effect of an interest rate change, techniques are used to isolate an exogenous shock to the interest rate. In such frame-works, the interest rate change is temporary and is gradually reversed, in line with estimated relationships.
In NEMO, a dwelling primarily serves two purposes. First, a dwelling is a durable con-sumption good that provides households with services over the lifetime of the dwelling. Second, a dwelling can serve as collateral. This means that a dwelling provides increased opportunities for the debt financing of consumption of goods and services and of invest-ment over the dwelling’s lifetime. In this framework, a dwelling is considered an asset, where the price reflects the present value of future services (housing services and the dwelling’s value as collateral). The effect of a change in the interest rate will then be stronger the lower the initial interest rate because the price of the dwelling changes in pace with the discounted value of future services. However, the non-linear effects are limited by the fact that dwellings depreciate over time, so that new investment is neces-sary to maintain the use value. In the operational version of NEMO, the relationship between the interest rate and house prices is in addition log-linearised, so that a given percentage point change in the interest rate results in the same percent change in house
4 See, for example, Assenmacher-Wesche, K. and S. Gerlach (2008) “Financial Structure and the Impact of Monetary Policy on Asset Prices“. Working Paper 2008-16, Swiss National Bank; Calza, A., T. Monacelli and L. Stracca (2013) “Housing Finance and Monetary Policy“. Journal of the European Economic Association 11; Goodhart, C. and B. Hofmann (2008) “House Prices, Money, Credit, and the Macroeconomy“. Oxford Review of Economic Policy 24(1); Iacoviello, M. and R. Minetti (2008) “The Credit Channel of Monetary Policy: Evidence from the Housing Market”. Journal of Macroeconomics 30(1); Jorda, O., M. Schularick and A.M. Taylor (2015) “Betting the House”. Journal of International Economics 96(S1); Sa, F., P. Towbin and T. Wieladek (2011) “Low Interest Rates and Housing Booms: The Role of Capital Inflows, Monetary Policy, and Financial Innovation”. Globalization and Monetary Policy Institute Working Paper 79. Federal Reserve Bank of Dallas.
Chart 3.G The effect on house prices of interest rate shocks in NEMO – previously and nowPercentage change in real house prices in the event of a 1 percentage point interest rate shock. Numbers of quarters ahead
1 2 3 4 5 6 7 8 9 10 11 12
0
5
0
5
SVAR
SVAR, confidence interval (67%)
NEMO - before estimation
NEMO - after estimation
Source: Norges Bank
43
PART 1 MONETARY POLICY / SECTION 3
NORGES BANK MONETARY POLICY REPORT 2/2021
prices irrespective of the level of the interest rate at the outset. This is done primarily to be able to solve and estimate the model, but such lineralisation appears to yield effects that correspond fairly well with the data.
In addition to the fact that the interest rate affects house prices through the two above-mentioned channels, households’ expectations of future house prices are partly adaptive in NEMO. This means that to a certain extent, households believe that house prices will continue to rise (fall), if they have risen (fallen) for a period. This makes house price increases and falls partly self-reinforcing.
To re-estimate the effect of an interest rate change on house prices in NEMO, we follow the same approach as in Kravik and Mimir (2019).5 The model is estimated using Bayesian techniques, and we use data for the period 2001–2019. In order to have a cross-check for NEMO that is as up-to-date and comparable as possible, we have re-estimated a variant of the SVAR model in Robstad (2018), which includes data for the period 1994–2019.6
Chart 3.G shows the results. The blue line shows the effect of a monetary policy shock in the SVAR model (median), while the light blue area shows an uncertainty interval for the response in the SVAR model. The yellow lines show the effect of a monetary policy shock in NEMO, prior to (broken) and after re-estimation (solid). The chart shows that the response to an interest rate change has become stronger with the new estimation of NEMO and that it follows the SVAR in the first two years to a greater degree. We give less weight to matching the SVAR response further out in time, since the model uncer-tainty is generally greater further out. NEMO therefore produces a gradual return of the real house price level after the temporary shock to the policy rate. Compared with many of the responses in the table, the response in NEMO lies in the lower portion of the range. Nevertheless, the studies in the table support that the response in NEMO is reasonable. This is because house prices change gradually, from one equilibrium to another, when the interest rate is changed permanently in some of the models in the table. High per-manent interest rate responses, around 10%, are therefore not directly comparable with a temporary interest rate change in NEMO.
The new estimation of NEMO entails a change in the strength of some mechanisms. First, the degree of “habit formation” in consumption of housing services (via changes in parameters affecting preferences) is reduced, which results in a faster impact on house prices. Second, households have become more backward-looking in their house price expectations (more adaptive expectations). This implies greater self-reinforcing effects for house prices.
The effect of the change in the modelling system is that shocks resulting in a higher interest rate will result in a more pronounced fall in real house prices in NEMO than previously. Conversely, shocks resulting in a lower interest rate will lead to a more pro-nounced rise in real house prices in NEMO. On the other hand, monetary policy, as modelled in NEMO, may more effectively counteract housing market shocks that affect the attainment of monetary policy objectives.
5 Kravik, E. and Y. Mimir (2019) “Navigating with NEMO”. Norges Bank Staff Memo, 5/2019.6 The SVAR model from Robstad (2018) has been adjusted slightly to make the model as comparable as possible with NEMO.
Credit has been replaced with housing investment, and the model is estimated with data in levels. In order to identify the monetary policy shock, sign restrictions have been used. The changes in the model have little impact on the effect of a monetary policy shock.
44
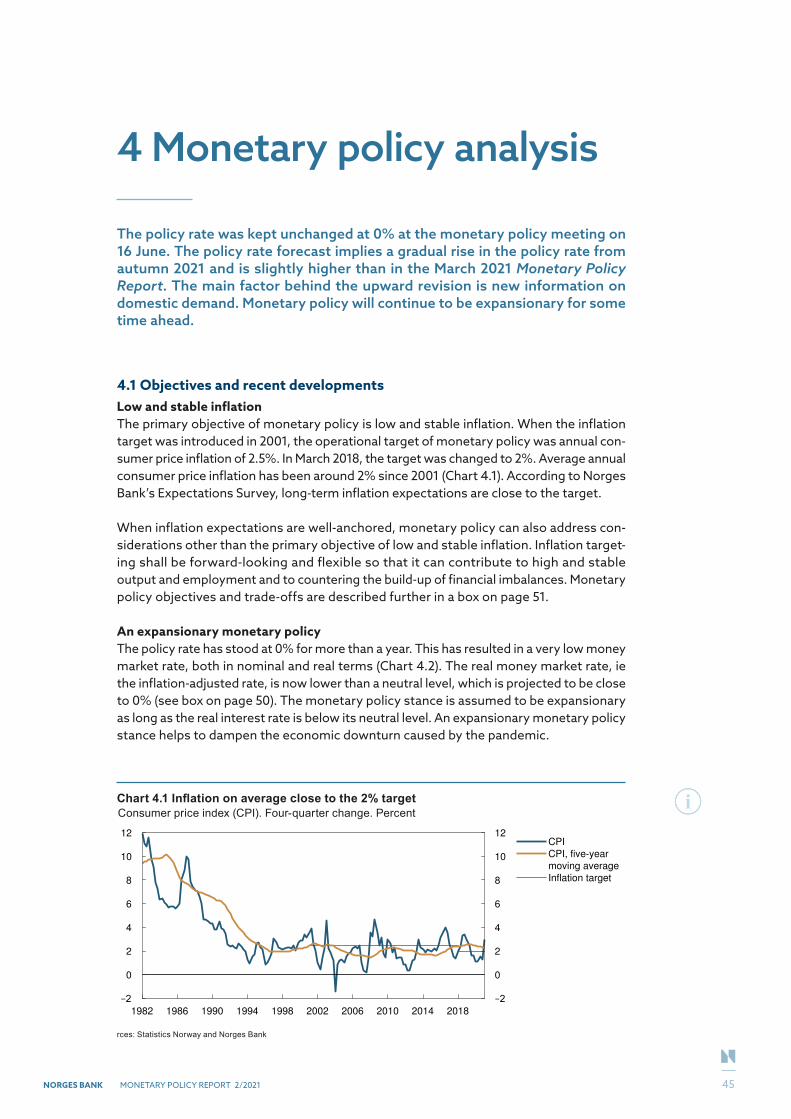
NORGES BANK MONETARY POLICY REPORT 2/2021
4 Monetary policy analysis
The policy rate was kept unchanged at 0% at the monetary policy meeting on 16 June. The policy rate forecast implies a gradual rise in the policy rate from autumn 2021 and is slightly higher than in the March 2021 Monetary Policy Report. The main factor behind the upward revision is new information on domestic demand. Monetary policy will continue to be expansionary for some time ahead.
4.1 Objectives and recent developmentsLow and stable inflationThe primary objective of monetary policy is low and stable inflation. When the inflation target was introduced in 2001, the operational target of monetary policy was annual con-sumer price inflation of 2.5%. In March 2018, the target was changed to 2%. Average annual consumer price inflation has been around 2% since 2001 (Chart 4.1). According to Norges Bank’s Expectations Survey, long-term inflation expectations are close to the target.
When inflation expectations are well-anchored, monetary policy can also address con-siderations other than the primary objective of low and stable inflation. Inflation target-ing shall be forward-looking and flexible so that it can contribute to high and stable output and employment and to countering the build-up of financial imbalances. Monetary policy objectives and trade-offs are described further in a box on page 51.
An expansionary monetary policyThe policy rate has stood at 0% for more than a year. This has resulted in a very low money market rate, both in nominal and real terms (Chart 4.2). The real money market rate, ie the inflation-adjusted rate, is now lower than a neutral level, which is projected to be close to 0% (see box on page 50). The monetary policy stance is assumed to be expansionary as long as the real interest rate is below its neutral level. An expansionary monetary policy stance helps to dampen the economic downturn caused by the pandemic.
Chart 4.1 Inflation on average close to the 2% targetConsumer price index (CPI). Four-quarter change. Percent
Sou
1982 1986 1990 1994 1998 2002 2006 2010 2014 2018
0
2
4
6
8
10
12
0
2
4
6
8
10
12CPI
CPI, five-year
moving average
Inflation target
rces: Statistics Norway and Norges Bank
45
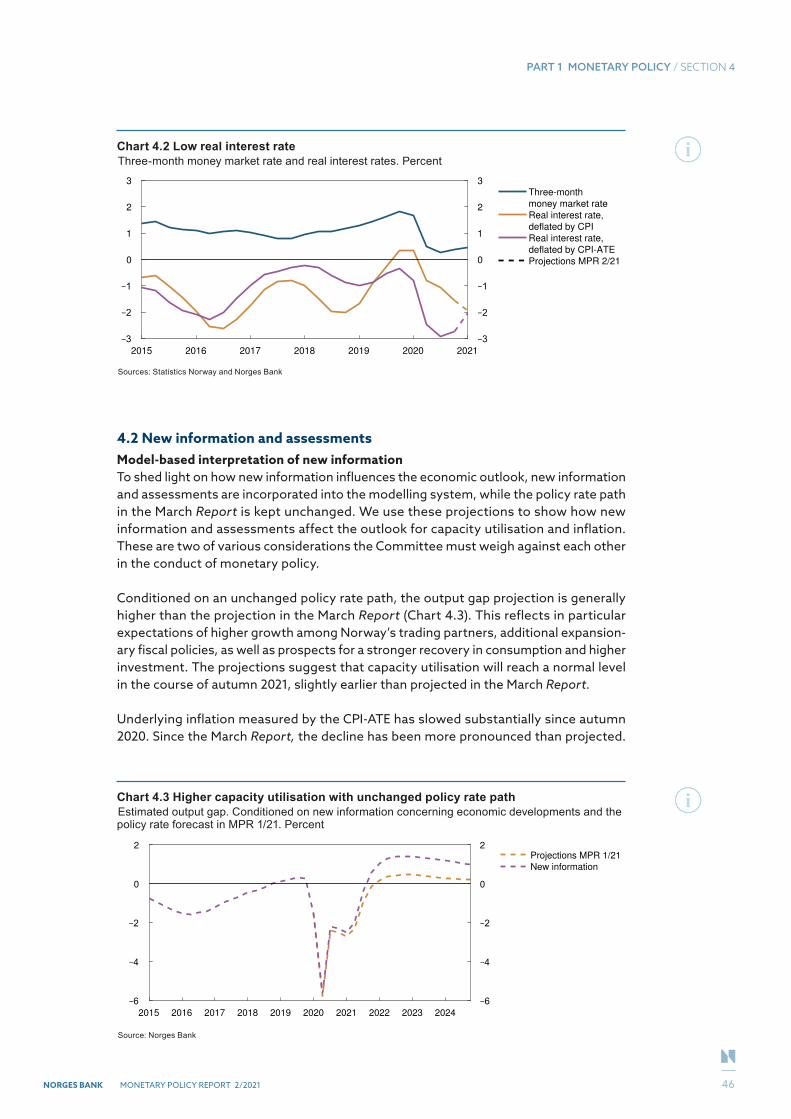
PART 1 MONETARY POLICY / SECTION 4
NORGES BANK MONETARY POLICY REPORT 2/2021
4.2 New information and assessmentsModel-based interpretation of new informationTo shed light on how new information influences the economic outlook, new information and assessments are incorporated into the modelling system, while the policy rate path in the March Report is kept unchanged. We use these projections to show how new information and assessments affect the outlook for capacity utilisation and inflation. These are two of various considerations the Committee must weigh against each other in the conduct of monetary policy.
Conditioned on an unchanged policy rate path, the output gap projection is generally higher than the projection in the March Report (Chart 4.3). This reflects in particular expectations of higher growth among Norway’s trading partners, additional expansion-ary fiscal policies, as well as prospects for a stronger recovery in consumption and higher investment. The projections suggest that capacity utilisation will reach a normal level in the course of autumn 2021, slightly earlier than projected in the March Report.
Underlying inflation measured by the CPI-ATE has slowed substantially since autumn 2020. Since the March Report, the decline has been more pronounced than projected.
Chart 4.2 Low real interest rateThree-month money market rate and real interest rates. Percent
2015 2016 2017 2018 2019 2020 2021
0
1
2
3
0
1
2
3Three-month
money market rate
Real interest rate,
deflated by CPI
Real interest rate,
deflated by CPI-ATE
Projections MPR 2/21
Sources: Statistics Norway and Norges Bank
Chart 4.3 Higher capacity utilisation with unchanged policy rate pathEstimated output gap. Conditioned on new information concerning economic developments and the policy rate forecast in MPR 1/21. Percent
2015 2016 2017 2018 2019 2020 2021 2022 2023 2024
0
2
0
2Projections MPR 1/21
New information
Source: Norges Bank
46
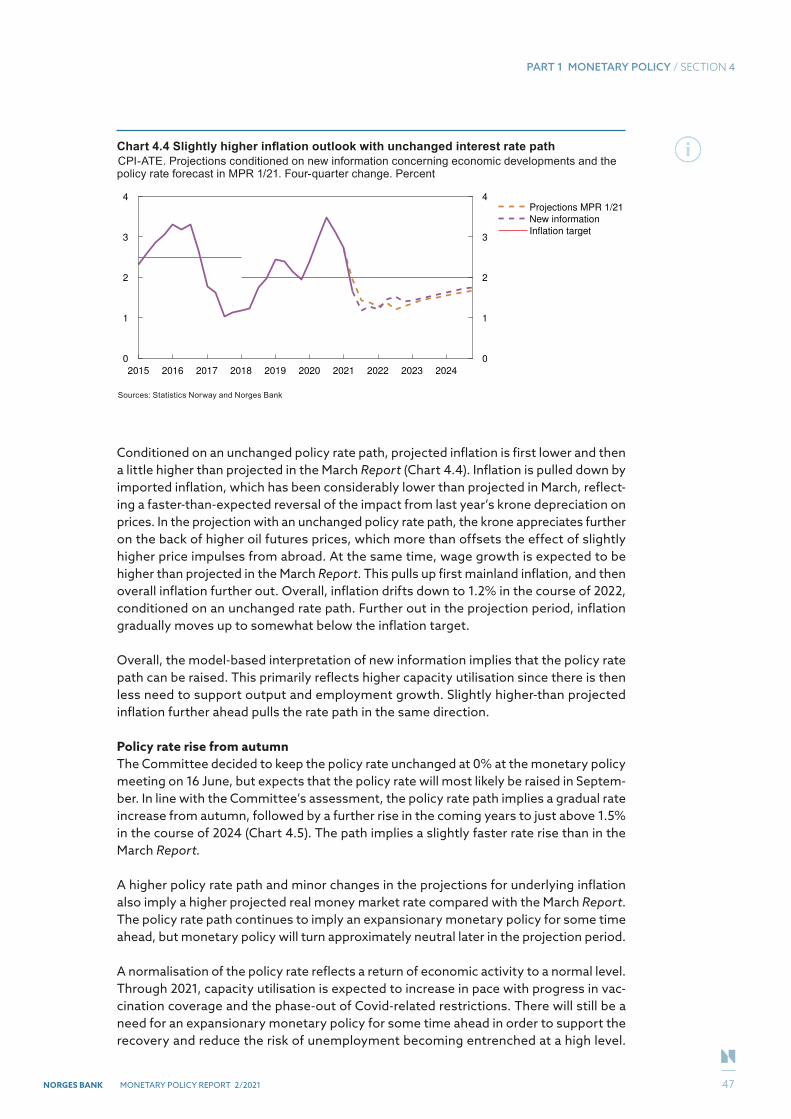
PART 1 MONETARY POLICY / SECTION 4
NORGES BANK MONETARY POLICY REPORT 2/2021
Conditioned on an unchanged policy rate path, projected inflation is first lower and then a little higher than projected in the March Report (Chart 4.4). Inflation is pulled down by imported inflation, which has been considerably lower than projected in March, reflect-ing a faster-than-expected reversal of the impact from last year’s krone depreciation on prices. In the projection with an unchanged policy rate path, the krone appreciates further on the back of higher oil futures prices, which more than offsets the effect of slightly higher price impulses from abroad. At the same time, wage growth is expected to be higher than projected in the March Report. This pulls up first mainland inflation, and then overall inflation further out. Overall, inflation drifts down to 1.2% in the course of 2022, conditioned on an unchanged rate path. Further out in the projection period, inflation gradually moves up to somewhat below the inflation target.
Overall, the model-based interpretation of new information implies that the policy rate path can be raised. This primarily reflects higher capacity utilisation since there is then less need to support output and employment growth. Slightly higher-than projected inflation further ahead pulls the rate path in the same direction.
Policy rate rise from autumnThe Committee decided to keep the policy rate unchanged at 0% at the monetary policy meeting on 16 June, but expects that the policy rate will most likely be raised in Septem-ber. In line with the Committee’s assessment, the policy rate path implies a gradual rate increase from autumn, followed by a further rise in the coming years to just above 1.5% in the course of 2024 (Chart 4.5). The path implies a slightly faster rate rise than in the March Report.
A higher policy rate path and minor changes in the projections for underlying inflation also imply a higher projected real money market rate compared with the March Report. The policy rate path continues to imply an expansionary monetary policy for some time ahead, but monetary policy will turn approximately neutral later in the projection period.
A normalisation of the policy rate reflects a return of economic activity to a normal level. Through 2021, capacity utilisation is expected to increase in pace with progress in vac-cination coverage and the phase-out of Covid-related restrictions. There will still be a need for an expansionary monetary policy for some time ahead in order to support the recovery and reduce the risk of unemployment becoming entrenched at a high level.
Chart 4.4 Slightly higher inflation outlook with unchanged interest rate pathCPI-ATE. Projections conditioned on new information concerning economic developments and the policy rate forecast in MPR 1/21. Four-quarter change. Percent
2015 2016 2017 2018 2019 2020 2021 2022 2023 2024
0
1
2
3
4
0
1
2
3
4Projections MPR 1/21
New information
Inflation target
Sources: Statistics Norway and Norges Bank
47
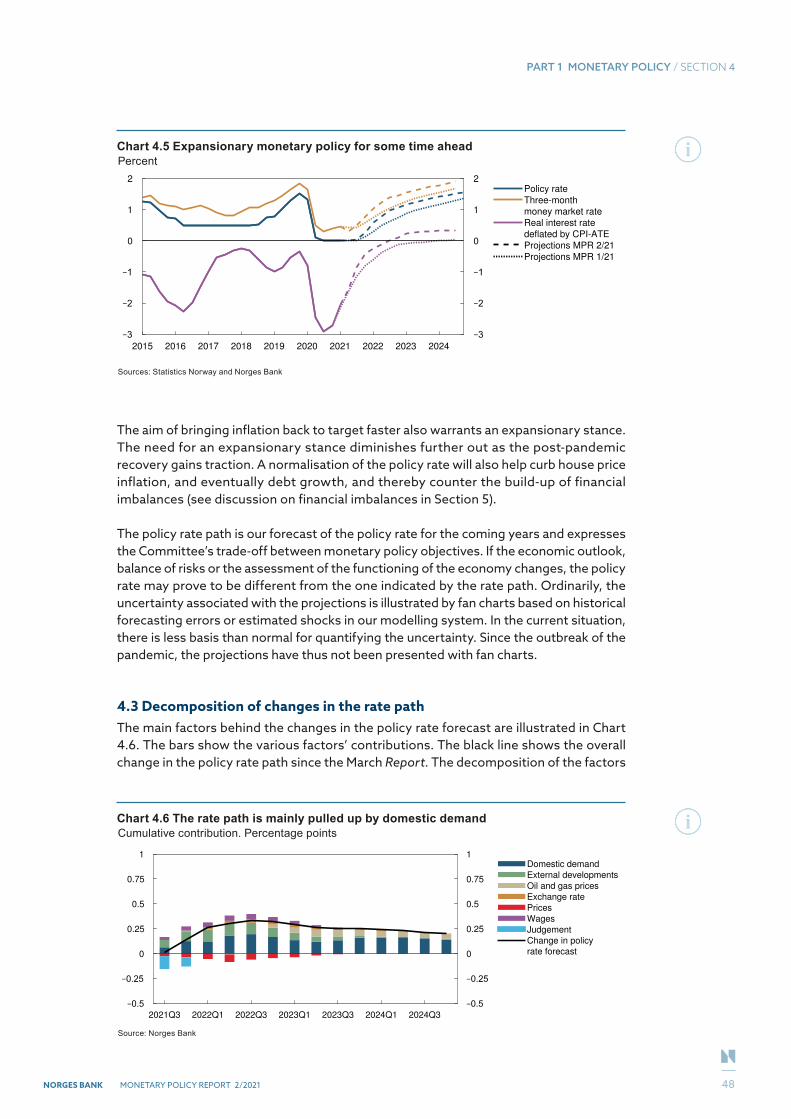
PART 1 MONETARY POLICY / SECTION 4
NORGES BANK MONETARY POLICY REPORT 2/2021
The aim of bringing inflation back to target faster also warrants an expansionary stance. The need for an expansionary stance diminishes further out as the post-pandemic recovery gains traction. A normalisation of the policy rate will also help curb house price inflation, and eventually debt growth, and thereby counter the build-up of financial imbalances (see discussion on financial imbalances in Section 5).
The policy rate path is our forecast of the policy rate for the coming years and expresses the Committee’s trade-off between monetary policy objectives. If the economic outlook, balance of risks or the assessment of the functioning of the economy changes, the policy rate may prove to be different from the one indicated by the rate path. Ordinarily, the uncertainty associated with the projections is illustrated by fan charts based on historical forecasting errors or estimated shocks in our modelling system. In the current situation, there is less basis than normal for quantifying the uncertainty. Since the outbreak of the pandemic, the projections have thus not been presented with fan charts.
4.3 Decomposition of changes in the rate pathThe main factors behind the changes in the policy rate forecast are illustrated in Chart 4.6. The bars show the various factors’ contributions. The black line shows the overall change in the policy rate path since the March Report. The decomposition of the factors
Chart 4.5 Expansionary monetary policy for some time aheadPercent
2015 2016 2017 2018 2019 2020 2021 2022 2023 2024
0
1
2
0
1
2Policy rate
Three-month
money market rate
Real interest rate
deflated by CPI-ATE
Projections MPR 2/21
Projections MPR 1/21
Sources: Statistics Norway and Norges Bank
Chart 4.6 The rate path is mainly pulled up by domestic demandCumulative contribution. Percentage points
2021Q3 2022Q1 2022Q3 2023Q1 2023Q3 2024Q1 2024Q3
0
0.25
0.5
0.75
1
0
0.25
0.5
0.75
1Domestic demand
External developments
Oil and gas prices
Exchange rate
Prices
Wages
Judgement
Change in policy
rate forecast
Source: Norges Bank
48
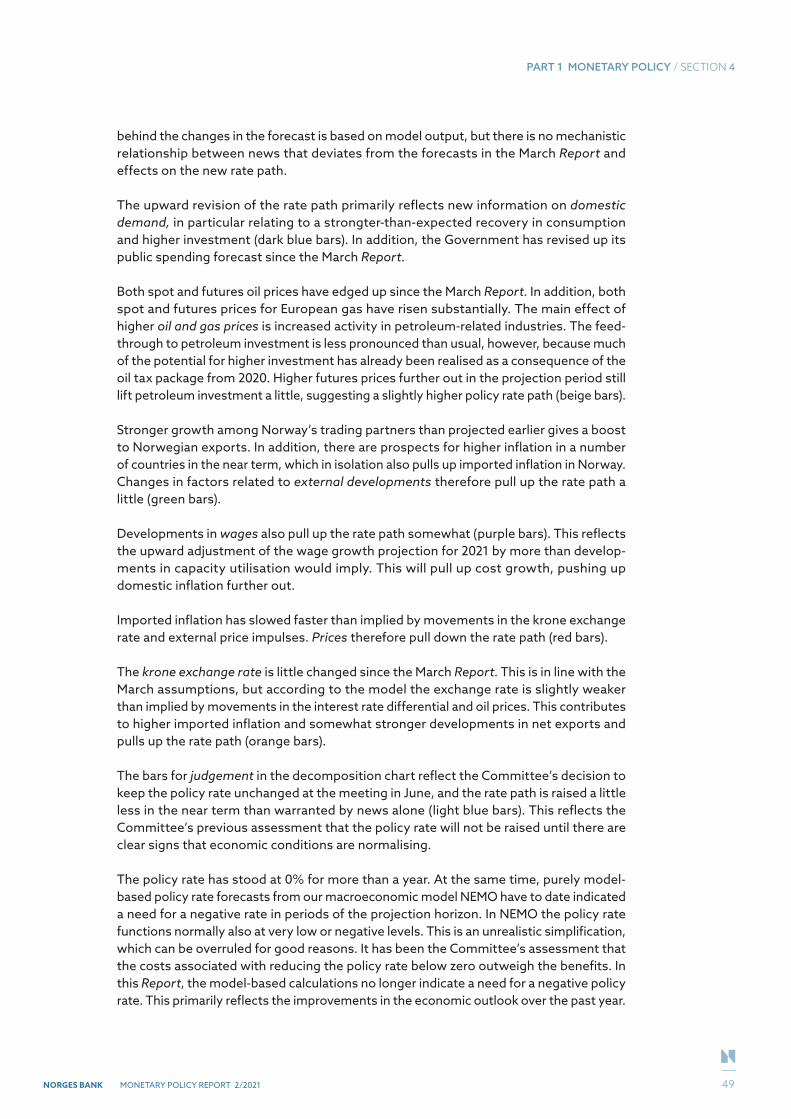
PART 1 MONETARY POLICY / SECTION 4
NORGES BANK MONETARY POLICY REPORT 2/2021
behind the changes in the forecast is based on model output, but there is no mechanistic relationship between news that deviates from the forecasts in the March Report and effects on the new rate path.
The upward revision of the rate path primarily reflects new information on domestic demand, in particular relating to a strongter-than-expected recovery in consumption and higher investment (dark blue bars). In addition, the Government has revised up its public spending forecast since the March Report.
Both spot and futures oil prices have edged up since the March Report. In addition, both spot and futures prices for European gas have risen substantially. The main effect of higher oil and gas prices is increased activity in petroleum-related industries. The feed-through to petroleum investment is less pronounced than usual, however, because much of the potential for higher investment has already been realised as a consequence of the oil tax package from 2020. Higher futures prices further out in the projection period still lift petroleum investment a little, suggesting a slightly higher policy rate path (beige bars).
Stronger growth among Norway’s trading partners than projected earlier gives a boost to Norwegian exports. In addition, there are prospects for higher inflation in a number of countries in the near term, which in isolation also pulls up imported inflation in Norway. Changes in factors related to external developments therefore pull up the rate path a little (green bars).
Developments in wages also pull up the rate path somewhat (purple bars). This reflects the upward adjustment of the wage growth projection for 2021 by more than develop-ments in capacity utilisation would imply. This will pull up cost growth, pushing up domestic inflation further out.
Imported inflation has slowed faster than implied by movements in the krone exchange rate and external price impulses. Prices therefore pull down the rate path (red bars).
The krone exchange rate is little changed since the March Report. This is in line with the March assumptions, but according to the model the exchange rate is slightly weaker than implied by movements in the interest rate differential and oil prices. This contributes to higher imported inflation and somewhat stronger developments in net exports and pulls up the rate path (orange bars).
The bars for judgement in the decomposition chart reflect the Committee’s decision to keep the policy rate unchanged at the meeting in June, and the rate path is raised a little less in the near term than warranted by news alone (light blue bars). This reflects the Committee’s previous assessment that the policy rate will not be raised until there are clear signs that economic conditions are normalising.
The policy rate has stood at 0% for more than a year. At the same time, purely model-based policy rate forecasts from our macroeconomic model NEMO have to date indicated a need for a negative rate in periods of the projection horizon. In NEMO the policy rate functions normally also at very low or negative levels. This is an unrealistic simplification, which can be overruled for good reasons. It has been the Committee’s assessment that the costs associated with reducing the policy rate below zero outweigh the benefits. In this Report, the model-based calculations no longer indicate a need for a negative policy rate. This primarily reflects the improvements in the economic outlook over the past year.
49
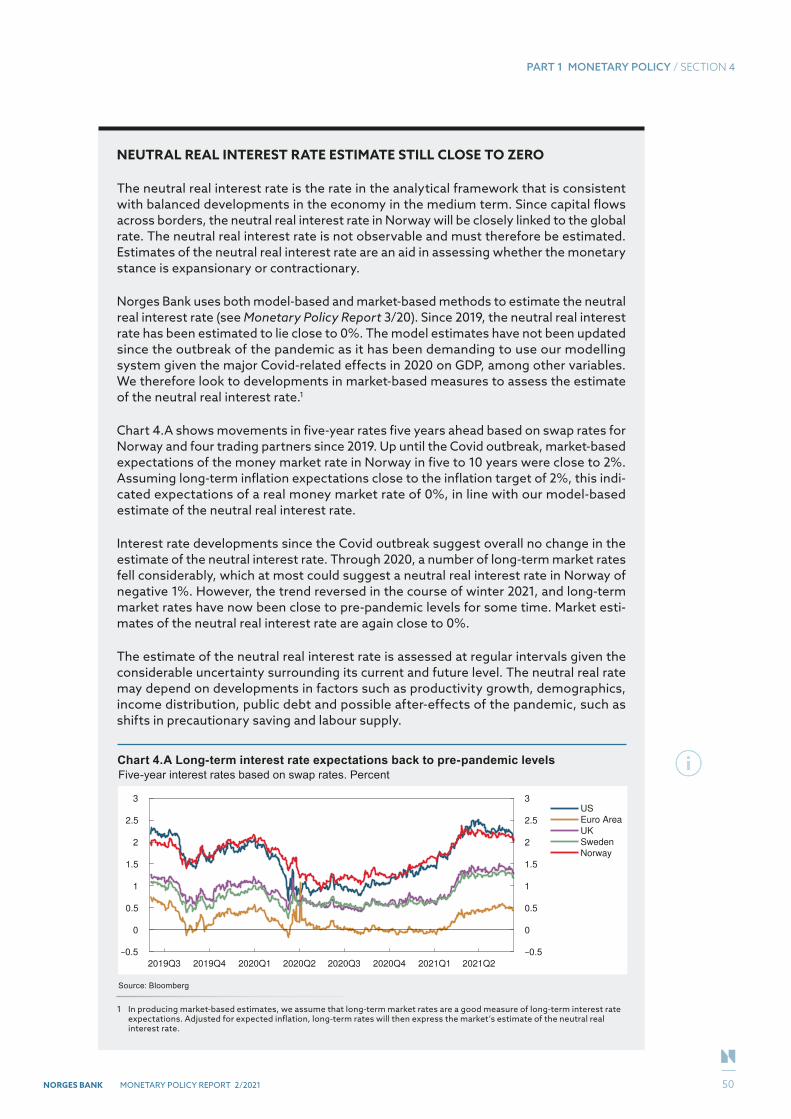
PART 1 MONETARY POLICY / SECTION 4
NORGES BANK MONETARY POLICY REPORT 2/2021
NEUTRAL REAL INTEREST RATE ESTIMATE STILL CLOSE TO ZERO
The neutral real interest rate is the rate in the analytical framework that is consistent with balanced developments in the economy in the medium term. Since capital flows across borders, the neutral real interest rate in Norway will be closely linked to the global rate. The neutral real interest rate is not observable and must therefore be estimated. Estimates of the neutral real interest rate are an aid in assessing whether the monetary stance is expansionary or contractionary.
Norges Bank uses both model-based and market-based methods to estimate the neutral real interest rate (see Monetary Policy Report 3/20). Since 2019, the neutral real interest rate has been estimated to lie close to 0%. The model estimates have not been updated since the outbreak of the pandemic as it has been demanding to use our modelling system given the major Covid-related effects in 2020 on GDP, among other variables. We therefore look to developments in market-based measures to assess the estimate of the neutral real interest rate.1
Chart 4.A shows movements in five-year rates five years ahead based on swap rates for Norway and four trading partners since 2019. Up until the Covid outbreak, market-based expectations of the money market rate in Norway in five to 10 years were close to 2%. Assuming long-term inflation expectations close to the inflation target of 2%, this indi-cated expectations of a real money market rate of 0%, in line with our model-based estimate of the neutral real interest rate.
Interest rate developments since the Covid outbreak suggest overall no change in the estimate of the neutral interest rate. Through 2020, a number of long-term market rates fell considerably, which at most could suggest a neutral real interest rate in Norway of negative 1%. However, the trend reversed in the course of winter 2021, and long-term market rates have now been close to pre-pandemic levels for some time. Market esti-mates of the neutral real interest rate are again close to 0%.
The estimate of the neutral real interest rate is assessed at regular intervals given the considerable uncertainty surrounding its current and future level. The neutral real rate may depend on developments in factors such as productivity growth, demographics, income distribution, public debt and possible after-effects of the pandemic, such as shifts in precautionary saving and labour supply.
1 In producing market-based estimates, we assume that long-term market rates are a good measure of long-term interest rate expectations. Adjusted for expected inflation, long-term rates will then express the market’s estimate of the neutral real interest rate.
Chart 4.A Long-term interest rate expectations back to pre-pandemic levelsFive-year interest rates based on swap rates. Percent
2019Q3 2019Q4 2020Q1 2020Q2 2020Q3 2020Q4 2021Q1 2021Q2
0
0.5
1
1.5
2
2.5
3
0
0.5
1
1.5
2
2.5
3US
Euro Area
UK
Sweden
Norway
Source: Bloomberg
50
PART 1 MONETARY POLICY / SECTION 4
NORGES BANK MONETARY POLICY REPORT 2/2021
MONETARY POLICY OBJECTIVES AND TRADE-OFFS
The operational target of monetary policy is annual consumer price inflation of close to 2% over time. Inflation targeting shall be forward-looking and flexible so that it can contribute to high and stable output and employment and to counteracting the build-up of financial imbalances. The various considerations are weighed against each other.
The policy rate is set with a view to stabilising inflation around the target in the medium term. The horizon will depend on the shocks to which the economy is exposed and the effects on the outlook for inflation and for output and employment.
Monetary policy can contribute to stabilising output and employment at around the highest possible level consistent with price stability over time. This level is determined by structural conditions such as the tax and social security system, the system of wage formation and the composition of the labour force.
When shocks occur, a short-term trade-off may arise between reaching the inflation target and supporting high and stable output and employment. Monetary policy should strike a reasonable balance between these considerations.
A flexible inflation-targeting regime where sufficient weight is given to the real economy can prevent downturns from becoming deep and protracted. This can reduce the risk of unemployment becoming entrenched at a high level following an economic downturn.
If there are signs that financial imbalances are building up, the consideration of high and stable output and employment may in some situations suggest keeping the policy rate somewhat higher than would otherwise be the case. To some extent, this can contribute to reducing the risk of sharp economic downturns further ahead. Nevertheless, the regulation and supervision of financial institutions are the primary means of addressing shocks to the financial system.
The conduct of monetary policy takes account of uncertainty regarding the functioning of the economy. Uncertainty surrounding the effects of monetary policy normally sug-gests a cautious approach to interest rate setting. This can reduce the risk that monetary policy will have unintended consequences. The policy rate will normally be changed gradually so that the effects of interest rate changes and other new information about economic developments can be assessed.
In situations where the risk of particularly adverse outcomes is pronounced, or if there is no longer confidence that inflation will remain low and stable, it may in some cases be appropriate to react more strongly in interest rate setting than normal.
51
NORGES BANK MONETARY POLICY REPORT 2/2021
5 Financial stability assessment – decision basis for the countercyclical capital buffer
Norges Bank’s Monetary Policy and Financial Stability Committee has advised the Ministry of Finance to raise the countercyclical capital buffer requirement to 1.5%, effective from 30 June 2022.1
The objective of the countercyclical capital buffer is to increase banks’ resilience in an economic downturn. Norwegian banks are profitable and credit losses are expected to be lower in 2021 than in 2020. Creditworthy businesses and house-holds appear to have ample access to credit. Norwegian banks are well equipped to meet an increased countercyclical capital buffer requirement while maintain-ing credit supply.
Prior to the reduction in March 2020, the countercyclical capital buffer require-ment was set at 2.5% against the background of a build-up of financial imbal-ances over a long period. During the Covid-19 (Covid) pandemic, both commer-cial property and house prices have increased markedly and household credit growth has picked up. Property price inflation has recently slowed and is expected to moderate ahead. The Committee’s assessment is that financial imbalances have increased somewhat over the past year. Both debt and property prices are at high levels. The consideration of financial imbalances suggests a higher buffer requirement.
In the Committee’s current assessment of economic developments and the outlook for bank losses and lending capacity, the Committee will advise further increasing the buffer rate in the course of 2021. The Committee expects the buffer to return to 2.5% in the period ahead.
5.1 Access to creditBanks have sufficient capacity to meet credit demand. Banks included in Norges Bank’s Survey of Bank Lending reported unchanged credit standards for households and busi-nesses in 2021 Q1, and no changes are expected ahead. Issuance volume in the corporate bond market has been high over the past six months, and risk premiums for most indus-tries are close to levels observed before the turbulence intensified in March. Growth in bank lending to corporates slowed in the same period. These developments may partly reflect the fact that non-financial corporations have ample access to market-based funding on favourable terms (see Section 2). Overall, creditworthy households and businesses appear to have ample access to credit.
1 See letter from Norges Bank to the Ministry of Finance of 16 June 2021.
PART 2: FINANCIAL STABILITY
52
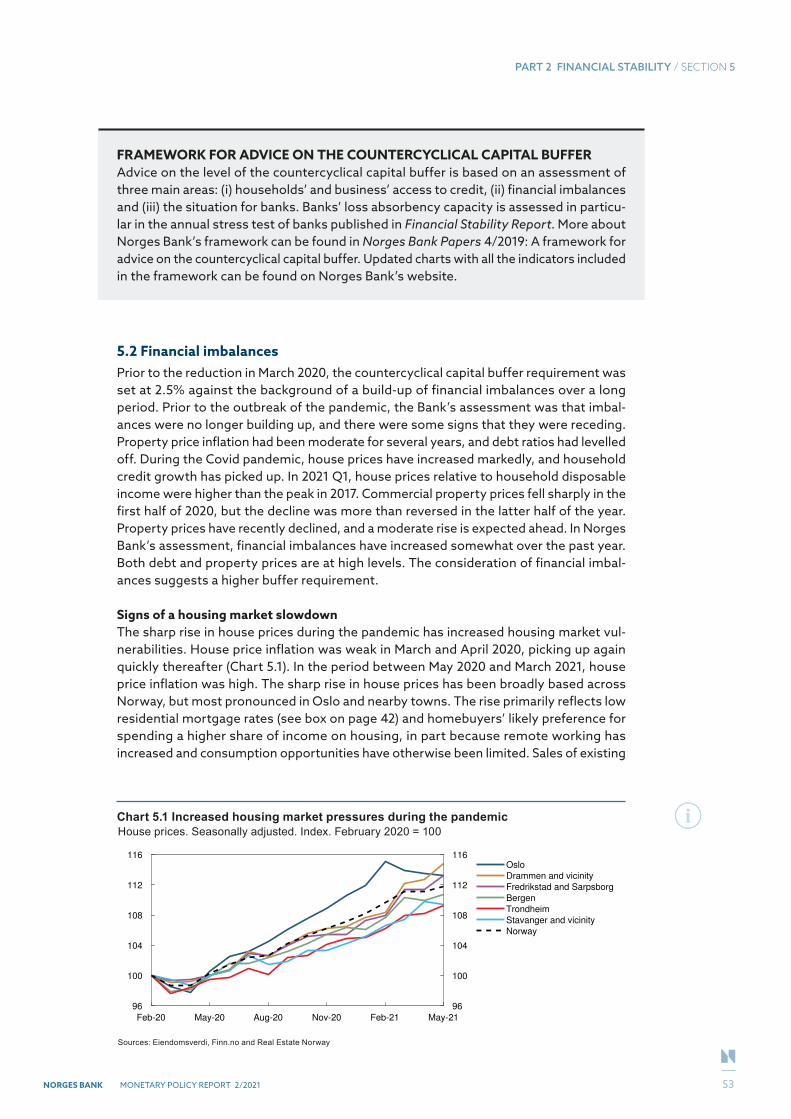
NORGES BANK MONETARY POLICY REPORT 2/2021
PART 2 FINANCIAL STABILITY / SECTION 5
5.2 Financial imbalancesPrior to the reduction in March 2020, the countercyclical capital buffer requirement was set at 2.5% against the background of a build-up of financial imbalances over a long period. Prior to the outbreak of the pandemic, the Bank’s assessment was that imbal-ances were no longer building up, and there were some signs that they were receding. Property price inflation had been moderate for several years, and debt ratios had levelled off. During the Covid pandemic, house prices have increased markedly, and household credit growth has picked up. In 2021 Q1, house prices relative to household disposable income were higher than the peak in 2017. Commercial property prices fell sharply in the first half of 2020, but the decline was more than reversed in the latter half of the year. Property prices have recently declined, and a moderate rise is expected ahead. In Norges Bank’s assessment, financial imbalances have increased somewhat over the past year. Both debt and property prices are at high levels. The consideration of financial imbal-ances suggests a higher buffer requirement.
Signs of a housing market slowdownThe sharp rise in house prices during the pandemic has increased housing market vul-nerabilities. House price inflation was weak in March and April 2020, picking up again quickly thereafter (Chart 5.1). In the period between May 2020 and March 2021, house price inflation was high. The sharp rise in house prices has been broadly based across Norway, but most pronounced in Oslo and nearby towns. The rise primarily reflects low residential mortgage rates (see box on page 42) and homebuyers’ likely preference for spending a higher share of income on housing, in part because remote working has increased and consumption opportunities have otherwise been limited. Sales of existing
FRAMEWORK FOR ADVICE ON THE COUNTERCYCLICAL CAPITAL BUFFERAdvice on the level of the countercyclical capital buffer is based on an assessment of three main areas: (i) households’ and business’ access to credit, (ii) financial imbalances and (iii) the situation for banks. Banks’ loss absorbency capacity is assessed in particu-lar in the annual stress test of banks published in Financial Stability Report. More about Norges Bank’s framework can be found in Norges Bank Papers 4/2019: A framework for advice on the countercyclical capital buffer. Updated charts with all the indicators included in the framework can be found on Norges Bank’s website.
Chart 5.1 Increased housing market pressures during the pandemicHouse prices. Seasonally adjusted. Index. February 2020 = 100
Feb-20 May-20 Aug-20 Nov-20 Feb-21 May-21
96
100
104
108
112
116
96
100
104
108
112
116Oslo
Drammen and vicinity
Fredrikstad and Sarpsborg
Bergen
Trondheim
Stavanger and vicinity
Norway
Sources: Eiendomsverdi, Finn.no and Real Estate Norway
53
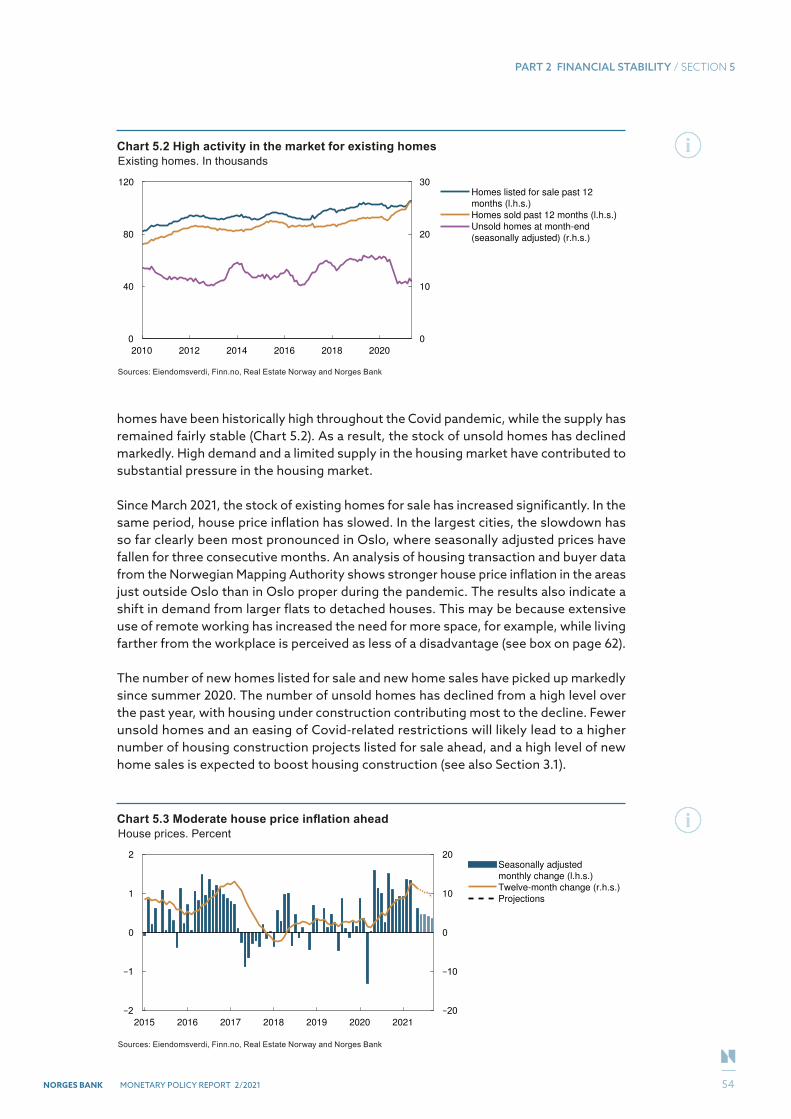
NORGES BANK MONETARY POLICY REPORT 2/2021
PART 2 FINANCIAL STABILITY / SECTION 5
homes have been historically high throughout the Covid pandemic, while the supply has remained fairly stable (Chart 5.2). As a result, the stock of unsold homes has declined markedly. High demand and a limited supply in the housing market have contributed to substantial pressure in the housing market.
Since March 2021, the stock of existing homes for sale has increased significantly. In the same period, house price inflation has slowed. In the largest cities, the slowdown has so far clearly been most pronounced in Oslo, where seasonally adjusted prices have fallen for three consecutive months. An analysis of housing transaction and buyer data from the Norwegian Mapping Authority shows stronger house price inflation in the areas just outside Oslo than in Oslo proper during the pandemic. The results also indicate a shift in demand from larger flats to detached houses. This may be because extensive use of remote working has increased the need for more space, for example, while living farther from the workplace is perceived as less of a disadvantage (see box on page 62).
The number of new homes listed for sale and new home sales have picked up markedly since summer 2020. The number of unsold homes has declined from a high level over the past year, with housing under construction contributing most to the decline. Fewer unsold homes and an easing of Covid-related restrictions will likely lead to a higher number of housing construction projects listed for sale ahead, and a high level of new home sales is expected to boost housing construction (see also Section 3.1).
Chart 5.2 High activity in the market for existing homesExisting homes. In thousands
2010 2012 2014 2016 2018 2020
0
40
80
120
0
10
20
30Homes listed for sale past 12
months (l.h.s.)
Homes sold past 12 months (l.h.s.)
Unsold homes at month-end
(seasonally adjusted) (r.h.s.)
Sources: Eiendomsverdi, Finn.no, Real Estate Norway and Norges Bank
Chart 5.3 Moderate house price inflation aheadHouse prices. Percent
2015 2016 2017 2018 2019 2020 2021
0
1
2
0
10
20Seasonally adjusted
monthly change (l.h.s.)
Twelve-month change (r.h.s.)
Projections
Sources: Eiendomsverdi, Finn.no, Real Estate Norway and Norges Bank
54
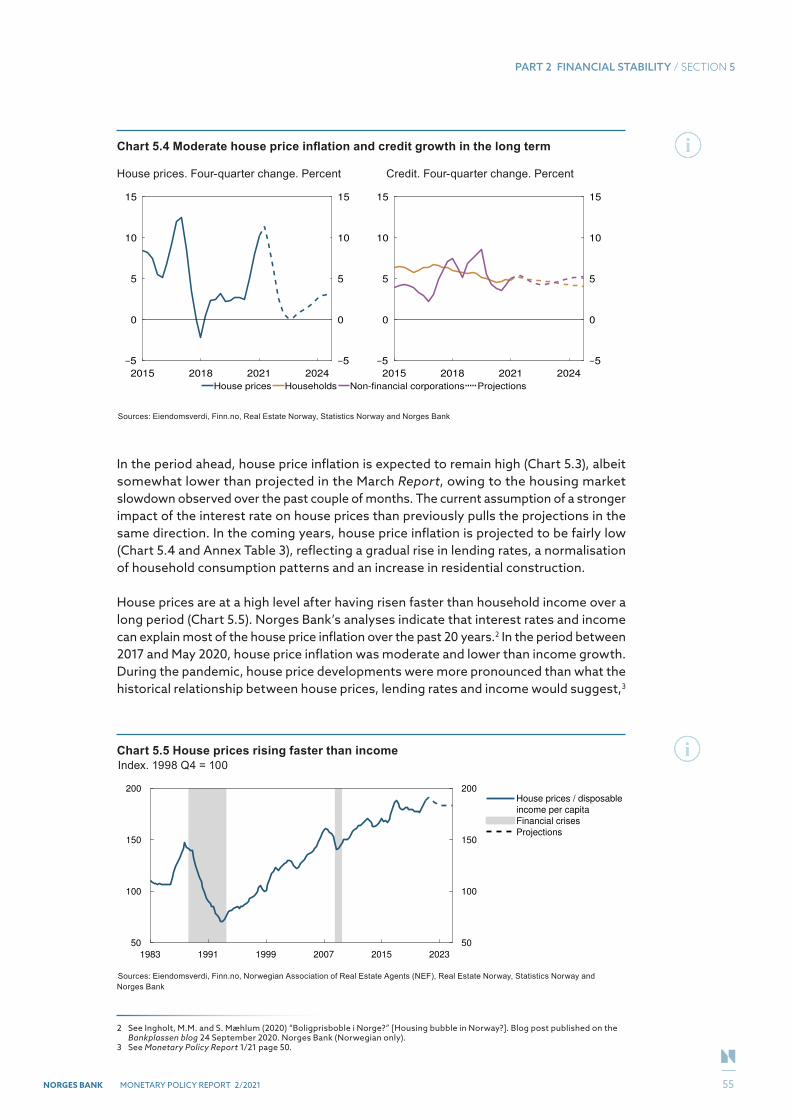
NORGES BANK MONETARY POLICY REPORT 2/2021
PART 2 FINANCIAL STABILITY / SECTION 5
In the period ahead, house price inflation is expected to remain high (Chart 5.3), albeit somewhat lower than projected in the March Report, owing to the housing market slowdown observed over the past couple of months. The current assumption of a stronger impact of the interest rate on house prices than previously pulls the projections in the same direction. In the coming years, house price inflation is projected to be fairly low (Chart 5.4 and Annex Table 3), reflecting a gradual rise in lending rates, a normalisation of household consumption patterns and an increase in residential construction.
House prices are at a high level after having risen faster than household income over a long period (Chart 5.5). Norges Bank’s analyses indicate that interest rates and income can explain most of the house price inflation over the past 20 years.2 In the period between 2017 and May 2020, house price inflation was moderate and lower than income growth. During the pandemic, house price developments were more pronounced than what the historical relationship between house prices, lending rates and income would suggest,3
2 See Ingholt, M.M. and S. Mæhlum (2020) “Boligprisboble i Norge?” [Housing bubble in Norway?]. Blog post published on the Bankplassen blog 24 September 2020. Norges Bank (Norwegian only).
3 See Monetary Policy Report 1/21 page 50.
Chart 5.4 Moderate house price inflation and credit growth in the long term House prices. Four-quarter change. Percent Credit. Four-quarter change. Percent
2015 2018 2021 2024
0
5
10
15
0
5
10
15
House prices Households Non-financial corporations Projections
2015 2018 2021 2024
0
5
10
15
0
5
10
15
Sources: Eiendomsverdi, Finn.no, Real Estate Norway, Statistics Norway and Norges Bank
Chart 5.5 House prices rising faster than incomeIndex. 1998 Q4 = 100
1983 1991 1999 2007 2015 2023
50
100
150
200
50
100
150
200House prices / disposable
income per capita
Financial crises
Projections
Sources: Eiendomsverdi, Finn.no, Norwegian Association of Real Estate Agents (NEF), Real Estate Norway, Statistics Norway and Norges Bank
55
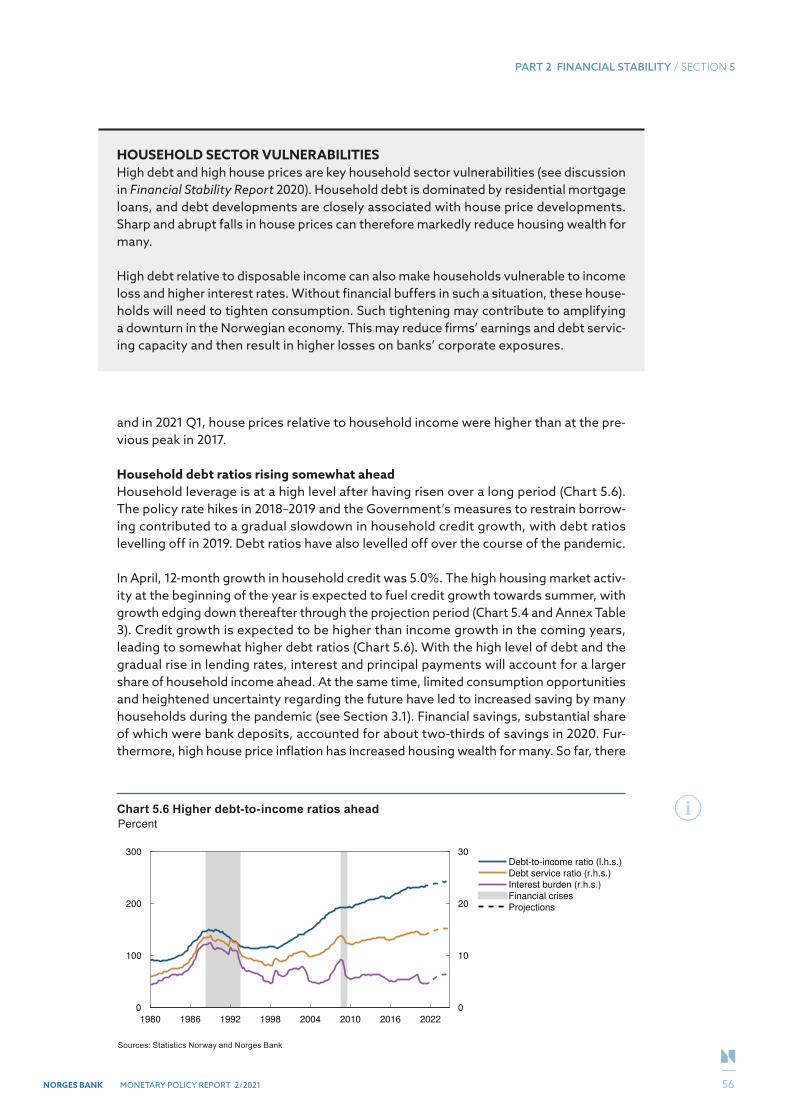
NORGES BANK MONETARY POLICY REPORT 2/2021
PART 2 FINANCIAL STABILITY / SECTION 5
and in 2021 Q1, house prices relative to household income were higher than at the pre-vious peak in 2017.
Household debt ratios rising somewhat aheadHousehold leverage is at a high level after having risen over a long period (Chart 5.6). The policy rate hikes in 2018–2019 and the Government’s measures to restrain borrow-ing contributed to a gradual slowdown in household credit growth, with debt ratios levelling off in 2019. Debt ratios have also levelled off over the course of the pandemic.
In April, 12-month growth in household credit was 5.0%. The high housing market activ-ity at the beginning of the year is expected to fuel credit growth towards summer, with growth edging down thereafter through the projection period (Chart 5.4 and Annex Table 3). Credit growth is expected to be higher than income growth in the coming years, leading to somewhat higher debt ratios (Chart 5.6). With the high level of debt and the gradual rise in lending rates, interest and principal payments will account for a larger share of household income ahead. At the same time, limited consumption opportunities and heightened uncertainty regarding the future have led to increased saving by many households during the pandemic (see Section 3.1). Financial savings, substantial share of which were bank deposits, accounted for about two-thirds of savings in 2020. Fur-thermore, high house price inflation has increased housing wealth for many. So far, there
HOUSEHOLD SECTOR VULNERABILITIESHigh debt and high house prices are key household sector vulnerabilities (see discussion in Financial Stability Report 2020). Household debt is dominated by residential mortgage loans, and debt developments are closely associated with house price developments. Sharp and abrupt falls in house prices can therefore markedly reduce housing wealth for many.
High debt relative to disposable income can also make households vulnerable to income loss and higher interest rates. Without financial buffers in such a situation, these house-holds will need to tighten consumption. Such tightening may contribute to amplifying a downturn in the Norwegian economy. This may reduce firms’ earnings and debt servic-ing capacity and then result in higher losses on banks’ corporate exposures.
Chart 5.6 Higher debt-to-income ratios aheadPercent
1980 1986 1992 1998 2004 2010 2016 2022
0
100
200
300
0
10
20
30Debt-to-income ratio (l.h.s.)
Debt service ratio (r.h.s.)
Interest burden (r.h.s.)
Financial crises
Projections
Sources: Statistics Norway and Norges Bank
56
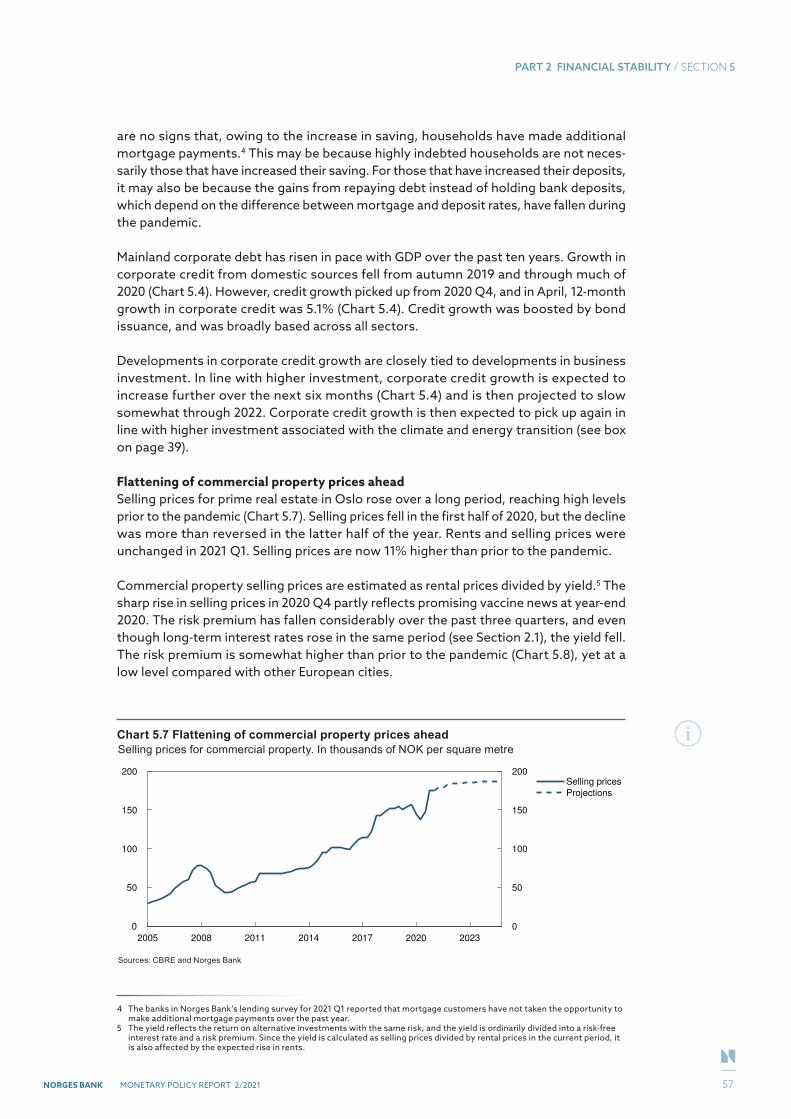
NORGES BANK MONETARY POLICY REPORT 2/2021
PART 2 FINANCIAL STABILITY / SECTION 5
are no signs that, owing to the increase in saving, households have made additional mortgage payments.4 This may be because highly indebted households are not neces-sarily those that have increased their saving. For those that have increased their deposits, it may also be because the gains from repaying debt instead of holding bank deposits, which depend on the difference between mortgage and deposit rates, have fallen during the pandemic.
Mainland corporate debt has risen in pace with GDP over the past ten years. Growth in corporate credit from domestic sources fell from autumn 2019 and through much of 2020 (Chart 5.4). However, credit growth picked up from 2020 Q4, and in April, 12-month growth in corporate credit was 5.1% (Chart 5.4). Credit growth was boosted by bond issuance, and was broadly based across all sectors.
Developments in corporate credit growth are closely tied to developments in business investment. In line with higher investment, corporate credit growth is expected to increase further over the next six months (Chart 5.4) and is then projected to slow somewhat through 2022. Corporate credit growth is then expected to pick up again in line with higher investment associated with the climate and energy transition (see box on page 39).
Flattening of commercial property prices aheadSelling prices for prime real estate in Oslo rose over a long period, reaching high levels prior to the pandemic (Chart 5.7). Selling prices fell in the first half of 2020, but the decline was more than reversed in the latter half of the year. Rents and selling prices were unchanged in 2021 Q1. Selling prices are now 11% higher than prior to the pandemic.
Commercial property selling prices are estimated as rental prices divided by yield.5 The sharp rise in selling prices in 2020 Q4 partly reflects promising vaccine news at year-end 2020. The risk premium has fallen considerably over the past three quarters, and even though long-term interest rates rose in the same period (see Section 2.1), the yield fell. The risk premium is somewhat higher than prior to the pandemic (Chart 5.8), yet at a low level compared with other European cities.
4 The banks in Norges Bank’s lending survey for 2021 Q1 reported that mortgage customers have not taken the opportunity to make additional mortgage payments over the past year.
5 The yield reflects the return on alternative investments with the same risk, and the yield is ordinarily divided into a risk-free interest rate and a risk premium. Since the yield is calculated as selling prices divided by rental prices in the current period, it is also affected by the expected rise in rents.
Chart 5.7 Flattening of commercial property prices aheadSelling prices for commercial property. In thousands of NOK per square metre
2005 2008 2011 2014 2017 2020 2023
0
50
100
150
200
0
50
100
150
200Selling prices
Projections
Sources: CBRE and Norges Bank
57
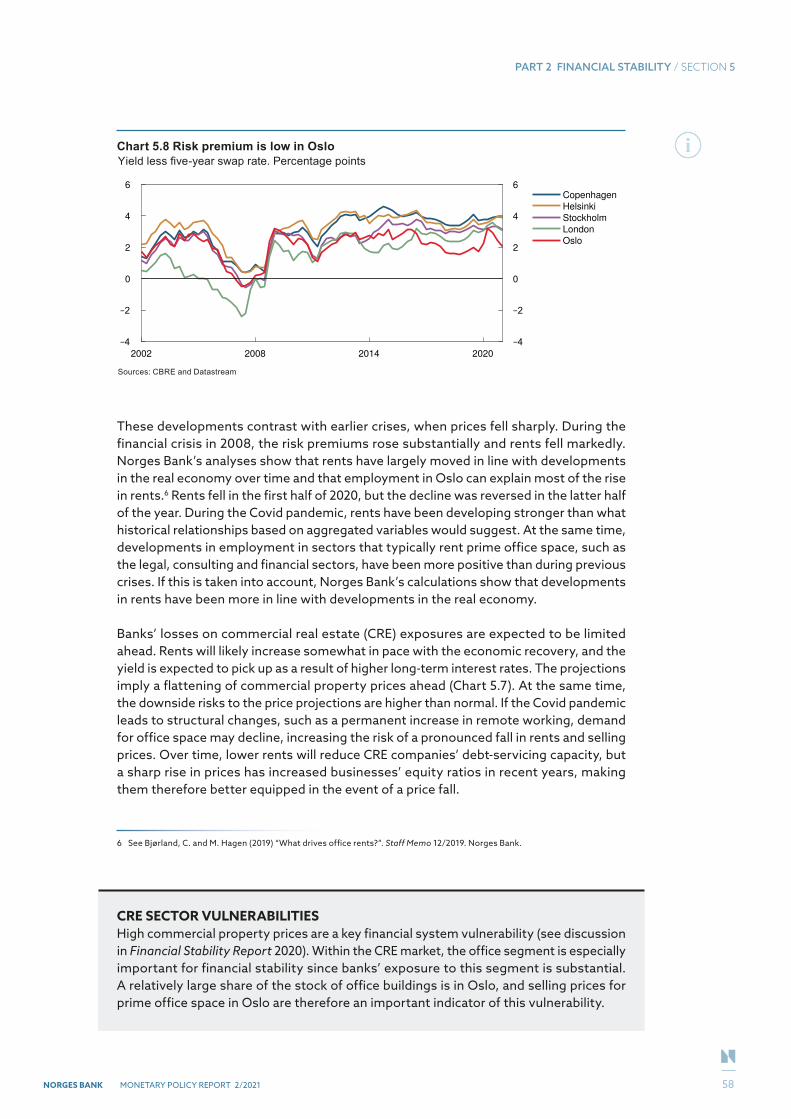
NORGES BANK MONETARY POLICY REPORT 2/2021
PART 2 FINANCIAL STABILITY / SECTION 5
These developments contrast with earlier crises, when prices fell sharply. During the financial crisis in 2008, the risk premiums rose substantially and rents fell markedly. Norges Bank’s analyses show that rents have largely moved in line with developments in the real economy over time and that employment in Oslo can explain most of the rise in rents.6 Rents fell in the first half of 2020, but the decline was reversed in the latter half of the year. During the Covid pandemic, rents have been developing stronger than what historical relationships based on aggregated variables would suggest. At the same time, developments in employment in sectors that typically rent prime office space, such as the legal, consulting and financial sectors, have been more positive than during previous crises. If this is taken into account, Norges Bank’s calculations show that developments in rents have been more in line with developments in the real economy.
Banks’ losses on commercial real estate (CRE) exposures are expected to be limited ahead. Rents will likely increase somewhat in pace with the economic recovery, and the yield is expected to pick up as a result of higher long-term interest rates. The projections imply a flattening of commercial property prices ahead (Chart 5.7). At the same time, the downside risks to the price projections are higher than normal. If the Covid pandemic leads to structural changes, such as a permanent increase in remote working, demand for office space may decline, increasing the risk of a pronounced fall in rents and selling prices. Over time, lower rents will reduce CRE companies’ debt-servicing capacity, but a sharp rise in prices has increased businesses’ equity ratios in recent years, making them therefore better equipped in the event of a price fall.
6 See Bjørland, C. and M. Hagen (2019) “What drives office rents?”. Staff Memo 12/2019. Norges Bank.
Chart 5.8 Risk premium is low in OsloYield less five-year swap rate. Percentage points
2002 2008 2014 2020
0
2
4
6
0
2
4
6Copenhagen
Helsinki
Stockholm
London
Oslo
Sources: CBRE and Datastream
CRE SECTOR VULNERABILITIESHigh commercial property prices are a key financial system vulnerability (see discussion in Financial Stability Report 2020). Within the CRE market, the office segment is especially important for financial stability since banks’ exposure to this segment is substantial. A relatively large share of the stock of office buildings is in Oslo, and selling prices for prime office space in Oslo are therefore an important indicator of this vulnerability.
58
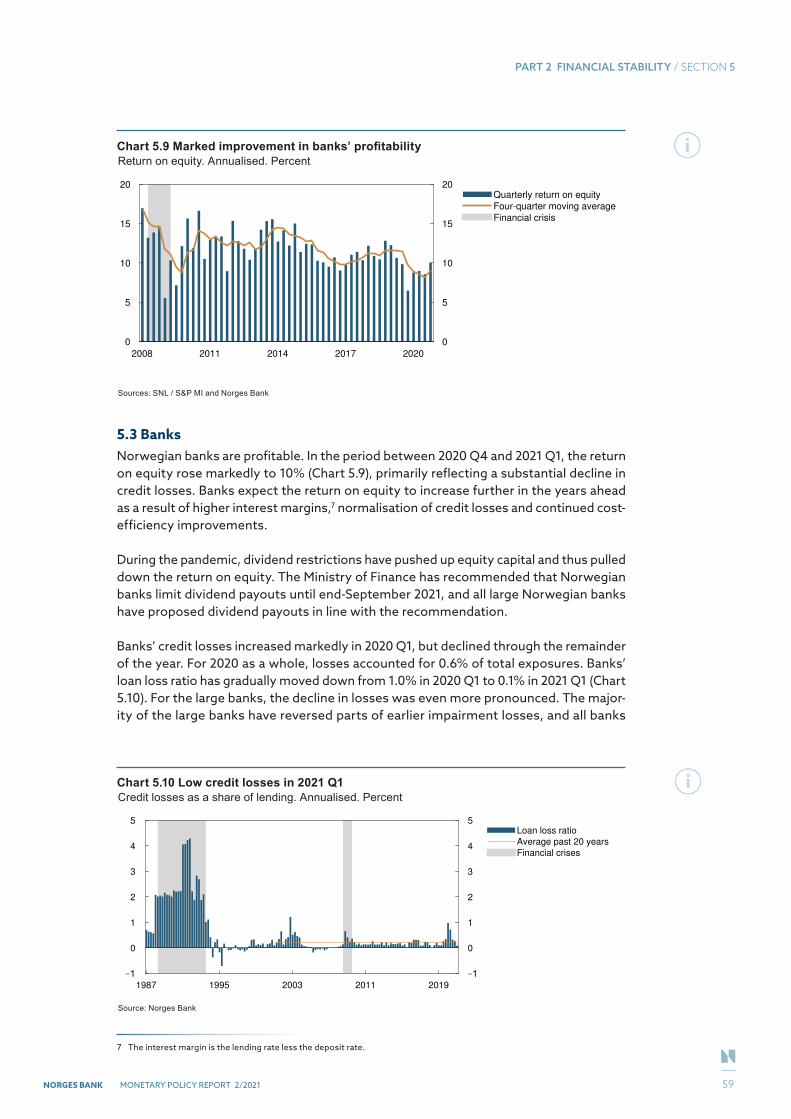
NORGES BANK MONETARY POLICY REPORT 2/2021
PART 2 FINANCIAL STABILITY / SECTION 5
5.3 BanksNorwegian banks are profitable. In the period between 2020 Q4 and 2021 Q1, the return on equity rose markedly to 10% (Chart 5.9), primarily reflecting a substantial decline in credit losses. Banks expect the return on equity to increase further in the years ahead as a result of higher interest margins,7 normalisation of credit losses and continued cost-efficiency improvements.
During the pandemic, dividend restrictions have pushed up equity capital and thus pulled down the return on equity. The Ministry of Finance has recommended that Norwegian banks limit dividend payouts until end-September 2021, and all large Norwegian banks have proposed dividend payouts in line with the recommendation.
Banks’ credit losses increased markedly in 2020 Q1, but declined through the remainder of the year. For 2020 as a whole, losses accounted for 0.6% of total exposures. Banks’ loan loss ratio has gradually moved down from 1.0% in 2020 Q1 to 0.1% in 2021 Q1 (Chart 5.10). For the large banks, the decline in losses was even more pronounced. The major-ity of the large banks have reversed parts of earlier impairment losses, and all banks
7 The interest margin is the lending rate less the deposit rate.
Chart 5.9 Marked improvement in banks’ profitabilityReturn on equity. Annualised. Percent
Sources: SNL / S&P MI and Norges Bank
Chart 5.10 Low credit losses in 2021 Q1Credit losses as a share of lending. Annualised. Percent
1987 1995 2003 2011 2019
0
1
2
3
4
5
0
1
2
3
4
5Loan loss ratio
Average past 20 years
Financial crises
Source: Norges Bank
2008 2011 2014 2017 2020
0
5
10
15
20
0
5
10
15
20Quarterly return on equity
Four-quarter moving average
Financial crisis
59
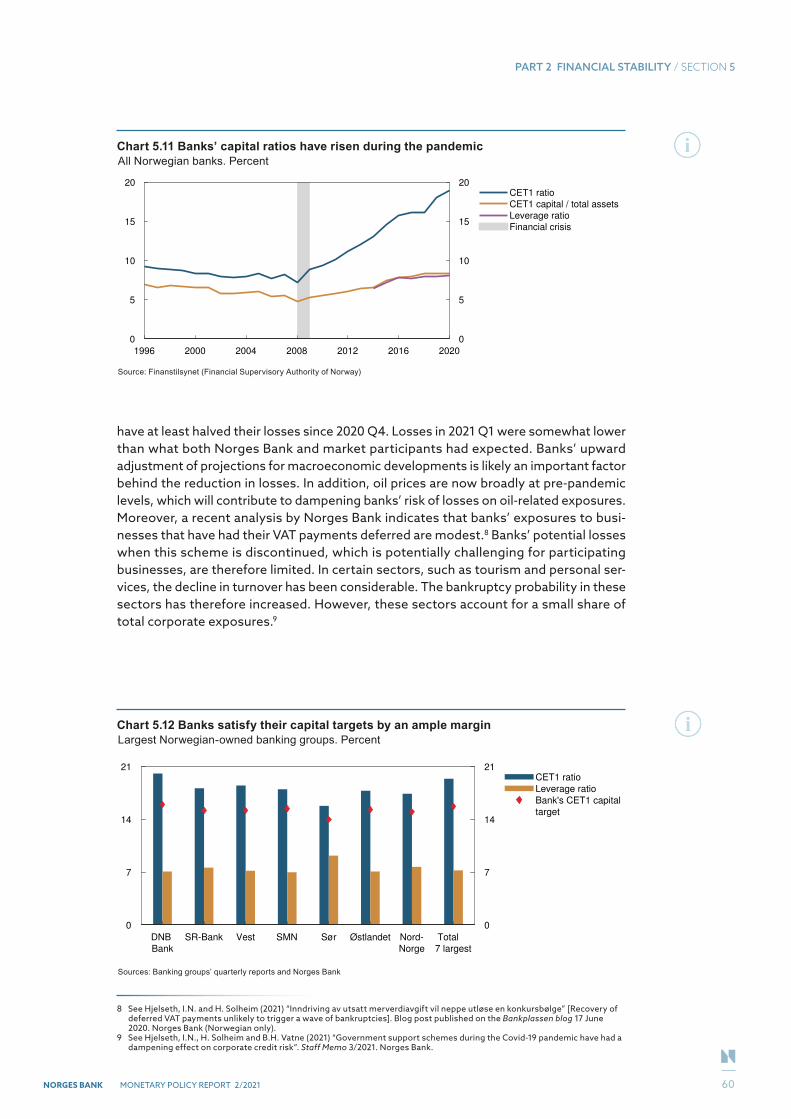
NORGES BANK MONETARY POLICY REPORT 2/2021
PART 2 FINANCIAL STABILITY / SECTION 5
have at least halved their losses since 2020 Q4. Losses in 2021 Q1 were somewhat lower than what both Norges Bank and market participants had expected. Banks’ upward adjustment of projections for macroeconomic developments is likely an important factor behind the reduction in losses. In addition, oil prices are now broadly at pre-pandemic levels, which will contribute to dampening banks’ risk of losses on oil-related exposures. Moreover, a recent analysis by Norges Bank indicates that banks’ exposures to busi-nesses that have had their VAT payments deferred are modest.8 Banks’ potential losses when this scheme is discontinued, which is potentially challenging for participating businesses, are therefore limited. In certain sectors, such as tourism and personal ser-vices, the decline in turnover has been considerable. The bankruptcy probability in these sectors has therefore increased. However, these sectors account for a small share of total corporate exposures.9
8 See Hjelseth, I.N. and H. Solheim (2021) “Inndriving av utsatt merverdiavgift vil neppe utløse en konkursbølge” [Recovery of deferred VAT payments unlikely to trigger a wave of bankruptcies]. Blog post published on the Bankplassen blog 17 June 2020. Norges Bank (Norwegian only).
9 See Hjelseth, I.N., H. Solheim and B.H. Vatne (2021) “Government support schemes during the Covid-19 pandemic have had a dampening effect on corporate credit risk”. Staff Memo 3/2021. Norges Bank.
Chart 5.11 Banks’ capital ratios have risen during the pandemicAll Norwegian banks. Percent
1996 2000 2004 2008 2012 2016 2020
0
5
10
15
20
0
5
10
15
20CET1 ratio
CET1 capital / total assets
Leverage ratio
Financial crisis
Source: Finanstilsynet (Financial Supervisory Authority of Norway)
Chart 5.12 Banks satisfy their capital targets by an ample marginLargest Norwegian-owned banking groups. Percent
DNB
Bank
SR-Bank Vest SMN Sør Østlandet Nord-
Norge
Total
7 largest
0
7
14
21
0
7
14
21CET1 ratio
Leverage ratio
Bank's CET1 capital
target
Sources: Banking groups’ quarterly reports and Norges Bank
60
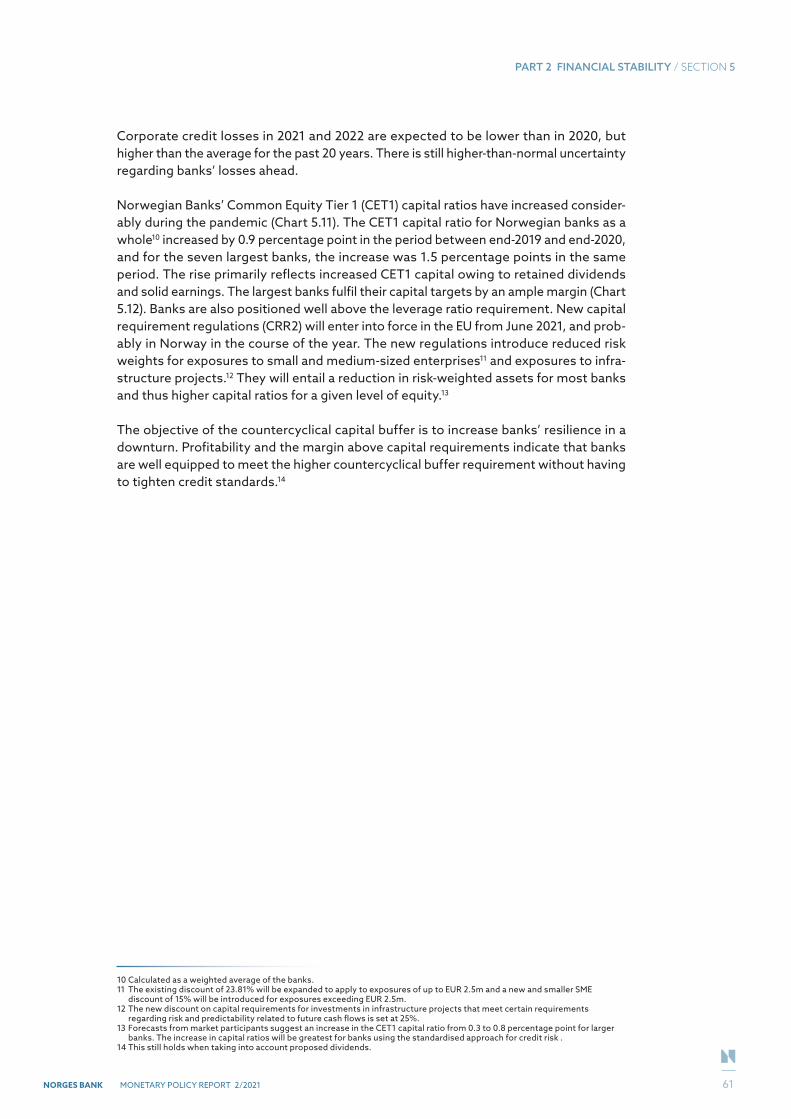
NORGES BANK MONETARY POLICY REPORT 2/2021
PART 2 FINANCIAL STABILITY / SECTION 5
Corporate credit losses in 2021 and 2022 are expected to be lower than in 2020, but higher than the average for the past 20 years. There is still higher-than-normal uncertainty regarding banks’ losses ahead.
Norwegian Banks’ Common Equity Tier 1 (CET1) capital ratios have increased consider-ably during the pandemic (Chart 5.11). The CET1 capital ratio for Norwegian banks as a whole10 increased by 0.9 percentage point in the period between end-2019 and end-2020, and for the seven largest banks, the increase was 1.5 percentage points in the same period. The rise primarily reflects increased CET1 capital owing to retained dividends and solid earnings. The largest banks fulfil their capital targets by an ample margin (Chart 5.12). Banks are also positioned well above the leverage ratio requirement. New capital requirement regulations (CRR2) will enter into force in the EU from June 2021, and prob-ably in Norway in the course of the year. The new regulations introduce reduced risk weights for exposures to small and medium-sized enterprises11 and exposures to infra-structure projects.12 They will entail a reduction in risk-weighted assets for most banks and thus higher capital ratios for a given level of equity.13
The objective of the countercyclical capital buffer is to increase banks’ resilience in a downturn. Profitability and the margin above capital requirements indicate that banks are well equipped to meet the higher countercyclical buffer requirement without having to tighten credit standards.14
10 Calculated as a weighted average of the banks.11 The existing discount of 23.81% will be expanded to apply to exposures of up to EUR 2.5m and a new and smaller SME
discount of 15% will be introduced for exposures exceeding EUR 2.5m.12 The new discount on capital requirements for investments in infrastructure projects that meet certain requirements
regarding risk and predictability related to future cash flows is set at 25%.13 Forecasts from market participants suggest an increase in the CET1 capital ratio from 0.3 to 0.8 percentage point for larger
banks. The increase in capital ratios will be greatest for banks using the standardised approach for credit risk .14 This still holds when taking into account proposed dividends.
61
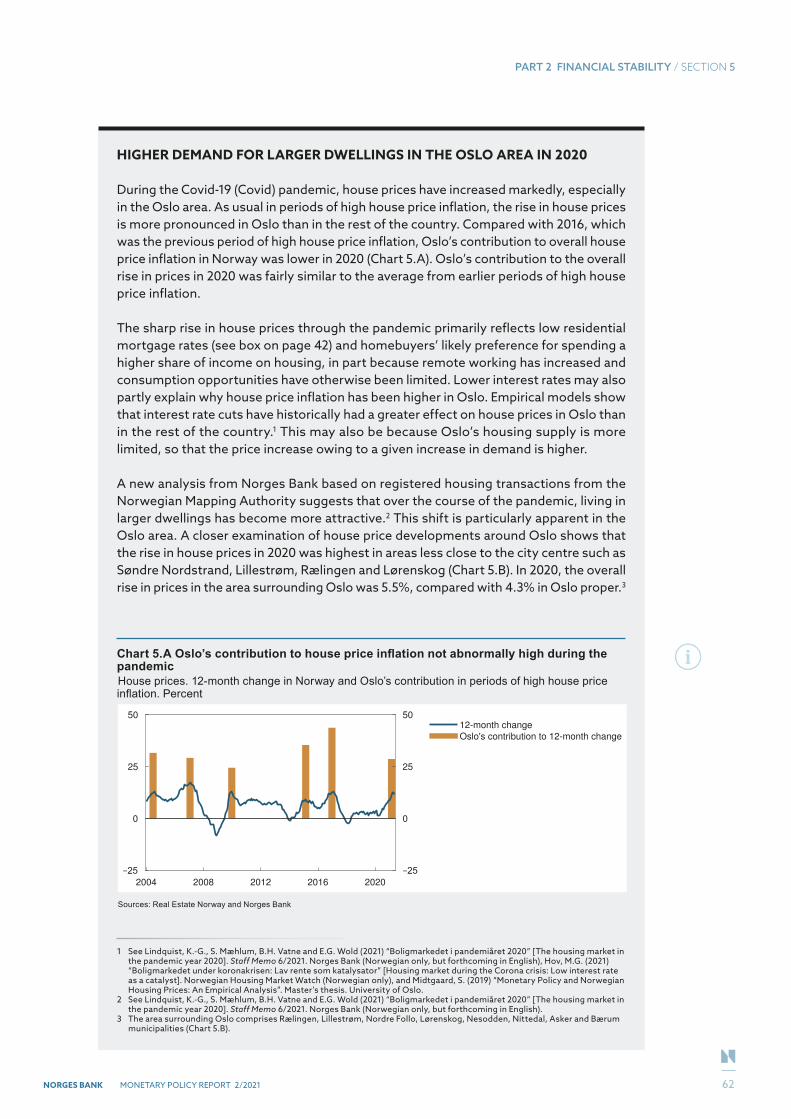
NORGES BANK MONETARY POLICY REPORT 2/2021
PART 2 FINANCIAL STABILITY / SECTION 5
HIGHER DEMAND FOR LARGER DWELLINGS IN THE OSLO AREA IN 2020
During the Covid-19 (Covid) pandemic, house prices have increased markedly, especially in the Oslo area. As usual in periods of high house price inflation, the rise in house prices is more pronounced in Oslo than in the rest of the country. Compared with 2016, which was the previous period of high house price inflation, Oslo’s contribution to overall house price inflation in Norway was lower in 2020 (Chart 5.A). Oslo’s contribution to the overall rise in prices in 2020 was fairly similar to the average from earlier periods of high house price inflation.
The sharp rise in house prices through the pandemic primarily reflects low residential mortgage rates (see box on page 42) and homebuyers’ likely preference for spending a higher share of income on housing, in part because remote working has increased and consumption opportunities have otherwise been limited. Lower interest rates may also partly explain why house price inflation has been higher in Oslo. Empirical models show that interest rate cuts have historically had a greater effect on house prices in Oslo than in the rest of the country.1 This may also be because Oslo’s housing supply is more limited, so that the price increase owing to a given increase in demand is higher.
A new analysis from Norges Bank based on registered housing transactions from the Norwegian Mapping Authority suggests that over the course of the pandemic, living in larger dwellings has become more attractive.2 This shift is particularly apparent in the Oslo area. A closer examination of house price developments around Oslo shows that the rise in house prices in 2020 was highest in areas less close to the city centre such as Søndre Nordstrand, Lillestrøm, Rælingen and Lørenskog (Chart 5.B). In 2020, the overall rise in prices in the area surrounding Oslo was 5.5%, compared with 4.3% in Oslo proper.3
1 See Lindquist, K.-G., S. Mæhlum, B.H. Vatne and E.G. Wold (2021) “Boligmarkedet i pandemiåret 2020” [The housing market in the pandemic year 2020]. Staff Memo 6/2021. Norges Bank (Norwegian only, but forthcoming in English), Hov, M.G. (2021) “Boligmarkedet under koronakrisen: Lav rente som katalysator” [Housing market during the Corona crisis: Low interest rate as a catalyst]. Norwegian Housing Market Watch (Norwegian only), and Midtgaard, S. (2019) “Monetary Policy and Norwegian Housing Prices: An Empirical Analysis”. Master’s thesis. University of Oslo.
2 See Lindquist, K.-G., S. Mæhlum, B.H. Vatne and E.G. Wold (2021) “Boligmarkedet i pandemiåret 2020” [The housing market in the pandemic year 2020]. Staff Memo 6/2021. Norges Bank (Norwegian only, but forthcoming in English).
3 The area surrounding Oslo comprises Rælingen, Lillestrøm, Nordre Follo, Lørenskog, Nesodden, Nittedal, Asker and Bærum municipalities (Chart 5.B).
Chart 5.A Oslo’s contribution to house price inflation not abnormally high during the pandemicHouse prices. 12-month change in Norway and Oslo’s contribution in periods of high house price inflation. Percent
2004 2008 2012 2016 2020
0
25
50
0
25
5012-month change
Oslo's contribution to 12-month change
Sources: Real Estate Norway and Norges Bank
62
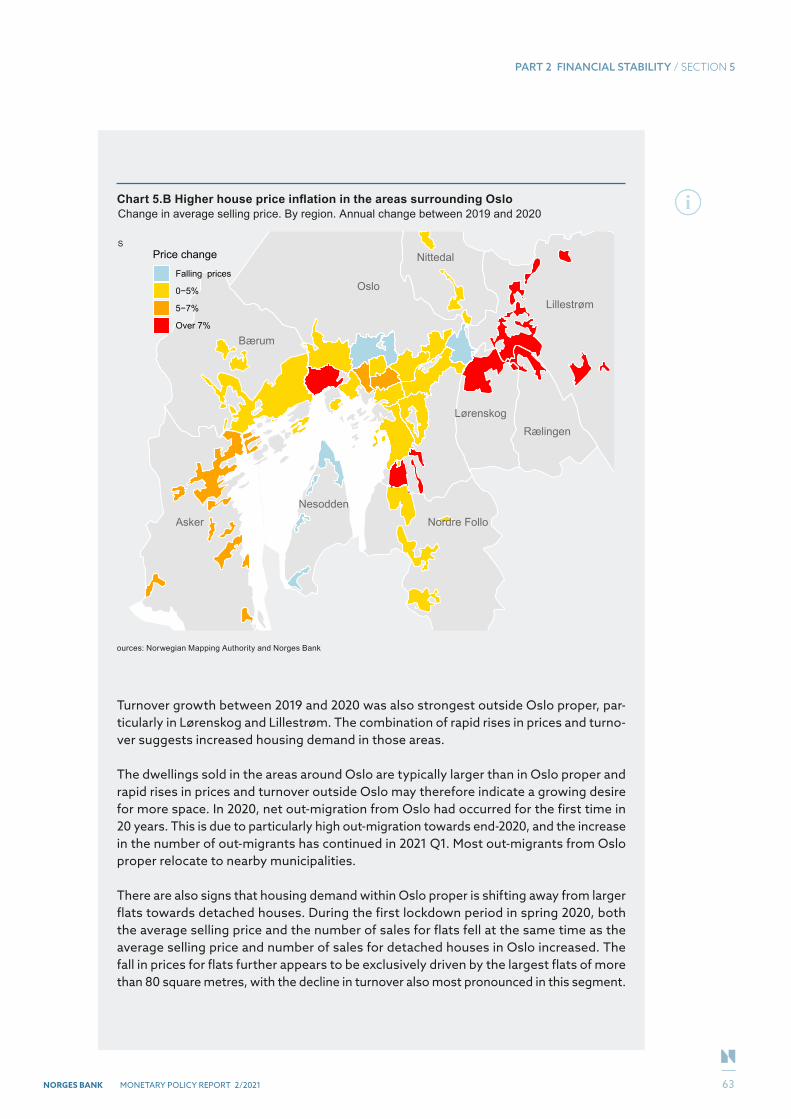
NORGES BANK MONETARY POLICY REPORT 2/2021
PART 2 FINANCIAL STABILITY / SECTION 5
Turnover growth between 2019 and 2020 was also strongest outside Oslo proper, par-ticularly in Lørenskog and Lillestrøm. The combination of rapid rises in prices and turno-ver suggests increased housing demand in those areas.
The dwellings sold in the areas around Oslo are typically larger than in Oslo proper and rapid rises in prices and turnover outside Oslo may therefore indicate a growing desire for more space. In 2020, net out-migration from Oslo had occurred for the first time in 20 years. This is due to particularly high out-migration towards end-2020, and the increase in the number of out-migrants has continued in 2021 Q1. Most out-migrants from Oslo proper relocate to nearby municipalities.
There are also signs that housing demand within Oslo proper is shifting away from larger flats towards detached houses. During the first lockdown period in spring 2020, both the average selling price and the number of sales for flats fell at the same time as the average selling price and number of sales for detached houses in Oslo increased. The fall in prices for flats further appears to be exclusively driven by the largest flats of more than 80 square metres, with the decline in turnover also most pronounced in this segment.
Chart 5.B Higher house price inflation in the areas surrounding OsloChange in average selling price. By region. Annual change between 2019 and 2020
S
Lillestrøm
Nittedal
Bærum
Nordre FolloNesodden
Lørenskog
Asker
Rælingen
Oslo
Price changeFalling prices
0−5%
5−7%
Over 7%
ources: Norwegian Mapping Authority and Norges Bank
63
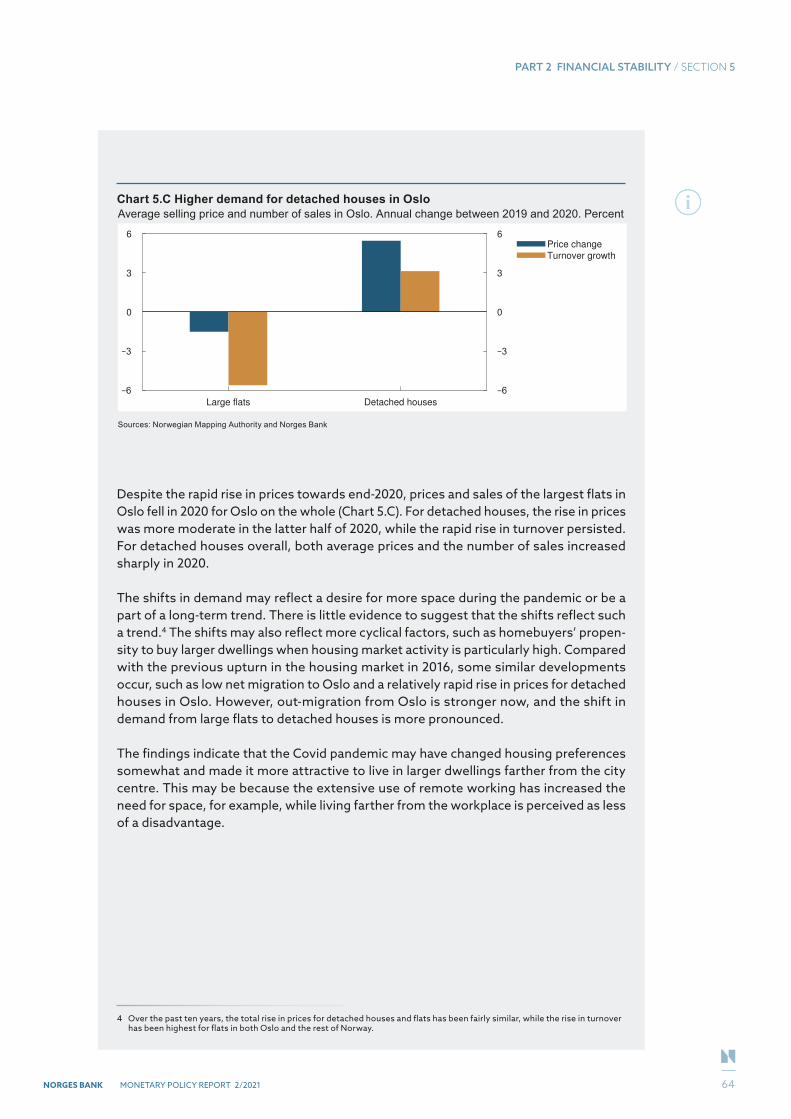
NORGES BANK MONETARY POLICY REPORT 2/2021
PART 2 FINANCIAL STABILITY / SECTION 5
Despite the rapid rise in prices towards end-2020, prices and sales of the largest flats in Oslo fell in 2020 for Oslo on the whole (Chart 5.C). For detached houses, the rise in prices was more moderate in the latter half of 2020, while the rapid rise in turnover persisted. For detached houses overall, both average prices and the number of sales increased sharply in 2020.
The shifts in demand may reflect a desire for more space during the pandemic or be a part of a long-term trend. There is little evidence to suggest that the shifts reflect such a trend.4 The shifts may also reflect more cyclical factors, such as homebuyers’ propen-sity to buy larger dwellings when housing market activity is particularly high. Compared with the previous upturn in the housing market in 2016, some similar developments occur, such as low net migration to Oslo and a relatively rapid rise in prices for detached houses in Oslo. However, out-migration from Oslo is stronger now, and the shift in demand from large flats to detached houses is more pronounced.
The findings indicate that the Covid pandemic may have changed housing preferences somewhat and made it more attractive to live in larger dwellings farther from the city centre. This may be because the extensive use of remote working has increased the need for space, for example, while living farther from the workplace is perceived as less of a disadvantage.
4 Over the past ten years, the total rise in prices for detached houses and flats has been fairly similar, while the rise in turnover has been highest for flats in both Oslo and the rest of Norway.
Chart 5.C Higher demand for detached houses in OsloAverage selling price and number of sales in Oslo. Annual change between 2019 and 2020. Percent
Large flats Detached houses
0
3
6
0
3
6Price change
Turnover growth
Sources: Norwegian Mapping Authority and Norges Bank
64
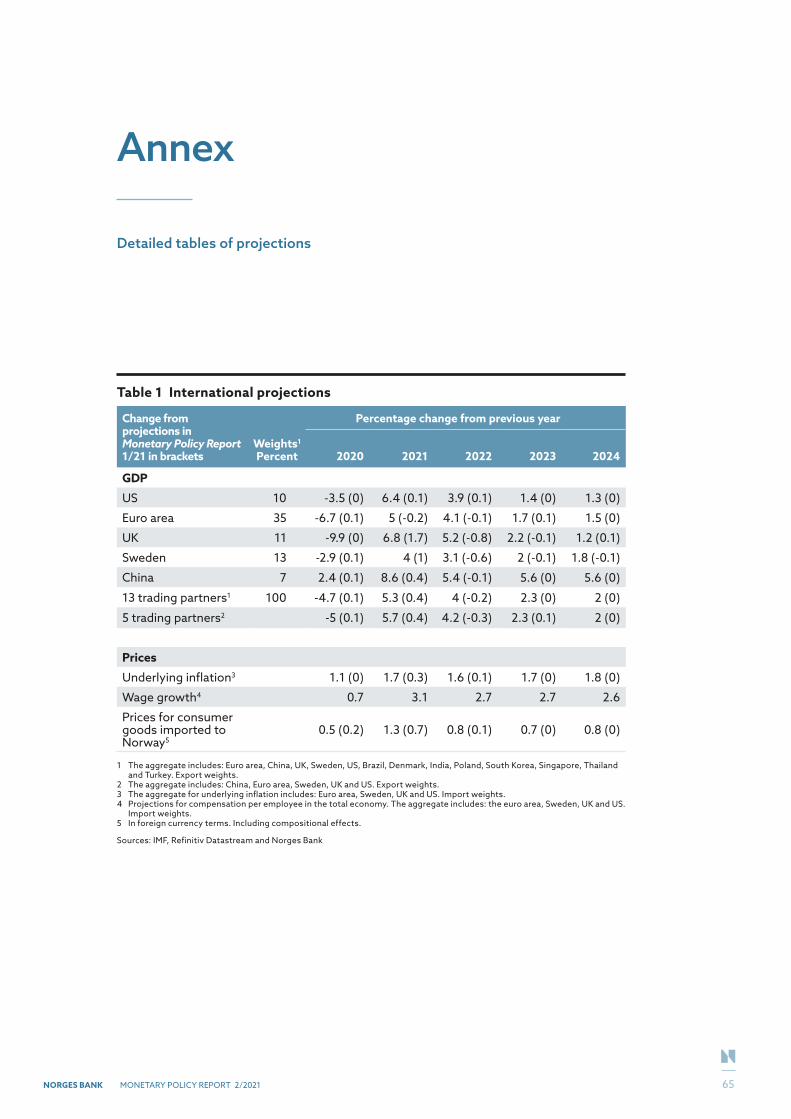
NORGES BANK MONETARY POLICY REPORT 2/2021
Annex
Detailed tables of projections
Table 1 International projections
Change from projections in Monetary Policy Report 1/21 in brackets
Weights1
Percent
Percentage change from previous year
2020 2021 2022 2023 2024
GDP
US 10 -3.5 (0) 6.4 (0.1) 3.9 (0.1) 1.4 (0) 1.3 (0)
Euro area 35 -6.7 (0.1) 5 (-0.2) 4.1 (-0.1) 1.7 (0.1) 1.5 (0)
UK 11 -9.9 (0) 6.8 (1.7) 5.2 (-0.8) 2.2 (-0.1) 1.2 (0.1)
Sweden 13 -2.9 (0.1) 4 (1) 3.1 (-0.6) 2 (-0.1) 1.8 (-0.1)
China 7 2.4 (0.1) 8.6 (0.4) 5.4 (-0.1) 5.6 (0) 5.6 (0)
13 trading partners1 100 -4.7 (0.1) 5.3 (0.4) 4 (-0.2) 2.3 (0) 2 (0)
5 trading partners2 -5 (0.1) 5.7 (0.4) 4.2 (-0.3) 2.3 (0.1) 2 (0)
Prices
Underlying inflation3 1.1 (0) 1.7 (0.3) 1.6 (0.1) 1.7 (0) 1.8 (0)
Wage growth4 0.7 3.1 2.7 2.7 2.6
Prices for consumer goods imported to Norway5
0.5 (0.2) 1.3 (0.7) 0.8 (0.1) 0.7 (0) 0.8 (0)
1 The aggregate includes: Euro area, China, UK, Sweden, US, Brazil, Denmark, India, Poland, South Korea, Singapore, Thailand and Turkey. Export weights.
2 The aggregate includes: China, Euro area, Sweden, UK and US. Export weights.3 The aggregate for underlying inflation includes: Euro area, Sweden, UK and US. Import weights.4 Projections for compensation per employee in the total economy. The aggregate includes: the euro area, Sweden, UK and US.
Import weights.5 In foreign currency terms. Including compositional effects.
Sources: IMF, Refinitiv Datastream and Norges Bank
65
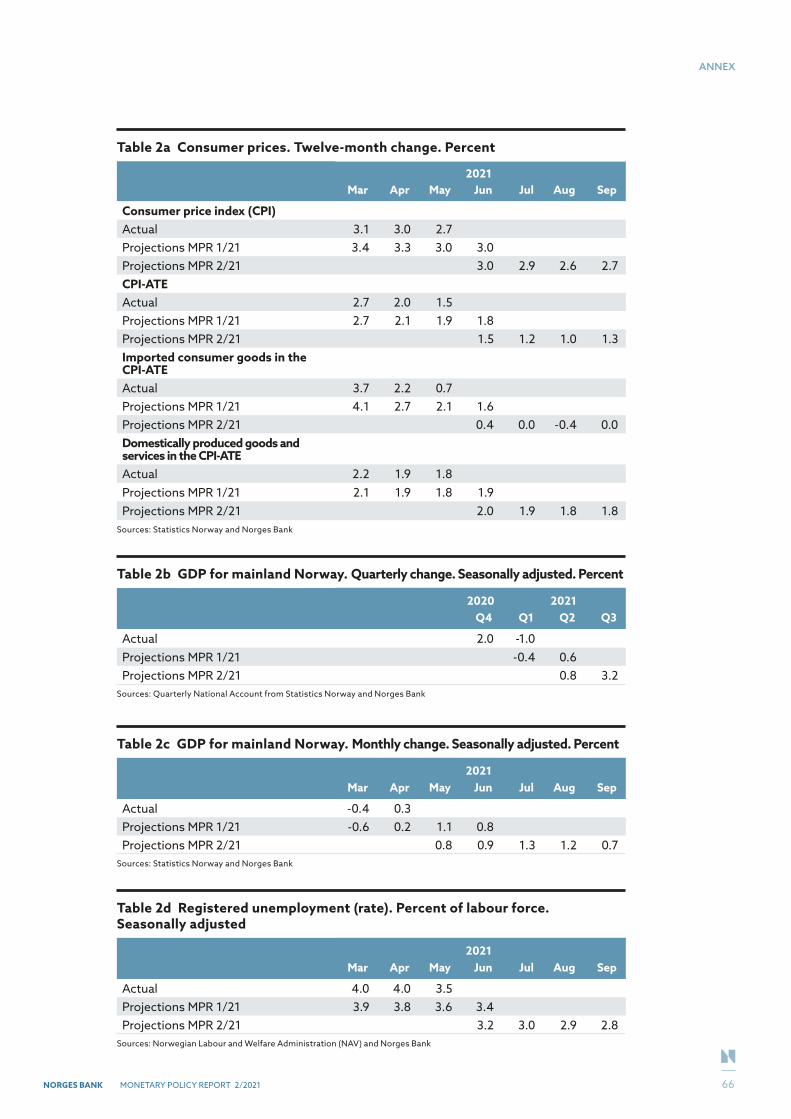
NORGES BANK MONETARY POLICY REPORT 2/2021
ANNEX
Table 2a Consumer prices. Twelve-month change. Percent
2021Mar Apr May Jun Jul Aug Sep
Consumer price index (CPI)Actual 3.1 3.0 2.7Projections MPR 1/21 3.4 3.3 3.0 3.0Projections MPR 2/21 3.0 2.9 2.6 2.7CPI-ATEActual 2.7 2.0 1.5Projections MPR 1/21 2.7 2.1 1.9 1.8Projections MPR 2/21 1.5 1.2 1.0 1.3Imported consumer goods in the CPI-ATEActual 3.7 2.2 0.7Projections MPR 1/21 4.1 2.7 2.1 1.6Projections MPR 2/21 0.4 0.0 -0.4 0.0Domestically produced goods and services in the CPI-ATEActual 2.2 1.9 1.8Projections MPR 1/21 2.1 1.9 1.8 1.9Projections MPR 2/21 2.0 1.9 1.8 1.8
Sources: Statistics Norway and Norges Bank
Table 2b GDP for mainland Norway. Quarterly change. Seasonally adjusted. Percent
2020 2021Q4 Q1 Q2 Q3
Actual 2.0 -1.0Projections MPR 1/21 -0.4 0.6Projections MPR 2/21 0.8 3.2
Sources: Quarterly National Account from Statistics Norway and Norges Bank
Table 2c GDP for mainland Norway. Monthly change. Seasonally adjusted. Percent
2021Mar Apr May Jun Jul Aug Sep
Actual -0.4 0.3Projections MPR 1/21 -0.6 0.2 1.1 0.8Projections MPR 2/21 0.8 0.9 1.3 1.2 0.7
Sources: Statistics Norway and Norges Bank
Table 2d Registered unemployment (rate). Percent of labour force. Seasonally adjusted
2021Mar Apr May Jun Jul Aug Sep
Actual 4.0 4.0 3.5Projections MPR 1/21 3.9 3.8 3.6 3.4Projections MPR 2/21 3.2 3.0 2.9 2.8
Sources: Norwegian Labour and Welfare Administration (NAV) and Norges Bank
66
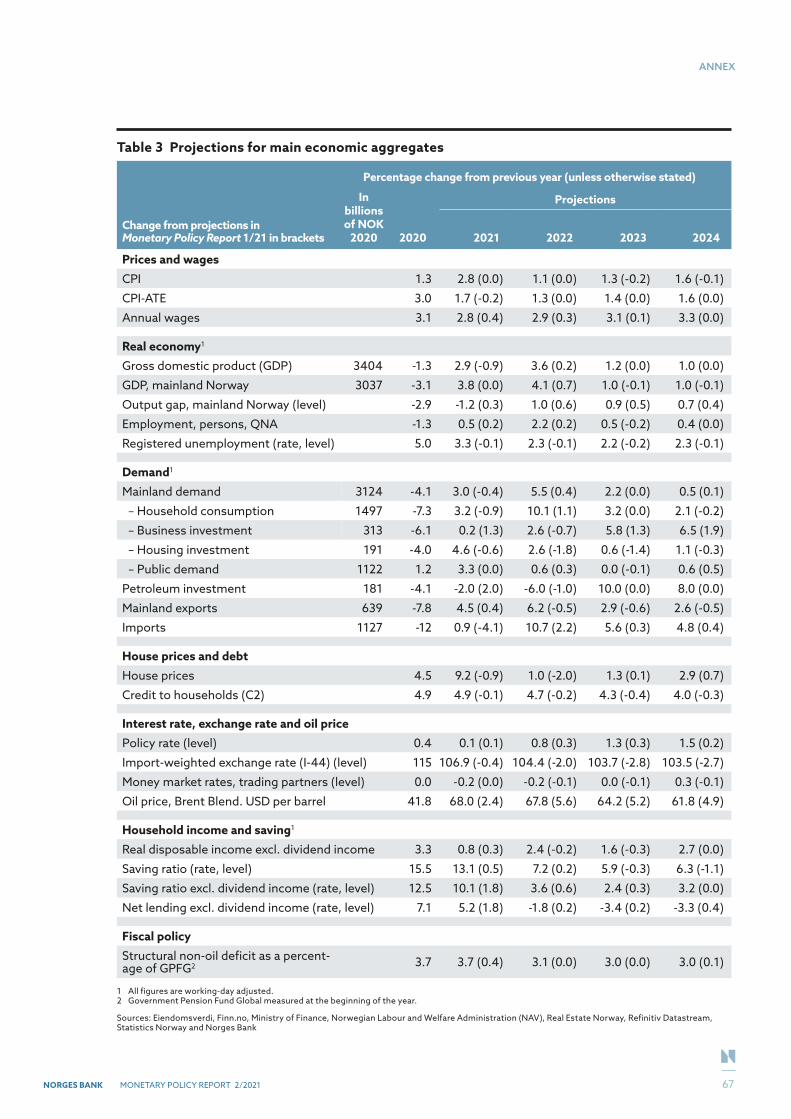
NORGES BANK MONETARY POLICY REPORT 2/2021
ANNEX
Table 3 Projections for main economic aggregates
Change from projections in Monetary Policy Report 1/21 in brackets
Percentage change from previous year (unless otherwise stated)
In billions of NOK
2020
Projections
2020 2021 2022 2023 2024
Prices and wages
CPI 1.3 2.8 (0.0) 1.1 (0.0) 1.3 (-0.2) 1.6 (-0.1)
CPI-ATE 3.0 1.7 (-0.2) 1.3 (0.0) 1.4 (0.0) 1.6 (0.0)
Annual wages 3.1 2.8 (0.4) 2.9 (0.3) 3.1 (0.1) 3.3 (0.0)
Real economy1
Gross domestic product (GDP) 3404 -1.3 2.9 (-0.9) 3.6 (0.2) 1.2 (0.0) 1.0 (0.0)
GDP, mainland Norway 3037 -3.1 3.8 (0.0) 4.1 (0.7) 1.0 (-0.1) 1.0 (-0.1)
Output gap, mainland Norway (level) -2.9 -1.2 (0.3) 1.0 (0.6) 0.9 (0.5) 0.7 (0.4)
Employment, persons, QNA -1.3 0.5 (0.2) 2.2 (0.2) 0.5 (-0.2) 0.4 (0.0)
Registered unemployment (rate, level) 5.0 3.3 (-0.1) 2.3 (-0.1) 2.2 (-0.2) 2.3 (-0.1)
Demand1
Mainland demand 3124 -4.1 3.0 (-0.4) 5.5 (0.4) 2.2 (0.0) 0.5 (0.1)
– Household consumption 1497 -7.3 3.2 (-0.9) 10.1 (1.1) 3.2 (0.0) 2.1 (-0.2)
– Business investment 313 -6.1 0.2 (1.3) 2.6 (-0.7) 5.8 (1.3) 6.5 (1.9)
– Housing investment 191 -4.0 4.6 (-0.6) 2.6 (-1.8) 0.6 (-1.4) 1.1 (-0.3)
– Public demand 1122 1.2 3.3 (0.0) 0.6 (0.3) 0.0 (-0.1) 0.6 (0.5)
Petroleum investment 181 -4.1 -2.0 (2.0) -6.0 (-1.0) 10.0 (0.0) 8.0 (0.0)
Mainland exports 639 -7.8 4.5 (0.4) 6.2 (-0.5) 2.9 (-0.6) 2.6 (-0.5)
Imports 1127 -12 0.9 (-4.1) 10.7 (2.2) 5.6 (0.3) 4.8 (0.4)
House prices and debt
House prices 4.5 9.2 (-0.9) 1.0 (-2.0) 1.3 (0.1) 2.9 (0.7)
Credit to households (C2) 4.9 4.9 (-0.1) 4.7 (-0.2) 4.3 (-0.4) 4.0 (-0.3)
Interest rate, exchange rate and oil price
Policy rate (level) 0.4 0.1 (0.1) 0.8 (0.3) 1.3 (0.3) 1.5 (0.2)
Import-weighted exchange rate (I-44) (level) 115 106.9 (-0.4) 104.4 (-2.0) 103.7 (-2.8) 103.5 (-2.7)
Money market rates, trading partners (level) 0.0 -0.2 (0.0) -0.2 (-0.1) 0.0 (-0.1) 0.3 (-0.1)
Oil price, Brent Blend. USD per barrel 41.8 68.0 (2.4) 67.8 (5.6) 64.2 (5.2) 61.8 (4.9)
Household income and saving1
Real disposable income excl. dividend income 3.3 0.8 (0.3) 2.4 (-0.2) 1.6 (-0.3) 2.7 (0.0)
Saving ratio (rate, level) 15.5 13.1 (0.5) 7.2 (0.2) 5.9 (-0.3) 6.3 (-1.1)
Saving ratio excl. dividend income (rate, level) 12.5 10.1 (1.8) 3.6 (0.6) 2.4 (0.3) 3.2 (0.0)
Net lending excl. dividend income (rate, level) 7.1 5.2 (1.8) -1.8 (0.2) -3.4 (0.2) -3.3 (0.4)
Fiscal policy
Structural non-oil deficit as a percent-age of GPFG2 3.7 3.7 (0.4) 3.1 (0.0) 3.0 (0.0) 3.0 (0.1)
1 All figures are working-day adjusted.2 Government Pension Fund Global measured at the beginning of the year.
Sources: Eiendomsverdi, Finn.no, Ministry of Finance, Norwegian Labour and Welfare Administration (NAV), Real Estate Norway, Refinitiv Datastream, Statistics Norway and Norges Bank
67

Design: BrandlabLayout: 07 Media ASThe text is set in 9.5 pt Azo Sans RegularISSN: 1894-0250 (online)
NORGES BANKBankplassen 2, P.O. Box 1179 Sentrum, N-0107 Oslo, NorwayPhone: +47 22316000www.norges-bank.no
Monetary Policy Report 2|21 – June


