www.pwc.com/globalmoneytree www.pwc.in PricewaterhouseCoopers India Pvt Ltd MoneyTree TM India Report Q1 2016 Technology Institute This special report provides summary results of Q1 ’15, Q4 ’15 and Q1 ’16 Data provided by Venture Intelligence
Transcript
www.pwc.com/globalmoneytree www.pwc.in
PricewaterhouseCoopers India Pvt Ltd
MoneyTreeTM India Report Q1 2016
Technology Institute
This special report provides summary results of Q1 ’15, Q4 ’15 and Q1 ’16
Data provided by Venture Intelligence
PwC MoneyTreeTM India Report – Q1 ’16 2
Table of contents
1. Overview 3 2 Analysis of PE investments 4
Total equity investments in PE-backed companies 4 Investments by industry 5 Investments by stage of development 8 Investments by region 9 Top 20 PE deals 10
3. Analysis of PE exits 11 Total PE exits 11 Exits by industry 12 Exits by type 13 Top five PE exits 14
4. Active PE firms 15 5. Sector focus: IT & ITeS sector 16
Total PE investments 17 Investments by stage of development 19 Investments by region 20 Investments by subsector 21 PE exits in the sector 22
Definitions 23
PwC MoneyTreeTM India Report – Q1 ’16 3
1. Overview
The first quarter of 2016 has started the year off well with 3.1 billion USD investments in 160 deals, underlining the continued heightened interest of private equity in India. The IT & ITeS sector attracted 1.26 billion in 92 deals to dominate among other sectors.
Despite the absence of appetite for big deals in e-tail, the IT sector recorded a surge of 18% over Q1’15 in terms of value. Among the e-tailers, Snapdeal raised 200 million USD in a funding round led by Ontario Teachers’ Pension fund while Shopclues raised 100 million USD from GIC, Tiger Global and others. Investments in Bill Desk (150 Million USD), Big Basket (150 million USD), and Cartrade.com (145 million USD) were the other significant deals.
Unlike last year, which saw record high venture capital deals, this year VC investment has been more muted, resulting in deal volume in the early stage being lower than corresponding previous quarters. The first quarter of the year saw 152 million USD in 83 early-stage deals as compared to 303 million USD in 101 deals in Q1’15. In Q4’15, it was 284 million USD in 100 deals. Interestingly, there is an increased participation by domestic Indian investors to provide seed money. Ratan Tata alone made 11 investments in this quarter.
NBFCs (non-banking financial companies) continue to attract private equity interest, although one wonders if Fairbridge Capital’s 321 million USD investment in Bangalore Airport is a sign of revival in Infrastructure.
The first quarter of the year saw record exits, with this quarter becoming the best Q1 for exits since we began tracking in 2004. Total exits in this quarter aggregated 2.5 billion USD across 35 deals. This was mainly fueled by the manufacturing sector (1.27 billion USD in 4 exits), with the exit of KKR from Alliance Tyres being the biggest with 1.05 billion USD. This could represent a more strategic interest in manufacturing assets owned by PEs.
In the coming quarters we expect the momentum to continue, provided the monsoon season remains normal. Otherwise, without a doubt Indian macros will be affected, resulting in a cascading effect on private equity investments.
Sanjeev Krishan Leader, Private Equity and Transaction Services PwC India
PwC MoneyTreeTM India Report – Q1 ’16 4
2. Analysis of PE investments
Total equity investments in PE-backed companies
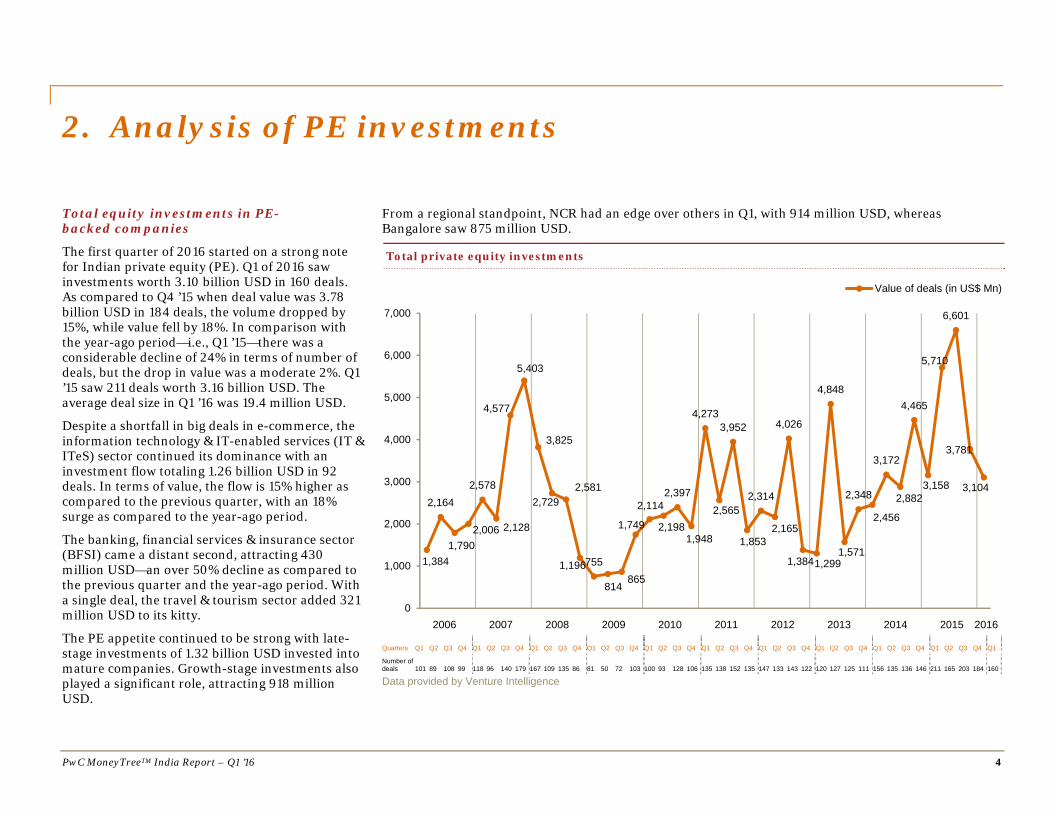
The first quarter of 2016 started on a strong note for Indian private equity (PE). Q1 of 2016 saw investments worth 3.10 billion USD in 160 deals. As compared to Q4 ’15 when deal value was 3.78 billion USD in 184 deals, the volume dropped by 15%, while value fell by 18%. In comparison with the year-ago period—i.e., Q1 ’15—there was a considerable decline of 24% in terms of number of deals, but the drop in value was a moderate 2%. Q1 ’15 saw 211 deals worth 3.16 billion USD. The average deal size in Q1 ’16 was 19.4 million USD.
Despite a shortfall in big deals in e-commerce, the information technology & IT-enabled services (IT & ITeS) sector continued its dominance with an investment flow totaling 1.26 billion USD in 92 deals. In terms of value, the flow is 15% higher as compared to the previous quarter, with an 18% surge as compared to the year-ago period.
The banking, financial services & insurance sector (BFSI) came a distant second, attracting 430 million USD—an over 50% decline as compared to the previous quarter and the year-ago period. With a single deal, the travel & tourism sector added 321 million USD to its kitty.
The PE appetite continued to be strong with late-stage investments of 1.32 billion USD invested into mature companies. Growth-stage investments also played a significant role, attracting 918 million USD.
From a regional standpoint, NCR had an edge over others in Q1, with 914 million USD, whereas Bangalore saw 875 million USD.
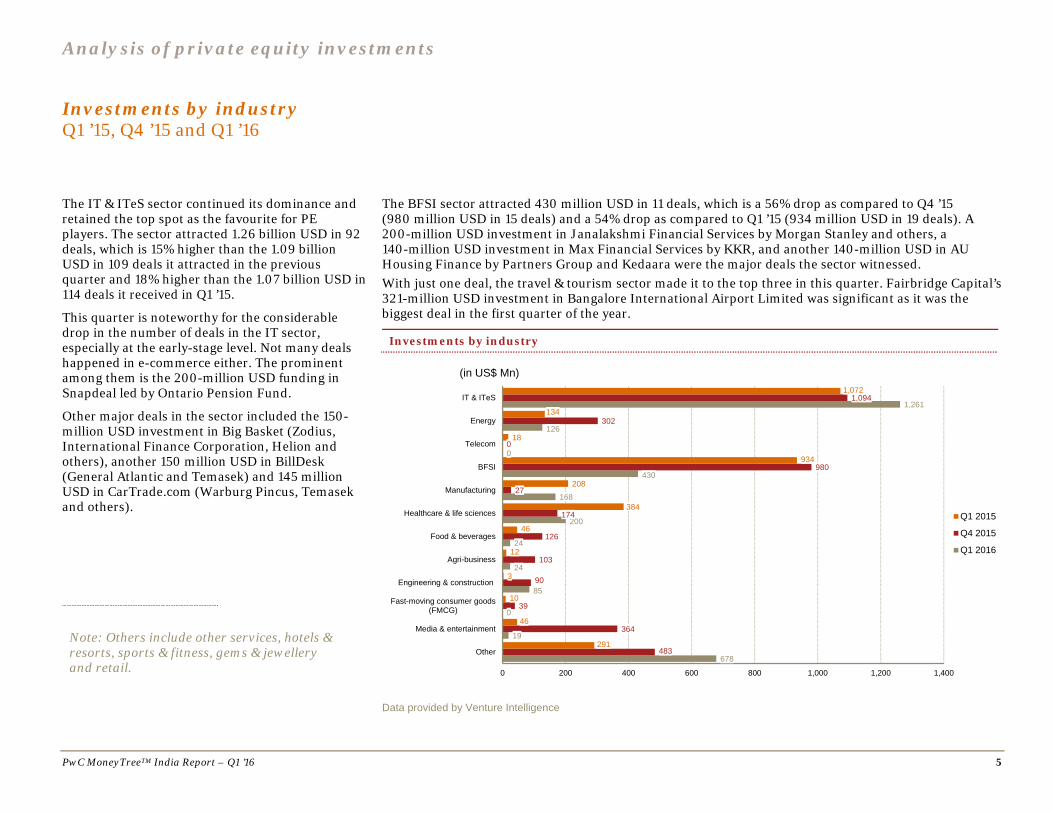
The IT & ITeS sector continued its dominance and retained the top spot as the favourite for PE players. The sector attracted 1.26 billion USD in 92 deals, which is 15% higher than the 1.09 billion USD in 109 deals it attracted in the previous quarter and 18% higher than the 1.07 billion USD in 114 deals it received in Q1 ’15.
This quarter is noteworthy for the considerable drop in the number of deals in the IT sector, especially at the early-stage level. Not many deals happened in e-commerce either. The prominent among them is the 200-million USD funding in Snapdeal led by Ontario Pension Fund.
Other major deals in the sector included the 150-million USD investment in Big Basket (Zodius, International Finance Corporation, Helion and others), another 150 million USD in BillDesk (General Atlantic and Temasek) and 145 million USD in CarTrade.com (Warburg Pincus, Temasek and others).
The BFSI sector attracted 430 million USD in 11 deals, which is a 56% drop as compared to Q4 ’15 (980 million USD in 15 deals) and a 54% drop as compared to Q1 ’15 (934 million USD in 19 deals). A 200-million USD investment in Janalakshmi Financial Services by Morgan Stanley and others, a 140-million USD investment in Max Financial Services by KKR, and another 140-million USD in AU Housing Finance by Partners Group and Kedaara were the major deals the sector witnessed. With just one deal, the travel & tourism sector made it to the top three in this quarter. Fairbridge Capital’s 321-million USD investment in Bangalore International Airport Limited was significant as it was the biggest deal in the first quarter of the year.
Investments by industry
Data provided by Venture Intelligence
678
19
0
85
24
24
200
168
430
0
126
1,261
483
364
39
90
103
126
174
27
980
0
302
1,094
291
46
10
3
12
46
384
208
934
18
134
1,072
0 200 400 600 800 1,000 1,200 1,400
Other
Media & entertainment
Fast-moving consumer goods(FMCG)
Engineering & construction
Agri-business
Food & beverages
Healthcare & life sciences
Manufacturing
BFSI
Telecom
Energy
IT & ITeS
(in US$ Mn)
Q1 2015
Q4 2015
Q1 2016
Note: Others include other services, hotels & resorts, sports & fitness, gems & jewellery and retail.
Analysis of private equity investments
PwC MoneyTreeTM India Report – Q1 ’16 6
Other important sectors in this quarter include energy (216 million USD in four deals), healthcare (200 million USD in 10 deals), education (170 million USD in six deals) and manufacturing (168 million USD in 11 deals).
“The year 2015 saw a strong growth in PE and VC funding, however, the interest of investors in eCommerce and Online businesses has started to see a gradual decline given that the valuations for various stages of funding are expected to be weaker in 2016 as compared to 2015. Driven by the interest rates in the US and declining demand in China, capital is also becoming scarce. The exuberance in the sector has been subdued, and there is increased focus on profitability, with players focusing on cost cutting and business viability as investors are demanding performance. In the coming year, the companies that can make a shift to a more operationally efficient model and generate value will be the ones that are likely to survive.”
Sandeep Ladda Leader, Technology PwC India
“While 2015 was an exciting year for PE deals in financial services, with the advent of new players, products and services, 2016 will continue to see extensive investments, driven by the government’s focus on stabilizing the banking system, sale of stressed assets by banks, the passage of the bankruptcy law and easing FDI (foreign direct investment) norms in the insurance sector. However, some caution will be exercised with the Indian rupee depreciating against the dollar and continuing tax concerns.”
Bharti Gupta Ramola Leader, Financial Services PwC India
Analysis of private equity investments
PwC MoneyTreeTM India Report – Q1 ’16 7
“As the government continues to address project-level issues like land acquisition and environmental clearances, as well as enabling early exits from concessions, more infrastructure assets will become investable. This trend will also be aided as debt restructuring progresses. Renegotiation guidelines being developed by the government can also help to address viability issues.
For new projects, improved public-private partnership models, like the hybrid annuity model, are better aligned with the risk appetite of long-term investors. Thus, sectors like road, rail and inland waterways could attract investors over the next few years.”
Manish B Agarwal Leader, Infrastructure PwC India
Analysis of private equity investments
PwC MoneyTreeTM India Report – Q1 ’16 8
Investments by stage of development Q1 ’15, Q4 ’15 and Q1 ’16
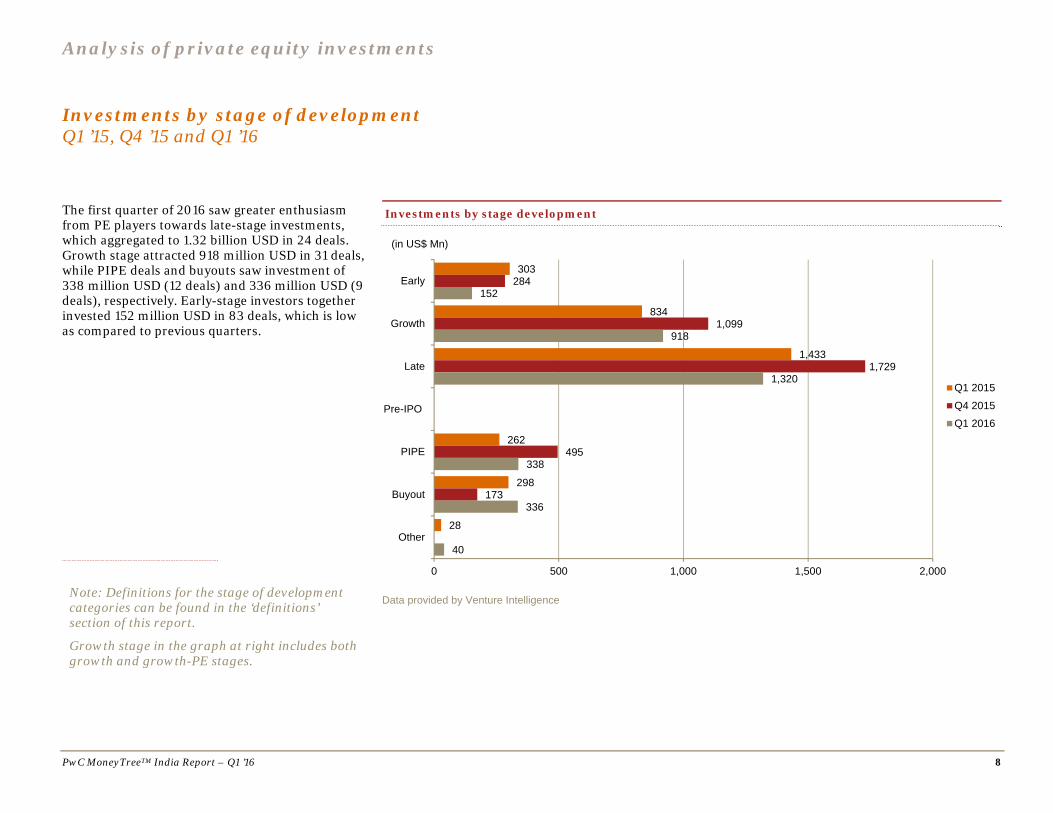
The first quarter of 2016 saw greater enthusiasm from PE players towards late-stage investments, which aggregated to 1.32 billion USD in 24 deals. Growth stage attracted 918 million USD in 31 deals, while PIPE deals and buyouts saw investment of 338 million USD (12 deals) and 336 million USD (9 deals), respectively. Early-stage investors together invested 152 million USD in 83 deals, which is low as compared to previous quarters.
Data provided by Venture Intelligence
303
834
1,433
262
298
28
284
1,099
1,729
495
173
152
918
1,320
338
336
40
0 500 1,000 1,500 2,000
Early
Growth
Late
Pre-IPO
PIPE
Buyout
Other
(in US$ Mn)
Q1 2015
Q4 2015
Q1 2016
Investments by stage development
Note: Definitions for the stage of development categories can be found in the ‘definitions’ section of this report.
Growth stage in the graph at right includes both growth and growth-PE stages.
Analysis of private equity investments
PwC MoneyTreeTM India Report – Q1 ’16 9
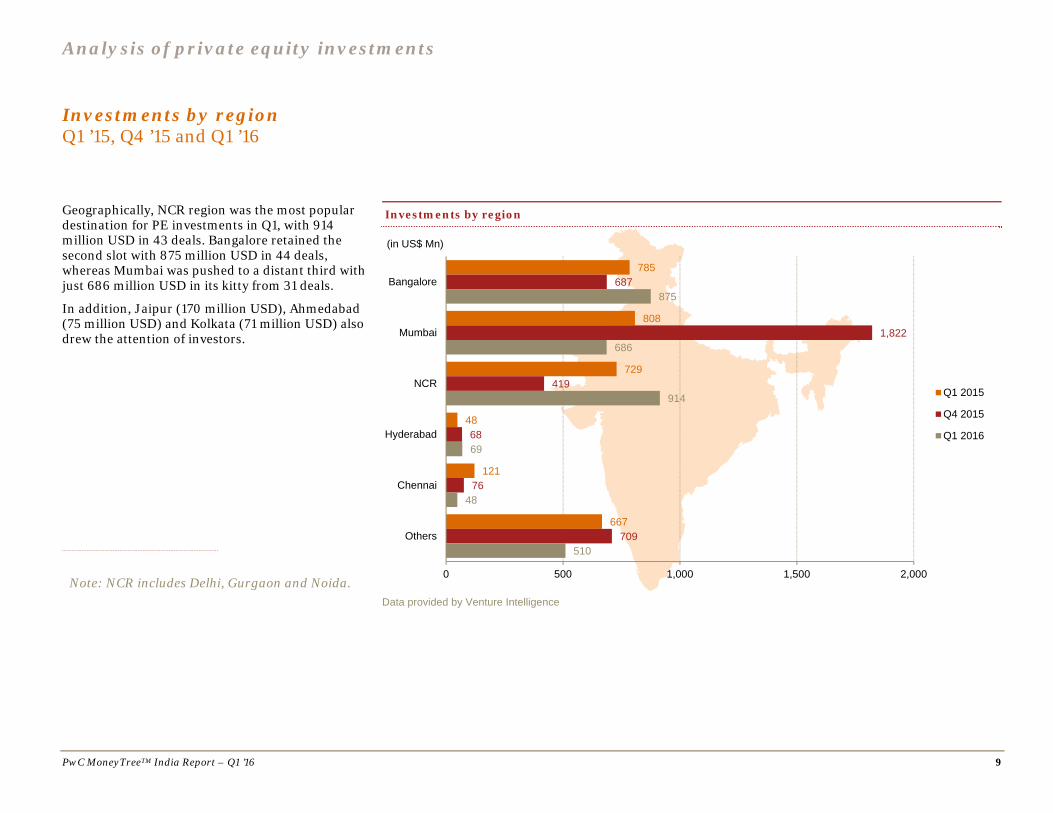
Investments by region Q1 ’15, Q4 ’15 and Q1 ’16
Geographically, NCR region was the most popular destination for PE investments in Q1, with 914 million USD in 43 deals. Bangalore retained the second slot with 875 million USD in 44 deals, whereas Mumbai was pushed to a distant third with just 686 million USD in its kitty from 31 deals.
In addition, Jaipur (170 million USD), Ahmedabad (75 million USD) and Kolkata (71 million USD) also drew the attention of investors.
Data provided by Venture Intelligence
785
808
729
48
121
667
687
1,822
419
68
76
709
875
686
914
69
48
510
0 500 1,000 1,500 2,000
Bangalore
Mumbai
NCR
Hyderabad
Chennai
Others
(in US$ Mn)
Q1 2015
Q4 2015
Q1 2016
Investments by region
Note: NCR includes Delhi, Gurgaon and Noida.
Analysis of private equity investments
PwC MoneyTreeTM India Report – Q1 ’16 10
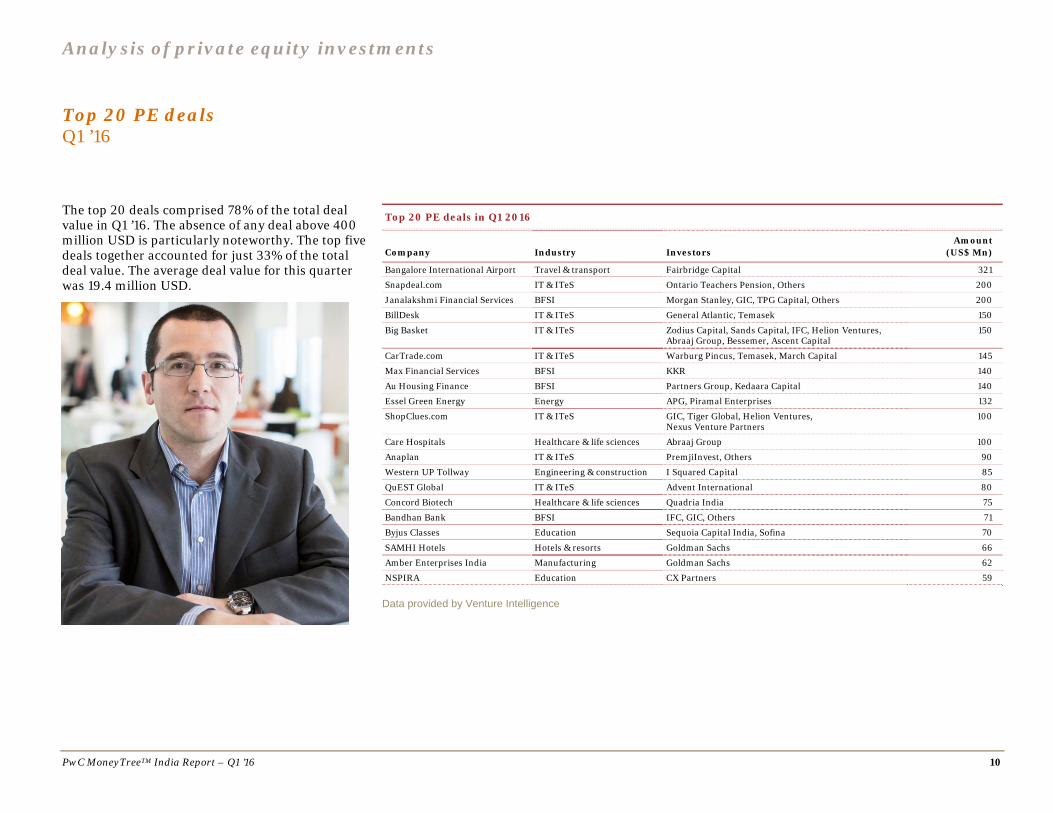
Top 20 PE deals Q1 ’16
The top 20 deals comprised 78% of the total deal value in Q1 ’16. The absence of any deal above 400 million USD is particularly noteworthy. The top five deals together accounted for just 33% of the total deal value. The average deal value for this quarter was 19.4 million USD.
Top 20 PE deals in Q1 2016
Company
Industry
Investors
Amount (US$ Mn)
Bangalore International Airport Travel & transport Fairbridge Capital 321
Snapdeal.com IT & ITeS Ontario Teachers Pension, Others 200
Care Hospitals Healthcare & life sciences Abraaj Group 100
Anaplan IT & ITeS PremjiInvest, Others 90
Western UP Tollway Engineering & construction I Squared Capital 85
QuEST Global IT & ITeS Advent International 80
Concord Biotech Healthcare & life sciences Quadria India 75
Bandhan Bank BFSI IFC, GIC, Others 71
Byjus Classes Education Sequoia Capital India, Sofina 70
SAMHI Hotels Hotels & resorts Goldman Sachs 66
Amber Enterprises India Manufacturing Goldman Sachs 62
NSPIRA Education CX Partners 59
Data provided by Venture Intelligence
PwC MoneyTreeTM India Report – Q1 ’16 11
3. Analysis of PE exits
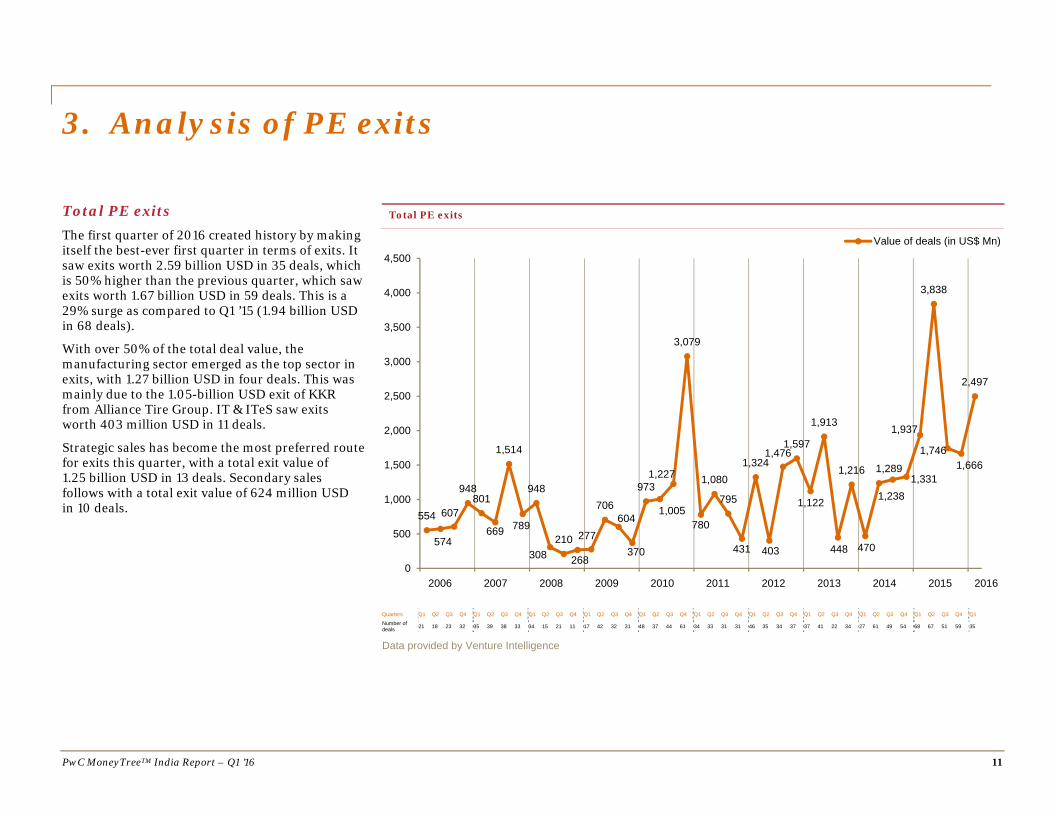
Total PE exits The first quarter of 2016 created history by making itself the best-ever first quarter in terms of exits. It saw exits worth 2.59 billion USD in 35 deals, which is 50% higher than the previous quarter, which saw exits worth 1.67 billion USD in 59 deals. This is a 29% surge as compared to Q1 ’15 (1.94 billion USD in 68 deals).
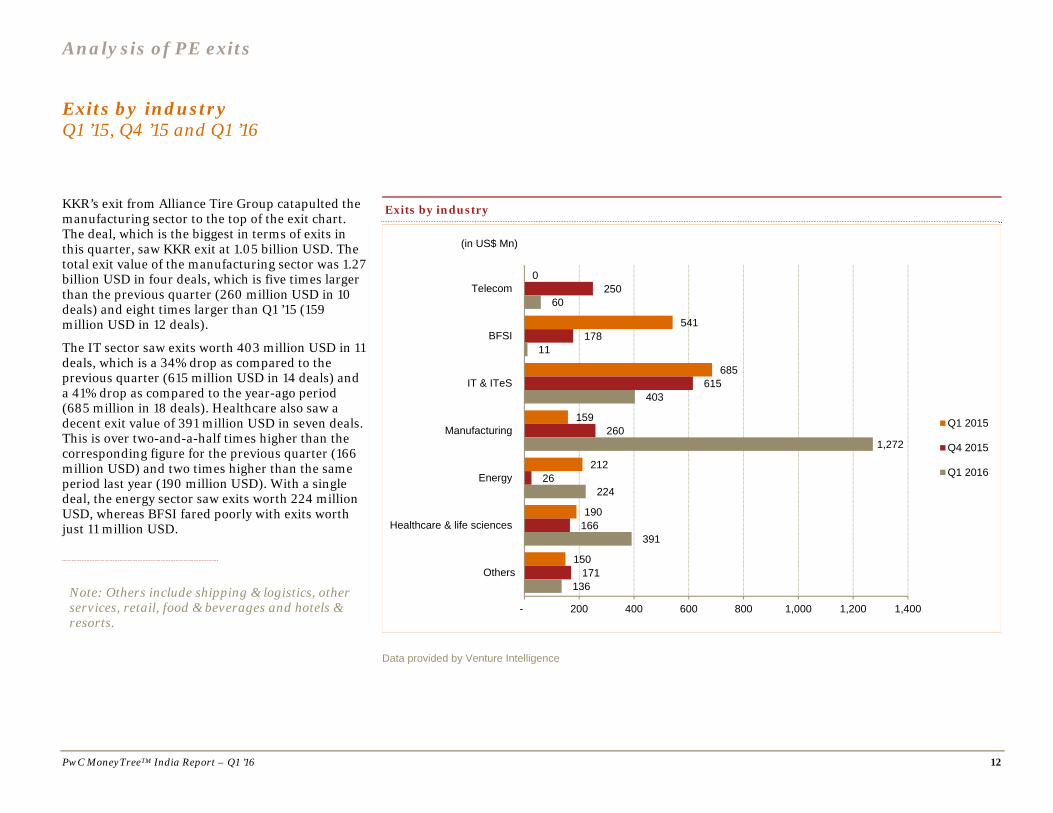
With over 50% of the total deal value, the manufacturing sector emerged as the top sector in exits, with 1.27 billion USD in four deals. This was mainly due to the 1.05-billion USD exit of KKR from Alliance Tire Group. IT & ITeS saw exits worth 403 million USD in 11 deals.
Strategic sales has become the most preferred route for exits this quarter, with a total exit value of 1.25 billion USD in 13 deals. Secondary sales follows with a total exit value of 624 million USD in 10 deals.
KKR’s exit from Alliance Tire Group catapulted the manufacturing sector to the top of the exit chart. The deal, which is the biggest in terms of exits in this quarter, saw KKR exit at 1.05 billion USD. The total exit value of the manufacturing sector was 1.27 billion USD in four deals, which is five times larger than the previous quarter (260 million USD in 10 deals) and eight times larger than Q1 ’15 (159 million USD in 12 deals).
The IT sector saw exits worth 403 million USD in 11 deals, which is a 34% drop as compared to the previous quarter (615 million USD in 14 deals) and a 41% drop as compared to the year-ago period (685 million in 18 deals). Healthcare also saw a decent exit value of 391 million USD in seven deals. This is over two-and-a-half times higher than the corresponding figure for the previous quarter (166 million USD) and two times higher than the same period last year (190 million USD). With a single deal, the energy sector saw exits worth 224 million USD, whereas BFSI fared poorly with exits worth just 11 million USD.
Data provided by Venture Intelligence
0
541
685
159
212
190
150
250
178
615
260
26
166
171
60
11
403
1,272
224
391
136
- 200 400 600 800 1,000 1,200 1,400
Telecom
BFSI
IT & ITeS
Manufacturing
Energy
Healthcare & life sciences
Others
(in US$ Mn)
Q1 2015
Q4 2015
Q1 2016
Note: Others include shipping & logistics, other services, retail, food & beverages and hotels & resorts.
Exits by industry
Analysis of PE exits
PwC MoneyTreeTM India Report – Q1 ’16 13
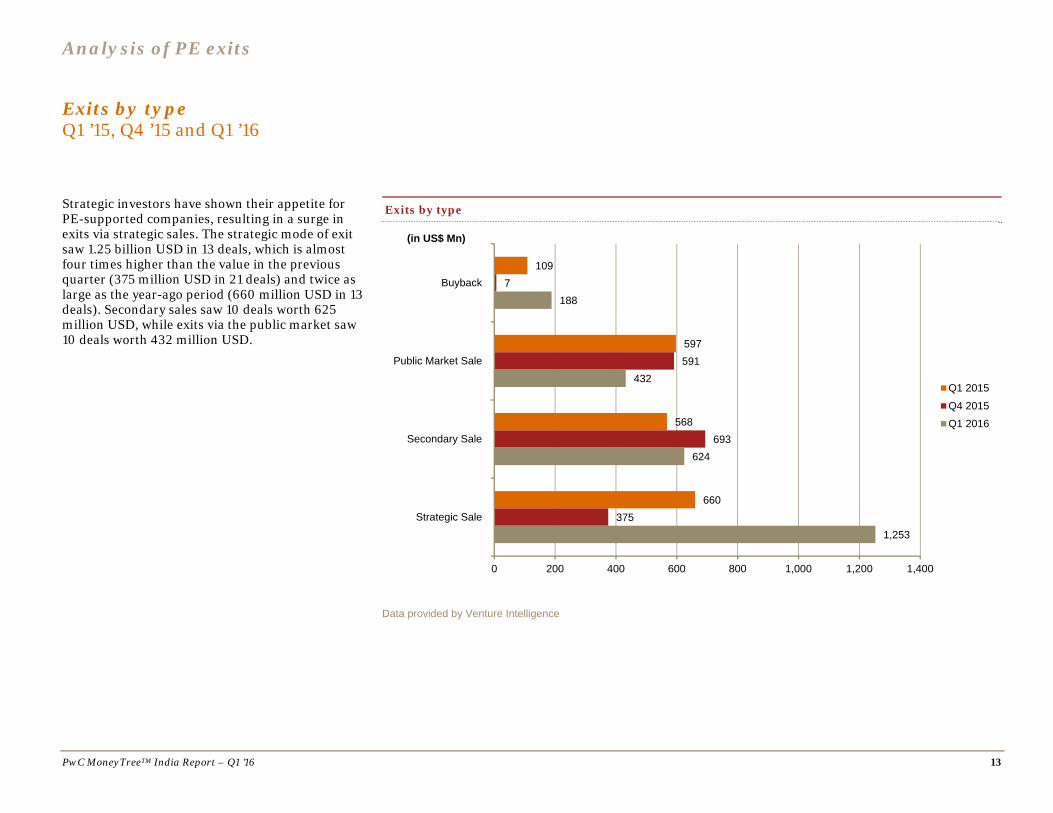
Exits by type Q1 ’15, Q4 ’15 and Q1 ’16
Strategic investors have shown their appetite for PE-supported companies, resulting in a surge in exits via strategic sales. The strategic mode of exit saw 1.25 billion USD in 13 deals, which is almost four times higher than the value in the previous quarter (375 million USD in 21 deals) and twice as large as the year-ago period (660 million USD in 13 deals). Secondary sales saw 10 deals worth 625 million USD, while exits via the public market saw 10 deals worth 432 million USD.
Data provided by Venture Intelligence
109
597
568
660
7
591
693
375
188
432
624
1,253
0 200 400 600 800 1,000 1,200 1,400
Buyback
Public Market Sale
Secondary Sale
Strategic Sale
(in US$ Mn)
Q1 2015
Q4 2015
Q1 2016
Exits by type
Analysis of PE exits
PwC MoneyTreeTM India Report – Q1 ’16 14
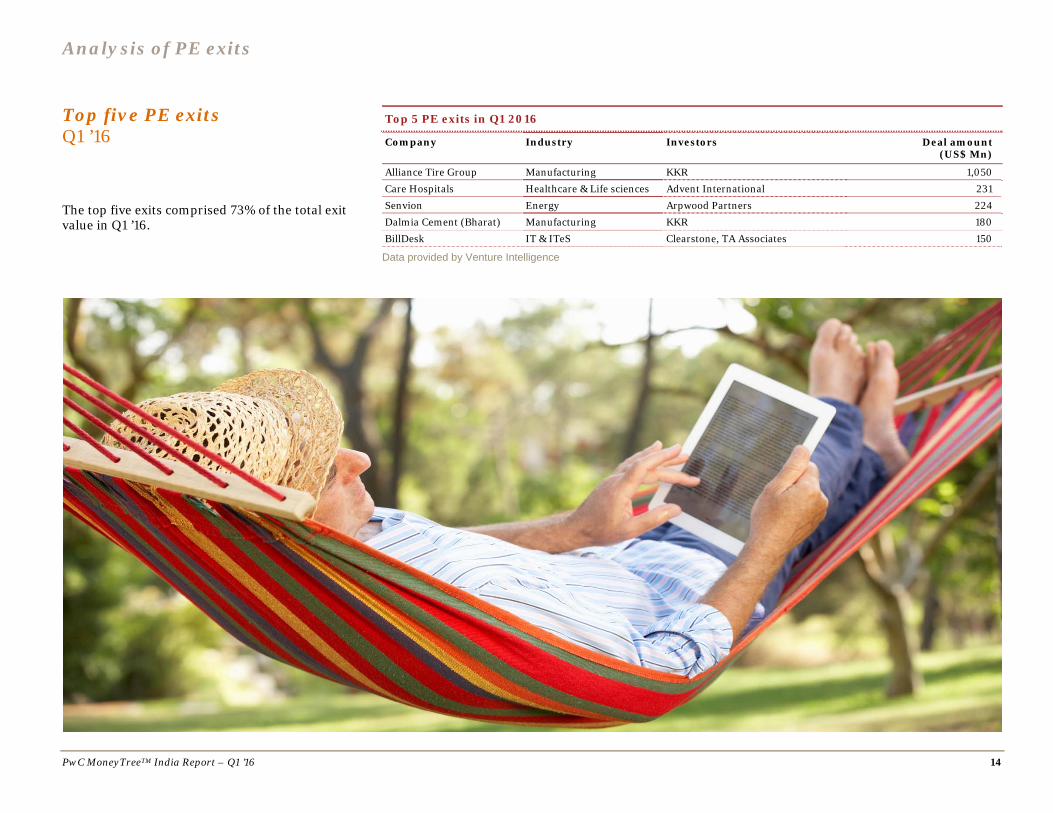
Top five PE exits Q1 ’16
The top five exits comprised 73% of the total exit value in Q1 ’16.
Top 5 PE exits in Q1 2016
Company Industry Investors Deal amount (US$ Mn)
Alliance Tire Group Manufacturing KKR 1,050 Care Hospitals Healthcare & Life sciences Advent International 231
Senvion Energy Arpwood Partners 224 Dalmia Cement (Bharat) Manufacturing KKR 180 BillDesk IT & ITeS Clearstone, TA Associates 150
Data provided by Venture Intelligence
PwC MoneyTreeTM India Report – Q1 ’16 15
4. Active PE firms
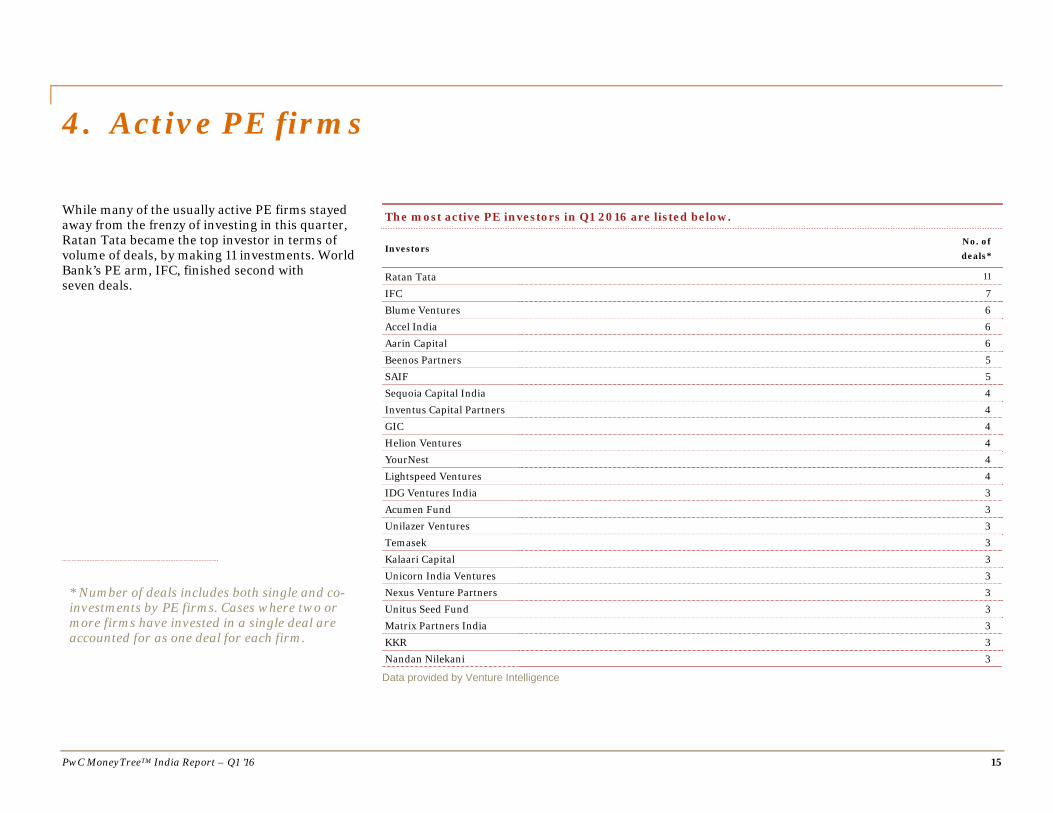
While many of the usually active PE firms stayed away from the frenzy of investing in this quarter, Ratan Tata became the top investor in terms of volume of deals, by making 11 investments. World Bank’s PE arm, IFC, finished second with seven deals.
The most active PE investors in Q1 2016 are listed below.
Investors No. of deals*
Ratan Tata 11
IFC 7 Blume Ventures 6 Accel India 6 Aarin Capital 6
Beenos Partners 5 SAIF 5 Sequoia Capital India 4 Inventus Capital Partners 4 GIC 4 Helion Ventures 4 YourNest 4
Lightspeed Ventures 4 IDG Ventures India 3 Acumen Fund 3 Unilazer Ventures 3 Temasek 3 Kalaari Capital 3
Unicorn India Ventures 3 Nexus Venture Partners 3 Unitus Seed Fund 3 Matrix Partners India 3 KKR 3 Nandan Nilekani 3
Data provided by Venture Intelligence
* Number of deals includes both single and co-investments by PE firms. Cases where two or more firms have invested in a single deal are accounted for as one deal for each firm.
PwC MoneyTreeTM India Report – Q1 ’16 16
5. Sector focus IT & ITeS sector
India continued to grow its share in the global IT & ITeS industry and became one of the fastest growing information technology markets globally. According to Gartner, India’s spending on IT is expected to rise 7.2% to USD 72.3 billion in 2016.* Furthermore, IT budgets too are growing the fastest in India at 11.7%, compared with the world average of 1%. As per NASSCOM, India’s IT & ITeS industry is projected to grow 8.5% in FY2016—from USD 132 billion in FY2015 to USD 143 billion, an addition of USD 11 billion. Technology adoption in India is increasing rapidly, driven by a large mobile-only population, improvements in connectivity and increasing data consumption.
The Indian IT & ITeS industry is in an optimistic mood, with the government planning a number of major technology-centric initiatives, including some wide-ranging infrastructure investments. The 'Digital India' program and ongoing efforts on 'Smart Cities' are driving spending on software and IT services. Meanwhile, IT budgets in sectors such as banking and financial services, retail, telecom and logistics continue to remain robust. Priority areas for the sector include standard technology upgrades due to continuous innovation in technology, as well as managing short-term business issues around compliance and the regulatory environment, cost-cutting programs and M&A integration.
The IT industry continues to strike a healthy balance between software products and the services sector growth. Key to this is the rise of more than 4,000 software product start-ups in India—a number that’s increasing every month—developing industry-specific solutions and targeting specific niche areas. Disruptive business models, the emergence of newer technologies, the rise of emerging markets and the creation of new buyer segments and government support will all help India to increase its share in the global software market.
India is slowly maturing towards global standards and customers are continuing to move away from large outsourcing and project services deals towards adopting smaller deals focused on delivering measurable business results. Technology is also playing a critical role in enabling transformation and supporting India’s GDP growth. India’s leading tech firms are reimagining their services with digital transformation, IoT, SMAC (social media, mobile, analytics, cloud), automation, and IP-led innovation as the backbone of their solutions. Digital technologies will continue to be popular and the revenue from these is likely to contribute around 40% by 2025. An important shift that is happening is the slowdown in hiring, with greater investment being made in re-skilling existing employees to meet evolving market needs. The Indian markets and their clients are changing, and Indian IT & ITeS companies targeting these opportunities will have to react aggressively with quick implementation of digital initiatives as well as specialized, standardized technology platforms to grow.
Sandeep Ladda Leader, Technology PwC India *Gartner press release and media reports, Nov 3, 2015
Sector focus: IT & ITeS
PwC MoneyTreeTM India Report – Q1 ’16 17
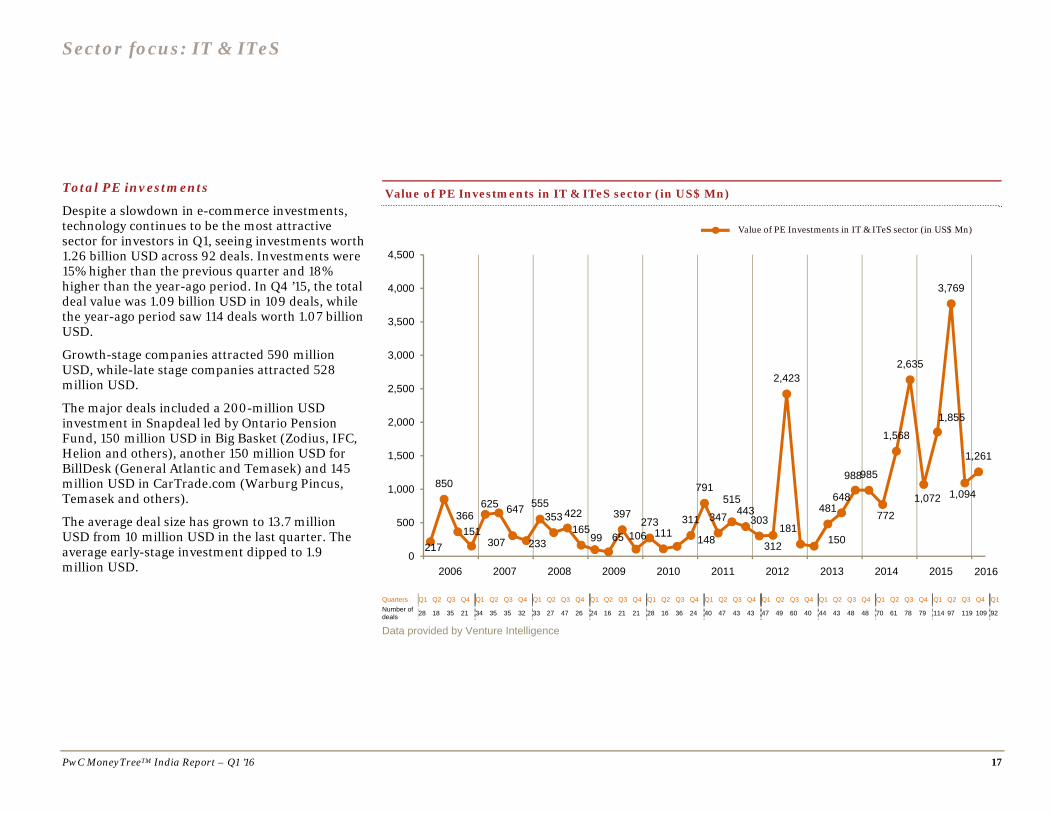
Total PE investments
Despite a slowdown in e-commerce investments, technology continues to be the most attractive sector for investors in Q1, seeing investments worth 1.26 billion USD across 92 deals. Investments were 15% higher than the previous quarter and 18% higher than the year-ago period. In Q4 ’15, the total deal value was 1.09 billion USD in 109 deals, while the year-ago period saw 114 deals worth 1.07 billion USD.
Growth-stage companies attracted 590 million USD, while-late stage companies attracted 528 million USD.
The major deals included a 200-million USD investment in Snapdeal led by Ontario Pension Fund, 150 million USD in Big Basket (Zodius, IFC, Helion and others), another 150 million USD for BillDesk (General Atlantic and Temasek) and 145 million USD in CarTrade.com (Warburg Pincus, Temasek and others).
The average deal size has grown to 13.7 million USD from 10 million USD in the last quarter. The average early-stage investment dipped to 1.9 million USD.
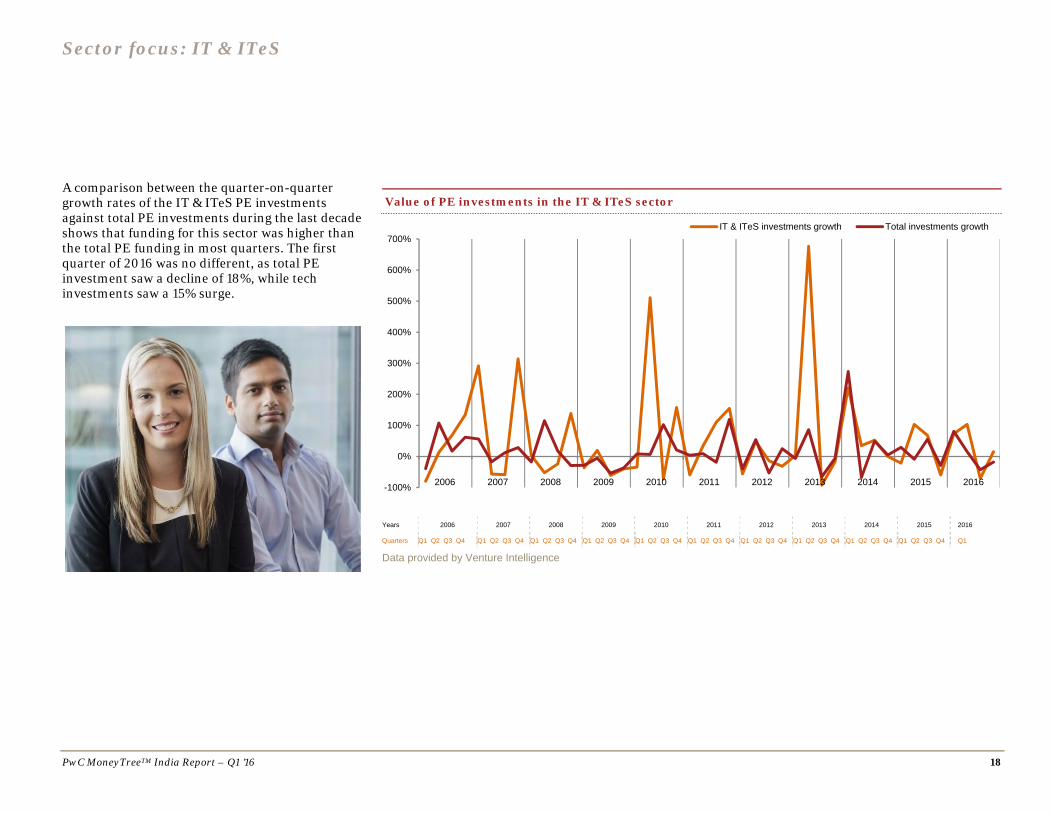
A comparison between the quarter-on-quarter growth rates of the IT & ITeS PE investments against total PE investments during the last decade shows that funding for this sector was higher than the total PE funding in most quarters. The first quarter of 2016 was no different, as total PE investment saw a decline of 18%, while tech investments saw a 15% surge.
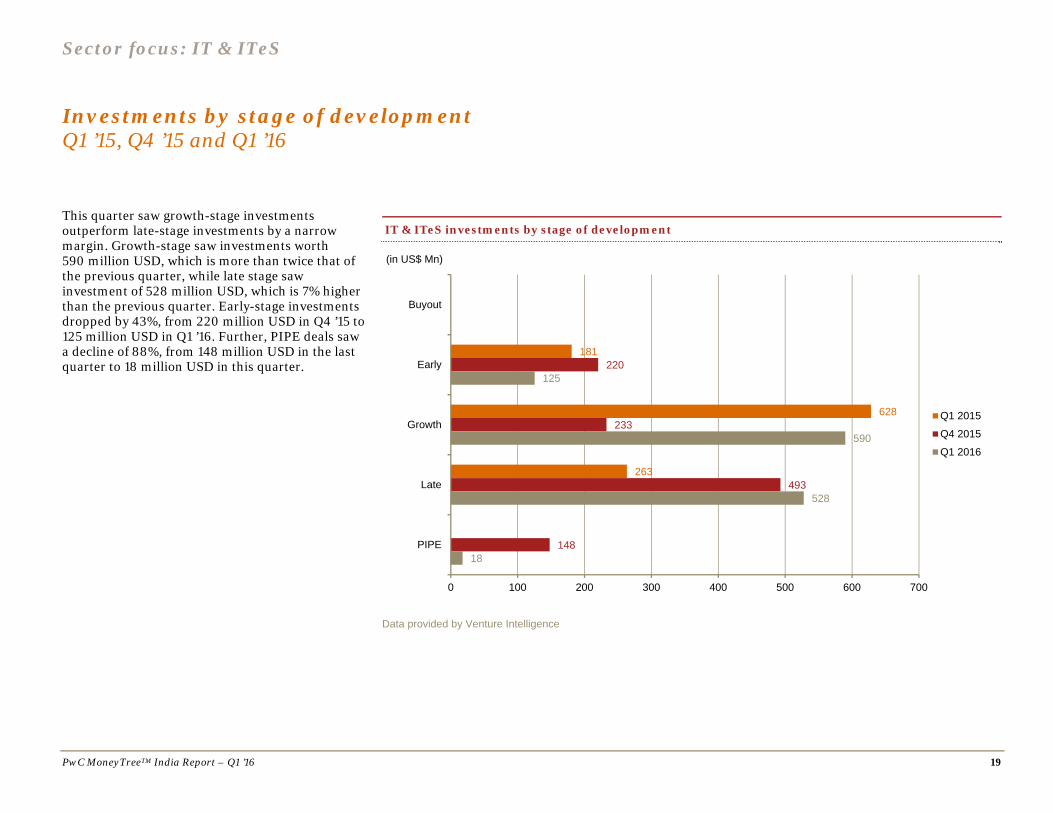
Investments by stage of development Q1 ’15, Q4 ’15 and Q1 ’16
This quarter saw growth-stage investments outperform late-stage investments by a narrow margin. Growth-stage saw investments worth 590 million USD, which is more than twice that of the previous quarter, while late stage saw investment of 528 million USD, which is 7% higher than the previous quarter. Early-stage investments dropped by 43%, from 220 million USD in Q4 ’15 to 125 million USD in Q1 ’16. Further, PIPE deals saw a decline of 88%, from 148 million USD in the last quarter to 18 million USD in this quarter.
Data provided by Venture Intelligence
181
628
263
220
233
493
148
125
590
528
18
0 100 200 300 400 500 600 700
Buyout
Early
Growth
Late
PIPE
(in US$ Mn)
Q1 2015
Q4 2015
Q1 2016
IT & ITeS investments by stage of development
Sector focus: IT & ITeS
PwC MoneyTreeTM India Report – Q1 ’16 20
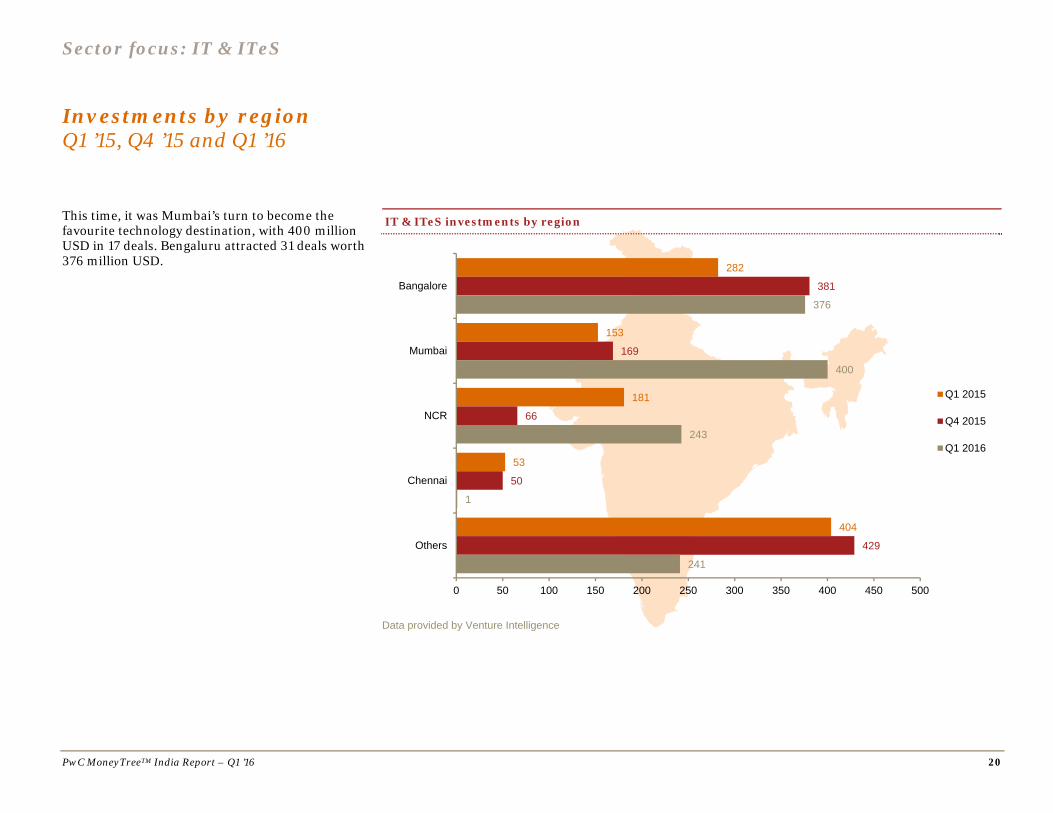
Investments by region Q1 ’15, Q4 ’15 and Q1 ’16
This time, it was Mumbai’s turn to become the favourite technology destination, with 400 million USD in 17 deals. Bengaluru attracted 31 deals worth 376 million USD.
Data provided by Venture Intelligence
282
153
181
53
404
381
169
66
50
429
376
400
243
1
241
0 50 100 150 200 250 300 350 400 450 500
Bangalore
Mumbai
NCR
Chennai
Others
Q1 2015
Q4 2015
Q1 2016
IT & ITeS investments by region
Sector focus: IT & ITeS
PwC MoneyTreeTM India Report – Q1 ’16 21
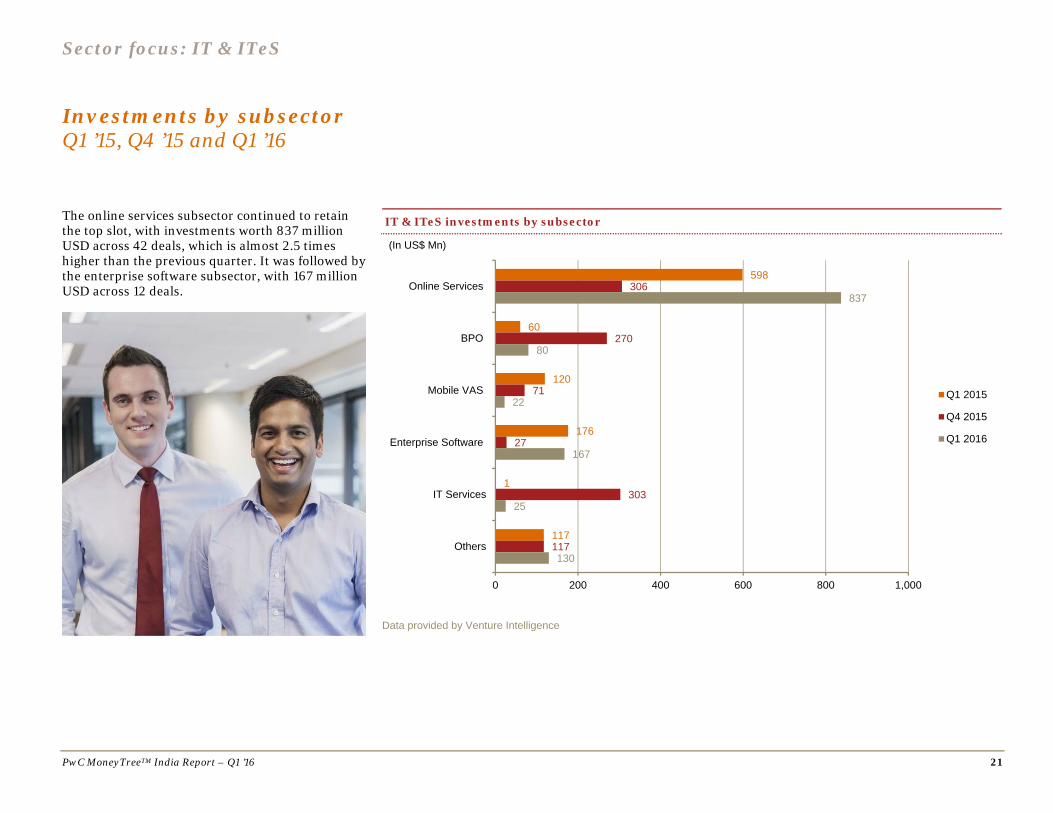
Investments by subsector Q1 ’15, Q4 ’15 and Q1 ’16
The online services subsector continued to retain the top slot, with investments worth 837 million USD across 42 deals, which is almost 2.5 times higher than the previous quarter. It was followed by the enterprise software subsector, with 167 million USD across 12 deals.
Data provided by Venture Intelligence
598
60
120
176
1
117
306
270
71
27
303
117
837
80
22
167
25
130
0 200 400 600 800 1,000
Online Services
BPO
Mobile VAS
Enterprise Software
IT Services
Others
(In US$ Mn)
Q1 2015
Q4 2015
Q1 2016
IT & ITeS investments by subsector
Sector focus: IT & ITeS
PwC MoneyTreeTM India Report – Q1 ’16 22
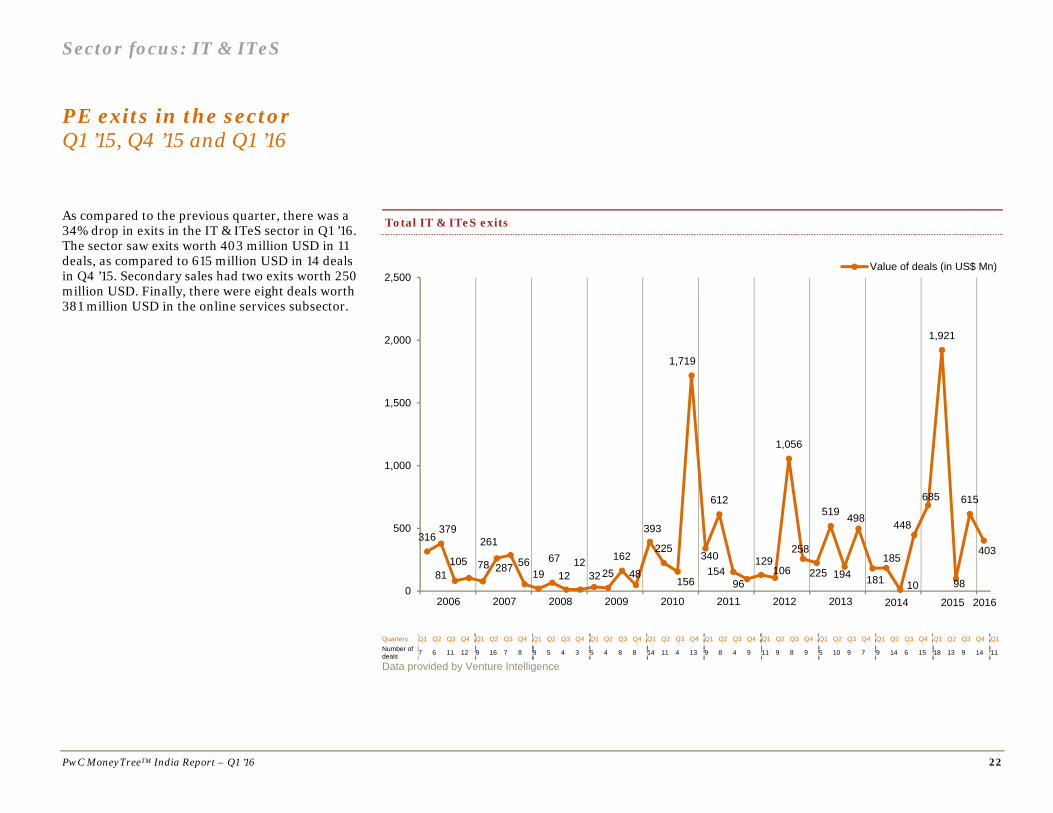
PE exits in the sector Q1 ’15, Q4 ’15 and Q1 ’16
As compared to the previous quarter, there was a 34% drop in exits in the IT & ITeS sector in Q1 ’16. The sector saw exits worth 403 million USD in 11 deals, as compared to 615 million USD in 14 deals in Q4 ’15. Secondary sales had two exits worth 250 million USD. Finally, there were eight deals worth 381 million USD in the online services subsector.
Early stage: This refers to the first or second round of institutional investments in companies that adhere to the following: Less than five years old Not part of a larger business group Investment is less than 20 million USD
Growth stage: This refers to investments of less than 20 million USD. Also, investments meeting the following criteria are considered to be in the growth stage: Third or fourth round funding of
institutional investments First or second round of institutional
investments in companies that are more than 5 years old and less than 10 years old or spin-outs from larger businesses
Growth-stage PE: This includes the following: First or second round of investments worth 20
million USD or more
Third or fourth round funding in companies that are more than 5 years old and less than 10 years old, or subsidiaries or spin-outs from larger businesses
Fifth or sixth round of institutional investments
Late stage: This comprises the following: Investment in companies that are a decade old Seventh or later round of institutional
investments
PIPEs: The following constitute PIPEs: PE investments in publicly listed companies via
preferential allotments or private placements Acquisition of shares by PE firms via the
secondary market
Buyout: This is an acquisition of controlling stake via purchase of stakes of existing shareholders.
Buyout – large: This includes buyout deals of 100 million USD or more in value.
Other: This includes PE investments in special purpose vehicle (SPV) or project-level investments.
Types of PE exits
Buy-back: This includes the purchase of PE or VC investors’ equity stakes by either the investee company or its founders or promoters.
Strategic sale: This includes the sale of PE or VC investors’ equity stakes (or the entire investee company itself) to a third-party company (which is typically a larger company in the same sector).
Secondary sale: Any purchase of PE or VC investors’ equity stakes by another PE or VC investors constitutes secondary sale.
Public market sale: This includes the sale of PE or VC investors’ equity stakes in a listed company through the public market.
Initial public offering (IPO): This includes the sale of PE or VC investors’ equity stake in an unlisted company through its first public offering of stock.
PricewaterhouseCoopers and Venture Intelligence have taken responsible steps to ensure that the information contained in the MoneyTreeTM report has been obtained from reliable sources. However, neither of the parties can warrant the ultimate validity of the data obtained. Results are updated periodically. Therefore, all data is subject to change at any time. Before making any decision or taking any action, you should consult a competent professional adviser.
Sibi Sathyan Knowledge Manager, Private Equity PwC India [email protected]
About PwC’s Technology Institute The Technology Institute is PwC’s global research network that studies the business of technology and the technology of business with the purpose of creating thought leadership that offers both fact-based analysis and experience-based perspectives. Technology Institute insights and viewpoints originate from active collaboration between our professionals across the globe and their first-hand experiences working in and with the technology industry.
About PwC PwC helps organisations and individuals create the value they are looking for. We are a network of firms in 158 countries with more than 208,000 people who are committed to delivering quality in assurance, tax and advisory services. Tell us what matters to you and find out more by visiting us at www.pwc.com.