18
Monitor and improving learning outcomes in the 2030 Education agenda Is a cross-national scale possible?
| Date post: | 19-Sep-2018 |
| Category: |
Documents |
| Upload: | nguyendung |
| View: | 222 times |
| Download: | 0 times |
Monitor and improving learning outcomes in the 2030 Education agenda
Is a cross-national scale possible?

2
Table of contents
TABLE OF CONTENTS .......................................................................................................................... 2
LIST OF TABLES AND FIGURES.......................................................................................................... 3
BACKGROUND ...................................................................................................................................... 4
THE POLITICAL LANDSCAPE: SDGS AND PRIORITY INDICATORS ............................................... 4
THE CASE FOR A GLOBAL METRIC: A DESCRIPTIVE RATHER THAN A PRESCRIPTIVE TOOL 6
THE CURRENT LANDSCAPE FOR MEASURING LEARNING OUTCOMES .......................................................... 7 National assessments ..................................................................................................................... 7 Regional assessments .................................................................................................................... 8 International assessments ............................................................................................................... 9
A SOUND STRATEGY TO MONITOR SDG 4.1: THE OPTIONS .......................................................... 9
STREAM 1: INDICATORS BASED ON NATIONAL ASSESSMENTS .................................................................. 10 Using NLAs to monitoring SDG 4.1 ............................................................................................... 12
STREAM 2: SNAPSHOTS AT VARIOUS POINTS IN THE EDUCATION CYCLE ................................................... 14 The challenge of linking assessments ........................................................................................... 14
STREAM 3: THE INTERNATIONAL LEARNING SCALES (ILS) ....................................................................... 15 STEPPING STONES TOWARDS THE ILS................................................................................................... 16
THE PENDING AGENDA: CAPACITY BUILDING FOR BETTER USE OF LEARNING ASSESSMENTS ................................................................................................................................... 17
3
List of Tables and Figures
TABLE 1 -COUNTRIES BY REGIONAL THAT HAVE NATIONAL ASSESSMENT BY REGION .......... 8
TABLE 2 - REGIONAL ASSESSMENT ................................................................................................... 8
TABLE 3: COUNTRIES PARTICIPATING IN THE INTERNATIONAL INITIATIVE BY REGION ........... 9
TABLE 4: CITIZEN-LED BASIC LEARNING ASSESSMENTS .............................................................. 9
FIGURE 1. HOW ENGAGE ARE COUNTRIES IN LEARNING ASSESSMENT? ................................ 11
FIGURE 2 -LEARNING OUTCOMES INDEX RESULTS BY WDI AREA ............................................. 11
FIGURE 3 - LEARNING OUTCOMES INDEX BY REGION ................................................................. 12
TABLE 5 - COUNTRIES THAT HAVE NATIONAL ASSESSMENT ...................................................... 13
TABLE 6: COMPARING THE ALTERNATIVES .................................................................................... 16
FIGURE 4: ON THE SAME PATH AT DIFFERENT SPEEDS .............................................................. 17

4
Background
Despite global progress in more boys and girls attending school, “at least 250 million children are failing to learn the basics” (Education for All Global Monitoring Report (GMR), 2012). School participation is an important indicator of access to education, but assessing learning outcomes provides insight into the quality of education and the skills with which students are equipped for global citizenship. But what are ‘basic skills’ and what does ‘fail’ mean in terms of measurement? How can this estimate be assessed without an internationally-agreed methodology? Since 2012, the international community has gone one step further in monitoring education by addressing the need to measure learning on a nationally comparable scale. The new Sustainable Development Goals (SDGs) call for relevant and effective learning outcomes, and as such, a system needs to be in place to monitor progress.
Assessing learning outcomes has never been as dynamic as today. A profusion of assessments exist at international, regional and national levels, research articles are flourishing, and media attention is all eyes and ears when new results from an international survey are published. League tables stir debate in every country and opposition to these exercises is fierce. Concerns about country ownership and control over their education policies are emerging. The methodology of assessments, the reliability of data and how exactly the score is produced are being questioned.
SDG 4.1 has the following target: "By 2030, ensure that all girls and boys complete free, equitable and quality primary and secondary education leading to relevant and effective learning outcomes". Therefore, accomplishing this target needs measuring Learning Outcomes through a comparable measure.
To date, a methodology which reconciles national assessments and ensures cross-national comparability does not exist. Results of assessments also need to be easily understood by a non-expert audience. This critical gap jeopardises the global monitoring of goals and subsequent targets put forward in the Sustainable SDGs.
A consensus is needed on a sound methodology and agreed-upon indicators for measuring learning outcomes on an international level, while preserving each stakeholder’s perspective on what learning means. At the national level, there is also a need for statistical capacity building and providing a forum for countries to learn from each other about specific needs, strengths and weaknesses.
The political landscape: SDGs and priority indicators
As part of the SDG 4, the international community will pledge to “ensure that all girls and boys complete free, equitable and quality primary and secondary education leading to relevant and effective learning outcomes”. The Draft Framework for Action for Education 2030 stresses the need to improve the systems and practices used to assess learning in order to provide the data needed by policymakers to improve the quality of education and the learning outcomes of all children and youth.
5
The United Nations Statistical Commission (UNSC) has emphasised that the global indicator framework should only contain a limited number of indicators, striking a balance between the number of indicators and policy relevance, taking into account conceptual indicator frameworks that have already been developed. It also recognised that besides global universal indicators there will also be additional indicators for thematic, regional and national monitoring, to be organized in an integrated architecture.
It is not feasible to expect countries to precisely measure the outcomes of every child in every possible area of learning using the same methodologies in order to produce internationally-comparable data. So instead of striving towards the ‘perfect fit’, the international education community may be better served by focusing on indicators that are ‘fit for purpose’ to monitor progress globally.
Progress towards the 2030 Agenda for Sustainable Development1 will be reviewed and monitored through a limited set of global indicators, for each of the 17 SDGs. The UNSC will provide the necessary statistical support for the elaboration of the global indicator framework to be endorsed at the forty-seventh session of the UNSC in March 2016.
A growing number of countries are conducting large-scale learning assessments either by developing their own systems or joining wider initiatives. However, these assessments are based on different methodological approaches and therefore do not provide internationally-comparable data that can be used for global monitoring.
There is currently no cross-national 2 assessment that measures learnings in all countries in all regions. Some countries have taken part in international assessment like but many participated in regional assessments. Each assessment body has its own test framework, test construct, implementation plan, methodology of data analysis and reporting format. A global comparison urges for an agreed coherent plan, methodology and reporting format. We need many definitions, and we decided to start discussing in which ages, grades, subjects, and sampling issues of learning assessments.
One eventually obvious possibility (the most efficient one) is to establish a link across existing assessments. However, the major obstacle to link national and cross-national assessments is the lack of coordination between assessment bodies. It remains difficult for countries and stakeholders to access test items, response data and methodological tools to existing national and cross-national assessments.
Thus, the discussion about how to monitor SDG 4 leads to a deeper discussion about what is learning, the existence or not of a common scale for all cultures, domains and
1 https://sustainabledevelopment.un.org/content/documents/7891TRANSFORMING%20OUR%20WORLD.pdf
2 Cross-national assessment is used to represent international and regional assessments.
6
subjects; closely related the possibility of a common metrics to measure it along all the spectrum or in specific moments (ages/grades) in the general conceptual side. In a second stage the issues to address are related to the architecture of learning assessments, technical needs, how to measure priorities, how to improve learning outcomes through a better use of assessment results among others.
Thus the agree measure to track progress will be the result of replying among others to the following the needs:
develop a shared understanding of both conceptual and technical issues related to learning and its monitoring;
raise awareness about the relevance of having a tools to track student’s progress;
advocate for the need of addressing equity and low levels of learning exist serve all stakeholders by providing adequate tools for learning assessments; respond to pressing needs for international monitoring; frame the global priority indicator for SDG4; Develop capacity-building networks to support countries in carrying out
learning assessments.
The case for a global metric: a descriptive rather than a prescriptive tool
The discussion about the measurement of SDG hides the relevant discussion that is the existence of a universal learning curve of learning, an International Curve for Educational Development (ICED) valid for all countries and culture. This curve, the ultimate objective in the discussion, would be the reference curve related to the development and abilities and capacities that will enable to link and compare persons and system to given educational internationally agreed reference.
The curve might be devised sequentially, i.e. divided into segments corresponding to different periods of cognitive and emotional growth and maturation. In tem of countries policymakers can then use this ICED to compare against other schools, countries and conditions.
There are plenty of examples in other fields of common scales as these have proven useful either to cope with the needs to reconcile multiplicity of already existing scales or to foster analytical and diagnosis capacity. In physics for instance, the physical state of water can be used as a common reference for the three main temperatures scales still in use today; Celsius, Fahrenheit and Kelvin. In health, work done by the World Health Organisation (WHO) generated new growth curves for assessing growth and development of infants and young children around the world by 2004.
Given the specific nature of learning outcomes, it is very likely that one curve per subject/matter is needed. In that regard, the proposed pathway is to start with mathematics and reading for which a lot of materials already exist before further expanding to other disciplines such as sciences and ultimately explore the feasibility of a curve for socio emotional skills.

7
The second issue is measurement. Assessment is usually used as a way to collect data on learning. In order to understand learning across countries we need to have a good measurement mechanism and consider the existence of a learning scale related to the ICED that allow a common cross-national metrics at the different ages/grade/subjects that allow comparison at the global level or the allocation for any system in that scale.
Yet, we do not know if the answer to the former questions is yes. While methodologies tend to converge between international and regional assessments differences remain and it is difficult for governments and citizens for instance to understand how a score of 302 in 2006 at the Progress in International Reading Literacy Study (PIRLS) (grade 4) relates to a score of 495 in 2007 at the Southern and Eastern Africa Consortium for Monitoring Educational Quality (SACMEQ) (grade 6) to take one example; South Africa. In addition, it is still difficult to situate one’s progress on an indicative pathway as there is no reference curve for the acquisition of learning outcomes, that is to more clearly explain using the former example: even when a score of 302 in PIRLS is the same than 495 in SACMEQ we do not know if this too much or too little related to the ideal scenario.
The idea of an international learning scale is likely to raise concerns regarding ownership over curricula and education policies. Many stakeholders –including governments, Non-Government Organizations (NGOs) and citizens– remain skeptical about the need for international learning assessments and monitoring of global learning outcomes. Teaching focused on test results, adjustments to the curriculum, and misuse and political use of league tables are issues that have been undermining the credibility and legitimacy of international assessments.
The current landscape for measuring Learning Outcomes
We can identify three major types of “official” assessments: i) national, ii) regional, and iii) international. They vary in different aspects such as grade, subject, sampling characteristics, some are mandatory and some are not, periodicity, etc.
National assessments
These are assessments elaborated and implemented by National Ministries of Education. Some examples could be the National Assessment of Educational Progress in the United States, the Operativo Nacional de Evaluación (ONE) in Argentina, or the Sistema de Medición de la Calidad Educativa (SIMCE) in Chile among others.
Depending on the country’s education system and structure, the (theoretical) duration of primary education can vary from 3 (Turkmenistan) to 8 (Ireland) years, with majority of countries having a duration of 6 years in the primary education 3 . From the
3 UIS Data Centre Theoretical duration of primary education by year in 2013.

8
experience of the Research Triangle Institute's (RTI) Early Grade Reading Assessment (EGRA) many students in Sub-Saharan Africa barely know how to read at grades 34.
Table 1 -Countries by regional that have national assessment by region Region Number of
countries Areas of assessment
East Asia & Pacific 25 Literacy, Reading, Language, Math, Sciences Social Studies, English, Life skills, Computer studies – Information and Communications Technology (ICT), Physical education, Civics
Europe & Central Asia 51 Literacy, Writing, Reading, Language, Math, Sciences Social Studies, French, Life skills, History, Computer studies ICT, Geography, Physical education.
Latin America & Caribbean
27 Literacy, Writing, Reading, Language, Math, Sciences Social Studies, French, History, Computer studies ICT, Geography, Physical education., Civics
Middle East & North Africa
18 Literacy, Language, Math, Sciences Social Studies, French, Life skills, Computer studies ICT
North America 3 Writing, Reading, Language, Math, Sciences Social Studies, History, Computer studies ICT, Geography, Civics
South Asia 8 Literacy, Language, Math, Sciences Social Studies, History, Computer studies ICT, Geography
Sub-Saharan Africa 31 Literacy, Language, Math, Sciences Social Studies, French, Life skills, Computer studies ICT
Total 163 - -
Source: UIS based on UIS Catalogue of Learning Outcomes and World Development Report.
Regional assessments
In this case, several countries from the same region elaborate and participate in the same assessment. Latin American Laboratory for Assessment of the Quality of Education (LLECE) in Latin America, SACMEQ in Southern and Eastern Africa are examples of this type of assessment, Programme on the Analysis of Education Systems of the Conference of Education Ministers of Francophone Countries across the World (CONFEMEN) (PASEC) in francocophone countries, South East Asia Primary Learning Metric (SEA-PLM) and PILNA in the Pacific Islands.
Table 2 - Regional Assessment Organization responsible for assessment
Region initiative Ccountries involves Area
Grade
Ministries of Education of the Southern and Eastern Africa SACMEQ 16
Literacy and mathematics 6 grade
CONFEMEN PASEC 10 French and mathematics
2 grade and 5 or 6 grade
4 Personal communication with Luis Crouch regarding learning at primary level.

9
LLECE SERCE and TERCE 15 Reading, mathematics and science 3 and 6 grade
Source: UIS based on UIS Catalogue of Learning Outcomes and World Development Report.
International assessments
These initiatives include several countries around the globe who participate in the same test. In 2012, for example, 65 countries from different regions participated in Programme for International Student Assessment (PISA). Other international studies are Trends in International Mathematics and Science (TIMSS), PIRLS, Internatinoal Civics and Citizenship Study (ICCS), Internatinoal Civics and Citizenship Study (ICILS), among others.
Table 3: Countries participating in the international initiative by region
Region TIMSS 2010-2011 PIRLS 2010-2011 ICILS 2013 PISA 2012 CIVED 1 or 2
East Asia & Pacific 10 6 4 13 2
Europe & Central Asia 30 26 13 37 24
Latin America & Caribbean 2 3 2 8 2
Middle East & North Africa 16 9 5 1
North America 2 2 1 2 2
South Asia - - - -
Sub-Saharan Africa 3 2 - -
Total general 63 48 20 65 31
Source: UIS based on UIS Catalogue of Learning Outcomes and World Development Report.
Other initiatives such as citizen-Led Assessments exist. In this case, several countries from the same region elaborate and participate in this type of assessment.
Table 4: Citizen-Led Basic Learning Assessments Programme Age range of children Languages in which children were tested Area
Annual Status of Education Report (ASER) India 5 -16 20 languages Reading and arithmetic
ASER Pakistan 5 -16 Urdu, Sindhi and Pashto & English Reading and arithmetic
UWEZO Kenya 6 -16 Kiswahili & English Reading and arithmetic
UWEZO Tanzania 7 -16 Kiswahili & English Reading and arithmetic
UWEZO Uganda 6 -16 English Reading and arithmetic
Beekungo Mali 5 -14 French, Bamanankan, Bomu & Fulfulde Reading and arithmetic
Jangandoo Senegal 5 -18 French, Wolof & Pulaar Reading and arithmetic
Source: Citizen-Led Basic Learning Assessments. An Innovative Approach. http://www.worldbank.org/content/dam/Worldbank/Event/education/2013_Citizen-led%20Learning%20Assessments%20Oct%2030.pdf
A sound strategy to monitor SDG 4.1: the options
10
Many will agree on the logic of a learning scale, but few can even envisage the technical and cultural issues that need to be resolved in the development of the international monitoring of learning outcomes, the following questions need to be addressed:
How reliable are national learning assessments (NLAs)? What are their advantages and limitations?
Are there converging methodologies for NLAs? How do performance in NLAs and cross-national assessments relate to
each other? What are the advantages and limitations of previous attempts at linking
assessments? How to reconcile norm-referenced and criterion-referenced tests? Can we reconcile diagnosis, formative and summative assessments? Do we want a cardinal or ordinal scale? What about total/partial order? and
by whom? Can the scale be applied across fields or are separate scales needed for
each field? Can there be any hybrid solution? How can out-of-school children be included in learning assessments?
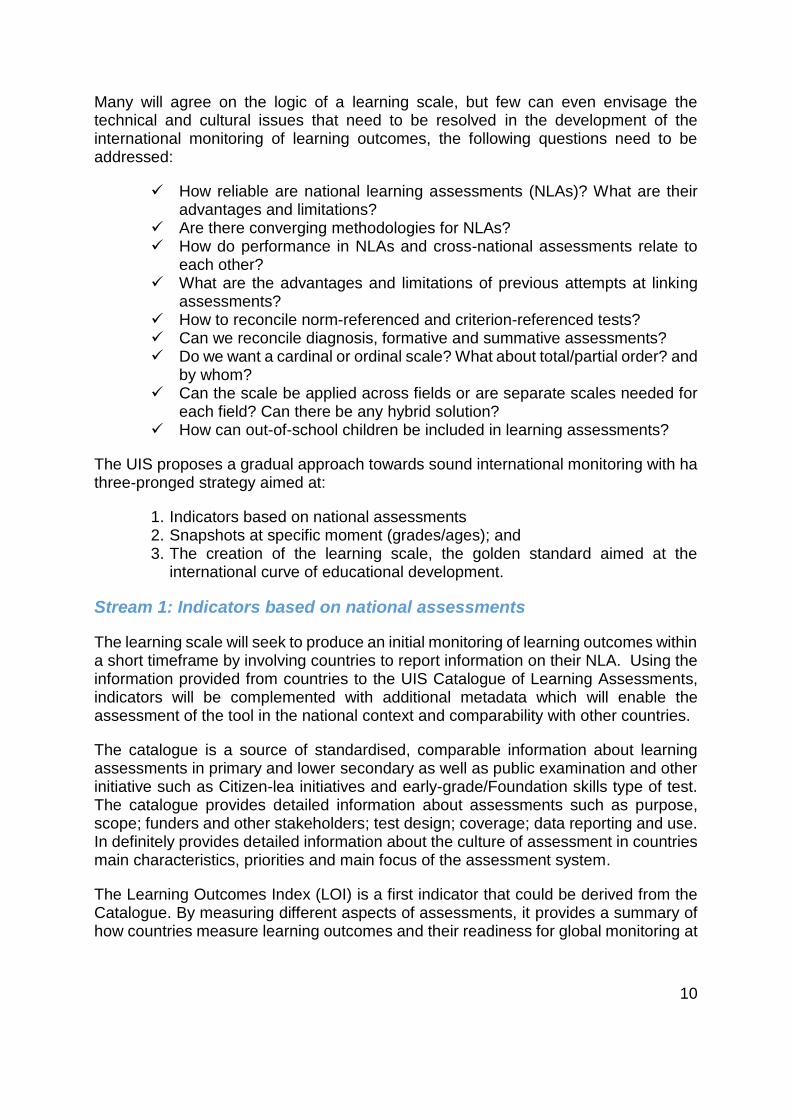
The UIS proposes a gradual approach towards sound international monitoring with ha three-pronged strategy aimed at:
1. Indicators based on national assessments 2. Snapshots at specific moment (grades/ages); and 3. The creation of the learning scale, the golden standard aimed at the
international curve of educational development.
Stream 1: Indicators based on national assessments
The learning scale will seek to produce an initial monitoring of learning outcomes within a short timeframe by involving countries to report information on their NLA. Using the information provided from countries to the UIS Catalogue of Learning Assessments, indicators will be complemented with additional metadata which will enable the assessment of the tool in the national context and comparability with other countries.
The catalogue is a source of standardised, comparable information about learning assessments in primary and lower secondary as well as public examination and other initiative such as Citizen-lea initiatives and early-grade/Foundation skills type of test. The catalogue provides detailed information about assessments such as purpose, scope; funders and other stakeholders; test design; coverage; data reporting and use. In definitely provides detailed information about the culture of assessment in countries main characteristics, priorities and main focus of the assessment system.
The Learning Outcomes Index (LOI) is a first indicator that could be derived from the Catalogue. By measuring different aspects of assessments, it provides a summary of how countries measure learning outcomes and their readiness for global monitoring at

11
least in terms of willingness to have information on learning using external evaluation (see Figure 1).
The LOI provides a quick summary of the willingness to measuring learning outcomes in different countries and their readiness for global monitoring. The index is based on responses to four questions taking as reference period the last 3 years?
1. Does the country have national assessments in the primary level of education? 2. Does the country have national assessments in the secondary level of
education? 3. Did the country have a national assessment between 2012 and 2014? 4. Did the country participate or is participating in an international assessment?
For each question, negative responses amount to zero and a positive response equals one. For instance, if a country replies "yes" to the first and third questions, and "no" to the others then it will have a score of two. Another country with annual assessments in all education levels and participating in international studies will have a value of four on the Index. The range of the index goes, then, from 0 to 4.
Figure 1 shows the extent of engagement of countries on measuring levels of learning. Only 20% of the countries do not have any “official” measurement of learning either by having a NLA or joining either regional or international initiatives.
Figure 1. How engage are countries in learning assessment?
Source: UIS based on UIS Catalogue of Learning Outcomes and World Development Report.
The following figure shows that it does not appear to be any strong correlation between a country’s income level and LOI value. In other words, both more and least developed countries appear across the different LOI results.
Figure 2 -Learning Outcomes Index results by WDI area
02
04
06
0
Num
ber
of C
ou
ntr
ies
0 1 2 3 4Learning Outcome Index

12
When we look at the LOI by region, we observe that South East Asia has the highest index, while Sub-Saharan Africa shows the lowest levels.
Figure 3 - Learning Outcomes Index by region
Source: UIS based on UIS Catalogue of Learning Outcomes and World Development Report.
Some additional, very informative indicators might be generated also from the date gathered from the Catalogue that need further consultation for its development such as the quality of the NLA, the access to information, the percentage of children who do not achieve the minimum level by country standards; and the distribution of students by level of skills/abilities.
Using NLAs to monitoring SDG 4.1
0 .2 .4 .6 .8 1
Upper middle income
Lower middle income
Low income
High income: nonOECD
High income: OECD
Primay High School
Both Levels International
Source: UIS based on UIS, GRM, and WDI databases.
0
1
2
3
4
Le
arn
ing O
utc
om
es
Ind
ex
Sub
-Sah
ara
n A
fric
a
East
Asi
a &
Pa
cific
La
tin A
me
rica
& C
arib
be
an
Nort
h A
me
rica
Mid
dle
East
& N
ort
h A
fric
a
Euro
pe
& C
en
tral A
sia
Sou
th A
sia

13
Several studies have taken stock of existing NLAs, and despite a number of shortcomings, notably the lack of comparability, using these materials could lead to an initial monitoring of education performance as defined at the national level. There has been a sharp increase over time in the use and frequency of NLAs, and at least 135 countries have carried out at least one NLA since 2000. Furthermore, more than 90% of these countries conducted at least one assessment at the end of primary school.
However countries differ in the number of years for each level. For instance, in advanced economy in the north, like Europe and North America, where the education system is more developed: children enter formal education system at an early age, and primary education is compulsory and free, we could collect learning data at grade 2 for early grade, and at grades 6-7 for end of primary education. For Central Asia and Eastern European countries where grade 4 is the end of primary.
Table 5 - Countries that have national assessment
Region
ISCED 1 ISCED 2 and 3
1 grade
2 grade
3 grade
4 grade
5 grade
6 grade
7 grade
8 grade
9 grade
10 grade
11 grade
12 grade
13 grade
East Asia & Pacific 2 3 6 12 8 16 3 6 6 5 3 2
Europe & Central Asia 5 9 14 28 15 21 9 19 17 7 3 2 Latin America & Caribbean 8 9 22 16 8 20 4 7 14 4 6 7 1 Middle East & North Africa 1 2 4 12 7 7 5 8 6 6 3 2
North America 1 1 1 1 2 1
South Asia 1 1 4 4 3 3 1 6 1 3
Sub-Saharan Africa 5 9 13 18 15 11 2 3 3 1 1
Total 22 33 64 91 57 79 24 51 47 26 15 15 1
Source: UIS based on UIS Catalogue of Learning Outcomes and World Development Report.
When to asses? In which grades or ages? Both in the Reading meeting (March 2014 at the UIS) and Working Group on Numeracy Indicators (WGNI) supports the view that monitoring learning outcomes should be regular and continuous, two points in time to indicate achievement of the targets and goal are proposed:
Assessment of learning outcomes at the end of grade 2 to inform an indicator at the early grades.
Assessment of learning outcomes at grades 4-6 to inform an indicator at the end of primary education.
The same assessments could be administered at different grades or ages. While monitoring at different grades increases flexibility for countries, it also complicates global reporting. Therefore the focus should be on reporting by education segment rather than limit to grade or age. The main focus is what children have learnt at the end of a formal education segment and not at what grade they have learnt. How to link between countries is a pending issues?

14
The second possibility is that NLAs are used to monitor progress on their own results and other under a comparable cross-national linked scale. This is eventually efficient in the sense that countries already have NLAs but there are concerns about low levels of learning (despite improved access), the heterogeneity in the use of assessment as planning and monitoring tools, skepticism about the technical rigor of some assessment approaches that raise concerns about not only global comparability but also the technical soundness.
Stream 2: Snapshots at various points in the education cycle
A second alternative while defining the ICED and the International Learning Scale (ILS) is to use snapshots in specific moments that might be either grades or ages as a first definition. Them some of the one questions highlighted above need to be answered starting by the age/grade, subject.
SDG 4 has not only the priority education abut there are also thematic indicators that call for monitoring different moments of learning process being those moment, end of primary education, end of lower high school, early grades and adult literacy.
If the choice if to gather information at the end of primary school two alternatives are to develop a new brand tool at the international level. This will need to establish a relevant test framework, items, implementation, analysis and reporting, relevance and consensus building that means time.
The second one is using current initiatives already in place ere is not any international assessment that targets countries across all regions in the Global South. Linking cross-national assessments is the best scenario since it will be cost-effective and efficient as most cross-national assessments have a reasonable coverage of countries. Furthermore, most cross-national assessments have an existing framework, test construct, sampling plan, developed implementation and operational process, data analysis plan and reporting framework.
The challenge of linking assessments
A detailed mapping exercise may be needed to find the commonality across these assessments. The Organization for Economic Co-operation and Development (OECD) and the World Bank (WB) have commissioned the mapping of various cross-national assessments and found similarity across the assessments, like the content coverage, the population (age/grade) coverage, the type of assessment items (multiple-choice or construct response). However, there are still differences, like the proportion of content domains included in the assessment, the proportion of type of assessment items, the statistical model uses to model the data, the estimation model uses to report the results, and the methodology to establish performance level. Sampling plan and contextual information could vary by region as these are the variables in assessment survey that could vary.
Is it feasible to link across assessments? If there is no willing participant, what’s next? There is no doubt that linking across assessments is feasible and most efficient than creating a new assessment. However there are political resistant as most cross-

15
national assessments are unwilling to share the secured items used for maintaining trend, the response data and contextual information used to estimate and produce reporting scores. Without these two fundamental components linking across assessment is not likely to happen. Given the unsuccessful attempts to gather cross-national assessment bodies to establish a consortium in the WB meeting in September 2012, UIS Montreal post-Reading meeting in April 2014, and Paris Learning Metric Partnership meeting in February 2015, an alternative may need to explore.
Stream 3: The international learning scales (ILS)
The last step of the learning scale is both the most needed and the most ambitious. As the international community makes progress towards cross-national monitoring of learning outcomes, the need for better tools to analyse and make policy recommendations will arise. At the moment, results are bound to a particular test, hence linked to one methodology, one test provider and limit country ownership and understanding of the use of the results.
The last step the ILS is both the most needed and the most ambitious. As the international community makes progress towards an international monitoring of learning outcomes the need for better tools to analyse and make policy recommendations will arise. At the moment, analysis of results remain contained to their particular test, hence linked to one methodology, one test provider and limits countries’ ownership over and understanding of the use of the results.
Further, countries will continue to develop their national assessments and will want to explain differences between scores at the national test and scores in international learning assessments. The ICED and the ILS will seek to develop international learning scales enabling to harness further analytical power from all assessments by allowing for comparison against a common reference. The development of the scale will span over several years at it involves rigorous testing and empirical validation. A gradual approach should be taken to define a core set of skills and competencies that children should acquire based on research and consultations with ministries of education.
The final objective is to reach a tool that, like with the measurement of temperature for instance, will enable any user to link and compare any given learning assessment to a robust and internationally agreed reference. The tool will be available to all but not necessarily apply to and by all countries should be encouraged to continue developing their national assessments using their own standards and methodologies and at the same time have at their disposition a Universal Learning Scale that would give them the option of assessing their performance against neighbours and other countries. Enhanced international monitoring will only be a natural sub-product of the tool.
This proposal aims at filling the gap by providing the international community with a pathway towards sound and robust international monitoring of learning outcomes. It seeks to harvest low hanging fruits by taking advantage of the plethora of international, regional and national learning assessments to produce initial data and indicators before going further into reconciling existing exercises and exploring the establishment of an independent and robust international scale against which each learning

16
assessment could be evaluated so as to produce a meaningful reading of the score not only within the assessment itself but also in comparison to other assessments be they international, regional or national.
Stepping stones towards the ILS
Further, countries will continue to develop their national assessments and will want to explain differences between scores at the national test and scores in international learning assessments. The ILS will seek to develop international learning scales enabling to harness further analytical power from all assessments by allowing for comparison against a common reference. The development of the scale will span over several years at it involves rigorous testing and empirical validation. A gradual approach should be taken to define a core set of skills and competencies that children should acquire based on research and consultations with ministries of education.
Table 6 provides a summary of the different alternatives and their main features while timeline is briefly summarized in Figure 3.
Table 6: Comparing the alternatives Alternatives Characteristics
Readiness Cost Political Soundness
Technically Soundness
Availability at the Global Level
Stream 1
LOI Yes Low Yes Yes Immediate
Quality and other No Int Int Yes 1-2 years
% of students who achieve the minimum
No Low No No Immediate
Distribution of student by level of Skills
No Low No No Immediate
Stream 2
Brand New Tool No Int. Difficult to assess
Yes 3-5 years
Linkage
a. Using NLAs No Int Yes Difficult to assess
Difficult to asses
b. Using International/regional assessment
No Int Difficult to assess
Int. 2-years
Stream 3
ILS No High Need Consensus
Difficult to assess
5-10 years?
Note: L: low; Int: Intermediate Source: UIS based on UIS Catalogue of Learning Outcomes and World Development Report.
17
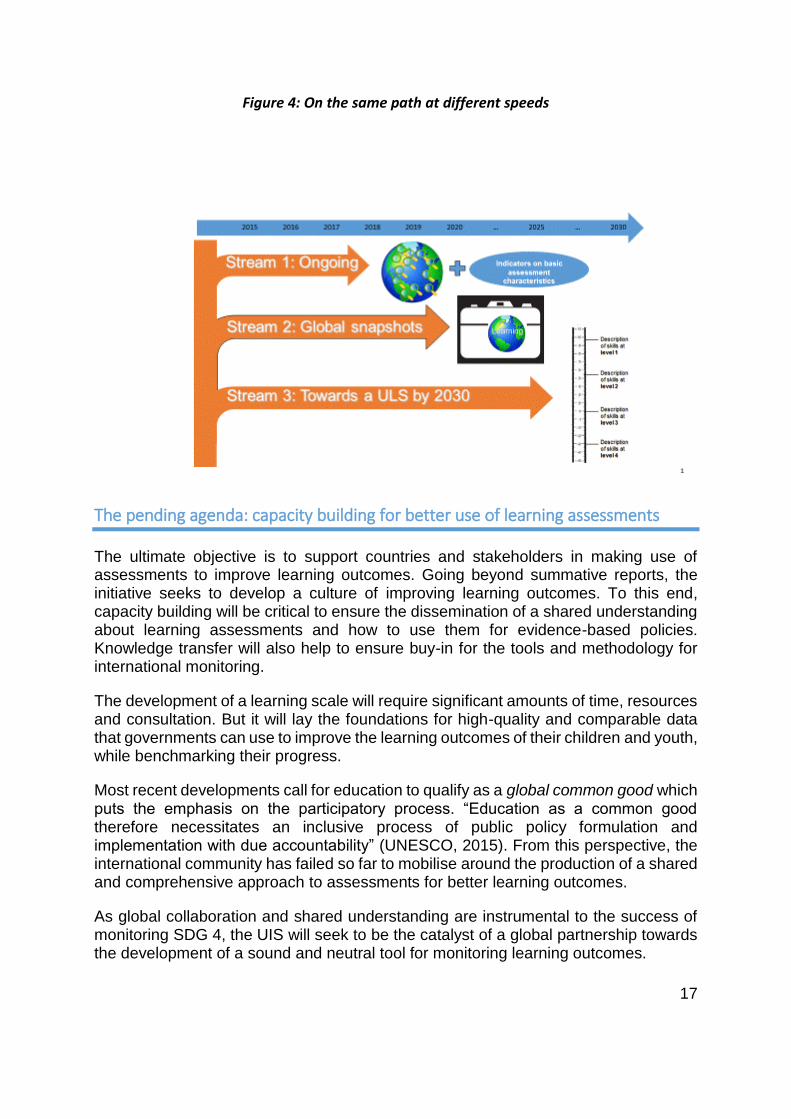
Figure 4: On the same path at different speeds
The pending agenda: capacity building for better use of learning assessments
The ultimate objective is to support countries and stakeholders in making use of assessments to improve learning outcomes. Going beyond summative reports, the initiative seeks to develop a culture of improving learning outcomes. To this end, capacity building will be critical to ensure the dissemination of a shared understanding about learning assessments and how to use them for evidence-based policies. Knowledge transfer will also help to ensure buy-in for the tools and methodology for international monitoring.
The development of a learning scale will require significant amounts of time, resources and consultation. But it will lay the foundations for high-quality and comparable data that governments can use to improve the learning outcomes of their children and youth, while benchmarking their progress.
Most recent developments call for education to qualify as a global common good which puts the emphasis on the participatory process. “Education as a common good therefore necessitates an inclusive process of public policy formulation and implementation with due accountability” (UNESCO, 2015). From this perspective, the international community has failed so far to mobilise around the production of a shared and comprehensive approach to assessments for better learning outcomes.
As global collaboration and shared understanding are instrumental to the success of monitoring SDG 4, the UIS will seek to be the catalyst of a global partnership towards the development of a sound and neutral tool for monitoring learning outcomes.

18
The first phase of the initiative is set to start in a few weeks, beginning with consultations with Member States on UIS products and services and an evaluation of the demands in the area of learning outcomes. The UIS will conduct a regional consultation with its data providers (ministries of education and national statistical offices) as well as data users of UIS products and services. The survey will cover dimensions such as the importance and knowledge of UIS data based on the national submissions, accessibility of UIS statistics (with reference to reports and the UIS Data Centre), quality of the technical assistance and statistical training workshops provided by the UIS, mechanisms of data requests by the UIS, channels of communication, quality of UIS electronic questionnaires, as well as the mechanisms for verification and validation of data and indicators. Additionally, the survey will include a component on the services and products that users would want to receive from the UIS.
The subsequent steps include empirical validation (leveraging existing resources and initiatives to validate the scale and produce initial results); dissemination round (demonstrating usefulness of application and communicating on the existence of the scale); adoption round (ensuring countries’ ownership and knowledge transfer, preserving countries and regions specificities, developing indicators to produce international monitoring); sustainability round (setting up mechanisms for the update, maintenance and expansion of the scale).


