MONITORING AND CONTROL DESIGN CONCEPT DESCRIPTIONS Name Designation Affiliation Date Signature Submitted by: Yashwant Gupta Project lead NCRA 2011-10-24 Yogesh Wadadekar, Yashwant Gupta, Niruj Mohan Ramanujam, Jayaram Chengalur, Jitendra Kodilkar, R. Balasubramanian, N. Swaminathan, Amrit Lal Ahuja, Tejaswini Jana, Piyush Laad, Sunu Engineer, Vivek Mohile Accepted by: T.J. Stevenson System Engineer SPDO 2011-10-24 Approved by: Peter Dewdney Project Engineer SPDO 2011-10-24 TBR Document number .................................................................. WP2-005.065.020-TD-002 Revision......................................................................................................................... 0.2 Author ..................................................................... Yogesh Wadadekar et al (see below) Date ................................................................................................................ 2011-10-24 Status ................................................................................................................ Submitted
Transcript
MONITORING AND CONTROL DESIGN CONCEPT DESCRIPTIONS
Name Designation Affiliation Date Signature
Submitted by:
Yashwant Gupta
Project lead NCRA 2011-10-24
Yogesh Wadadekar, Yashwant Gupta, Niruj Mohan Ramanujam, Jayaram Chengalur, Jitendra Kodilkar, R. Balasubramanian, N. Swaminathan, Amrit Lal Ahuja, Tejaswini Jana, Piyush Laad, Sunu Engineer, Vivek Mohile
Accepted by:
T.J. Stevenson System Engineer SPDO 2011-10-24
Approved by:
Peter Dewdney Project Engineer SPDO 2011-10-24 TBR
Document number .................................................................. WP2-005.065.020-TD-002 Revision......................................................................................................................... 0.2 Author ..................................................................... Yogesh Wadadekar et al (see below) Date ................................................................................................................ 2011-10-24 Status ................................................................................................................ Submitted
WP2-005.065.020-TD-002 Revision : 0.2
Page 2 of 69
DOCUMENT HISTORY Revision Date Of Issue Engineering Change
Number
Comments
A 2011-09-05 - Initial draft: not ready for internal review
B 2011-09-29 Updated draft for SPDO review.
0.1 2011-10-07 Draft released for external review
0.2 2011-10-24 Final version submitted to CoDR Panel
DOCUMENT SOFTWARE Package Version Filename
Word processor MS Word Word 2010 04_WP2-005.065.020-TD-002v0.2_dcd
Block diagrams
Other
ORGANISATION DETAILS Name National Centre for Radio Astrophysics
1.1 Scope of the document ..................................................................................................................................... 8 1.2 Purpose of the document ................................................................................................................................. 8
4.1 Hierarchical Semi-Autonomous Control ......................................................................................................... 13 4.1.1 Strengths and limitations of this approach ............................................................................................. 14
4.2 Service Capability Matching ............................................................................................................................ 15 4.2.1 Strengths and Limitations of this Approach ............................................................................................ 16
5 ADDRESSING THE DRIVING REQUIREMENTS ........................................................................... 18
5.1 Control ............................................................................................................................................................. 18 5.2 Monitoring....................................................................................................................................................... 20 5.3 Support for Concurrent Observations and Sub-Arrays ................................................................................... 22 5.4 Heterogeneous receptor types ....................................................................................................................... 23 5.5 Metadata Augmentation ................................................................................................................................. 24 5.6 Support for Science Performance Management ............................................................................................. 27 5.7 Support for Operations ................................................................................................................................... 28
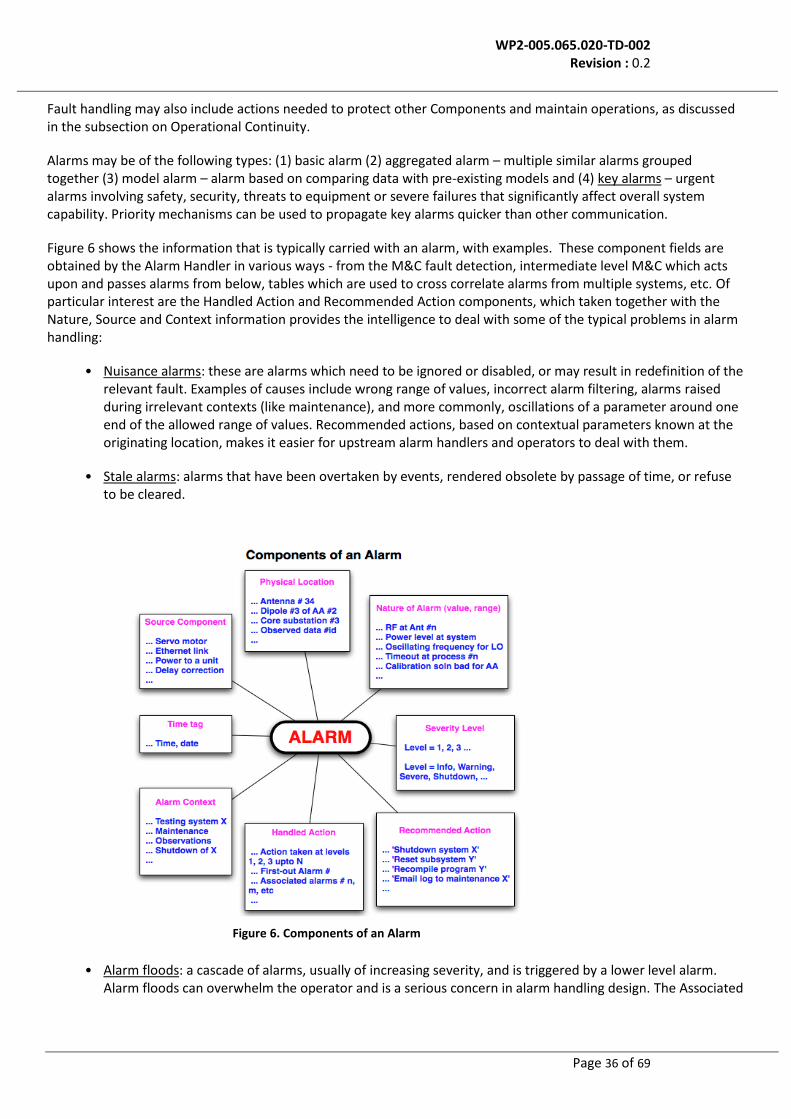
LIST OF FIGURES Figure 1. Hierarchical Semi-Autonomous Control........................................................................................................... 13 Figure 2. Service Capability Matching ............................................................................................................................. 15 Figure 3. SKA Observation Flow ...................................................................................................................................... 18 Figure 4. M&C Observation Control Sequence ............................................................................................................... 19 Figure 5. Operations Support Databases ........................................................................................................................ 30 Figure 6. Components of an Alarm ................................................................................................................................. 36 Figure 7. Archiving Schema ............................................................................................................................................. 41 Figure 8. Archive Usage ................................................................................................................................................... 42 Figure 9. Deployment view of M&C ................................................................................................................................ 62 Figure 10. Typical Local M&C Block Structure................................................................................................................. 64
LIST OF TABLES Table 1. Inventory of monitoring data ............................................................................................................................ 20 Table 2. Typical metadata ............................................................................................................................................... 26 Table 3. Support for Operations: Summary .................................................................................................................... 30 Table 4. Alarm Handling Methods ................................................................................................................................... 38
WP2-005.065.020-TD-002 Revision : 0.2
Page 6 of 69
LIST OF ABBREVIATIONS AA..... ................. Aperture Array AD ...................... Applicable Document ALMA ................. Atacama Large Millimetre Array AMGA ................ ARDA Meta-data Grid Application ARDA ................. A Realisation for Distributed Analysis (for HCL) API ..................... Application Programming Interface ASKAP ............... Australian Square Kilometre Array Pathfinder ASTRON ............ Netherlands Foundation for Research in Astronomy Astro-WISE ........ Astronomical Wide-field Imaging System for Europe AWE .................. Astro-Wise Environment CAN Bus ............ Controller Area Network Bus CCD ................... Charge-Coupled Device CERN ................ European Organization for Nuclear Research (European Council for Nuclear Research) CoDR ................. Concept Design Review CORBA .............. Common Object Request Broker Architecture DCS ................... Distributed Control System DDS ................... Data Distribution Service DOI .................... Digital Object Identifier EPICS ................ Experimental Physics & Industrial Control System EVLA ................. Expanded Very Large Array FITS ................... Flexible Image Transport System FMECA .............. Failure Modes, Effects and Criticality Analysis FTA .................... Fault Tree Analysis HALT ................. Highly Accelerated Life-cycle Testing IP ....................... Internet Protocol I/O ...................... Input/output ISO .................... International Organization for Standardization IEC ..................... International Electro technical Commission LASER ............... LHC Alarm SERvice LHC ................... Large Hadron Collider LOFAR ............... Low Frequency Array for Radio-astronomy LRU ................... Line Replacement Unit M&C ................... Monitoring and Control Mbps .................. Mega bits per second MTBF ................. Mean Time Between Failures MTTR ................. Mean Time To Repair OMG .................. Object Management Group OS ..................... Operating System PLC .................... Programmable Logic Controller PROFIBUS ........ PROcess FIeld BUS QoS ................... Quality of Service RFI ..................... Radio Frequency Interference SCADA .............. Supervisory Control And Data Acquisition SKA ................... Square Kilometre Array SKA1 ................. SKA Phase 1 SKA 2 ................ SKA Phase 2 SPDO ................ SKA Program Development Office TBC ................... To Be Confirmed TBD ................... To Be Determined TBF .................... To Be Filled In TBW ................... To Be Written USB ................... Universal Serial Bus VO ..................... Virtual Observatory
WP2-005.065.020-TD-002 Revision : 0.2
Page 7 of 69
GLOSSARY Central M&C: The portion of the M&C system that is located at the Operations & Maintenance Centre, and responsible for management of the system as a whole rather than a portion of it. Common Operating State: An abstraction of the actual state of Components so that different Components can be treated uniformly by Regional M&C from the viewpoint of determining validity of transitions and validity of particular operations in a given state. The Common Operating State captures the health and usage status of entities. Domain M&C: An auxiliary M&C system that manages resources belonging to a particular domain e.g. signal transport equipment, power equipment. This is developed (or acquired) by that domain and is outside the primary M&C hierarchy. Entity: A generic term that may span any granularity from Element to Component to Part. Key Alarms: High-severity alarms. Local M&C: Controller for a Component typically developed by the Component provider, possibly off-the-shelf. Monitoring points: Data items (including logs and reports), alarms or events that are forwarded up the system periodically or on-occurrence from the point of origin. Monitoring points may be processed, combined or abstracted by receivers to generate new monitoring points. Operating Mode: A property of entities that reflect who can control the entity, and its relationships to other entities. In Integrated mode, the entity is fully functional and under the control of its parent nodes / operators. In Offline mode, the entity is under the control of maintenance engineers and not available to participate in normal operations. In Commissioning mode, the entity is not yet operational, has a lesser level of trust, and operates such that it does not interfere with the functioning of other entities (e.g. logical isolation of Commissioning network). In Testing mode the entity is partially functional and is available to participate only in test operations. The Testing and Commissioning modes affect the handling and propagation of alarms from the entity. Regional M&C: M&C functionality that has primary responsibility for management of a portion of the system. This could be a station, a portion of the Core, or the collection of sensors and actuators in the system that is not associated with any station or Core. Standardised Component Interface: All Components that interface with Regional M&C must conform to a standardised interface definition created by M&C. This includes not only interaction protocols at the software, hardware and technology levels, but also governance constraints on functionality and behaviour. Sub-array: A logical partitioning of array of receptors into sub-groups to carry out different observations in parallel and control them concurrently. System M&C: The parts of M&C developed by the M&C team i.e. Central M&C and Regional M&C.
WP2-005.065.020-TD-002 Revision : 0.2
Page 8 of 69
1 Introduction
1.1 Scope of the document
This document relates to the SKA Monitoring and Control Domain Element and its Sub-elements. It is of a maturity commensurate with a Concept level of definition of the M&C Domain and the SKA Observatory as a whole. Though much of the documentation is limited in scope to SKA1, the M&C design concept is scoped to the full SKA because of the challenges of retrofitting major architectural change into developed software, and because most of the M&C capabilities needed for the eventual system will need to be in place by SKA1. It also forms the working basis of the M&C Architecture Document to be prepared for the future Preliminary Design Review.
1.2 Purpose of the document
The purpose of this document is to identify the major design issues in the design of the SKA Monitoring & Control Element and its Sub-elements, identify candidate solutions, and synthesise them into architectural alternatives, with an evaluation of their relative strengths and limitations. The objective is to analyse the feasibility of meeting requirements and determine the further work needed to firm up requirements and develop the SKA M&C architecture. The document describes a number of potential solutions to design concerns. It should be emphasised that all solutions discussed in this document are purely explorations to determine feasibility of meeting design objectives. Nothing in this document should be taken as describing an actual design decision. Design decisions will be taken only after the requirements are fully established, during the Preliminary Design phase.
WP2-005.065.020-TD-002 Revision : 0.2
Page 9 of 69
2 References
2.1 Applicable documents
The following documents are applicable to the extent stated herein. In the event of conflict between the contents of the applicable documents and this document, the applicable documents shall take precedence.
[1] ‘SKA Phase 1 System Requirements Specification’, T. Stevenson et al, WP2-005.030.000-SRS-002, February
2011, Rev B.
[2] ‘The Square Kilometre Array Design Reference Mission: SKA Phase 1’, January 2011, Rev v1.3.
[3] ‘SKA Configurations Design’, R. Bolton et al, WP3-050.020.000-R-002, February 2011, , Rev A.
[4] ‘Strategies and Philosophies’, K. Cloete et al, WP2-005.010.030-TR-001, February 2011, Rev F.
[5] ‘SKA Operational Concepts’, P.E. Dewdney, WP2-001.010.010-PLA-002, February 2011, Rev A.
[6] 'SKA1: High Level System Description', P.E. Dewdney et al, WP2-005.030..010-TD-002, 2011-02-14, Rev A.
[7] RFI/EMC Control Plan WP2-005.080.020.PL-001.
[8] Design & Development Plan WP2-005.080.030-PL-001.
[10] 'Practices for Software Development Rev C', WP2-050.040.010-SR-003-A, work in progress.
[11] 'Policies for Software Acquisition and Development Rev A, WP2-050.040.010-SR-004-A, work in progress.
[12] Signal Transport and Networks High-level Description, WP2-030.030.030-TD-001.
2.2 Reference documents
The following documents are referenced in this document. In the event of conflict between the contents of the referenced documents and this document, this document shall take precedence.
[13] ‘SKA Monitoring & Control strategy’, N. Swaminathan et al, WP2-005.065.000-R-001-H_MCStrategy,
February 2011, Rev H.
[14] ‘SCADA in the LOFAR radio telescope’, Kjeld v.d. Schaaf, E. Lawerman, 2005, 10th ICALAPCS Int. Conf. on
Accelerator & Large Expt. Physics Control System, Geneva, Oct 2005.
[15] ‘ASTRO-WISE Architectural Design’, Astro-Wise consortium, July 2003 Ver 1.0, http://www.astro-
M&C Requirements are documented in [26], derived from the high-level system requirements [1]. Of all the requirements, certain requirements that are both critical and challenging to achieve are identified as critical design drivers i.e. driving requirements that determine the architecture:
Science Support
o Complete support for Control of operations and Monitoring of system functioning and its
environment, given the need for extensive automated operation.
o Support for multiple Concurrent observations using the same infrastructure e.g. a piggy back
transient survey.
o Augmentation of the science data with metadata reflecting the engineering parameters of the
observation. The scale of SKA necessitates abstraction in the augmentation, however it must also be
possible to obtain more detailed engineering information for analysis.
o Bidirectional support for science performance management including providing parameters to signal
processing and providing an interface to enable that domain to dynamically tune system
configuration parameters that affect science performance.
o Coordination of heterogeneous receptor types that operate together to perform an observation.
o Dynamically partitioning the system into sub-arrays that are controlled independently and carry out
observations concurrently.
Engineering Concerns
o Support for Operations: M&C is tightly coupled with System Operations, providing automation
support to complement and facilitate the work of operators and engineers. Challenges and special
needs in this area include avoidance of information overload to operators and other users,
automated real-time information exchange with external entities such as weather stations and
resource providers, and handling of control latencies given the wide geographic distribution of the
telescope.
o Fault management, given that some parts of such a large system will always be faulty or under
maintenance. Maximizing the capability for remote management.
o Threats prevention, detection and handling to ensure safety, security and integrity.
o Reliability, Availability and Performance of Monitoring and Control.
o Support for continuous system deployment and evolution over a long lifetime, leading to
requirements for continuous integration and commissioning of entities while the system is
operational.
Opportunity Features
o Support for intelligent resource management i.e. correlating information from multiple sources to
reduce the consumption of resources such as power, communication bandwidth and processing
power. This feature is not currently a formal program requirement, but a potential opportunity to
reduce operational costs that will require support in the architectural foundations of M&C.
WP2-005.065.020-TD-002 Revision : 0.2
Page 13 of 69
4 Candidate Architectures
The structure of M&C consists of three hierarchical tiers:
Central M&C, which performs system-wide control and monitoring functions.
Regional M&C, which performs control and monitoring, functions for all the equipment at a single region. Receptors and other equipment in the Core may also be grouped into regions from the M&C perspective.
Local M&C, which performs control and monitoring functions for an individual Component and/or its subsystems e.g. receptor, power transformer.
One of the primary architectural points of variation in the M&C design is the relationship between these tiers. There are two competing alternatives:
Traditionally, M&C systems have fixed parent-child relationships among nodes in the hierarchy. Thus for example, there may be a predefined Regional M&C node in a region (possibly consisting of multiple processors, but logically a single entity) and all equipment at the region connects to that node for M&C functions.
An alternative is to create the hierarchy dynamically through service-oriented approaches. Child nodes are reconceptualised as "service provider nodes", while parent nodes such as the Regional M&C become "service consumer nodes" that dynamically request services from the provider nodes, and bind them into a hierarchy for the duration of an observation (or other system goal) based on a commitment process. This scheme adds complexity, but is potentially more resilient to failures, and potentially more intelligent about the relationship between science goals and the engineering capabilities provided by Components.
This section describes these competing candidate architectures, and assesses their comparative strengths and limitations. Interestingly, it turns out that this architectural variation point has relatively little influence on other aspects of M&C design and system functioning. Once the hierarchy is established, the functioning of the system is pretty much identical across both approaches. This will become clear in Section 5, where the solutions discussed to address the design challenges are mostly independent of which architectural option is chosen, except in a few cases. However, the architectural choice does influence overall systemic properties such as resilience and ability to pinpoint the source of gaps in science performance.
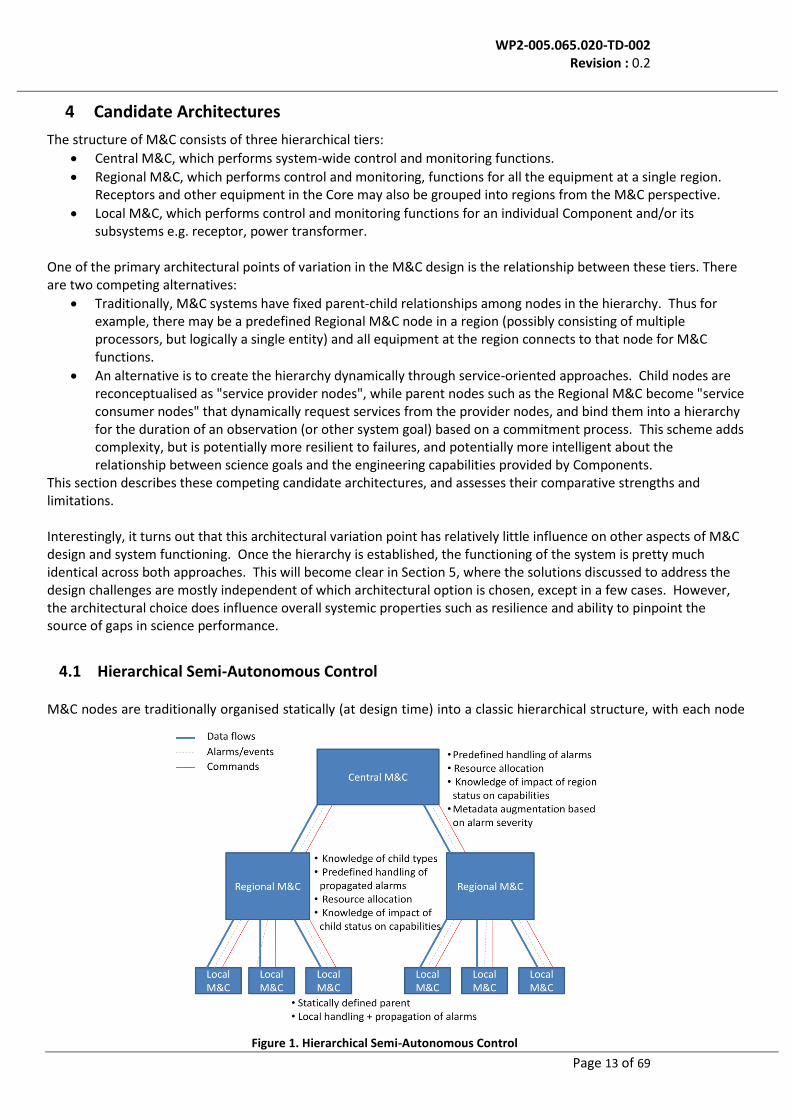
4.1 Hierarchical Semi-Autonomous Control
M&C nodes are traditionally organised statically (at design time) into a classic hierarchical structure, with each node
Figure 1. Hierarchical Semi-Autonomous Control
WP2-005.065.020-TD-002 Revision : 0.2
Page 14 of 69
in the system having inbuilt knowledge of the identity of its M&C controller (parent node). In turn, parent nodes have full knowledge of their child nodes, at least in terms of the various child node types, their individual capabilities, and the impact of failures on the ability of the parent node to achieve its goals.
o For example, if a power supply unit reports an alarm, the region controller is pre-programmed with knowledge of how to handle the alarm, whether it is necessary to shut down other Components (e.g. antennas), and whether the region as a whole should declare itself faulty.
The architectural relationships between tiers in hierarchical semi-autonomous control are shown in Figure 1. In this type of architecture, each node provides a set of capabilities (e.g. steer to an orientation, track a target, perform observations, distribute power, provide cooling etc) to its parent node, along with a control interface to invoke its capabilities. Parent nodes are preconfigured with knowledge of child node interfaces and capabilities. They receive commands from their parent nodes, and implement these commands by orchestrating the behaviour of their child nodes to achieve the desired capability. They send commands to child nodes, receive responses as well as alarms and exceptions, and have full pre-programmed knowledge of how to handle these alarms and exceptions. Child nodes have full autonomy of how to implement each command (and deliver the associated capabilities), however they cannot reject a command unless it is not well-formed (e.g. syntactically erroneous) or semantically inappropriate (not applicable/available in the current state). Their overall functioning is fully directed by the parent nodes, while they have autonomy over their internal realization of the desired behaviour. This pattern is generally referred to as hierarchical semi-autonomy. Fault handling in this architecture is typically based on simple pre-programmed rules. Nodes at each level of the control hierarchy provide their health status. If the node is healthy, the parent node assumes that it is capable of meeting the science needs (as determined by the offline scheduler), configures it and issues commands. If the node declares a fault status, then the control algorithm of the parent node (as created by the offline scheduler) detects the fault status and reacts according to the pre-programmed schedule, either continuing with the planned control sequence or switching to an alternative pathway, depending on the severity of the fault. In short, non-faulty operation is considered the default, with faults being situations to be handled as special cases.
4.1.1 Strengths and limitations of this approach
The semi-autonomy architecture enables M&C nodes to be hierarchically composed to control even large systems with thousands of distributed entities. It is a widespread design that has proven successful over decades. It is relatively simple, easy to implement and performs sufficiently well for most control applications. This is the architectural pattern used in each of the reviewed precursor radio astronomy projects (except MeerKat, which uses service-oriented architectural concepts). The limitation of this architecture is that it is relatively less dynamic and less robust.
o Typically, it does not include plug-n-play features i.e. a new node that is commissioned cannot simply connect to the parent node and start participating in observations. Instead, the parent node typically has to be pre-programmed with knowledge of the new Component, including the command set supported, the alarms it can raise and how they should be handled etc. It should be noted that it is possible to support limited plug-n-play in this architecture, so that it can accommodate new nodes of a previously known type.
o The defined parent node becomes a single point of failure for the system (though it is possible to create failover capabilities by which another unit will assume parent node responsibilities).
o Intelligent fault handling becomes more difficult as the system scales up. If a region with a hundred Components reports two faults, (say) a power quality problem plus a failed antenna, it is difficult for the scheduler to assess the impact of the combination of these faults on the observation in progress. Instead, decisions such as whether to continue observing or switch to a less demanding activity must be made either on high level abstractions ("2% of the dishes have failed, 25% may experience transient faults") or it must rely on detection of data quality problems during the science data processing. It should be noted that relying on operator intelligence becomes more problematic in large systems, where at any given time there are
WP2-005.065.020-TD-002 Revision : 0.2
Page 15 of 69
multiple faults in the system, and operators cannot easily assess the collective impact of combinations of faults.
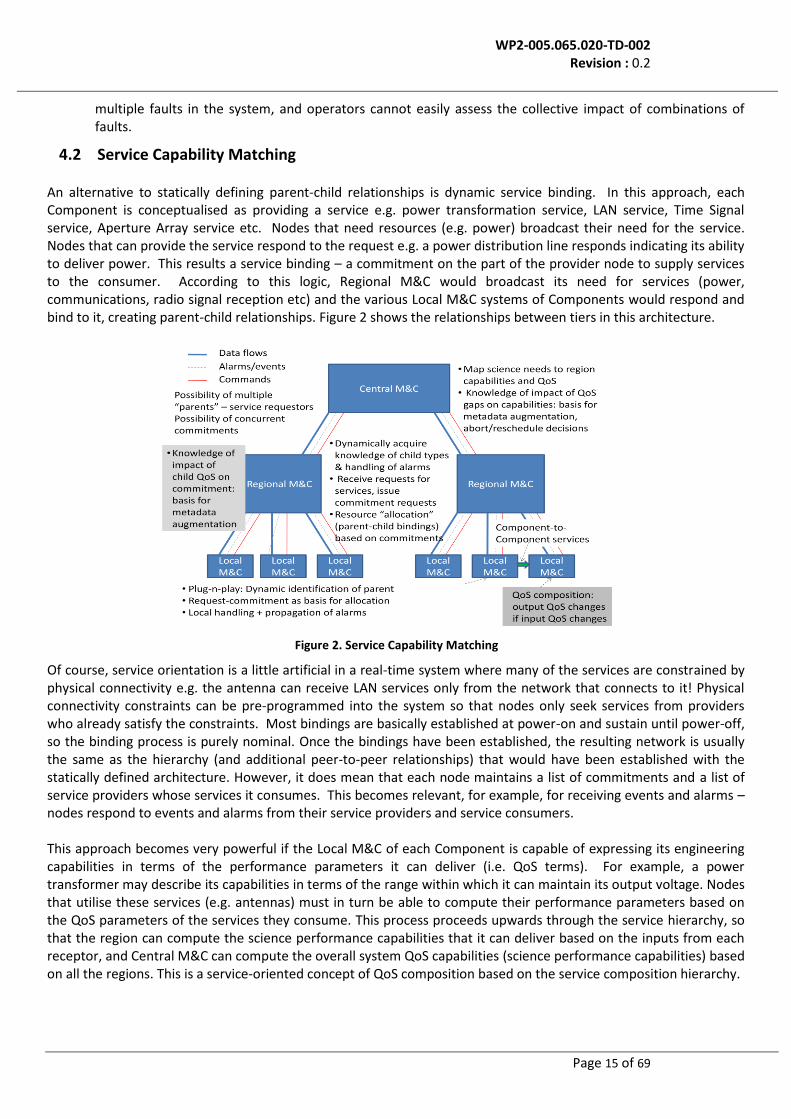
4.2 Service Capability Matching
An alternative to statically defining parent-child relationships is dynamic service binding. In this approach, each Component is conceptualised as providing a service e.g. power transformation service, LAN service, Time Signal service, Aperture Array service etc. Nodes that need resources (e.g. power) broadcast their need for the service. Nodes that can provide the service respond to the request e.g. a power distribution line responds indicating its ability to deliver power. This results a service binding – a commitment on the part of the provider node to supply services to the consumer. According to this logic, Regional M&C would broadcast its need for services (power, communications, radio signal reception etc) and the various Local M&C systems of Components would respond and bind to it, creating parent-child relationships. Figure 2 shows the relationships between tiers in this architecture.
Of course, service orientation is a little artificial in a real-time system where many of the services are constrained by physical connectivity e.g. the antenna can receive LAN services only from the network that connects to it! Physical connectivity constraints can be pre-programmed into the system so that nodes only seek services from providers who already satisfy the constraints. Most bindings are basically established at power-on and sustain until power-off, so the binding process is purely nominal. Once the bindings have been established, the resulting network is usually the same as the hierarchy (and additional peer-to-peer relationships) that would have been established with the statically defined architecture. However, it does mean that each node maintains a list of commitments and a list of service providers whose services it consumes. This becomes relevant, for example, for receiving events and alarms – nodes respond to events and alarms from their service providers and service consumers. This approach becomes very powerful if the Local M&C of each Component is capable of expressing its engineering capabilities in terms of the performance parameters it can deliver (i.e. QoS terms). For example, a power transformer may describe its capabilities in terms of the range within which it can maintain its output voltage. Nodes that utilise these services (e.g. antennas) must in turn be able to compute their performance parameters based on the QoS parameters of the services they consume. This process proceeds upwards through the service hierarchy, so that the region can compute the science performance capabilities that it can deliver based on the inputs from each receptor, and Central M&C can compute the overall system QoS capabilities (science performance capabilities) based on all the regions. This is a service-oriented concept of QoS composition based on the service composition hierarchy.
Figure 2. Service Capability Matching
WP2-005.065.020-TD-002 Revision : 0.2
Page 16 of 69
This facilitates considerably more intelligent fault management, particularly if the required capabilities to execute a scientific observation are also expressed in QoS terms i.e. in terms of desired and minimum acceptable science performance parameters. Then the scheduler can decide which observations can be carried out based on the match between their desired performance parameters, and the current capabilities of the instrument based on the health status of its various entities. In the ideal world, this matching process would take place at each level of the hierarchy, so that (for example) Regional M&C nodes would try to create a match between the performance parameters they are committed to deliver and the QoS capabilities of available Components. This architectural pattern of service capability matching thus incorporates three schemes:
o Dynamic binding of services resulting in commitments. o QoS capability expression and composition based on the service composition hierarchy. o Matching desired capabilities with available capabilities based on QoS parameters.
MeerKAT M&C makes limited use of service-oriented architecture [35]. The standard katcp interface supports introspection and discovery, but only for monitoring points and commands and not for services. The discovered monitoring points and commands are then automatically included in the M&C hierarchy and stored, exposed for control in scripts, etc. Flexibility is implemented through templated, standardised configuration that is served to all components from a central configuration server and not through service discovery. Plug-n-play is supported for number of components and any katcp (standard interface) device/component.
4.2.1 Strengths and Limitations of this Approach
This is a futuristic architecture, with QoS composition still being a research issue. Service-oriented architectures are increasingly becoming common for machine control applications; however it is well-recognised that QoS composition is extremely challenging to accomplish successfully for general domains. It is a futuristic architecture also in the sense that with the increasing prevalence of service orientation, and on-going research in QoS composition, this type of architecture may become feasible in the medium term. There are several potential benefits from this architecture, if it were to be feasible:
o Intelligent fault management, as discussed above. o Resilience to failures. The failure of a parent node can be handled by introducing a new parent node that
takes over commitments or obtains fresh commitments. The failure of a service provider can be handled by broadcasting requests for an alternative provider, if any.
o It enables considerably more powerful metadata augmentation, since the impacts of faults are translated to impacts on science performance parameters. Deciding which faults require metadata tagging becomes relatively simple: it depends on how much each fault affects performance parameters. Capturing this chain would considerably facilitate science data interpretation, since the instrument itself has the best knowledge of how faults can be expected to affect capabilities and outcomes.
o It facilitates intelligent resource management. If there is equipment that can operate in different modes that consume more/less resources to deliver superior/inferior performance parameters (e.g. operate at higher/lower power levels, consume more or less communication bandwidth to produce different accuracies), then its operating mode can be selected based on the desired performance parameters, saving resources.
o It can deal with concurrent commitments to multiple requestors. This is necessary for intelligent resource allocation. With current designs, the feasibility of concurrent operations has to be determined at least partly by human intelligence. For example, with continuous commissioning, there may be a need to commission a new antenna while other antennas in the region are participating in an observation. Determining whether this creates conflicts because of impacts on shared resources (e.g. power, networking) is largely the responsibility of people: commissioning team, operator. With this architecture, the service providers could potentially detect and reject commitment conflicts.
o It can support plug-n-play introduction of new Components.
WP2-005.065.020-TD-002 Revision : 0.2
Page 17 of 69
However, while it is potentially very attractive, it is not currently an option with demonstrated feasibility. The limitations include
o Feasibility not established. Advanced design followed by prototyping is necessary to determine whether QoS composition is currently feasible for the radio astronomy domain. Even if it proves to be feasible, it would carry high risk, since it does not have a proven track record.
o Significantly higher complexity. Every Component would have to express its QoS and know how to perform QoS composition. Also every Component would need to support dynamic service binding. The scheduler and M&C nodes would have to implement capability matching. Bugs in any of this functionality could have major impacts on reliability and availability.
o Performance overheads to perform QoS composition, dynamic binding etc. o Service-orientation works well in stateless systems. Because of commitments that create a long-lasting
connection between provider and consumer, real-time systems are intrinsically tasteful. Many of the traditional benefits of the service-oriented approach (such as resilience to provider failures) may not be realised fully for real-time systems because of this.
It should be noted that the choice between the candidate architectures is not a binary choice. It is possible to combine static parent-child and producer-consumer relationships with QoS composition, or adopt a service-oriented approach without QoS composition. The hierarchical semi-autonomous architecture is adopted as the baseline for the rest of this document, but the actual architectural decision will be made in the Preliminary Design phase.
WP2-005.065.020-TD-002 Revision : 0.2
Page 18 of 69
5 Addressing the Driving Requirements
This section elaborates the M&C design by discussing how each of the driving requirements can be addressed. In
most cases, the solution is independent of which candidate architecture is chosen. The solutions are based on the
hierarchical semi-autonomy architecture. In cases where the Service Capability Matching architecture enables a
superior solution to the design concern, this alternative solution is discussed as well.
5.1 Control
A primary function of M&C is to provide the control capabilities need to perform observations using the instrument.
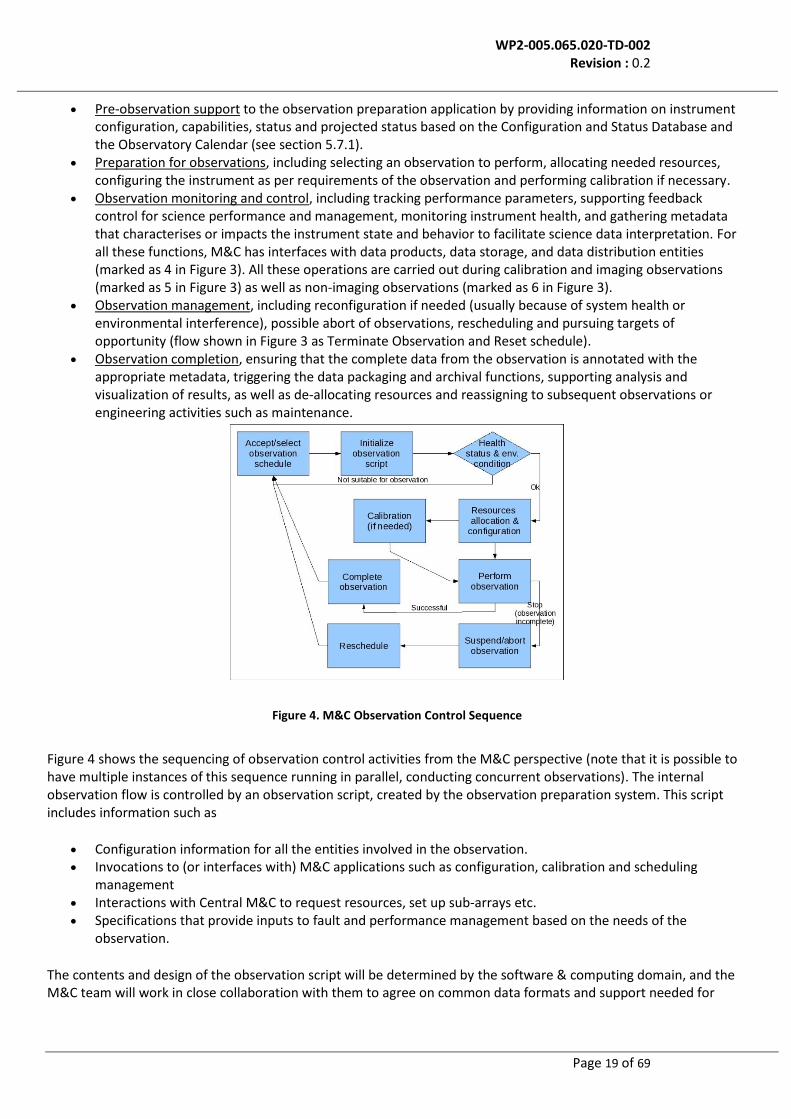
The SKA observation flow is shown in Figure 3. M&C support for this observation cycle includes the following aspects:
Figure 3. SKA Observation Flow
WP2-005.065.020-TD-002 Revision : 0.2
Page 19 of 69
Pre-observation support to the observation preparation application by providing information on instrument configuration, capabilities, status and projected status based on the Configuration and Status Database and the Observatory Calendar (see section 5.7.1).
Preparation for observations, including selecting an observation to perform, allocating needed resources, configuring the instrument as per requirements of the observation and performing calibration if necessary.
Observation monitoring and control, including tracking performance parameters, supporting feedback control for science performance and management, monitoring instrument health, and gathering metadata that characterises or impacts the instrument state and behavior to facilitate science data interpretation. For all these functions, M&C has interfaces with data products, data storage, and data distribution entities (marked as 4 in Figure 3). All these operations are carried out during calibration and imaging observations (marked as 5 in Figure 3) as well as non-imaging observations (marked as 6 in Figure 3).
Observation management, including reconfiguration if needed (usually because of system health or environmental interference), possible abort of observations, rescheduling and pursuing targets of opportunity (flow shown in Figure 3 as Terminate Observation and Reset schedule).
Observation completion, ensuring that the complete data from the observation is annotated with the appropriate metadata, triggering the data packaging and archival functions, supporting analysis and visualization of results, as well as de-allocating resources and reassigning to subsequent observations or engineering activities such as maintenance.
Figure 4 shows the sequencing of observation control activities from the M&C perspective (note that it is possible to have multiple instances of this sequence running in parallel, conducting concurrent observations). The internal observation flow is controlled by an observation script, created by the observation preparation system. This script includes information such as
Configuration information for all the entities involved in the observation. Invocations to (or interfaces with) M&C applications such as configuration, calibration and scheduling
management Interactions with Central M&C to request resources, set up sub-arrays etc. Specifications that provide inputs to fault and performance management based on the needs of the
observation.
The contents and design of the observation script will be determined by the software & computing domain, and the M&C team will work in close collaboration with them to agree on common data formats and support needed for
Figure 4. M&C Observation Control Sequence
WP2-005.065.020-TD-002 Revision : 0.2
Page 20 of 69
script functioning. Related aspects such as the need for a Common Software Library to work with observation scripts are discussed in [29]
During observation preparation, M&C actively checks the status of all requested resources, as well as environment parameters. Observation control applications may also define and subscribe to threshold events & alarms on environment and performance parameters. If gaps are detected between the desired and actual observation context during pre-observation, pilot scan or during observation, the applications will be able to make dynamic reconfiguration and rescheduling decisions and implement them through M&C control APIs.
The functions of M&C are likely to include providing some support for translation of science parameters to engineering parameters and associated commands as well as support for continuous monitoring and computation of science performance parameters. The degree of support and the precise interfaces will be determined in collaboration with Software and Computing. The level of this support will be enhanced considerably if the Service Capability Matching architecture is deployed.
In addition to calibration support, M&C can also provide interfaces with applications at Regional as well as Central nodes for providing setpoint inputs to the continuous feedback control algorithms implemented within M&C. This is useful, for example, so that Components along the science data path such as beam formers, Correlator and post-processing algorithms can provide feedback to improve science performance.
One of the potential challenges in a large distributed system such as SKA is the control latency involved in distributing commands over long distance, and its effect on coordination. Fortunately, the presence of an extremely accurate time reference across the entire system provided by the Timing and Synchronization network simplifies this task, by making it possible to use absolute time values to coordinate time-critical actions wherever necessary.
5.2 Monitoring
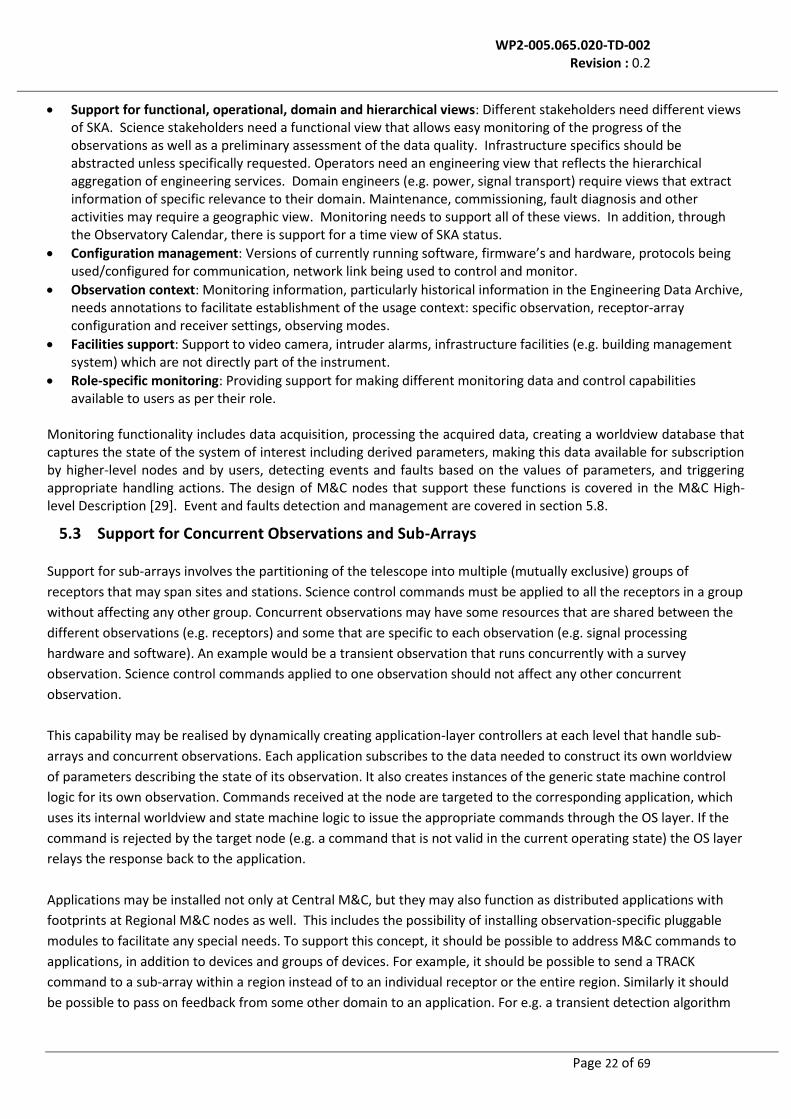
The objectives of monitoring include tracking the configuration, status, state and behavior of the system as a whole and its constituent entities. This includes monitoring various parameters and aspects of the environment and operational context, tracking the progress of observations and other system activities, tracking and understanding the performance of the system and individual entities, detecting health issues and gaps in behavior, auto-discovery and interrogation of new elements added to the system and in-depth exploration of entity state, parameters and behavior for troubleshooting.
Data Sources Data Types
Sources of science data (Antennae, stations, correlators) Signal amplitude, frequency band pattern, fringe pattern.
Monitoring data for all system components (Receptors, power, signal transport, cooling, facility)
Safety & security monitoring Video camera, motion sensors, audio monitors; intrusion detection; authentication and authorization devices; smoke detectors and other threat sensors.
Schedule and User Inputs Information about observations (observation settings, observer etc.) and other system activities in progress.
Table 1. Inventory of monitoring data
WP2-005.065.020-TD-002 Revision : 0.2
Page 21 of 69
Table 1 identifies some of the types of monitoring data in SKA and their sources. This is based on the following types of needs identified to date.
Science observations monitoring needs:
Observation infrastructure and progress summary: Monitor array-configuration, receptor configuration, tracking status (This includes astronomical object information and element tracking status), data acquisition status for the running projects.
Configured parameters: Monitor the receptor configuration (Observing frequency settings), array configuration, loaded parameters for the observation corrections (like which pointing model and when it is applied, present beam forming related parameters etc), software and hardware limits set in the dishes and AAs.
Science data quality and performance parameters: The signal processing facility computes data quality parameters from data that are collected and provided by M&C (e.g. round trip phase measurements). M&C itself may also compute a range of science performance parameters, (e.g. available sensitivity, interference levels etc.)
Hierarchical summary of health status: Since the SKA1 will have large number of dishes, AAs, and their huge network of sensors, there is a need for configurable alarms and drillable monitoring points that provide a hierarchical summary of health status to facilitate observation management decisions.
Logging of parameter calculations: Some of the real time parameters that need to be supplied to the subsystems (e.g. for pointing models, beam forming parameters, calibration parameters) would need to be logged so that they are available for subsequent debugging and/or astronomical data analysis.
Metadata: In addition to processing engineering parameters into drillable monitoring points that summarise instrument state, the monitoring and data processing system must also facilitate the providing of insights into the impact of instrument functioning on the science data. From the monitoring viewpoint, this places requirements to incorporate intelligence in the engineering data processing about the effect of engineering parameters on the science data at each level of the system, so that the right information can be supplied as metadata. The needs for metadata and its effect on the design of the processing system for engineering data will be worked out in collaboration with science computing. In addition to aiding more effective science data quality control, good metadata design can also facilitate early detection of problems, so that observing modes like pulsar search, transient search that produce huge amounts of astronomical data do not end up collecting huge amounts of defective data.
System monitoring needs:
Health monitoring: Monitoring the health and operational status of system entities along with influencing contextual factors, including overloads and capacity shortfalls, weather conditions etc.
Resource status, performance and utilization: Continuous computation of both engineering and science performance parameters and detection of potential problems based on performance parameters. Providing abstracted views of resource status, allocation and utilization of supporting system resources including receptors, networking, power, cooling and computational resources.
Query and drill down: Support visibility into the hierarchical derivation of the high-level abstracted views in the form of drill-downs, complemented by query modes that can retrieve specific parameters.
Introspection at high level: e.g. network status to each node, time-synchronization status etc.
Support for security, safety, integrity, regulatory compliance and fault management: All of these functions that support the automated and human management of engineering concerns depend heavily on monitoring capabilities. In many cases, monitoring latency can be critical. The design of the monitoring system must be coordinated with the architecture for these functions to enable low-latency response to threats. In addition there will be support regular and on demand audits of the system from a security and safety perspective.
Prioritization support: Ability to define priorities and target latencies based on either type of monitoring point or contents (i.e. specific values of monitored data will result in prioritised delivery).
WP2-005.065.020-TD-002 Revision : 0.2
Page 22 of 69
Support for functional, operational, domain and hierarchical views: Different stakeholders need different views of SKA. Science stakeholders need a functional view that allows easy monitoring of the progress of the observations as well as a preliminary assessment of the data quality. Infrastructure specifics should be abstracted unless specifically requested. Operators need an engineering view that reflects the hierarchical aggregation of engineering services. Domain engineers (e.g. power, signal transport) require views that extract information of specific relevance to their domain. Maintenance, commissioning, fault diagnosis and other activities may require a geographic view. Monitoring needs to support all of these views. In addition, through the Observatory Calendar, there is support for a time view of SKA status.
Configuration management: Versions of currently running software, firmware’s and hardware, protocols being used/configured for communication, network link being used to control and monitor.
Observation context: Monitoring information, particularly historical information in the Engineering Data Archive, needs annotations to facilitate establishment of the usage context: specific observation, receptor-array configuration and receiver settings, observing modes.
Facilities support: Support to video camera, intruder alarms, infrastructure facilities (e.g. building management system) which are not directly part of the instrument.
Role-specific monitoring: Providing support for making different monitoring data and control capabilities available to users as per their role.
Monitoring functionality includes data acquisition, processing the acquired data, creating a worldview database that captures the state of the system of interest including derived parameters, making this data available for subscription by higher-level nodes and by users, detecting events and faults based on the values of parameters, and triggering appropriate handling actions. The design of M&C nodes that support these functions is covered in the M&C High-level Description [29]. Event and faults detection and management are covered in section 5.8.
5.3 Support for Concurrent Observations and Sub-Arrays
Support for sub-arrays involves the partitioning of the telescope into multiple (mutually exclusive) groups of
receptors that may span sites and stations. Science control commands must be applied to all the receptors in a group
without affecting any other group. Concurrent observations may have some resources that are shared between the
different observations (e.g. receptors) and some that are specific to each observation (e.g. signal processing
hardware and software). An example would be a transient observation that runs concurrently with a survey
observation. Science control commands applied to one observation should not affect any other concurrent
observation.
This capability may be realised by dynamically creating application-layer controllers at each level that handle sub-
arrays and concurrent observations. Each application subscribes to the data needed to construct its own worldview
of parameters describing the state of its observation. It also creates instances of the generic state machine control
logic for its own observation. Commands received at the node are targeted to the corresponding application, which
uses its internal worldview and state machine logic to issue the appropriate commands through the OS layer. If the
command is rejected by the target node (e.g. a command that is not valid in the current operating state) the OS layer
relays the response back to the application.
Applications may be installed not only at Central M&C, but they may also function as distributed applications with
footprints at Regional M&C nodes as well. This includes the possibility of installing observation-specific pluggable
modules to facilitate any special needs. To support this concept, it should be possible to address M&C commands to
applications, in addition to devices and groups of devices. For example, it should be possible to send a TRACK
command to a sub-array within a region instead of to an individual receptor or the entire region. Similarly it should
be possible to pass on feedback from some other domain to an application. For e.g. a transient detection algorithm
WP2-005.065.020-TD-002 Revision : 0.2
Page 23 of 69
could trigger the archival of all transient data buffers associated with a given observation. This places a requirement
on the engineering design of the command interface, to design the parameter structure of commands accordingly.
The same feature of application control nodes may be used to support the construction and use of views other than
the science view e.g. domain views and geographic views. For instance, a Power Management solution could be
implemented as an application on the Central M&C node (or at the region node, for region-level power
management). It would subscribe to data relating to all the power equipment of interest, process the data to
compute control responses, and implement the control responses through the OS layer. It should be noted that off-
the-shelf power management applications can be easily adapted to function in this manner. There is also no
constraint that the application should reside on the same physical node as M&C – it could reside at an entirely
different physical node, provided it had access to the relevant worldview items through subscriptions, and the
authority to send commands to the target M&C nodes.
5.4 Heterogeneous receptor types
SKA2 includes four types of receptors: sparse aperture arrays, dense aperture arrays, wide-band single pixel feeds
and phased array feeds. Each of these receptor types has different configuration, calibration, steering and other
control commands, different needs as regards fault management, etc.
The challenge in handling this situation is twofold, viz. (1) coordinated control of all receptors of a particular type e.g.
for configuration parameter setting or software upgrade, and (2) exploiting commonality in logic at the system level.
For example, a particular collection of configuration parameters may apply to all phased array feeds. In order to set
these parameters, Central M&C could individually issue commands to every receptor of that type, resulting in an
enormous number of commands to be cascaded down to every node, but it is preferable to avoid such repetitive
control structures.
One alternative is to create a dynamic application node for each type, similar to that for sub-arrays. While this would
work well if there were no sub-arrays, the presence of sub-arrays would require a separate application controller for
each combination of sub-array and receptor type. This is an undesirable solution.
The other possibility is to allow addressability of commands by receptor type, similar to application addressability
supported for sub-arrays. Central M&C instructs the region to distribute the particular command only to receptors
of that type. This applies to all command types for which commonality is to be exploited, including configuration
commands, control commands and troubleshooting commands, as well to monitoring subscriptions e.g. the ability to
subscribe to particular monitoring data from dense aperture arrays only. This is the preferred solution. It is
applicable not only to receptor types, but also other equipment types e.g. only power reticulation equipment.
This does not fully address the problem of repetitive logic at each region. For example, fault handling logic for each
type of receptor would be needed in each region. Of course, this problem exists for devices other than receptors as
well e.g. every region needs to be able to handle alarms from cooling equipment. This duplication is not considered a
problem from a software design perspective: much of the control software may be the same for all regions (some
parts of the software will be different for outlying stations and Core regions) so there is no additional software effort
to create the duplicated logic.
WP2-005.065.020-TD-002 Revision : 0.2
Page 24 of 69
5.5 Metadata Augmentation
Any auxiliary data needed to fully interpret and process the science data is termed as metadata. The nature of metadata for radio telescopes data has generally been restricted to keywords (containing information about observational parameters like pointing direction, frequency settings etc.) and tables (containing information regarding antenna configuration, calibration parameters etc.) in FITS files. However, recent telescopes like LOFAR and ALMA have substantially enlarged the concept of what constitutes metadata, and have hence also developed new schemes for collecting and storing them as well. Such a broadening of what constitutes metadata is even more important for the SKA. The description below is based on the following features of metadata which we believe may be required to fully interpret and process the science data:
Metadata is not restricted to just keywords and values, but includes entire data files of diverse information from various domains - engineering, science, external monitors, preliminary processing, etc..
The metadata may be abstracted from all the information the M&C system accesses, and is able to access, through interfaces to multiple systems.
The user should be able to specify additional metadata based on information that is accessible by the M&C hierarchy.
The user should be able to follow back from a portion of metadata and drilldown to system parameters which are stored in the Archive, post the observations.
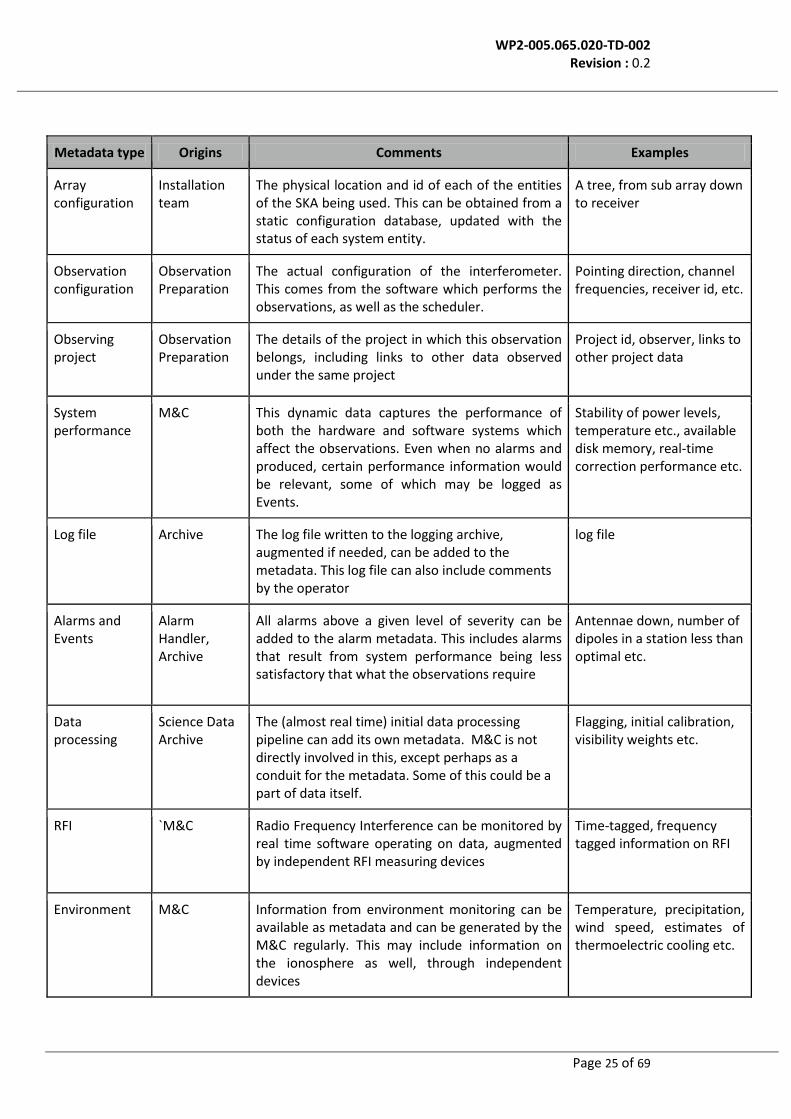
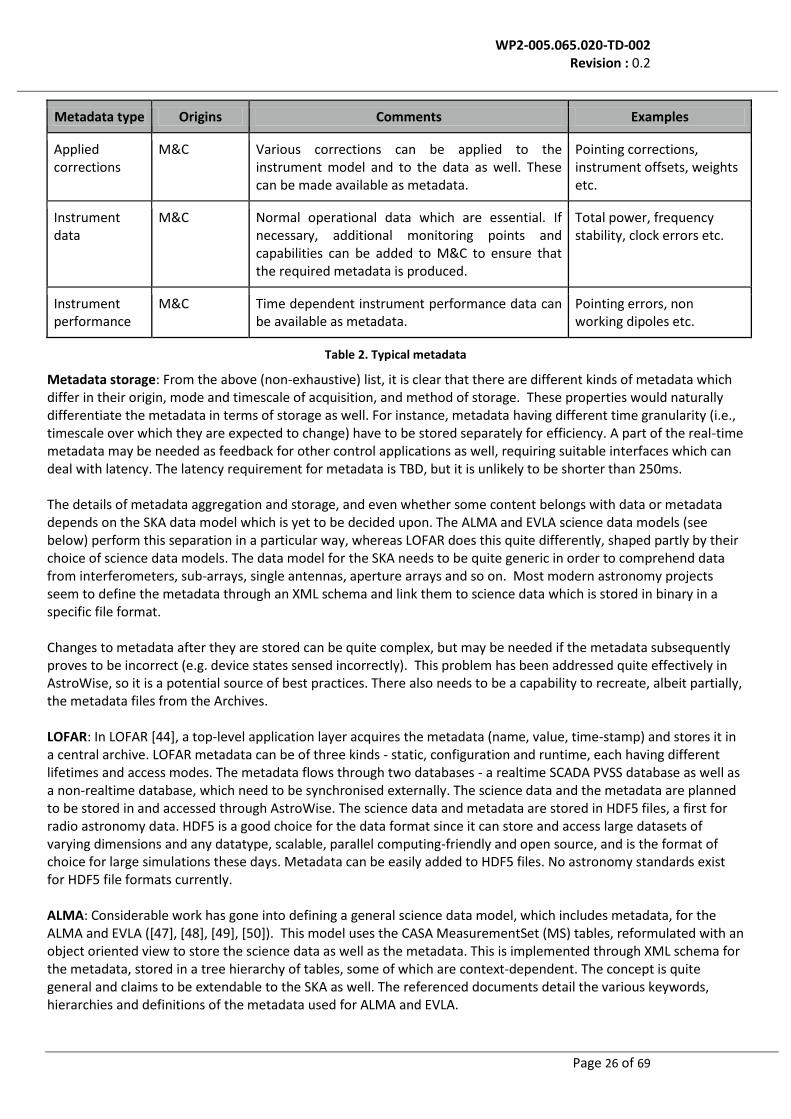
For the SKA, all of the required metadata can be collected by the M&C through dedicated processes, and will be passed along with the science data. These can also be stored in the metadata part of the Archive and linked to all the relevant components in the Archive (e.g. M&C information, Observation and Scheduler data, Alarms etc). Metadata generation: Metadata will, in general, be a subset of all information that M&C collects, either as default or because of custom applications. What constitutes metadata may depend on the observation and may grow - or diminish - over time as the system and its operational modes evolve. Some part of the metadata would be common in nature to all observations, and can be described in static configuration files. A significant proportion would depend on the type of observation and tables containing the relevant metadata can be defined for each type of observations. Dynamically defined metadata would be, for example, related to alarms and monitoring and control information. In addition, there needs to be an interface wherein the user can choose to store a part of the M&C data stream (e.g. from the achievable data) within the metadata as well. Some of the metadata can have drilldown information associated with it (e.g. some entities in an AA station fail). This leads to two possible scenarios - first, where a central Metadata engine sits inside the Central M&C and computes the required data by subscribing to whichever service it requires (as is done in LOFAR), and second, where every Regional M&C has a metadata engine which collects the necessary information for local domains coupled with a System M&C Metadata engine which collects top level data and aggregates information sent upwards. The scheme adopted has relevance for latency problems in communicating the data to the metadata Archiver. Though metadata is traditionally written along with the science data file during observations, and is hence static, the SKA would need a more generalised concept of metadata where parts of the metadata can be accessed through the archive much later. What constitutes this metadata will also not be strictly defined, but the drilldown facility in the archive can be used to probe downwards in the hierarchy of metadata information to retrieve what is needed. Metadata constituents: We detail broadly the nature and origin of various metadata in Table 1. This incomplete list aims to highlight the diversity of interfaces and the complexity of abstraction required in metadata generation. Note that though the origin of certain types might be different (Operations, for example), the metadata engine always acquires this data through the M&C.
WP2-005.065.020-TD-002 Revision : 0.2
Page 25 of 69
Metadata type Origins Comments Examples
Array configuration
Installation team
The physical location and id of each of the entities of the SKA being used. This can be obtained from a static configuration database, updated with the status of each system entity.
A tree, from sub array down to receiver
Observation configuration
Observation Preparation
The actual configuration of the interferometer. This comes from the software which performs the observations, as well as the scheduler.
Pointing direction, channel frequencies, receiver id, etc.
Observing project
Observation Preparation
The details of the project in which this observation belongs, including links to other data observed under the same project
Project id, observer, links to other project data
System performance
M&C This dynamic data captures the performance of both the hardware and software systems which affect the observations. Even when no alarms and produced, certain performance information would be relevant, some of which may be logged as Events.
Stability of power levels, temperature etc., available disk memory, real-time correction performance etc.
Log file Archive The log file written to the logging archive, augmented if needed, can be added to the metadata. This log file can also include comments by the operator
log file
Alarms and Events
Alarm Handler, Archive
All alarms above a given level of severity can be added to the alarm metadata. This includes alarms that result from system performance being less satisfactory that what the observations require
Antennae down, number of dipoles in a station less than optimal etc.
Data processing
Science Data Archive
The (almost real time) initial data processing pipeline can add its own metadata. M&C is not directly involved in this, except perhaps as a conduit for the metadata. Some of this could be a part of data itself.
Flagging, initial calibration, visibility weights etc.
RFI `M&C Radio Frequency Interference can be monitored by real time software operating on data, augmented by independent RFI measuring devices
Time-tagged, frequency tagged information on RFI
Environment M&C Information from environment monitoring can be available as metadata and can be generated by the M&C regularly. This may include information on the ionosphere as well, through independent devices
Temperature, precipitation, wind speed, estimates of thermoelectric cooling etc.
WP2-005.065.020-TD-002 Revision : 0.2
Page 26 of 69
Metadata type Origins Comments Examples
Applied corrections
M&C Various corrections can be applied to the instrument model and to the data as well. These can be made available as metadata.
Pointing corrections, instrument offsets, weights etc.
Instrument data
M&C Normal operational data which are essential. If necessary, additional monitoring points and capabilities can be added to M&C to ensure that the required metadata is produced.
Total power, frequency stability, clock errors etc.
Instrument performance
M&C Time dependent instrument performance data can be available as metadata.
Pointing errors, non working dipoles etc.
Table 2. Typical metadata
Metadata storage: From the above (non-exhaustive) list, it is clear that there are different kinds of metadata which differ in their origin, mode and timescale of acquisition, and method of storage. These properties would naturally differentiate the metadata in terms of storage as well. For instance, metadata having different time granularity (i.e., timescale over which they are expected to change) have to be stored separately for efficiency. A part of the real-time metadata may be needed as feedback for other control applications as well, requiring suitable interfaces which can deal with latency. The latency requirement for metadata is TBD, but it is unlikely to be shorter than 250ms. The details of metadata aggregation and storage, and even whether some content belongs with data or metadata depends on the SKA data model which is yet to be decided upon. The ALMA and EVLA science data models (see below) perform this separation in a particular way, whereas LOFAR does this quite differently, shaped partly by their choice of science data models. The data model for the SKA needs to be quite generic in order to comprehend data from interferometers, sub-arrays, single antennas, aperture arrays and so on. Most modern astronomy projects seem to define the metadata through an XML schema and link them to science data which is stored in binary in a specific file format. Changes to metadata after they are stored can be quite complex, but may be needed if the metadata subsequently proves to be incorrect (e.g. device states sensed incorrectly). This problem has been addressed quite effectively in AstroWise, so it is a potential source of best practices. There also needs to be a capability to recreate, albeit partially, the metadata files from the Archives. LOFAR: In LOFAR [44], a top-level application layer acquires the metadata (name, value, time-stamp) and stores it in a central archive. LOFAR metadata can be of three kinds - static, configuration and runtime, each having different lifetimes and access modes. The metadata flows through two databases - a realtime SCADA PVSS database as well as a non-realtime database, which need to be synchronised externally. The science data and the metadata are planned to be stored in and accessed through AstroWise. The science data and metadata are stored in HDF5 files, a first for radio astronomy data. HDF5 is a good choice for the data format since it can store and access large datasets of varying dimensions and any datatype, scalable, parallel computing-friendly and open source, and is the format of choice for large simulations these days. Metadata can be easily added to HDF5 files. No astronomy standards exist for HDF5 file formats currently. ALMA: Considerable work has gone into defining a general science data model, which includes metadata, for the ALMA and EVLA ([47], [48], [49], [50]). This model uses the CASA MeasurementSet (MS) tables, reformulated with an object oriented view to store the science data as well as the metadata. This is implemented through XML schema for the metadata, stored in a tree hierarchy of tables, some of which are context-dependent. The concept is quite general and claims to be extendable to the SKA as well. The referenced documents detail the various keywords, hierarchies and definitions of the metadata used for ALMA and EVLA.
WP2-005.065.020-TD-002 Revision : 0.2
Page 27 of 69
AstroWise approach: AWE is an environment consisting of hardware and software which is federated over about a dozen institutes all over Europe. It provides a single environment for ingestion of data, calibration, analysis and archiving. There is a complete linking of all steps in data analysis, including the input, output, and the software code used, for arbitrary data volumes and is fully scalable. It can be installed in multiple places, has tuneable user privileges, users can add their own analysis code, and it provides a web based archive. For more information, refer [15]. The data are stored in FITS files and the metadata is in a relational database which can then be queried. Data can be processed inside AWE and the corresponding metadata is updated suitably. Through the metadata, a given data product, e.g. a source position, can be traced all the way back to the parameters used in generating some intermediate stage data file. Standards and best practices: The recommended practice is to define the metadata through an XML schema, using controlled vocabularies and link this to binary files containing science data [51]. One can also define the binary files to be accessed as if they were in XML. The data format of the science data (CASA, HDF5, etc) will also influence the metadata structure and format. It is recommended that GRID standards are used for interoperability. One of the standards for metadata for science data is AMGA (ARDA Metadata Grid Application, for the LHC [41]). In addition, Grid and VO applications have also led to protocols for metadata definitions, some of which include AstroGrid-D, RTML (Robotic Telescope Markup Language) [42] and Resource Description Framework (RDF) [38]. The Open Archives Initiative Protocol for Metadata Harvesting [43] provides an application-independent interoperability framework based on metadata harvesting. OpenURL is the new standard for referencing remote data and should be explored in this context. ISO/IEC 11179 [39] is another international standard for representing metadata. Conforming to the Open Archive Protocol would make VO and cloud computing access easier [43] as well. A good resource of links to metadata definitions etc is [40].
5.6 Support for Science Performance Management
Ensuring the quality of science data and managing the science performance of the instrument is a primary responsibility of the Signal Processing domain. M&C supports and enables this by (a) providing needed metadata to signal processing in real-time (b) providing an interface that can be used by Signal Processing to tune device parameters and improve system performance. This section describes these interactions. The precise interfaces and capabilities will be defined in collaboration with the Signal Processing team. Additional discussion on interfaces may be found in [29]. Some typical situations where interaction with M&C would be required for managing science performance are described below. The beam former will need certain parameters at the beginning of every observation, such as what kind of weighting scheme to use (possible choices could be a weighting scheme that maximises the gain at the beam centre, or one which minimises the sidelobe level etc.), the pointing directions for multiple beams, frequency information (bandwidth, channelisation, channel frequencies etc) and so on. These are computed from the observational requirements and passed on by the System M&C (and later stored in the metadata, archive and log).The interfaces needed with other backends like the correlator are similar in nature (e.g. set initial values like source positions, observation time, frequency settings etc.). During observations, real-time information needs to be fed to the regional signal processing nodes by the regional M&Cs as well e.g. current pointing direction, instrumental phase correction applied for generating a phased array beam. The phase corrections themselves are obtained from the signal processing domain, for which it should be possible for the signal processing M&C to query the system M&C for any required metadata. Further, the station calibration solutions, or the computed beam shape (width, sidelobe levels) needs to be constantly checked against the observational requirements in order to modify configuration parameters/generate alarms if needed. Issues of latency and wait-time are important in this context. The regional signal processor could also independently raise
faults and events, e.g. non-functioning dipoles, strong RFI which appeared during observations, etc. These will have to be analysed against predefined rules, checked against observational requirements, and control commands sent downstream to modify configuration parameters to mitigate the fault. All of the above information (state changes, calibration parameters, faults, modifications due to faults etc.) may need to be archived, logged and added to metadata, according to static and user/operator specified configuration tables. The signal processing feedback on data flags based on initial quality control would also need to be added to the metadata. Based on alarms and faults, the M&C may also need to change certain configuration parameters like the stations/antennas that are participating in an observation, and these in turn would need to be propagated to the signal processing chain. In summary, the support provided by M&C for science performance management includes supply of parameters to the science data path with very tight latency requirements, query interfaces with which signal processing M&C can retrieve any parameters needed, APIs for control operations, and logging facilities so that any science data and performance problems detected can be captured in the metadata augmentations and in the engineering archive.
5.7 Support for Operations
A major difference between SKA and previous radio telescopes is in the scale and consequent required degree of automated operations. The vast scale and remoteness of the equipment makes it imperative that all aspects of operation, including safety, security, fault management and upgrades, be automated as much as possible. It is reasonable to think of M&C and System Operations (which cover automated operations) and the people & management aspects respectively, as two halves of a whole. A primary responsibility of M&C is to provide support for System Operations. While all the material in this document is in early concept stage and hence rather fluid, the contents of this section should be viewed as being especially so, because of the absence of a defined System Operations plan (System Operations is not covered in the PrepSKA effort). This work represents attempts by M&C to anticipate the needs of system operations. It will acquire more concrete shape during the preliminary design stage as a System Operations plan starts taking shape and it places specific demands (as formal requirements) on M&C. System Operations includes
Observatory utilization management, including dynamic scheduling of observations and health status management of the observatory.
Science lifecycle support, including proposal handling, observation scheduling and preparation, collection, processing and archival of science data, data delivery, access and interpretation support.
Control of instrument functioning, including observations control, state management, fault management, performance management, ensuring integrity, security and safety.
Instrument maintenance and evolution, including commissioning and upgrades.
Enterprise aspects, including people management, asset and configuration management, financial management and stakeholder management: reporting, interfaces with scientists, suppliers, regulators etc.
Science lifecycle support is provided by the Software and Computing activities in the Software & Computing domain. M&C support for this aspect is discussed in the sections on Metadata Augmentation and Integration Interfaces. Scheduling, tracking and management of instrument maintenance and evolution may likely be supported by enterprise activity management applications. M&C provides considerable support for these activities, discussed in section 5.8 on Fault Management and section 5.11 on Evolution: Continuous Commissioning, Maintenance and Upgrades.
WP2-005.065.020-TD-002 Revision : 0.2
Page 29 of 69
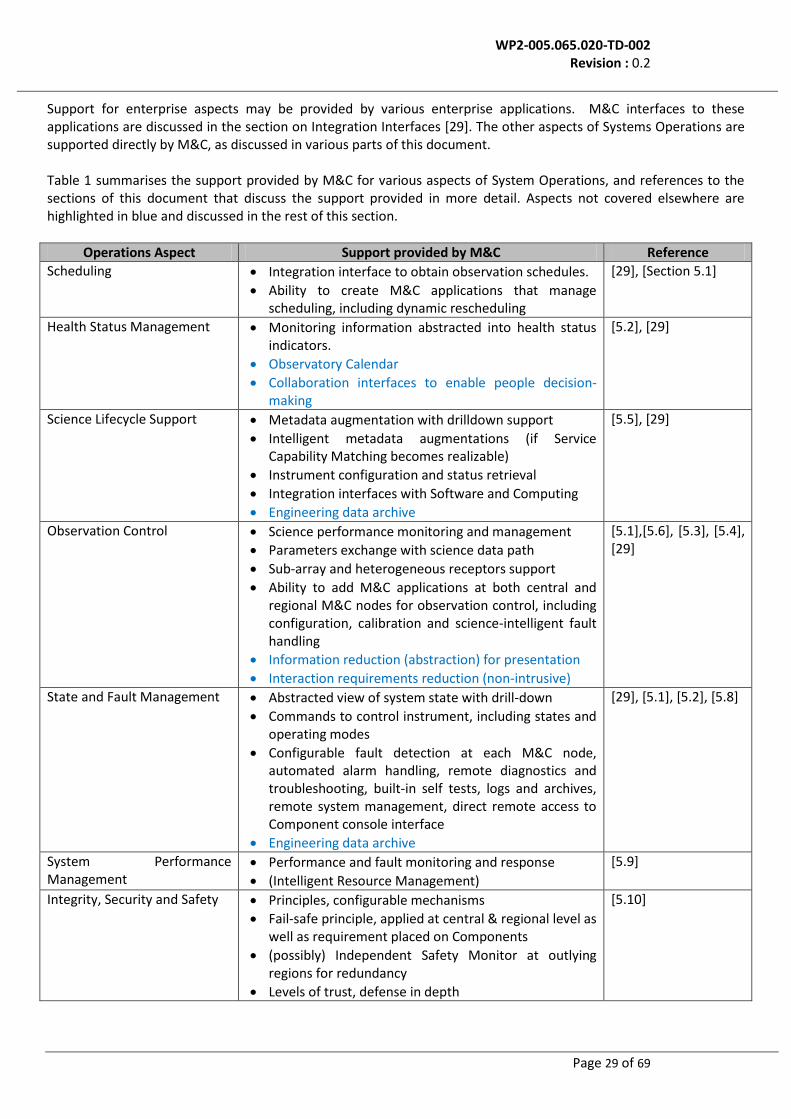
Support for enterprise aspects may be provided by various enterprise applications. M&C interfaces to these applications are discussed in the section on Integration Interfaces [29]. The other aspects of Systems Operations are supported directly by M&C, as discussed in various parts of this document. Table 1 summarises the support provided by M&C for various aspects of System Operations, and references to the sections of this document that discuss the support provided in more detail. Aspects not covered elsewhere are highlighted in blue and discussed in the rest of this section.
Operations Aspect Support provided by M&C Reference
Scheduling Integration interface to obtain observation schedules.
Ability to create M&C applications that manage scheduling, including dynamic rescheduling
[29], [Section 5.1]
Health Status Management Monitoring information abstracted into health status indicators.
Observatory Calendar
Collaboration interfaces to enable people decision-making
[5.2], [29]
Science Lifecycle Support Metadata augmentation with drilldown support
Intelligent metadata augmentations (if Service Capability Matching becomes realizable)
Instrument configuration and status retrieval
Integration interfaces with Software and Computing
Engineering data archive
[5.5], [29]
Observation Control Science performance monitoring and management
Parameters exchange with science data path
Sub-array and heterogeneous receptors support
Ability to add M&C applications at both central and regional M&C nodes for observation control, including configuration, calibration and science-intelligent fault handling
Information reduction (abstraction) for presentation
State and Fault Management Abstracted view of system state with drill-down
Commands to control instrument, including states and operating modes
Configurable fault detection at each M&C node, automated alarm handling, remote diagnostics and troubleshooting, built-in self tests, logs and archives, remote system management, direct remote access to Component console interface
Engineering data archive
[29], [5.1], [5.2], [5.8]
System Performance Management
Performance and fault monitoring and response
(Intelligent Resource Management)
[5.9]
Integrity, Security and Safety Principles, configurable mechanisms
Fail-safe principle, applied at central & regional level as well as requirement placed on Components
(possibly) Independent Safety Monitor at outlying regions for redundancy
Levels of trust, defense in depth
[5.10]
WP2-005.065.020-TD-002 Revision : 0.2
Page 30 of 69
Instrument maintenance and evolution
Support for continuous commissioning: isolation of commissioning traffic, coexistence of observations and commissioning activities
Configuration and Status Database
Scripts capability to facilitate automation support for maintenance operations (e.g. upgrades)
Remote upgrades and patches
Integrations with maintenance software
[5.11], [29]
Enterprise aspects Integration with Enterprise Applications
Integrations with external information sources (e.g. weather reports, resource providers)
Context Information Database
[29]
Table 3. Support for Operations: Summary
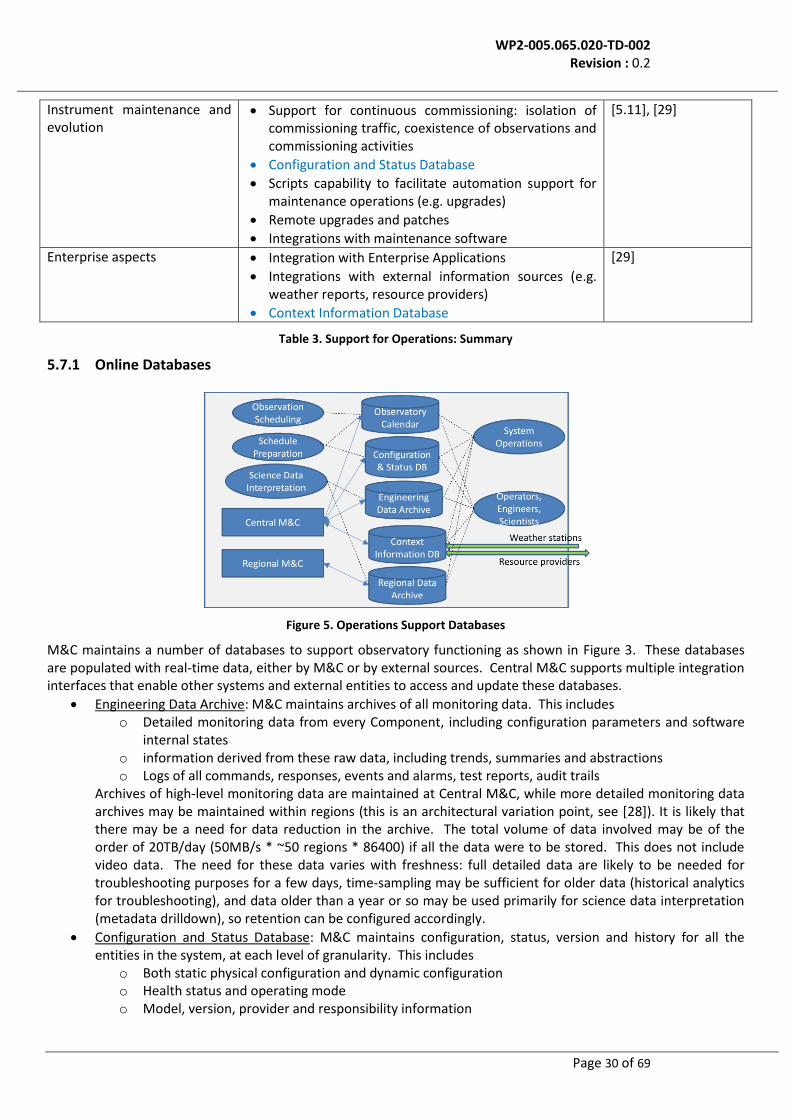
5.7.1 Online Databases
Figure 5. Operations Support Databases
M&C maintains a number of databases to support observatory functioning as shown in Figure 3. These databases are populated with real-time data, either by M&C or by external sources. Central M&C supports multiple integration interfaces that enable other systems and external entities to access and update these databases.
Engineering Data Archive: M&C maintains archives of all monitoring data. This includes
o Detailed monitoring data from every Component, including configuration parameters and software internal states
o information derived from these raw data, including trends, summaries and abstractions o Logs of all commands, responses, events and alarms, test reports, audit trails
Archives of high-level monitoring data are maintained at Central M&C, while more detailed monitoring data archives may be maintained within regions (this is an architectural variation point, see [28]). It is likely that there may be a need for data reduction in the archive. The total volume of data involved may be of the order of 20TB/day (50MB/s * ~50 regions * 86400) if all the data were to be stored. This does not include video data. The need for these data varies with freshness: full detailed data are likely to be needed for troubleshooting purposes for a few days, time-sampling may be sufficient for older data (historical analytics for troubleshooting), and data older than a year or so may be used primarily for science data interpretation (metadata drilldown), so retention can be configured accordingly.
Configuration and Status Database: M&C maintains configuration, status, version and history for all the entities in the system, at each level of granularity. This includes
o Both static physical configuration and dynamic configuration o Health status and operating mode o Model, version, provider and responsibility information
WP2-005.065.020-TD-002 Revision : 0.2
Page 31 of 69
o Health, maintenance and change history. This information is accessed for schedule preparation through an integration interface, and by various users including operators and engineers. It has a bi-directional integration with the enterprise asset management system.
Observatory Calendar: This maintains a calendar of planned activities, including scheduled downtime, commissioning and upgrade events, maintenance events and observation schedules. The purpose of this Calendar is to track future resource status and allocations. It is complementary to the Configuration and Status Database. It is used in observation scheduling, observation preparation and maintenance scheduling. Most updates and accesses to this database are not real-time, however it may be automatically updated based on identified significant health and environment events e.g. severe weather. There may also be consistency checks between the Calendar and the instrument status.
Context Information Database: SKA operations will require information about its context, particularly weather information and notifications from resource providers. The context information database can obtain updates from weather information sources through integration interfaces. This can be organised by geography and time for easy retrieval. It can also obtain updates from resource providers (e.g. power, communications – it is possible that SKA may use external providers, particularly for backup communications capability to outlying stations) about planned outages or quality problems being experienced. M&C nodes will be able to subscribe to this database to receive notifications of updates that may affect them. This subscription capability may be used to set up automated propagation of updates to other databases such as the Observatory Calendar. This capability also serves as a backup safety mechanism to deal with severe weather events that may cause instantaneous and widespread outage in regions e.g. earthquakes, flash floods. In extreme situations where much of a region's situation handling capabilities are damaged, this mechanism can be used to generate alarms to Central M&C which can then monitor the regional M&C through backup communication mechanisms (if needed) to safely shut it down. It should be possible for Central M&C to use the integration with resource providers to shut off power supply to affected areas.
5.7.2 M&C Access Interfaces
M&C must provide support for design of user interfaces for operators, engineers, scientists and other roles. In addition, it also needs to support interfaces for M&C applications, integration interfaces, testing interfaces etc. The types of interfaces to be supported by M&C include:
Support for Graphical User Interfaces: SKA will need role-based GUIs with configurable as well as customizable content and look-and-feel to meet variations in responsibilities and characteristics of individual users. To support the design of these GUIs, M&C can provide APIs to subscribe to monitoring data, alarms and events, and to issue commands. The APIs can also provide meta-information such as data types and data rates for monitoring points, to support configurability and customizability (e.g. display an information item as a bar graph instead of a line chart), as well as the possibility of specifications-driven UI technologies, that combine a layout specifications file with a content specifications file to generate the GUI rendering.
APIs (Application Programming Interfaces) for use by M&C applications such as the scheduler. Much of the domain-specific and system-specific intelligence of how to use the SKA system resources effectively to perform astronomical observations may reside in the applications layer. The APIs can provide applications with full access to all monitoring points (including configuration data, system statuses, science and engineering performance parameters) as well as all events and alarms, and full control to invoke all commands, configuration operations and engineering actions. The APIs are the primary system interface on which all other interfaces can be built. They will enable integration with other systems, support for both custom and off-the-shelf applications (e.g. scheduler, network and power management applications) to manage system operation, and easy extension of system capability. There can be capability for (token) authentication and authorization on APIs to ensure security.
WP2-005.065.020-TD-002 Revision : 0.2
Page 32 of 69
Command line interfaces to accommodate alternative user preferences and easy callability from scripting languages and tools. These may be relatively limited but easily extensible, providing a thin layer on top of the API corresponding to commonly used operator actions.
Batch/Script interfaces for the implementation of common control sequences and automation of repetitive operations. These can utilise either the command line interface or APIs depending on the scripting language employed. These interfaces can be available at every M&C node, to facilitate the creation of built-in test scripts and control scripts. This is the primary internal extensibility feature for SKA control, and is expected to be used extensively both at design-time and dynamically during system operations to perform configuration-dependent automated activities, including possibly alarms handling, custom troubleshooting operations etc.
Bypass access to console interfaces: Remote consoles of devices in maintenance or commissioning operating modes can be accessed directly from remote locations for engineering operations and troubleshooting, provided the device supports such access. In the bypass mode, M&C can act purely as a communications relay, without attempting to interpret or filter any of the commands. This facilitates remote low-level troubleshooting using custom interfaces of devices.
Remote access capabilities: In principle, all M&C interactive and non-interactive interfaces can be available from remote locations as well, to support regional science centers, remote troubleshooting and system management, and standby operations. Maintenance engineers accessing Central M&C from stations are also handled as remote access locations. However, there may be differences in the degree of trust based on access points: there can be an extra validation layer ("gatekeeper") that may permit only commands that can be verified to be safe to be initiated from remote locations e.g. download of scripts, arbitrary changes to configuration parameter settings, upgrade operations etc will be permitted only if the associated contents can be analysed and checked for possible adverse impacts on equipment or system status. Firewalls, VPNs and access-point-based security checks may be used to supplement basic authentication and authorization mechanisms and increase levels of confidence.
Untrusted access from arbitrarily locations: In addition to standard thick-client highly configured/customised role-based interfaces for remote science and engineering operations, there may be a need for access to system monitoring information from non-permanent locations using personal access devices (PDAs and so on) etc. The range of access modes supported by M&C may include a completely untrusted access mode limited to monitoring. The set of capabilities may be configurable based on level of trust, so that for example it is possible to add limited control capabilities based on pre-configuration and pre-authorization.
Collaboration capabilities: SKA will feature users with different roles in widely dispersed geographic locations that may all be interested in the progress of observations, including operators, scientists, engineers (e.g. observing an item that appears possibly faulty) and observatory management. Making decisions e.g. whether to abort an ongoing observation, may require dialogue among these users. The concept of "primary point of control" may also make it necessary to have commands relayed by the operator. This can be enabled by supporting simple collaboration capabilities such as messaging. Further, SKA1 and SKA2 scales are such that it may be desirable to have some kind of independent telecommunications network to allow - in the event of M&C network failure - humans to interact separately from the actual M&C network.
5.7.3 Interaction design principles and patterns
The model of interaction between M&C and users, particularly operators and engineers, needs to be guided by principles that are designed to prevent information overload resulting from the scale of SKA, control conflicts and potential problems arising from the high degree of automation. Some guiding principles are:
Abstraction with drillability: All entity-level information may be rolled-up to system-level abstractions (e.g. system status, operating state, operating mode, performance parameters) and summaries (e.g. number of sub-arrays, % of operational entities). It will then be possible to drill down from system-level information to Segment and Element-level information and from there to individual Components and Component-internal behavior and parameters.
WP2-005.065.020-TD-002 Revision : 0.2
Page 33 of 69
Entities at each level of the system hierarchy have a set of operational parameters, configuration parameters and an operating state. The operating state includes an indication of the status of the entity e.g. off / ready / operational / faulty / under maintenance. At each level of the system hierarchy, the operating state of the parent entity is related to the operating state of its child entities by a set of rules e.g. the presence of faults in one or more child entities may result in the parent entity being declared faulty. Operational parameters are similarly consolidated and rolled up through the system hierarchy.
Non-intrusive notifications: The interface can minimise intrusive notifications (pop-ups, flashing elements, audio notifications, "action required" interactions), reserving them for critical situations with system-wide impacts. This is a "large-scale systems" philosophy where a certain degree of faults and failures are expected as routine, and the danger of flooding operators with information is considered to outweigh the likelihood of missed events. This can be complemented by a system design emphasis on assessment and prioritization of available information relative to role responsibilities, so that the most relevant and important information is made most easily accessible through differential-emphasis techniques such as color, highlighting, on-screen positioning and prioritised lists. The presumption is that of high operator expertise capable of superior decision-making on which aspects need attention. [59] provides detailed guidance in the form of principles and guidelines on how to design operator interfaces that enable them to ensure the safety of the system. M&C support for user interfaces needs to incorporate these principles.
Operator empowerment: System operators can be assumed to have a better understanding of action appropriateness than the system. Commands can be checked for safety and validity against operating ranges of devices, current state of receiving entities and potential impacts to operational capability, and warnings / requests for confirmation can be employed where appropriate. However, the operator can have the option of manually overriding system checks, to provide for situations where the system functions erroneously and requires operator intervention to correct its behavior, with the exception of situations that affect safety, in which case the system response will tend towards fail-safe behavior. In addition, while operator interfaces can be configured based on role responsibilities, access to information need not be so tightly restricted based on roles. For example, scientists can have access to engineering information and maintenance engineers can have access to science parameters. Detailed logs of all operator actions will be maintained and audited.
Support for coordinated navigation: Interface designs such as the LOFAR Navigator [36] enable the context for each view to be updated in a coordinated manner in response to commands e.g. drilldown to an entity. M&C can support this with a concept of Interaction Context that can be updated based on the effect of commands. For example, if the operator drills down to an entity in a system structure diagram, successful access to the parameters associated with the entity can result in a change in the Interaction Context. The UI can detect this to trigger update of other views to conform to the new Interaction Context. As a result, in the example associated performance parameter views may be automatically updated to reflect the parameters of that particular entity.
Primary point of control: Ideally, every entity should have a single point of control i.e. at any given instant; it receives commands from only one source. M&C can enforce this by default e.g. if a particular system operator has charge of the system, no one else from any location and no other automated software entity will be able to issue commands to the system except with the explicit concurrence of the operator, who may have to relay the command. However, this may be too restrictive. It is quite likely that operators may want maintenance engineers to have limited control access to a Component that is behaving erratically, so that they may issue diagnostic and troubleshooting commands to investigate the problem, even while it is still operational. Similarly Local M&C software may issue performance tuning commands to its Components, even while responsibilities for fault management of the software lie with regional M&C. The proposed alternative philosophy is that of primary point of control, which permits delegation of limited authorities to other secondary points of control.
WP2-005.065.020-TD-002 Revision : 0.2
Page 34 of 69
5.8 Fault management
Fault management in SKA is qualitatively different from earlier radio telescopes because of the system scale. Given that the system has thousands of Components, it must be expected that (a) there will be several Components unavailable at any given time. The current requirements include an availability target of 90% with availability being defined as 95% of receptors being operational, which implies that up to 5% of the receptors may be unavailable at a given time, either due to anticipated maintenance downtime, faults, or dependencies on other Components that may be currently unavailable. (b) multiple faults may occur even during the course of a single relatively short observation cycle e.g. if a given Component averages a (possibly non-fatal) fault once a month, and there are 10000 Components, the mean failure rate is over 10 faults an hour. The implication is not only that the system must be designed to expect faults and failures as routine, but also that there must not be an expectation of operator intervention on every fault – even interactive (interrupt-style) fault notification is not appropriate for all faults. The emphasis is primarily on automated fault management, with the possibility of human intervention for major faults or at the operator's discretion.
In the following discussion, we define faults as anomalous behaviour of a subsystem, which need to be detected, and interpreted. These faults then result in the generation of relevant alarms, which are then processed further before action is taken on them. All alarms, and hence faults, are archived and reported. State changes which are not faults (or faults that have been resolved) but are still relevant to the M&C or the user are termed Events and are archived as well. A subset of alarms, selected by their severity level and the context in which they arise, will have to be passed on to the metadata interface as well.
Fault management has multiple aspects that must be addressed: fault detection, alarm and fault handling, operator notification and response, troubleshooting, archiving and logging to support fault management, recovery and operational continuity.
5.8.1 Fault detection
Faults may be detected either within a Component's own hardware, software and Local M&C systems, or by higher-level M&C systems. Fault detection mechanisms in M&C systems include
Thresholds: Comparison against a pre-determined range of allowed values.
Timeouts: Operations not completing in expected timeframes.
Anomalies: Parameter values or behaviours that deviate from what is expected e.g. unexpected response to a command.
Correlations: Comparison of values and parameters from multiple sources to detect mutual discrepancies.
Patterns analysis: Detection of patterns that indicate potential problems e.g. periodic voltage spikes in a power supply. This may include analyses of trends over extended time periods and log/history analysis, as well as analysis of Event patterns (see below).
External sources: Faults and more commonly threats may be detected by sources external to the affected Components or even to the entire system. For example, warnings of thunderstorms and anticipated poor power quality may originate from external sources such as the weather service or power supply provider. Integrations with external systems must include the capability to originate and deliver alarms and events to the M&C system.
Behavioural symptoms may also be detected by other entities e.g. Correlator, user interfaces, scheduler. The alarms interface to M&C may be used either to flag problems within the source entity, or to report detected symptoms that may indicate faults in other entities:
Downstream analysis: Discrepancies detected by data processing pipelines (Correlator, user interfaces, scheduler, initial data processing, etc) connected downstream to the data acquisition (but able to provide feedback to the M&C), through, for example, comparison with a model or quality control.
WP2-005.065.020-TD-002 Revision : 0.2
Page 35 of 69
Reported a posteriori: Feedback from the user/astronomer after extensive off-line data analysis, though not necessarily easily translatable into engineering alarms. Some of these might be subtle but systematic variations in the data quality caused by small variations in the engineering parameters, but too small to trigger alarms. These will be logged and used in later analysis.
Central M&C software can provide configurable fault detection capabilities on the acquired data and computed parameters in its worldview real-time database, at each level of the hierarchy. In other words, only definable faults can be detected in an automated fashion.
Fault detection mechanisms will need to be configured for each level of M&C in the system, to detect the following kinds of problems:
Faults relating to the behaviour of a single Component.
Faults modes that span across multiple Components e.g. repeated failover from primary to backup and back to primary within relatively short periods of time.
Behavioural symptoms from the user or system perspective e.g. long latencies for command response, multiple receptors drifting out of phase repeatedly.
Behaviour discrepant from a model for expected values of a higher level system, in the absence of an obvious fault in a single Component.
Attack on the system.
All faults and resulting alarms are stored in the relevant M&C archive, which mention the detection method as well as the kind of problem as detailed above, along with a host of parameters which are described later on in this document.
5.8.2 Alarms handling
Alarm handling is hierarchical in the M&C system. Alarms may either be handled in the originating entity (with Event notification to the parent entity) by its Local M&C, and/or be passed as alarms to the parent entity for handling. Both local and non-local handling of alarms is appropriate in situations where the local handler takes action to prevent negative impacts from an observed fault (e.g. powering down an affected subsystem), but higher-level action is needed to handle ripple effects on other entities and/or to restore normalcy.
Alarm handling actions include:
1. Ignore: wait to see if alarm reoccurs 2. Retry operation that generated the alarm 3. Reset/restart to check if the fault is transient 4. Disabling faulty component, possibly replacing it with an alternative (e.g. failover, rerouting), and marking it
for maintenance/replacement 5. Shift into establishing detailed diagnostics mode automatically. 6. Repair actions, if known e.g. modify configuration parameters.
WP2-005.065.020-TD-002 Revision : 0.2
Page 36 of 69
Fault handling may also include actions needed to protect other Components and maintain operations, as discussed in the subsection on Operational Continuity.
Alarms may be of the following types: (1) basic alarm (2) aggregated alarm – multiple similar alarms grouped together (3) model alarm – alarm based on comparing data with pre-existing models and (4) key alarms – urgent alarms involving safety, security, threats to equipment or severe failures that significantly affect overall system capability. Priority mechanisms can be used to propagate key alarms quicker than other communication.
Figure 6 shows the information that is typically carried with an alarm, with examples. These component fields are obtained by the Alarm Handler in various ways - from the M&C fault detection, intermediate level M&C which acts upon and passes alarms from below, tables which are used to cross correlate alarms from multiple systems, etc. Of particular interest are the Handled Action and Recommended Action components, which taken together with the Nature, Source and Context information provides the intelligence to deal with some of the typical problems in alarm handling:
• Nuisance alarms: these are alarms which need to be ignored or disabled, or may result in redefinition of the relevant fault. Examples of causes include wrong range of values, incorrect alarm filtering, alarms raised during irrelevant contexts (like maintenance), and more commonly, oscillations of a parameter around one end of the allowed range of values. Recommended actions, based on contextual parameters known at the originating location, makes it easier for upstream alarm handlers and operators to deal with them.
• Stale alarms: alarms that have been overtaken by events, rendered obsolete by passage of time, or refuse to be cleared.
• Alarm floods: a cascade of alarms, usually of increasing severity, and is triggered by a lower level alarm. Alarm floods can overwhelm the operator and is a serious concern in alarm handling design. The Associated
Figure 6. Components of an Alarm
WP2-005.065.020-TD-002 Revision : 0.2
Page 37 of 69
alarms concept is a way of identifying related alarms based on source, type and context and delivering them to operators in a package.
• Unclear alarms: alarms that are ill-defined, lack documentation, or are redundant.
• Progressive alarms: Situations where a physical situation progressively degrades triggering a series of alarms of increasing severity. For example, the voltage in a power line may drop below a threshold, triggering an alarm. Within a very short time (milliseconds), it may dip further, triggering a more severe alarm that needs a different response. A short time later, the power may fail altogether, changing the situation completely. Since more severe alarms have priority and move through the system hierarchy quicker, there are multiple challenges: without careful design, the later alarm may arrive first, and then the response action to the earlier alarm may accidentally reverse the actions taken in response to the more severe later alarm. The sequencing may also cause confusion to handlers, making the current status of the device unclear.
Various alarm handling standards as well as industrial alarm handling protocols has addressed the above problems using a multitude of methods, as shown in Table 4.
Alarm handling method
Description Effect
Aggregation Similar alarms are grouped and presented together to the operator. This similarity could be across components of the same type, across different faults in the same component, across time for a given fault, and so on, and requires built-in intelligence in the alarm handler/filter.
Minimises Alarm Flood.
Abstraction At any given time, there may be several pending alarms in an Element (e.g. signal transport). Except for key alarms, these alarms are combined and translated into a modification of the status of the Element or Segment (e.g. signal transport may turn amber if there are enough faults to cause significant loss in network bandwidth). Drill-down on the abstracted status may be necessary to identify the alarms that caused it.
Minimises Alarm Flood. (See Operator notification and response)
Contextualization Multiple contexts need to be defined – operation, maintenance, testing, switch-off etc, and the alarm handler behavior as well as the documented response for an alarm may be defined separately for each context.
Minimises Nuisance and Unclear Alarms.
Suppression Alarms raised as a direct result of another alarm are suppressed (and subsequently monitored), unless it is a key alarm. If the latter, it’s causal link to the original alarm is preserved. Alarm suppression requires knowledge of time-tags for each alarm, taking into account signal latency across the SKA (see first-out alarm).
Minimises Alarm Flood.
First-out If an alarm raises multiple alarms, each propagating upwards at different speeds, the first alarm generated, which was the cause of the other alarms, can be tagged as the first-out alarm. The highest severity alarm (usually the latest one) can be presented to the operator, aggregating the lower severity alarms, while identifying the first-out alarm.
Minimises Flood, solves latency issues.
WP2-005.065.020-TD-002 Revision : 0.2
Page 38 of 69
Alarm handling method
Description Effect
Filtering Alarm generation can include a filtering step so that, for example, oscillatory behaviour around an extreme of the allowed range does not raise multiple alarms.
Minimises Flood and Nuisance Alarms
Override, shelving, redirection The operator can move an alarm from the 'main' shelf to an 'auxiliary'
shelf temporarily, to be dealt with later. They may also be able to redirect alarms to other roles using asynchronous notification.
Minimises Nuisance alarms
Asynchronous notification Many alarms may need to be dealt with not by the operator but by
maintenance engineers (e.g. those involving parts replacement). This is typically known at the source, based on the type of fault. To reduce operator workload and facilitate handling of routine failures, such operator alarms are automatically passed on to the target role through a configurable asynchronous notification mechanism (messaging, Email etc). This mechanism can be used to automatically trigger applications e.g. maintenance requests logger.
Minimises Unclear or nuisance alarms and does not overwhelm the operator.
Table 4. Alarm Handling Methods
5.8.3 Operator notification and response
The guiding principle in the design of operator alarms notification for SKA is to minimise intrusiveness, limiting interrupt-style notifications (popups, audible etc.) to only the highest-priority alarms. The priority of an alarm for operator notification is based on three criteria: impact on science goals or safety/security, fault severity and action ability (e.g. a major equipment failure at a remote site may not be immediately actionable by the operator; it is better notified to the maintenance engineer, especially if the preliminary automated response has already shut down the affected equipment and handled the ripple effects). Only actionable high severity faults and alarms that have safety or security implications (i.e. key alarms) get presented to operators as requiring "acceptance" and/or immediate response. Standards for alarm handling recommend that an operator should be required to respond to typically at most one alarm per minute during normal operations and not more than 10 alarms per minute during emergencies.
All other faults are abstracted to the Element or Segment level, and presented as decorations on system schematic diagrams (e.g. affected regions are shown with a different colour or modified icon), along with being added to a prioritised list of pending alarms, with decorations indicating severity and recentness. This enables operators to monitor system status continually, identifying problems and their severity at a glance, selecting problems that need investigation and response. The prioritised alarms list enables operators to follow up on pending alarms whenever convenient.
Where alarms carry one or more possible recommended actions with them, those can be available to the operator as alternative responses to the alarm. Other readily available response capabilities can include changing the state or configuration of either the affected entity or any of its parent entities. In case the standard responses are inadequate, the operator can have access to troubleshooting capabilities and full set of system commands to identify and resolve the problem.
WP2-005.065.020-TD-002 Revision : 0.2
Page 39 of 69
Operators may need drill-down investigation to identify the specific alarms (other than key alarms) affecting a region and contributing to its status (if non-healthy), because alarms are aggregated and abstracted to a health status for the Element or Segment. Alarms that are not viewed/handled by operators get logged and passed on to other roles through the asynchronous notification mechanism.
It should be noted that these practices are significantly different from small-scale radio astronomy systems where all alarms are presented to the operator, and require operator acknowledgement. Because of the scale of SKA, a fundamentally different operational philosophy is adopted, viewing faults and alarms (other than key alarms) as business-as-usual rather than exceptional occurrences.
Fault handling must be automated in situations where there is an immediate threat to safety, possibility of damage to system entities or integrity violations. Automation is also appropriate in situations where the desired response latency is small or where there is a well-defined response action with little likelihood of error in situation detection. Operator intervention is sought in situations where there is uncertainty in the detection, multiple possible responses, no defined responses or potential adverse impacts to science from the handling actions. Automated handling actions are notified to operators. It must be possible to manually override system actions except in situations that may result in violations of safety or system integrity.
5.8.4 Troubleshooting and remote management
Fault diagnosis and resolution is typically expected to be performed by maintenance engineers. The goal in troubleshooting is to minimise the need to physically go out to the equipment, considering that much of the equipment will be in remote locations.
The approach to facilitating remote troubleshooting includes the following: A requirement to subsystem M&C developers and equipment providers that all commands and all system parameters down to LRU level must be made available through remote access interfaces. M&C can make it possible to directly send commands to entities lower down in the hierarchy as a pass-through, without needing it to be relayed by intermediate M&C nodes. This capability can be available in Offline, Testing and Commissioning operating modes. In Integrated operating mode, all commands may have to be relayed through the higher-level M&C interfaces, restricting the set of available commands to those supported by the higher-level interfaces. These capabilities can be used by engineers to update configuration parameters for hardware modules as well.
M&C should require that Components support remote reset and power on/off as part of the standardised M&C interface. This should apply to subsystem M&C implementations, and to all Components that are procured, except in situations where the Component is intrinsically passive and cannot support such capabilities, or an exception is made for off-the-shelf vendor equipment.
M&C should support remote software patches and upgrades, and require that these capabilities be supported by subsystem M&Cs as part of the standardised M&C interface.
M&C should comprehensively log state changes of entities down to Component level, as well as all commands, parameters and responses. It should maintain an archive of all monitoring data for TBD time period, to facilitate historical analysis. All logs should be remotely retrievable, and all parameters internally available within M&C can be able to be examined through troubleshooting commands.
The monitoring capabilities of M&C should continue to be available when a system is in Offline mode, unless network connectivity is unavailable. Traffic generated by control interactions with and monitoring of entities in Offline, Testing or Commissioning mode can be isolated from normal operations traffic, so that there is a sandbox for troubleshooting.
WP2-005.065.020-TD-002 Revision : 0.2
Page 40 of 69
In Integrated mode, maintenance engineers can subscribe to all system monitoring parameters, and relay requests for examining parameters, reconfiguration of entities etc through the system operator. This restriction is necessary to preserve system integrity, to ensure that such requests do not disrupt observations in progress.
M&C should support the concept of built-in self-tests that may be remotely triggered for diagnostic purposes. It should be possible to dynamically download and install test procedures on M&C nodes. It is up to subsystem designers and equipment providers to decide whether to provide similar capabilities within subsystems.
Computing equipment at remote sites can have remote system administration capabilities enabled.
M&C should have a backup (probably low bandwidth) communications capability with remote sites, to facilitate troubleshooting of communication links to remote sites.
M&C should provide support for video cameras and other monitoring equipment to facilitate monitoring of remote sites.
M&C should provide integration with maintenance management applications to facilitate physical maintenance. Needs for maintenance can be conveyed to maintenance management applications through the asynchronous notification capability of alarms. Notifications from the applications can be processed (with operator concurrence) to ensure that the equipment is in maintenance mode at the designated time, and that maintenance personnel have the authorisation to access the site and equipment (since M&C manages access control to physical facilities). In addition to direct access points that are built into Components, M&C can provide physical network access points at the Core and Stations so that maintenance engineers have access to M&C capabilities for monitoring and troubleshooting. Integration with the maintenance applications can be used to track the configuration changes made by maintenance engineers and update its internal information about system configuration.
5.8.5 Logging and Archiving
Archiving and logging is an essential part of SKA M&C functioning and serves the following purposes:
• Storing monitoring and control data • Diagnostics and troubleshooting • Analysis of system performance • Establishing links between various data, or traceability
All of these tasks need to be performed both in real time and off-line using suitable visualisation and analysis tools which link to the Archive Database.
WP2-005.065.020-TD-002 Revision : 0.2
Page 41 of 69
Storing Data: As the schema in Figure 7 indicates, the M&C data, science data and associated metadata as well the products of the initial data processing may need to be archived. In addition, all alarms and events may also need to be stored in the archive. Each of these data streams may need to have an Archiver application within, which captures the information which needs to be stored, and sends it to the Archiver with appropriate tags. Each application may decide which data are to be archived. In the case of M&C, considering the diversity of monitoring and control data that can be generated, a guiding principle which is used in some systems is that any data which could in principle raise an alarm can be archived routinely, even in the absence of an alarm. This can facilitate analysis of actual alarms. Diagnostics and Troubleshooting & Analysis of system performance: All of the data stored in the Archive may need to be accessible to analysis tools, both for evaluation of performance and for trouble-shooting. The Archiver stores all the input data with suitable links (see below) to facilitate data retrieval across multiple views like time, system, location, and so on. Traceability: All the M&C data, science data, metadata, alarms etc associated with a given observation (i.e., at a given time, using a given sub array) need to linked to each other in the Archiver so that an user can access, for example, start from an image and access the alarms generated during a particular scan of science data which went into generating the image. When certain erroneous archive records are deleted or modified, these links need to be suitably modified as well.
Figure 7. Archiving Schema
WP2-005.065.020-TD-002 Revision : 0.2
Page 42 of 69
Figure 8 shows the components which store information in the archive, and the components which use the archived data. Note that each of the former components need an application which decides what is to be archived. The
Archiver then links related data products, outputs data across multiple views, and is capable of modifying its contents through feedback. Related to traceability and access to multiple views is the issue of tagging of data in time, system, observing proposal, etc. Various data streams may arrive at the Archiver at different times, in non-chronological order. Existing systems like PVSS II (LOFAR) and EPICS (ASKAP) have attempted to handle this issue. The archive needs an audit trail. The needs for backup / disaster recovery have yet to be determined. Archiving and logging need to conform to Virtual Observatory standards. Work is ongoing in defining standards for both VO and AstroGrid for archives. In this regard, a good example is Astrowise [52], a federated system for processing large multi-CCD images). AstroWise not only conforms to VO standards, but has also implemented trackability extremely well, though it stops short of going backwards of the input science data. Logging is meant to help users to analyse science data, in addition to metadata. This is complementary to the standard use of logs for engineers to analyse system behaviour. The system is pre-configured to be aware of the information that needs to be logged. Additionally, users should be able to, based on some interface, choose which other (achievable) information she wants logged as well. Logs are also achievable. Only the telescopes that are currently being built are designed to archive the M&C data in a consistent manner – e.g. LOFAR, ASKAP, EVLA and ALMA. The LOFAR M&C, PVSS II ([22], [36]), has an inbuilt archiving tool – a relational database for storing data point monitoring and alarms. It supports retrieval, visualisation, APIs etc. The logging is through an external package. Five levels of logging are defined and are stored in the PVSS database as well. Logging access is restricted to front-end of regions to limit database connections but there is a logging client at each node as well. ASKAP M&C (based on EPICS) has an archiving module ([53], [54]) with similar functionality to PVSS II. A separate system is built over this module in order to visualise the data. EPICS has a separate logging Archiver which connects
Figure 8. Archive Usage
WP2-005.065.020-TD-002 Revision : 0.2
Page 43 of 69
to various software, and has a query service as well. An event is stored in the log with its origin, timestamp, level, and message. Log events propagate such that there is decoupling between the Archiver and components that publish log values. EVLA has its own monitor data archive tool [55]. Archives from proposal up to data, M&C info and schedule are trackable.
5.8.6 Recovery
Recovery from a fault may be accomplished by mechanisms such as a reset or reconfiguration of the entity involved and any other affected entities, or by failover or other substitutions (e.g. re-routing, re-balancing load among other power sources) if redundant capacity is available. Where equipment has been disabled and removed from service, recovery requires that the cause of the fault be diagnosed and resolved, that the entity be tested and reintegrated into the system.
Recovery also includes restoring the state of the entity. Where there are redundant or substitute entities, the recovering entity may obtain its state from them. In other cases, techniques such as check pointing and persistence of changes to base state provide the state information needed to recover from failures. The ability to recover to the last known good state is useful to handle misconfiguration errors.
M&C supports the recovery process by providing coordination capabilities among affected entities, troubleshooting capabilities and the Offline operational mode. Entities that are faulty notify their parent entity of the fault. The parent in turn can send commands to other affected entities, placing them temporarily in states that may not be adversely affected by the faulty entity, until recovery is complete. Parent nodes that receive notifications of faults in entities can broadcast an Event to indicate this. Peer nodes that may be affected can subscribe to the Event and temporarily suspend their interactions / dependence on the faulty entity until its recovery is complete. The Offline operating mode enables direct engineer control of entities, monitoring while maintenance activities are in progress, and isolation from the rest of system to avoid disruption of observations that may be in progress.
5.8.7 Operational Continuity
The objectives in operational continuity are that ongoing observations must not be disrupted by failures and that any gaps in the instrument's scientific capabilities caused by the failures must be notified to the operator, to scientists and recorded in the metadata.
Avoidance of disruption requires that faulty entities be removed from operation without unnecessarily affecting healthy entities. This requires
• Isolation of the faulty entity • Notifications to affected entities • Assessment of the impacts of the fault • Substitution or reconfiguration of the environment to work around the fault.
Isolation of the faulty entity may involve powering it down and/or removing references and dependencies so that no fresh interactions take place. This is accomplished typically by the parent of the affected entity, responsible for distributing notifications to affected peer entities so that they may eliminate their dependency on the faulty entity.
In some cases, the effect of a fault may be that a higher-level entity can no longer continue functioning. For example, failure of power, cooling or signal transport may make an entire region inoperative. The impact of the fault must be assessed by the appropriate higher-level node, which must then shutdown all child entities, notify its parent and finally shut itself down.
WP2-005.065.020-TD-002 Revision : 0.2
Page 44 of 69
Where there is redundant capacity, e.g. in infrastructure, faults may be dealt with by substitution of other system resources for the failed entity. Either in the case of substitution or simple shutdown, other entities in the context may need to be reconfigured so that they no longer refer to or depend on the entity that was removed. This may include removal of communication references, modifications to internal tables, or changes to physical dependencies (e.g. switching to an alternative power source). This reconfiguration is the responsibility of common parent nodes, that know both about the failed entity and about which other entities may be affected.
The impact of the fault on the instrument's engineering and scientific capability must also be assessed. If the fault is severe and widespread enough to affect any of the science performance parameters (e.g. sensitivity, uv coverage, station beams), this must be detected, the science parameters recomputed, and if they fall short of the needs of any observation currently in progress, then this must be notified to the operator as a key alarm (in addition to generating metadata augmentations). This may need to be checked against observational requirements (either by the operator or by software) and the scheduler may need to reschedule observations. If it does not have a significant impact, then the operator notification may be as a simple alarm or Event. Faults that have an impact on capabilities must also be propagated and notified as metadata to the science data path. Software faults must be fixed either by reset and restart of the failed software, by reconfiguration of associated data and parameters, or by the development and application of appropriate patches.
5.8.8 Standards, best practices and current capabilities
The two main standards for alarm handling - the Abnormal Situation management Consortium [16] and EEMUA [17] led to the current industry standard ISA SP 18 task force (see documents in [18], especially [19]). The standards recommend a well defined set of organisational principles and decision trees for designing, testing and operating an alarm handling system (referred to as the Lifecycle Model).
These standards recommend a series of best practices in the context of alarm handler design. The first principle is to ensure that higher the severity of an alarm type, lesser is their frequency of occurrence. In practice, it is seen that a small fraction of alarm types contribute to the bulk of alarms and these need to be dealt with keeping in mind alarm floods and aggregation.
The Alarm System needs to be flexible enough to accommodate feedback from the operator with regard to modifications to the alarm definitions. Tools need to be provided for alarm analysis both in real-time as well as from archival data. Alarm floods should not cause the entire system to come to a halt, in case alarm handling methods like aggregation are not sufficient.
There are standards available in SP 18 for evaluating the safety of an alarm system (Safety Integrity Level), which comes into play during the design phase. Radio telescopes currently being built utilise standards-compliant Alarm Handlers.
Both PVSS II (used by LOFAR [21]) and EPICS (used by ASKAP [23]) have an integrated alarm system including configuration, automatic triggering and, alarm displays and APIs for custom apps, using an alarm database. PVSS II alarms have an associated entity name, the value of the faulty variable and the timestamp and these can be filtered and summarised. Computers at region level can handle alarms locally and only out-of-boundary events are reported to the central processor. The EPICS alarm handler brings alarms to the notice of the operator, allows the operator to globally acknowledge alarms, aggregates alarms, provides a graphical view of current alarms, logs alarms and displays the logged alarm history. Each alarm consists of the status and its severity.
ALMA has adopted the LASER (LHC Alarm Service [56], [57]) system from the LHC for alarm handling. LASER functionality does not include fault detection. It uses a specification-driven (non-compiled) approach that enables one to make online changes to fault definition and employs a run time lookup. LASER has a fault state reduction technique for avalanche (cascade) conditions, eliminating causal sequences and similar alarms. LASER is a service based distributed layered application that uses Java technologies. User software detects faults, generates message
and injects them into LASER in the correct format, which then gathers faults, groups, analyses, allows browsing, and archives them.
EVLA [55] uses a hierarchical system for alarms. Each alert captures the time, device id, type, consequence, description, and cause and action suggestion. They have mechanisms for dealing with multiple alarms arising from oscillatory behaviour, as well as identification of the first-out alarm. Based on their experiences, IP multicast should be investigated further for a messaging bus for alarms within the SKA. E.g. message bus for weather station data access.
5.9 Reliability, Availability and Performance Management
SKA has a system reliability goal of 99.4%, and an availability goal of over 90% (with availability being defined as 95% of receptors operational). M&C performance (latency, capacity and throughput) should be sufficient to enable coordination, operator and remote monitoring, timely metadata and to not contribute to any gaps in system functioning.
5.9.1 Reliability and Availability Terminology and Definitions
We have used the following parameters as reliability and availability metrics: Mean Time between Failures (MTTF): This is the statistically predicted most likely time between two failures for a single item being monitored (part, component or system), based on the statistical analysis of failure rates over a number of observations. This is typically measured in hours or years Mean Time to Repair (MTTR): This is the statistically predicted most likely time to recover from a failure and have the component or system functional again. This too is based on the statistical analysis of actual times over a number of observations. This is typically measured in minutes or hours Availability: This represents the percentage of the total time that a component or system is functional. This is related to MTBF and MTTR as under Availability % = MTBF / (MTBF + MTTR) * 100 Given that the availability definition permits some parts of the system to be down at any given time, the system operation should be considered to be operating reliably if given the available receptors, the system is able to perform correct observations and deliver useful science output. It is considered to be functioning unreliably (erroneously) if
The system is unable to utilise the available receptors to perform useful observations e.g. because of errors in coordination or resulting behaviour.
The system performs observations and produces science data, but the produced data are not useful because of deviations from expected science performance parameters.
5.9.2 Implications of the Reliability and Availability Goals
This section is a preliminary exploration to understand the implications of the reliability and availability goals on M&C design, including requirements on Local M&C. The 99.4% reliability goal for the SKA system will require a much higher reliability from Central and Regional M&C, at least 99.9% and possibly higher (99.9% implies that M&C itself contributes ~15% of all the allowed Component failures), since any unreliability in M&C will directly lead to Component unreliability. The 90% availability goal implies that M&C should have high availability, since any M&C downtime directly results in downtime for an entire region or even the whole system. (It should be noted that unavailability in SKA is caused largely by environmental conditions such as severe weather and radio interference, not just by failures or scheduled downtime). There are several potential sources of lack of M&C reliability and availability:
WP2-005.065.020-TD-002 Revision : 0.2
Page 46 of 69
M&C hardware failures
M&C software failures
Misconfiguration of M&C.
Scheduled downtime for maintenance. FMECA can be used to perform a detailed fault tree analysis for the M&C system and work out precise implications. Here we present a crude analysis to get an initial sense of failure sources and impacts, to understand where reliability efforts need to be focused. M&C is likely to have multiple processors at each node, even for Regional M&C. Not only does modern hardware have high reliability, but the presence of multiple hardware units makes it relatively simple to incorporate failover. This is further simplified if distributed control database technology is used (see section 6.3), since they transparently distribute the system state. Within an M&C node, it is primarily the control functionality that is critical to reliability and availability, since control failures have a multiplier effect. However, it is relatively straightforward to provide failover capability that encompasses both control and monitoring capabilities. Failover can be used to tolerate hardware faults, and transient software faults that are eliminated by a system reset. Misconfiguration problems are largely tolerated by providing the ability to revert to a "known good state". The reliability goal is far tougher to achieve, since it requires very low error rates. The primary impact on reliability is likely to come from software, since the probability of software bugs is much higher than that of hardware failures. The primary technique to develop highly reliable software is that of software reliability engineering. This includes a collection of practices, including operational profiles to focus reliability attention on frequently used parts of the software, tracking reliability growth and extensive load testing with a test suite that mirrors the real operational environment. The simplest and most effective approach to make sure that the software is extensively tested in a wide range of contexts is to use the same software for the unit and integration testing of all SKA Components. If a prototype of the M&C software is developed early in the program (~3 years before first science) and supplied to all Component providers for testing their software and hardware, they will be able to eliminate most of the defects well before M&C commissioning. A related problem is that of ensuring high reliability for Local M&C software. A Component cannot meet the 99.4% reliability goal unless its Local M&C software has ~99.7% reliability (which implies that Local M&C itself contributes 50% of he allowed Component failures). There are three steps that M&C can take to ensure that Local M&C for all components meets these standards:
Place an explicit requirement on all Local M&C systems to meet and demonstrate this level of reliability.
Provide a set of guidelines, practices and features that is expected to be present in all Local M&C systems, such as internal software fault detection and fault-tolerance, software fault recovery (e.g. automated software restart) and internal design and testing practices including FMECA. These can be part of the Standardised Component Interface (see section Standardised Component Interface). The M&C team can also provide expert consultancy and guidance to ensure software reliability.
Create a certification test suite that severely exercises Local M&C software, including faulty inputs and unusual pathways, plus generation of randomised legal sequences so that it can find transient faults. Ideally, a generic configurable simulator of the hardware should be developed so that it can be provided to Local M&C developers, so that they can test their software thoroughly without having to have the hardware fully ready and incur the costs of its operation. The generic machine control software technology referred to in section 6.6 is capable of also serving as such a simulator.
5.9.3 Preliminary analysis of M&C reliability
We present here a preliminary analysis modelling the impact of M&C reliability on the overall system availability. This is a back of envelope / order of magnitude analysis, to establish a preliminary understanding of the needs and
WP2-005.065.020-TD-002 Revision : 0.2
Page 47 of 69
implications, as a prelude to the more thorough reliability analysis based on FMECA techniques later in the lifecycle. For this purpose the following simplifying assumptions are considered:
i) All points of failure are considered to have a uniform failure probability f; for order of magnitude
calculations, we can consider this to be the worst one of all points of failure. ii) All failure events that affect only M&C are considered to be independent of each other. [This assumption
is of course not valid for common cause failures like outages, hardware failures due to voltage spikes on account of lightning strikes, large fires etc. However these are not considered here under the assumption that these are likely to affect other systems than just M&C, and would have to be analysed for downtime impact at a system level, and so too would be the mitigation or containment methods]
iii) We partition the individual failure types into just two categories: the first those that result in a complete system downtime; the other type being those failures that have a local impact and are containable in terms of system wide impact.
Based on these assumptions, the failure behaviour of M&C can be analysed as follows:
Consider N independent points of failure for the M&C i.e. there are N different entities with failure probability f all of which must be functional for M&C to function correctly. There are two possibilities: i) The failure point involves an entity with redundancy, hence its effective probability of failure is f2 ii) The failure point involves an entity with no redundancy, the effective probability of failure is f For N independent points of failure therefore, the probability of at least one uncompensated failure is
[1 – (1 - f2) N] ....... in case i)
[1 – (1 - f) N] ....... in case ii)
Assume the following values for the variables: f = 0.005; this would be valid based on an MTTR of 48 hours and an MTBF for an individual component of an order greater than 10,000 hours. An examination of typical figures for control equipment provided by leading vendors shows this assumption to be reasonable. N = 50; this is arbitrary but useful for getting an order of magnitude figure and a reasonable worst case figure since we impose the very strict condition that a single failure brings down the system.
This gives an overall failure probability of 0.001 or uptime of 99.9% for the case with redundancy and 0.22 or uptime as low as 78% for the second case. This leads to the fairly apparent conclusion that having a 100% redundancy for every critical point of failure is a must for high M&C reliability. There are two types of entities in Central and Regional M&C that can fail: hardware entities such as processors, network links, power supplies and storage devices; and software entities. Given that the data rates at both Regional M&C and Central M&C are high enough to warrant multiple control processors, it is relatively simple to provide n+1 redundancy, particularly for control processors. N+1 redundancy can also tolerate transient software faults, based on detection and restart. However, reliability also requires that software faults be detected, so that they do not propagate throughout the system. This requires the software reliability techniques discussed in the previous subsection. The reliability requirements of Local M&C are somewhat weaker than for Central and Regional M&C, for which failures have a much larger scope of impact. If the reliability of Regional M&C and Central M&C were each 99.9% (the target), Local M&C would need a reliability level of ~99.7% to get an overall reliability level of 99.4% for individual Components. This may or may not require hardware redundancy, but it will require that Local M&C software also build in significant fault detection and restart capabilities. In addition, there will be a requirement for
WP2-005.065.020-TD-002 Revision : 0.2
Page 48 of 69
each Local M&C to have a heartbeat with Regional M&C, so that complete failures of a Component controller can be detected and the Component M&C restarted.
5.9.4 Performance Terminology
Performance typically has two meanings, the first relates to “time performance” and the ability to perform the required tasks in the expected time. This is closely related to system latency, the ability of the system to respond or perform its various tasks in a specified time. The second aspect is the “throughput performance” or ability to service a high number of simultaneous transactions, correctly, without important tasks being dropped entirely and also without significant degradation in the timeliness. Clearly these are interrelated, since the second aspect has timeliness as one of the considerations. For the purposes of the M&C analysis, we have considered both timeliness and throughput.
5.9.5 Performance: Throughput
Handling 500,000 monitoring values per second may require multiple processors. The M&C node architecture presented in [29] is scalable to large volumes, because the worldview database can be distributed across multiple nodes. This becomes vastly easier if the underlying platform supports transparent data replication, as discussed in the section on Realization Technologies. The presence of multiple processors makes it easy for M&C to incorporate redundancy. Each M&C processor may have both control and data processing capabilities, however only one of the processors actually performs control functions. It periodically replicates its internal state information with other processors (this is performed transparently by data replication platforms such as EPICS and PVSS). If the primary control processor fails, any other processor can immediately take over as the primary. The data volumes above did not take video data into account. It is desirable for M&C to support video monitoring as well for security and safety reasons. Video data need not be processed at the regional M&C node, but can be directly streamed to destination receivers via the communication link. It increases data rates but not the processing requirements of M&C nodes (except to control the video stream). Central M&C may need to handle approximately 50 times as much data as individual regions i.e. up to 25 million monitoring values and 3 Gaps of data. (This becomes somewhat less if the option to store much of the data locally at regions is chosen. It should be noted in this context that M&C for the core region may also be grouped into multiple regions for design convenience). Most of these points can go directly into the archive, and be available for troubleshooting. Some of these data streams can be accessed by operators, with other monitoring points and parameters being available on drill-down. These throughput estimates were for SKA2. SKA1 may process only a small fraction of the above data volumes. An analysis of recent control equipment specifications, similar to the one done in the section above, shows that communications cards designed for protocols like Optical Fault Tolerant Ethernet can today easily handle data rates to the tune of several Gaps, and so can the processor at least to the extent of storing the data. Therefore, purely from the communication perspective it would not be a challenge to meet this requirement. However, if there is a lot of processing intended on every data point coming in, that may be a challenge. However, here too the essentially distributed nature of the SKA can help.
As a slight digression to understand this point, it should be noted that performance is often closely juxtaposed with another non-functional parameter of scalability. This is because when the system performance because of transaction load reaches its limits, scaling the system components based on the load is one of the intuitive solutions. Scalability addresses the question of whether the system architecture, interfaces and application components allow performance to increase reasonably linearly with the addition of components. This aspect is not addressed directly
WP2-005.065.020-TD-002 Revision : 0.2
Page 49 of 69
in this document. However we would like to comment here that distributed system architectures typically scale well on most parameters. Since the SKA by its very nature is in great measure a distributed system, and correspondingly so will be its M&C system, performance of most of the M&C tasks are expected to be maintained from the sub-system level to the system level. Considering the multiple processor nodes in the M&C architecture, each largely dedicated to the processing needs of one sub-part of the SKA, a large part of the processing and decision making of the incoming data can be handled within that processor itself. While there would certainly some processing based on the data coming from a global level, it is not expected to form more than a small fraction. Therefore the proposed distributed, multi-processor architecture for the M&C can be safely expected to handle the throughput requirements well. The only aspect that would need more detailed analysis at the next stage of the project lifecycle is the throughput and latency requirement for those aspects of the M&C that involve data streams and co-ordination at a global level. Again this being a requirement at a single point, rather than needing to be replicated at each processing node, the possibility of using a much more powerful dedicated processor for this purpose can resolve any issues on this count.
5.9.6 Preliminary analysis of M&C throughput requirements
This section develops a simple parametric representation to derive the typical expected M&C data rate from Components to Regional M&C to Central M&C. The throughput requirements for M&C can be estimated based on data volumes to be handled. The exact data volumes are not yet available at this stage of the design; however a very preliminary estimate can be arrived at based on some ballpark assumptions. Let a region contain on average N components; these include receptors and supporting infrastructure. Each component has multiple sub-components each with their own control loops, e.g. a set of servo drives, and several data points: both analog and digital utilised by the local control processors. Many of these will be local to the control algorithms and loops, however quite a few, especially those that represent sub-component states will be necessary to control, monitor and archive at a higher level, say Regional. Moreover, for troubleshooting purposes, it is quite desirable to capture and archive data points even from deep within a Component, so that historical data is available for data mining and analysis to aid in fault analysis and failure prediction. For example, for power equipment we will need to monitor internal operating states as well as the current state of all of the associated transmission links; similarly, a beam-former will need to monitor the operating parameters of all the processors, the status of all its interconnects, as well as some of the internal software parameters. Dense Aperture Arrays may have many more monitoring points. Assume M to be the number of points to be monitored at the regional level. Let T represents the sampling frequency for data points (or frequency of control operations, for output parameters). This includes both set point updates etc. and monitoring, trending transactions. Let B represent the average size in bytes of the data exchanged per point. The data rate flowing from the station is
M X N X B / T
Typical traffic can be derived by making a set of assumptions: N = 100 M = 5000; considering monitoring points could include some raw (acquired) data and derived values
resulting from the processing of the acquired data. It also includes logs, alarms and events, control commands (which generate comparatively small amounts of traffic) and archiving traffic. The relatively large value of M reflects the complexity of Components, which may have many subsystems and hundreds of parts, and also allows for dense AAs, that may have tens of thousands of monitoring points.
WP2-005.065.020-TD-002 Revision : 0.2
Page 50 of 69
T = 1s; The sampling frequency typically varies from 10/sec for data points monitored very frequently to about once in 10 secs for points that vary more slowly. Again set point updates, alarms, commands etc. for a distributed control scenario are expected to be well lower on average.
B = 10 bytes; Assumes every data point is an analog high precision (double). Many tags are expected to be
Boolean, some may be analog of lower precision, but on the other hand some parameters may consist of pairs or even collections of values. This includes encapsulation, packetization overhead as well.
This gives us a preliminary estimate of traffic generated per station of is ~5MB/sec– around 50 Mbps per station. One potential challenge is that of dealing with hundreds of thousands of monitoring points at Regional M&C, both from a viewpoint of processing capability and the scalability of real-time databases. Modern processors can typically deal with thousands of data points per second per CPU. However, even with this capability, and allowing for increases in capacity over time, it is still likely that Regional M&C will consist of multiple servers. This has a positive side: the presence of multiple processors and servers provides the redundancy that will be needed to achieve high reliability and availability. The real-time database problem could be more tricky to handle. It is discussed further in section 6.3.1. One of the architectural variation points [28] is whether all of this data needs to be transmitted to Central M&C. If all the data from each region is sent to Central M&C, then the potential data volume at Central M&C could be huge, running into millions of monitoring points. The alternative is to archive the data at the station itself, thereby reducing both traffic to Central M&C to only high-level abstractions and summaries of the monitoring data, and also eliminated the need for duplicated data handling at Central M&C as a prelude to archival. The current preferred design option is to store and archive much of this data locally at each region for drill-down / troubleshooting purposes, and send only abstracted high-level summary information to Central M&C. If this design option is chosen, the volume of network traffic generated and the amount of redundant computation at Central M&C is much less, however Regional M&C must still acquire and process all of these data points, and also be able to store and archive it.
5.9.7 Performance: Latency
SKA includes latency requirements for control, monitoring, metadata and alarm response. Control operations that require system-wide synchronization (e.g. start of observation, end of observation, steering) can be based on absolute time. The availability of an extremely accurate clock at every node makes this an extremely attractive option, eliminating the problem of lack of synchronization due to latencies. Other control operations (e.g. configuration parameter setting, query of parameter values) need to complete quickly enough to (a) avoid operator wait (b) avoid delays in getting the system to the desired state. This typically translates to latency targets of around 500ms. Monitoring latencies need to be small enough so that (a) observers perceive no undue delays (b) higher-level nodes that detect and handle events are able to do so in a timely fashion. In this case, 250ms appears to be a reasonable target that satisfies both criteria, and aligns with the requirement of 500ms for two-way interaction. This level of latency is also probably acceptable for most alarms, given that immediate response to urgent situations is the responsibility of the local node, not higher-level nodes or the operator. However, key alarms may require a faster latency e.g. 50ms to reach higher-level nodes (not for human response, which can be of the order of seconds or minutes). The latency requirement for metadata is TBD, but it is unlikely to be shorter than 250ms. It is TBD whether signal processing has any requirements for real-time input parameter streams with shorter latencies. The feasibility of meeting this requirement can be analysed by examining the processing flow for control and monitoring operations. Data from a sensor or actuator may need to (a) be processed within the Component (b) be acquired and processed by the Local M&C (c) communicated to Regional M&C (d) be acquired and processed by Regional M&C (e) be communicated to Central M&C (f) be processed and displayed by Central M&C. A total budget
WP2-005.065.020-TD-002 Revision : 0.2
Page 51 of 69
of 250ms breaks down to budgets of 40-50ms for each step. While this budget is adequate for processing, the delays in moving data between nodes (largely due to wait times for communication and for processing) can be longer in some cases. It can be seen that the critical entities in achieving the end-to-end latency are not the communication links, but the choice of scheduling algorithms for the processor and for the network. If most of the mechanisms employed are push mechanisms (interrupts, event-based triggers), then the target latency can be achieved. Control equipment, including PLCs (Programmable Logic Controllers) and DCS (Distributed Control System) typically uses the parameter of scan time to measure latency. This figure provides an idea of the time it takes to complete a cycle of input acquisition, processing, and updating the outputs as needed. Analysis of the scan times for PLCs shows that the latest ones provide scan times as low as 3 to 5 millisecond. This is true even for PLCs that can handle several hundred up to a few thousand I/Os. Since DCS are expected to handle a much higher range of I/Os, several tens of thousands, as well as more analogy loops, their scan times are an order of magnitude higher. But even here the specs show this parameter today to be anywhere from 50 ms to 100ms. This is a significant improvement over the last decade, when PLC scan times were of the order of 1 to 2 seconds. It would be safe to conclude, therefore that the M&C latency requirements are within the limits of today’s technology.
5.9.8 Reliability, Availability and Performance: Summary
The latency requirements appear to be achievable if there are only three layers to the architecture. The throughput requirement may require multiple processors and bandwidths of the order of 50Mbps per region. The presence of multiple processors makes it possible to provide redundancy and failover to deal with both hardware and software failures in M&C nodes, which require to be very highly reliable both for Regional M&C and Central M&C. Techniques such as reliability engineering may be necessary to deliver software that can meet this reliability goal, particularly because synchronous failures cannot be dealt with by failover mechanisms alone (the replacement node is likely to encounter the same failure if it tries to handle the triggering event, since it uses the same software). All single point of failure components may also need to achieve higher levels of reliability and availability, either through redundancy or partial availability. This preliminary reliability and availability analysis may need to be followed up by a formal Fault Tree Analysis and the use of FMECA (Failure Modes, Effects and Criticality Analysis). The failure nodes must each have accompanying failure rates (MTBF) data. These parameters are obtained either from equipment providers, empirically from several years of field failure data or in-lab settings through methodologies like HALT (Highly Accelerated Life-cycle Testing) or a combination.
For a system level, the approaches to reliability calculation would derive from the component level parameters but is quite a non-trivial activity. A formal reliability analysis would have to take into account various aspects of degradations in the system like proportion of the functionality affected, criticality of non-available features, whether a workaround is available or not, whether the error is self recoverable - albeit with some delay, and so on. Such formal analysis requires considerable time and effort. It can be done to a moderate level of fidelity for much of the system, and needs to be done thoroughly for the safety-critical parts of the system i.e. the handling chain for key alarms. Caltech Millimetre Array [24] has a tree structure for detecting and flagging bad real time data and use Fault Tree Analysis, a method to analyse faults in a system in a tree fashion, fault tree diagram using logic gates, in reliability engineering, and then calculate probability of failure from the tree etc. - http://www.faulttree.org/. It would be useful to adopt a similar approach during the system detailed design phase, when components are identified and specifications available.
5.10 Safety, Security and Integrity
The scale and complexity of SKA makes it imperative that the system must act proactively and automatically to
protect its integrity, ensure safety of people and expensive equipment, as well as prevent, detect and repel security threats. The approach to ensuring integrity, safety and security is threefold:
Identification of architectural guiding principles that define an overarching approach to guard against both anticipated and unanticipated threats.
Design of specific mechanisms that can be configured to repel anticipated threats.
Modelling of anticipated threats and analysis of the handling of these threats.
5.10.1 Safety
Safety considerations include both threats to people and threats of damage to expensive equipment. Guiding Principles
Fail-safe: The response of the system to failures shall ensure that the failure modes of the system do not threaten safety. For example, in the event of loss of primary communications between an outlying region and the Operations & Maintenance Centre, the outlying region is shut down. This ensures that the absence of higher level exception handling for power and other infrastructure systems does not lead to accidents such as fires. Fail-safe design also includes prevention and elimination of threats where possible e.g. designs of dish mounting mechanisms that limits travel to safe ranges.
Localised response: The responsibility for detection and response to safety threats is pushed as far down the system hierarchy (as close to the point of occurrence) as possible. This reduces latency of response, reduces the number of system entities on which the detection and response to the threat depends (e.g. no dependence on long-distance communication links), and enables assurance of safety response at the unit level.
Redundant detection and response: Where possible, there should be multiple independent sources by which the threat can be detected and repulsed, preferably including both direct local detection and indirect local or nonlocal detection. For example, the threat of fire in a computational unit should be detected and handled both by direct temperature sensing of the processing unit and smoke detection in the associated facility. In situations where there are no alternative detection modes, there should be redundant sensors and handling entities, so that there is no single point of failure for safety threats. Ideally there should also be ways to confirm the successful implementation of the targeted response, typically lack of output from entities that have been shutdown.
Defense in depth: The above principle is a specific instance of the more general principle of defense in depth, whereby the safety system need to be designed with multiple layers of detection and response, including human and external sources. For example, notification of a severe weather event may arrive from external sources, in addition to being detected locally. These multiple layers provide considerably higher reliability, since any given detection mechanism may be subject to common mode failures with the situation being detected.
Mechanisms
Threat detection mechanisms, including alarms built into the hardware, thresholds on sensors and parameter correlation and externally detected threats notified to M&C from external integrations.
Redundant sensors, especially where there do not exist multiple independent detection and response pathways.
Watchdog and heartbeat mechanisms, between Central M&C and regions, as well as between regions and individual Components. The purpose of heartbeats is to detect loss of connectivity, as well as failures of individual control nodes, so that appropriate handling actions (e.g. restart) can be taken. Watchdogs provide for automatic resets in case of some types of internal failures.
Threat elimination and response mechanisms built into the hardware or into special purpose safety devices.
Threat response rules programmed into the event detection and control logic state machine specifications.
One possible mechanisms (to be evaluated) is an Independent safety monitor at each region that monitors safety-critical sensors (e.g. smoke detectors, flood detectors) and shuts down the region if triggered. This is a backup mechanism to deal with the possibility of a total Regional M&C failure, which could lead to equipment in
WP2-005.065.020-TD-002 Revision : 0.2
Page 53 of 69
the region continuing to function in an uncontrolled way. This could be an extremely expensive design option, since it may need redundant wiring and sensors to ensure that it has no common modes of failure with the Regional M&C. If an off-the-shelf design is available, that would reduce development costs. It is possible that more careful threat analysis can reduce this requirement to a more manageable cost level. This is an architectural variation point [28].
Backup on-demand low-capacity network link between Central and Regional M&C, with which it is possible to ensure safe shutdown in the event of communications link outage.
Safety threats model and handling This is a preliminary model identifying some of the anticipated safety threats. More comprehensive threats identification and analysis will be performed during the next phase.
Excessive wind speeds that can damage receptors. This can be detected by wind speed sensors, weather reports, receptor position sensors as well as deviations from expected receptor travel patterns. The response action is to stow the affected dishes.
Power surges that can damage equipment. Complementary to surge protection equipment that detects and responds to power surges, there also needs to be detection based on monitoring of power quality at various points that triggers cut-outs or shutdowns of equipment that could be affected.
Fires in computing equipment either at regions or operations centres resulting from cooling failure or short-circuits. Detection includes temperature sensing, smoke detection and monitoring of power consumption patterns. Response is to shutdown computing equipment and trigger fire fighting mechanisms, if necessary.
Excessive speed or range of travel of receptors. This is prevented by interlock mechanisms that limit the speed and range to safe values.
Environmental threats, including floods and earthquakes. Detection includes sensors in facilities, external reports and unusual erratic behaviour patterns in equipment (relevant particularly for localised events, such as rain-induced flooding in specific Components). Response is to shut off power to the affected equipment or the entire area, stowing receptors and taking any additional protective measures that may be available.
Communication failures that lead to isolation of outlying stations from central control. This can be detected directly by the communications link, as well as indirectly by loss of heartbeat with central M&C. Any regions that lose communications capability can shut themselves down unless communication is restored within a short timeframe (~1 minute), since anyway the results of observations cannot reach the Correlators. This can prevent the possibility of safety violations due to unhandled exceptions. Regions can have a on-demand low-capacity backup communication link so that Central M&C can ensure in emergency situations that the region has shut down and visually monitor the region if needed.
Failure of Regional M&C. While it is designed to be highly reliable, and redundant so that failover can restore capability quickly, there is still the possibility of unanticipated common mode failures that cause complete failure of Regional M&C. This would be the function of the independent safety monitor, to detect situations where Regional M&C itself fails and safely shut down the station. Creating a simple independent safety monitor with which M&C heartbeats and which includes some independent detection of environmental threats (a primary source of common mode failures) can provide very high reliability at moderate cost. The backup low-capacity link
Failure of Local M&C. It can be quite dangerous for Components (such as power equipment) to continue to operate if their M&C is no longer operational to detect and respond to safety threats. Local M&C systems can be required to maintain a heartbeat with regional M&C systems as part of the standardised interface, so that any Local M&C failures can be detected by the station. The response action is for the station to restart the M&C node for the Component (another part of the standardised interface: in general, all Components can be required to provide reset/restart capabilities). If the M&C operations cannot be restored, then the associated Component can itself be shut down by the station.
IEC 61508 [61] provides guidance on designing for safety.
WP2-005.065.020-TD-002 Revision : 0.2
Page 54 of 69
5.10.2 Security
The problem statement from a security perspective for the SKA is as follows: the distributed set of nodes has to be physically and structurally secured against unauthorised access both in physical space and in cyber space. Security concerns include physical security, access security, network security, malware, active IT threats (cybercrime), data security, secure software development, as well as needs for accountability and traceability. Guiding principles
Levels of trust: Sources of commands, requests for information, modifications to system software (e.g. upgrades, patches, test scripts) and information exchange (i.e. integration points) have associated levels of trust based on the access point, authentication mechanisms and trustworthiness of the connectivity from the source to the system. The extent of monitoring and control capabilities provided varies with the trust level.
Trust in authorised personnel: Authorised personnel can explicitly override trust limitation mechanisms. For example, maintenance engineers at sites can upload software that does not pass digital signature checks by explicit override. This is a philosophical choice that avoids restrictive procedures that can impact productivity, based on the assumption that the nature of SKA does not warrant an excessively tight approach to security. However, such overrides can be controlled by explicit system configuration parameters, so that overrides can be temporarily prohibited when environmental threat perceptions are high. This relates to the principle of matching security levels to threat levels, discussed below.
Security zones: The system and each of its entities constitute security zones. Inputs to security zones are validated based on rules. For example, direct connection of laptops to Components is permitted, but the inputs accepted are limited by the level of trust established based on the defined authentication mechanisms. This is particularly essential for the key data archives: engineering and science data archives. Any propagation of malware to those databases could have major impacts on SKA.
Matching security levels to threat levels: The objective is to balance cost of security against the impacts of lack of security. Stringent security mechanisms have costs, including development costs, operational costs (e.g. generating digital signatures, enforcing rigorous processes, operational glitches due to security-related restrictions) and convenience. While the design provides for a range of security mechanisms, the architectural guiding principle is judicious selection of mechanisms appropriate to the threat level, ideally with configurability wherever possible to enable security to be tightened upon need. The philosophy is one of enabling tight security but enforcing much less security unless clearly needed. The recommended approach is a design and configuration bias towards non-intrusive passive security mechanisms (auditing, patterns analysis) over active mechanisms (digital signatures, encryption, and challenge-response) that have higher costs.
Defense in depth: The defense in depth principle, that involves multiple redundant layers of detection and response, is even more applicable to security where there may be active attempts to evade particular security mechanisms.
Mechanisms
Authentication and authorization: Authentication of sources is performed using identity mechanisms (login/password, biometrics), pre-authentication of access points (based on IP address, preconfigured encryption passwords) and knowledge of expected access patterns (based on maintenance schedules, pre-registration of scientific users and configuration of expected access locations). Access from unexpected locations results in lower trust levels, with additional authentication (e.g. challenge/response) needed to raise trust levels. All users and active agents can be given unique IDs in a SKA LDAP (or equivalent) authentication system. These IDs are used to log activity, determine authorities and create audit trails. Failed authorization attempts are logged with originating IP address (or other access point information) and analysed to detect patterns that indicate intrusion attempts. Operations require authorities that are related both to roles and levels of trust. In general, computational operations other than those explicitly permitted (whitelisted) can be rejected by M&C access points. Authorities may be delegated to other roles/individuals for operational convenience.
Firewalls: The entire system constitutes a network security zone, with all access points to the internet being protected by firewalls (note that firewalls may not be available at access points built into Components e.g. USB
WP2-005.065.020-TD-002 Revision : 0.2
Page 55 of 69
and TCP ports – this is a separate risk that is discussed below). The firewalls are configured to detect and record attack attempts, and use techniques such as rate limiting and message flow control to mitigate denial of service and flooding attacks, and prevent intrusions such as port scanning on the rest of the system. The system of firewalls is also designed to serve as distributed network intrusion detection systems which will use various techniques like rate limiting, honey pots, tar pits etc. to manage defences. They will perform a variety of correlated analyses to determine attack patterns and weak spots in the system.
Checksums and digital signatures: Electronic materials that install or modify system software (patches, upgrades, executable code such as test scripts and automation scripts) must include checksums, and preferably encrypted with digital signatures to ensure authenticity and protect against modifications. Extensive checking for malware is performed at the point of generation of digitally signed assets. This alternative is preferred to installing malware checks on all systems to avoid performance penalties. o Need to check the implications for field maintenance engineers who may need to generate diagnostic scripts
on the fly and download them on to equipment for troubleshooting. One possibility is to use manual override provisions, if this is needed.
Logging and audit trails: Audit trails are maintained of changes to system configuration and changes to the system software configuration for accountability. Command/responses and exchanges over integration interfaces are logged and archived for traceability and facilitation of troubleshooting. Log analysis is a primary mechanism for detection of security violations.
Support for physical security: It is expected that SKA facilities (at the core as well as stations) can have restricted access to some hardware that may require physical authentication (e.g. card swipe). M&C can provide API support for such authentication, integrate with operations management software to obtain credentials and expected access patterns (e.g. maintenance schedules, rosters) and cross-correlate authentication attempts with expected access patterns to enforce higher security levels for unexpected patterns and to detect intrusion attempts. It can also maintain logs of physical accesses. Backup authentication and access control mechanisms can be provided to ensure that access is possible even in the event of power or communication failures.
Security monitoring capabilities with triggers: M&C can provide support for video cameras, motion sensors, audio microphones and other intrusion detection equipment. Given the potentially high bandwidth requirements of such devices, the triggering modes for these devices may vary from always-on to event-triggered (e.g. motion detection may be used to trigger video cameras) to on-demand triggering by operators. o Note: The communications bandwidth requirements of M&C can likely NOT take into account simultaneous
operation of all video cameras throughout the system. Instead, an expected demand can be computed based on likelihood of needs for simultaneous monitoring, to avoid over-provisioning.
Messaging architecture: The network links that interconnect different parts of SKA may have many entry points. Computational security (as well as other concerns) makes it desirable to create a messaging architecture over the network that ensures secure, reliable transmission and authenticity of sender and receiver identity. Intrusion detection intelligence based on packet and traffic patterns analysis is also needed to detect network security violations. These constitute security requirements for the Signal Transport domain.
Secure development processes: Security loopholes can be created by poor software. This challenge is qualitatively different from operational security, because the presence of insecure software can affect all development teams involved in the creation of M&C software, potentially including all equipment providers.
Data confidentiality: SKA data (science data, engineering data, personnel data, logs and audit trails) can be classified into levels of confidentiality. There is also the possibility of watermarking of science data if there is a need to demonstrate provenance. Less voluminous confidential data may be encrypted. However, both encryption and watermarking are expensive in terms of space and/or computation, and will add to the already massive computational infrastructure requirements, so they will be employed only where there is demonstrated need.
Threat models and analysis
Physical intrusion, including attempts at casual vandalism, theft, and intrusion by straying wildlife: The presence of expensive equipment at unmanned outlying stations raises the possibility of casual intrusion, vandalism and theft attempts, as well as wildlife that may stray into the area. M&C can support first-level detection by sensors
WP2-005.065.020-TD-002 Revision : 0.2
Page 56 of 69
on or near physical barriers (e.g. motion detectors inside fenced-off areas), as well as triggering of response actions e.g. audio alarms to scare away intruders, video cameras to monitor and record activities.
Cyber attacks, including denial of service, port scanning, and other hacking attempts: Firewall mechanisms can prevent penetration of hacking attempts into the system, and capture patterns that can be traced to sources. Denial of service attacks can be partially mitigated by filtering packets based on source IP addresses, but it can primary affect remote access to the system, not operator terminals within the firewall.
Credentials theft, spoofing: Electronic attempts to steal user credentials can be detected by records of failed authentication attempts. Physical theft of credentials can be detected by audit trails, unusual usage patterns analysis, and cross-correlation against duty rosters. Spoofing attacks (record-and-replay and other attempts to imitate legitimate users or usage) can be detected by source location checks and unusual usage patterns analysis. Biometrics can be used to help avoid the problem of credentials theft.
Malware: Digital signatures can prevent malware. If infection happens in spite of the patterns, patterns of failed integrity checks and erratic behaviour by components can provide indications of the presence of malware. The system software can then be restored (re-installed) based on system software configuration history.
Direct access to Components from field devices: Laptops, handheld and portable computing devices (including USB sticks) and support computing equipment for integration and commissioning (e.g. test harnesses) may be connected directly to Components by maintenance engineers, commissioning staff and others, to assist with monitoring, diagnostics, automated control, testing and software upgrades. This raises the possibility of propagation of malware and accidental corruption of the Component software configuration. This can be prevented by requiring that such access devices and equipment themselves be certified to be malware-free, and by instituting disciplines at the level of people processes to maintain the integrity of field equipment. The certifying authority (SKA IS operations) can configure the checked equipment with authentication tokens that can be checked by Component access points (this is a requirement imposed as part of the standardised interface), so that would-be intruders cannot simply connect arbitrary field equipment to access points.
5.10.3 Integrity
Guiding Principles
Autonomous integrity maintenance: System entities (Elements, Components) are responsible for maintaining their own integrity. All inputs from outside should be validated, outputs should be checked for validity, and the internal state should be monitored to detect integrity violations. In the event that internal integrity is lost, the entity must declare it faulty and be capable of recovering to a state that has integrity. Specifically, child entities (above some level of complexity) should not depend on parent and peer entities to supply only good inputs.
Single point of control: Any entity should have a single primary parent controller that sends it commands. There may be situations where multiple sources of control are desirable. For example, when equipment is in testing or maintenance mode, it may be useful for it to be able to receive and respond to commands both from its operational parent node and from external test harness or field equipment. Similarly, region operators, Domain controllers (e.g. network management, power management) may need to be able to send commands to the entity (e.g. minor configuration changes and parameter adjustments) for performance tuning or error elimination. However, multiple points of control create the possibility of control conflicts. To avoid or mitigate this, it is desirable to maintain a single point of control, or at least define a primary source of control. This issue is discussed in detail in the following subsection.
User primacy: There should be mechanisms for operators and maintenance engineers to override the integrity maintenance barriers of entities and either force state changes or operations (if feasible), or a force a transition to a known good state. This is to guard against the failure of the integrity maintenance mechanisms themselves.
Mechanisms
Validation of inputs: Commands and their parameters, messages from peer entities and acquired data can be checked for validity, including syntactic validity and consistency with the current state of the receiving entity. This is to guard against propagation of faults from other entities.
Built-in self-tests: Entities can include various simple built-in self-tests that detect integrity violations.
WP2-005.065.020-TD-002 Revision : 0.2
Page 57 of 69
Known good states: Both hardware and software entities can have inbuilt or saved configurations that are known to have internal integrity. Updates to these configurations are tightly controlled, typically requiring explicit human decisions. Mechanisms to trigger transitions to the known good state are also needed.
Reset: Both hardware and software entities require reset mechanisms that transition the entity to a "clean" state. This is to facilitate recovery from transient failure modes that corrupt the internal state.
Threat models
Invalid inputs: Other entities may send commands or messages that are invalid, either because they are in an erroneous state or because of race conditions and other anomalies. This is handled by validation of inputs.
Control conflicts: Multiple users (e.g. operators, engineers) may perform operations that affect the same entity, creating the possibility of control conflicts. This can even happen among applications or between users and applications, as discussed in the next subsection. This is handled by either enforcing a single point of control, defining a primary point of control (that dominates others in case of conflicts) and/or separating scopes of control in ways that avoid conflict e.g. limited rights to change configuration parameters in ways that do not affect correctness of functioning.
Propagation of state inconsistencies: System entities in faulty states that have not been detected may interact in erroneous ways. This has the potential to corrupt receiving entities that do not guard against such inputs. Input validation and the principle of autonomous integrity maintenance protect against this.
Transient faults: In spite of all the protection mechanisms, it is to be expected that complex entities can eventually transition to some erroneous state either because of unanticipated sequences of events or unexpected environmental influences. This is handled by detecting the lack of integrity, declaring one faulty, and recovering either to a clean state (i.e. erasing the erroneous transient state) or to a known good state (in case the "clean" state is itself corrupted).
Faulty states that inhibit recovery: It is possible for entities to get into undetected erroneous states, with the integrity maintenance mechanisms rejecting inputs that can fix the problem e.g. valid commands get rejected because they are not consistent with the current erroneous state, but the commands that do get accepted cannot be completed successfully because they are invalid or ineffective in the current actual state. This is handled with concepts such as known good states, user primacy and reset.
5.10.4 Support for multiple hierarchical views
One specific integrity threat is that of multiple independent sources of control. There are multiple hierarchical
system views in SKA relative to which Monitoring & Control operations may take place. There is a potential for
control conflicts arising from operations that originate from different views. Maintenance of system integrity
requires that these multiple views be identified and mechanisms worked out to permit control operations from these
views to be applied through a single hierarchy that has the capability to detect and avoid conflicts.
Operational view: This view reflects entities that work together to deliver engineering capability e.g. a
receptor together with its supporting infrastructure such as power and cooling. In this view, the observatory
consists of regions that in turn consist of sites, which include multiple receptors, power, cooling and facilities
infrastructure. Equipment such as beam formers, Correlator, data processing and archiving equipment,
central facilities all slot in at the appropriate level of the hierarchy. At each level of the hierarchy, a higher-
level engineering capability (e.g. a beam) is made available utilizing a collection of underlying capabilities.
Any gaps in lower-level capabilities will reflect as gaps in the higher-level capability.
Monitoring and Control occurs through the operational hierarchy. Decisions on resource allocation, fault
management and engineering control operations (e.g. power on, self test, state management) are all based
on the operational hierarchy. Decisions emanating from other views must be implemented through the
operational view to avoid potential conflicts. The operational view must have a model of the commands and
WP2-005.065.020-TD-002 Revision : 0.2
Page 58 of 69
associated parameters that can be accepted in each operating state and mode, and reject commands that
violate these constraints. This issue is discussed further in the section on Candidate Architectures.
Science view: From the usage viewpoint, the telescope can be decomposed to observations (possibly with
sub-arrays), and further into regions, observing sites, receptor groups and individual receptors. This view is
mostly aligned with the operational view, but varies from it because of dynamic allocation of entities to tasks
(e.g. sub-arrays). Control and coordination for achieving science purposes is based on this dynamic view.
Monitoring views based on this hierarchy are important for determining parameters relevant to science
control and coordination (e.g. instrument performance measures such as sensitivity and baseline). The
construction of these monitoring views and the control of sub-arrays are discussed in section 5.3.
Product Breakdown Structure (PBS) view: The PBS view is a development hierarchy that decomposes the
Observatory into types of entities, such as Segments, Elements, Sub-Elements, Components and so on. It
groups entities by domain and entity type. This view is useful for some types of fault analysis and
management, performance management, configuration management and upgrades that operate on all
entities of the same type as a unit. For example, Power Management software may obtain data from all the
power-related equipment in SKA, correlate the information and make power management decisions. The
construction of these views is performed by applications or dedicated control nodes that subscribe to the
relevant information sources. The decisions resulting from these views must be implemented through the
operational hierarchy.
Geographical view: Physical adjacency relationships among entities are important for some analyses and
decisions relating to physical phenomena and actions e.g. maintenance sequencing, physical risks (e.g.
flooding), radio interference. SKA M&C must support the construction and use of geographical views for
The construction of SKA, including SKA1 and SKA2, will span a decade, including several years after First Science, and the system will have a lifetime of several decades. In addition to the challenge of extensive system changes and technology evolution over a long lifetime, SKA M&C must also provide support for continuous commissioning i.e. it should be possible to integrate and commission system entities without disrupting ongoing science operations. The distributed and remote nature of system entities makes it desirable to be able to do software (and where possible, hardware) maintenance, patches and upgrades through remote management capabilities. These goals can be facilitated by the following candidate architectural principles and patterns:
Architectural decomposition to recognised sub-problems: It is to be expected that software and hardware technologies can evolve significantly in the period between design and commissioning (around 5 years for SKA1) and much more over the lifetime of the system. Ideally, the design should be able to take advantage of newer technologies that appear during this period, but of course it is impossible to predict the direction of evolution of technologies over decades. One approach to mitigate the risk of technological obsolescence is to align the architecture with the standard decomposition of the domains to subdomains, since it is likely that newer technologies will address the same subdomains, albeit in very different ways. For example, the M&C problem decomposes neatly into subdomains such as hardware sensing and actuation, field buses, software data acquisition, real-time (in-memory) data stores, data servers, control logic, alarms handling, communication infrastructure and processing infrastructure. If the architectural interfaces between subsystems are defined along the lines of the relationships among the subdomains, it is likely that modular replace ability of the subsystem solutions can be possible when newer technologies arise. The dependency patterns will also match the expected dependencies among subdomains, making it more likely that the newer technologies can support adaptation with respect to those dependencies. One limitation of this approach is that it will make it difficult to take advantage of technologies that straddle
WP2-005.065.020-TD-002 Revision : 0.2
Page 59 of 69
subdomains without covering them comprehensively. For example, an integrated technology that addresses sensing needs for one particular type of parameter (e.g. processor performance) along with the associated buses, data acquisition, data storage, alarms and control logic may interface poorly with modular technologies that address these concerns for all other system parameters.
Modular replaceability based on well-defined interfaces: To facilitate modular replacement, architectural decomposition needs to be complemented by standardised and well-defined interfaces among the subsystems. This interface definition should include not only the interaction protocols and hardware interfaces (where applicable), but definitions of higher-level semantics including functional responsibilities, interaction styles, assumptions and QoS (e.g. synchrony/asynchrony, push-pull, preconditions and state-based validity, timing expectations, validity expectations etc). This level of interface definition requires considerable effort, but it is doable if limited only to interfaces between M&C subsystems.
Use of existing and off-the-shelf technologies: Modular replace ability is synergistic with the project guideline to use existing and off-the-shelf technologies wherever possible. Reusable and publicly available solutions are likely to conform to standard interfaces, whereas custom solutions are more likely to create non-standard interface that inhibit modular replace ability. Use of off-the-shelf technologies also minimises investments that may be wasted in the event of replacement by a newer technology.
Isolation of the commissioning network: Continuous commissioning means that commissioning activities may be concurrent with observations over an extended period of time. Commissioning activities will involve three phases: 1. installation, configuration and onsite testing of the entity being commissioned, then 2. Integration and testing with the larger system, then 3. Full integrated operations. During the first phase, the entity is in principle isolated from the larger system, but in practice it may need services from the larger system, including power, weather and other environmental data, as well as possibly remote monitoring and management. This implies that commissioning activities need to be visible to the Operations and Maintenance Centre from an M&C perspective. It is desirable that the network traffic generated for this purpose not interfere with observations in progress, hence the commissioning network needs to be logically isolated from the rest of the communications network (i.e. use different fibres or a lower QoS level). This is accomplished by placing the entity in Commissioning mode, and all traffic to and from an entity in Commissioning mode goes over the logical commissioning network. In phase two, the entity is still not fully operational, but it needs to be integrated into the larger system and tested. The Testing operating mode is used for this purpose. Entities in testing mode may interact with other entities, provide services or data to them (e.g. power, cooling, weather data, science data) and generate traffic over the regular network (to maintain test fidelity with respect to communications). It is an operational decision whether the other entities affected by the testing are in full operational mode or also in Testing mode. This flexibility allows non-critical entities (e.g. a cooling system Component) to be integrated into the system without requiring downtime of surrounding entities. In phase three, the entity is placed in Integrated mode and can participate in observations and other regular operations.
Diagnosability and testability: The remote management requirement is that faults be diagnosable down to the LRU level. While this applies to hardware, the concept of LRU needs to be defined for software. The operational equivalent of replacement for software is restart, which typically resets the software back to a known good state and eliminates all transient faults. If the fault is not transient but a synchronous fault, the operational replacement involves offline repair and replacement i.e. bug fixing and patching. This is applied to software libraries and executable images, hence these are also LRUs from a diagnosis and repair viewpoint. The architectural principle is that entities, particularly system M&C software entities, must support self-diagnosis and self-test to the extent possible. They should include fault detection mechanisms, built-in self tests and diagnostic routines, so that faults do not propagate to the rest of the system.
Hierarchical backward compatibility: Upgrades to entities are performed by placing them in Offline mode, and typically assuming either local control or direct remote control of their functioning (i.e. maintenance engineers issue commands directly to the entity without going through M&C). For software, the standardised Local M&C interface requires all Components to support software update functionality so that
WP2-005.065.020-TD-002 Revision : 0.2
Page 60 of 69
upgrades are possible through remote management. In a large distributed system such as SKA, it may not be possible to simultaneously apply upgrades to the entire system. It is quite likely that some parts of the system may be operational with upgraded hardware and/or software while other parts are yet to be upgraded for various operational reasons. This creates a challenge of co-existence of multiple versions. This can be challenging along several dimensions, including potential interface incompatibility, data format incompatibility, functional differences (e.g. differences in fault detection and alarm handling by parent entities for different versions of child entities) and behavioural differences (e.g. different patterns of response from child entities to commands), any of which can lead to faults. These challenges can be addressed by the architectural principle of hierarchical backward compatibility. This principle consists of two guidelines: parent entities must be upgraded before child entities, and the upgraded parent entity must either support backward compatibility of child entity versions, or the child entity must be upgraded simultaneously with the parent entity. In other words, an upgraded parent entity must be capable of handling both older and newer versions of all their child entities, as relevant. In cases where it is not possible to support both versions (e.g. for hardware interface reasons), the child entity must be upgraded along with the parent entity. Design of parent nodes for backward compatibility is easier if child entities support forward (upward) compatibility i.e. they are capable of working with newer versions of interfaces or data. Typical upward compatibility features include incompatibility detection (e.g. ignoring or rejecting unrecognised commands) and ignoring additional fields in protocol messages / commands / data. It should be noted that while design of Components for upward compatibility is desirable, this can only be a guideline and not a requirement in the Standardised Component Interface (SCI), because it may not be satisfied by off-the-shelf Components.
Scalability: The component-based development of the architectural design shall be capable to grow in size i.e. scalable while maintaining its properties and qualities. Architecture design can have the distributed or roll-up approach to alleviate the performance degradation due to the scalability, as the solution which work at the local network may not give the same performance over the large intranet. This need can fulfill the requirement of maintainability and evolvability during the SKA1 implementation in stages/steps.
Self-Description: Each identified subdomain can be componentised for a modular replaceability by a model driven approach. If the solution is architected as a collection of self-describing components that plugs together, it forces a modular, highly extensible and agile design. The self-description (model-driven or specifications-driven) approach can be applied to any or all of the functional, behavioral and interface specifications. Using this approach the technology choice, interoperability, repairability (to correct the defects in minimal amount of time) and evolvability (to adapt to environmental changes) issues can be addressed.
WP2-005.065.020-TD-002 Revision : 0.2
Page 61 of 69
6 Realization
This section discusses various aspects related to the realization of the M&C architecture. This includes identification of the required hardware & infrastructure, software platforms, interface standardization, resource requirements, and development approach.
6.1 Deployment Overview
Figure 9 shows the deployment view of M&C realisation. Data is acquired by M&C nodes from sensors and actuators using field buses connected to data processing boards. These boards are typically on the same chassis as the processors that host Local M&C nodes (M&C systems associated with a receptor or other infrastructure Component). The connectivity between the Local M&C and Central M&C varies with the deployment context. If the Component is part of a region, there is a Regional M&C that monitors and controls all the Local M&C systems, with LAN connectivity between them. In the Core, from a deployment perspective, the Components are grouped into Regions for M&C purposes, and again there is likely to be LAN connectivity from the Components to Regional M&C. In addition to Components in the Core and at Regions, there may be also some remote outlying sensors. These sensors are relatively simple (weather sensor, video camera etc.) and may require hardly any control. They may typically not need a separate M&C node processor, but can instead directly send their data to a Regional M&C through the WAN, using probably a simplified version of the Standardised Component Interface whose implementation may be small enough to fit on the data acquisition board itself. Central M&C must also interface with Domain M&C systems for various domains (central network management, central power management etc). Since these are co-located at the Operations & Maintenance Centre, there may be LAN connectivity between the systems. Similarly, if there are Sub-Domain M&C systems at the regions, there may be LAN connectivity between them and Regional M&C. It should be noted that this deployment view does not cover the acquisition and handling of astronomical data. That is the responsibility of signal processing and the science data path. One of the fundamental architectural decisions on SKA is to completely separate the science data path from the M&C data path, with only parameter exchange at different levels of the system. The primary rationale for this architectural decision is to preserve the predictability and independence of the data handling along the science data path, since the volumes of data involved are huge and high predictability of data handling is critical to effective correlation. Since the volumes of data generated by the science data path are relatively constant and predictable, separating their handling preserves the predictability. In comparison, M&C data rates and timing needs vary across time based on the situation. Since M&C data and its timing behaviour are also critical to system functioning, it is equally desirable to not have this affected by the enormous data handling needs of the science data. This mutual independence is achieved by separating much of the computational infrastructure needed to support M&C from the science infrastructure at every level of the system: M&C uses separate fibres (on the same cable), separate processors and separate storage from the science data.
WP2-005.065.020-TD-002 Revision : 0.2
Page 62 of 69
Figure 9. Deployment view of M&C
6.2 Hardware and infrastructure
From the hardware and infrastructure perspective, M&C includes six types of entities: Sensors and actuators, field buses, data acquisition boards, local M&C nodes, regional M&C nodes and Central M&C nodes. The discussion below identifies the functionality of each entity type, required hardware, selection criteria for making technology choices, and the ownership of realization responsibilities.
6.2.1 Sensors and actuators
SKA will require a wide variety of sensors and actuator types e.g. RFI detectors, weather sensors, servo motors, front end electronics, opto-electronic devices, video cameras, sensors for parameters related to power, networking and computational infrastructure etc. Some of these sensors and actuators are hardware devices, while others may be soft sensors/actuators (e.g. CPU performance sensors, configuration parameter settings). Some of these sensors and actuators may be part of provider equipment e.g. power supplies. For hardware sensors and actuators whose choice and procurement is directly or indirectly (i.e. the choice is made by a vendor but in the context of the project) controlled by the project, it makes sense to standardise choices both for volume pricing and for minimizing spares inventory. Standardisation will also minimise the effort to integrate these sensors with the data acquisition system, particularly for remote equipment. Where necessary to accommodate variations in requirements, multiple sensors of a given type with varying characteristics may be selected (e.g. video camera resolution). Primary evaluation criteria for sensors and actuator choices include reliability, accuracy, cost, durability, power and space footprint, compatibility and ease of integration. Most sensors and actuators will be part of Components whose realization is managed by other domains e.g. receptors, power equipment, computing and communications equipment etc. M&C will need to interact with each domain to determine their needs before standardizing on sensor choices.
WP2-005.065.020-TD-002 Revision : 0.2
Page 63 of 69
For Components acquired off-the-shelf, the choices of sensor/actuator hardware, fieldbuses and data acquisition boards are outside the control of the program. This is acceptable, since in those cases, the LRU may be the Component itself, or for larger components, the LRU may be spare parts provided by the Component vendor.
6.2.2 Fieldbuses
Fieldbuses (e.g. USB, CANbus, PROFIbus, MODbus, EtherNet/IP etc) conform to IEC 61158, however this standard covers only the lower layer communication protocols. Currently there is work ongoing on developing a new generation of sensor network standards. While these standards are primarily aimed at facilitating wireless sensor networks, the standards are applicable to wired sensor networks as well. Conformance to these emerging standards will be advantageous to SKA from the viewpoint of long-term availability of drivers and range of sensor choices, even if wireless sensor networks are largely unusable in SKA because of RFI concerns, except perhaps within the central processing facilities. Standardisation of field bus technology throughout SKA is absolutely essential both for maintainability and simplification of integration. The maintainability issues go beyond spares inventory to engineering and troubleshooting expertise. Fieldbus choices also influence the choice of sensors and actuators. However, there is a possibility that different fieldbus choices may be appropriate for stations and for the Core. At stations, it is likely that the physical distance from sensors and actuators to Local M&C is of the order of a few metres, since every Component is likely to have associated Local M&C. However in the Core, it is unclear whether each receptor will have its own Local M&C, or Local M&C capability will be shared across multiple Components. If sharing is a possibility, then the distances involved may be longer, necessitating a different fieldbus choice. Similarly, if an entire Aperture Array consisting of thousands of dipoles has a single Local M&C, the physical distances to Local M&C may be longer. These considerations may necessitate widening the space of choices to two different fieldbuses, one suitable over shorter distances and one that can accommodate longer distances. Evaluation criteria for fieldbuses include reliability, data rate, maximum number of drops, maximum physical distance, cost, ease of integration, compatibility with multiple physical media, vendor independence and probable longevity of the technology. The last criterion is important because changing to a new fieldbus technology may be an extremely expensive undertaking. Fieldbus integration and deployment may be done by Component providers. A best practice lesson from ALMA is that the fieldbus protocol choice should be made collaboratively between the hardware, software and network teams.
6.2.3 Data Acquisition Boards
The data acquisition board acquires data from all the field devices and passes it on to the Local M&C. Standardisation of data acquisition boards is strongly desirable to minimise integration efforts and reduce spares inventory. A primary decision point for data acquisition boards is whether to design a custom board for SKA or utilise an off-the-shelf board. The advantage of a custom board is that it is possible to add functionality specific to SKA, if necessary. The volumes of SKA may be sufficient to make the design of a custom board economical. However, unless there are special needs, there are significant advantages to the use of an off-the-shelf board, including lower development, unit and lifecycle costs, higher reliability, possible availability of reusable device drivers, easier availability of spares and ease of upgrading as technology evolves. This is the current preferred option. Driving criteria in board design/selection include reliability, processing capacity, ease of integration, lifecycle costs, power consumption, vendor independence and availability of tools support for software development and integration.
6.2.4 Local M&C Nodes
Local M&C Nodes are responsible for monitoring and control of a Component, such as an Aperture Array, dish, power generation equipment, transformer, power distribution network, cooling equipment, beam former,
WP2-005.065.020-TD-002 Revision : 0.2
Page 64 of 69
Correlators etc. The number of monitoring points per Component may vary from a few dozens to thousands. Typically Local M&C may be implemented entirely in software (except possibly for some safety-critical functions) and hosted on a single processing unit. Local M&C has responsibility to monitor and manage its own operating infrastructure (processor, storage, state and health status of the software itself) in addition to the Component. Error! Reference source not found. shows a block diagram that illustrates a typical structure for Local M&C.
Figure 10. Typical Local M&C Block Structure
It is desirable to standardise the platform and broad overall structure of Local M&C software to maximise productivity and facilitate reuse of common infrastructure, though the content and particular functionality of the software may be specific to the Component. This may generally be possible for Components whose M&C software is directly or indirectly created by the project, but not for off-the-shelf Components that already include M&C software. Further, in some cases equipment providers might already have prototype designs that include M&C software, and the Component and its software may only be customised for SKA to a limited extent. Accordingly, M&C can require that all Components must support a Standardised Component Interface (this can be done for off-the-shelf Components by adding an interface adapter), and can strongly recommend but probably not enforce that Component providers use the standard M&C platform (used to implement Central M&C and Regional M&C). The uptake can be incentivised by providing extensive support for development of Local M&C if the standard platform is used. Candidate platform technologies are discussed in section 6.3. The possibility of generic configurable M&C software is discussed in section 6.6.
6.2.5 Regional M&C Nodes
Regional M&C Nodes control the operations of all the equipment in a region. Monitoring points (including data, alarms and events) from every unit must flow through Regional M&C. This means that each Regional M&C may have tens of thousands of monitoring points (about 50-100 Components per region, each with hundreds or thousands of monitoring points on average). Handling this capacity will require a bank of processors to handle Regional M&C. While monitoring will require large processing capacities, the demands of control are much smaller, since the number of commands to be processed will rarely exceed 5-10 per second, often much less. This makes it likely that control can be handled on a single processing unit, which is preferable in order to avoid complications with race conditions. It is desirable to have a backup processor available onto which control can be shifted in the case of software or hardware faults in the primary processor. One possible scheme is to have one of the monitoring processors themselves to serve as the backup control processor. This can be easily accomplished with distributed real-time
WP2-005.065.020-TD-002 Revision : 0.2
Page 65 of 69
database platforms, because the entire state is already present in the distributed database (its replication can be assured by having each monitoring processor maintain a copy of a portion of the control state). The only requirement is that the code for processing the state be readily available in storage for loading onto the selected processor in the event of a failure (warm backup strategy). In this manner, a bank of n+1 processors (i.e. one processor more than the minimum needed) can provide backup capabilities to quickly recover from any software or hardware failure without downtime. Regional M&C nodes have a low bandwidth backup communications link to Central M&C. This enables operators to ensure that the region has been properly shut down in the event of a communications failure or emergency event (e.g. floods, fire, earthquake). Every region will have a fail-safe design so that individual Components as well as entire regions shut down if they lose connectivity for more than a defined period of time. This is to prevent the possibility of further safety and equipment damage events caused by unhandled alarms, and anyway there is little point in continuing operation if science data connectivity is lost. Regions will also require power backup capabilities for a limited period so that they can safely shut themselves down in the event of an extended power outage. The actual sizing of the infrastructure requirements (network bandwidth, computational capacity) will require estimation of the total number of monitoring points in a region. This will be possible once the design of each domain is sufficiently advanced for them to identify the data processing capabilities needed in each Component. It is possible to reduce the number of monitoring points in a region to a few thousand by only obtaining high-level parameters from each Component. It is desirable that regions include storage capability to archive all the monitoring data at least for a few weeks. This is particularly important if not all the data is being passed on to Central M&C, since engineers will need this data for troubleshooting. Additional processors and storage will be needed to support this archiving and associated retrieval capability. Realisation responsibilities for Regional M&C and Central M&C rest with the M&C domain team.
6.2.6 Central M&C Nodes
Central M&C gathers monitoring data from the entire system and makes it available to operators, engineers, scientists and other users. It also takes commands from operators and distributes control signals to the entire system. If all monitoring points from the entire system are channelled to Central M&C, then it would have a few hundred thousand monitoring points for SKA1 and several million monitoring points for SKA2. The alternative is for Central M&C to receive only higher-level abstract summaries of health and status from each region, potentially reducing the number of monitoring points to tens of thousands for SKA2. The tradeoffs among these approaches are discussed in [26]. In addition to monitoring and processing operator/engineer commands, Central M&C also has responsibilities for integration with all the other SKA systems, as described in [28]. Central M&C may also require a bank of processors to handle this load. As with Regional M&C, the rate of control commands is likely to be low enough so that a single processor can handle the control functionality. However, it is strongly desirable that this control processor have a full redundant hot backup, so that there is no system-wide downtime if there are software or hardware faults in the control handling. Since Central M&C will reside in the Operations & Maintenance Centre, it will also have significant power and communications backup. The software platform for Central M&C may be the same as for Regional M&C. They may differ only in configuration, with a different set of monitoring points, control commands, command handling, alarm handling etc. The possibility of configurable generic control software is discussed in section 6.6. The processors that handle integrations with other systems (as well as support the interfaces to operator consoles) need not employ the same software platform, instead they could run an alternative platform that can simplify integration. This reflects the differences in usage patterns: the monitoring and control processors must process streams of real-time data efficiently, while the integration processors must be able to invoke services and provide services to other systems.
WP2-005.065.020-TD-002 Revision : 0.2
Page 66 of 69
Central M&C must have extensive storage to archive the engineering data for a long time, perhaps years. If there is a need to reduce storage costs, it is possible to purge parts of the data by increasing the sampling intervals for older data. This creates a trade-off between storage costs and the availability of historical data for troubleshooting. Moreover, if the drilldown of the metadata in the science data store directly refers to the engineering data archives, then there is a stronger need to retain the engineering data over a long period of time to facilitate science interpretation. The deployment view of Central M&C also includes the operator and engineering consoles. These are workstations that primarily run user interface software (and probably collaboration platforms to facilitate teamwork), that displays the monitoring data (including events and alarms) based on subscriptions to the processed monitoring points in Central M&C. This scheme minimises the processing load on the Central M&C processors to support the operator consoles.
6.3 Software Platforms
There are two classes of software technologies that could potentially serve as platforms for the implementation of M&C functionality: object-oriented languages and distributed real-time databases. They are not precisely mutually exclusive, since it is possible to implement functionality in object-oriented languages utilising a distributed real-time database. Hence the actual choice is between the data-oriented (and event-driven) computing paradigm and object-oriented procedural programming. Some of the precursor M&C systems have been implemented using distributed real-time databases, including LOFAR (PVSS II) and ASKAP (EPICS), while MeerKAT (C++ and Python) and ALMA (C++, Java, CORBA) use the object-oriented approach. The distributed real-time database technologies have been designed precisely for this purpose (implementation of large M&C solutions), and provide several advantages: transparent distributed computing, ability to process large data volumes at high data rates, high reliability, less development effort. Object-oriented languages such as Java and C++ have the advantages of a large user base, flexible programming capabilities, developer familiarity and ease of integration with other systems and software packages. Given that the databases can be interfaced with object-oriented languages to take advantage of those strengths, distributed real-time databases are currently the preferred software platform for SKA M&C, probably with object-oriented technologies being used to implement higher-level and interaction functionality, though the alternatives have not been ruled out. There are several SCADA vendors who provide distributed real-time database solutions. Of the various possibilities, the most popular choices for large scientific control software include Siemens-ETM PVSS, EPICS, DDS and LabView. PVSS is a commercial product that has been used successfully in multiple radio astronomy projects. It can be used in conjunction with C++. EPICS is an open source framework with several associated tools to address functionality such as alarm handling, logging, archiving etc. It can also be interfaced with either Java or C++. LabView from National Instruments is based on the concept of Virtual Instruments and has been used successfully in conjunction with CORBA to support distribution. DDS is an increasingly popular OMG standard supported by multiple vendors. Extensive information on DDS and vendor support is provided in [60], including a comparison with other SCADA systems. Evaluation criteria for the technology selection include reliability (lack of bugs), performance (ability to handle large data volumes), development effort, development support tools, cost, vendor independence and track record of usage (experience reports). There is an excellent review and summary of SCADA systems in [58], including a section on SCADA security and vulnerabilities and recommendations on developing a SCADA security strategy.
6.3.1 Software Platform Architecture
The scale of SKA in terms of the number of monitoring points is larger than that of previous radio astronomy projects that have used the above software platforms. This section discusses the architectural implications of scale.
WP2-005.065.020-TD-002 Revision : 0.2
Page 67 of 69
The publish-subscribe paradigm used in distributed real-time databases requires locating the source of a data item before subscribing to it. The algorithms used to locate data items may or may not be able to scale up to millions of monitoring points without significantly degrading performance. Extensive investigation and experimentation will be needed to establish whether in fact a particular technology is capable of scaling up to that extent. In the meantime, mitigating this risk requires the availability of architectural alternatives to deal with potential capacity limitations. The issue is one of whether it is feasible to have a single namespace of monitoring points throughout the system, going down to Component level or even Part level. If every monitoring point in every SKA Component belongs to the same namespace, then potentially the namespace could contain over a million monitoring points. The advantage of a single namespace is that any entity in the system (including operator and engineer interfaces, as well as any Component in any region) can access information about any Component anywhere in the system. This is very convenient for supporting drillable abstractions, so that operators engineers can transparently request any information item without having any barriers to obtaining the information. However, if such a large namespace creates performance problems, then the solution is to partition the namespace, by localising the data within each region. The monitoring points in each region can be constitutes as a separate distributed real-time database or even partitioned into multiple databases. In order to subscribe to monitoring points within another database, it will be necessary to create a mirror monitoring point within the local database, and use a broker to establish a link between this monitoring point and the monitoring point in the target database. This brokering scheme will also be necessary between Central M&C and each region, since they will have to be separate namespaces. This scheme will require a little effort from programmers (to specify the link between the monitoring points) and considerable deployment effort. Some additional effort will be needed to support drillability. While the need for access to data in a different region is determined at design time, the need for drill-down access to intra-Component data arises dynamically during troubleshooting. Supporting this requires the dynamic creation of monitoring points and linking them to target monitoring points through brokers. The evaluation criteria must include whether this capability is supported. A side-effect of this architectural workaround is that it forces data localization from the monitoring and storage perspective: the option of sending all monitoring points to Central M&C becomes more difficult to support (it can be done, by placing one Central M&C processor in each region's namespace). Thus it is linked to the other major architectural decision, of whether all data should be transferred to Central M&C. The advantages of transferring all monitoring points are that Central M&C has a full picture of the entire system, and that all engineering data can be stored securely in the Operations & Maintenance building. However, there are considerable disadvantages that offset this advantage. Transferring all monitoring points creates significant extra communication overhead, and more importantly, huge processing costs at Central M&C. Even without this, Central M&C and operators/engineers have full access to any monitoring point in the entire system, by drilling down and subscribing directly to the information source at the region level. They also have access to historical monitoring data by accessing the engineering data archives at the region. For these reasons, the current recommended approach is that only high-level summary data (including possibly status and health summaries for each Component, but not the detailed monitoring information about each Component) should be transferred to Central M&C.
6.4 Standardised Component Interface
SKA2 may have several thousand Components. Each of these Components would be sourced from different providers, and their realisation would be managed by different domains. M&C needs to interface with all these components in a homogenous way, including getting a common abstract view of their health and status.
WP2-005.065.020-TD-002 Revision : 0.2
Page 68 of 69
This may be accomplished by the definition of a Standardised Component Interface to which all Components must conform. This interface may include
A collection of standard concepts, such as Data Item, Alarm, Event, Command, Configuration Parameter etc. Each Component defines its particular interface by instantiating these concepts with specific values. There may be predefined commands for common operations such as power on/off, mode transitions, reset etc.
Common abstractions, including Operating Mode (provisionally Integrated, Commissioning, Testing, Offline) and Status (provisionally OFF, READY, INUSE, FAULTY, MAINTENANCE). Each Component may be required to support these operating modes and report its abstracted Status and Operating Mode in these terms, possibly in addition to making its actual internal status available as another monitoring point.
Requirements to support specific features, such as remote software upgrades, reset functionality, time synchronisation, remote console displays for engineers, fail-safe features, authentication/authorisation, maintain audit trails etc. These requirements arise from needs for conformance to the overall M&C architecture, and identification of the specific requirements may be part of M&C architecture and design.
Requirements to adopt standardised technologies, including fieldbus, sensors and actuators, data acquisition boards, standard computing infrastructure (processors, storage devices), hardware ports etc. These requirements may be waived for off-the-shelf components.
In addition to these requirements, there may also be guidelines for Local M&C design, including software platform recommendations, development practices, suggested tools etc. While these may not be binding on Component providers, they may be strongly encouraged to conform to the guidelines.
6.5 Resource Requirements
M&C consumes services from Signal Transport, Software & Computing as well as Power & Cooling to obtain the infrastructure and resources needed for its operations. This section briefly summarises the needs. Operational interfaces with these domains is discussed in [28]. Signal Transport:
LAN connectivity within each region, as well as within the Core. Bandwidth needed may vary with the Component involved based on its monitoring points, but may generally be of the order of 10 Mbps or less per Component.
WAN connectivity between regions and the O&M Centre. Bandwidth is TBD, probably of the order of 1 Gbps or less (based on around 10,000 monitoring points). It should be noted that this bandwidth estimate does not include multimedia surveillance equipment such as video cameras.
Backup low bandwidth WAN connectivity between regions and Central M&C to verify safe shutdown.
Support for interfacing sensing equipment at outlying locations. There may be a need for weather sensors, power parameters monitoring and perhaps video cameras at locations other than region sites (e.g. along the network cable trench or power lines).
Power:
Power for all the M&C computing and sensing infrastructure.
Backup power for regions to facilitate shutdown in the event of outage. Software and Computing:
Processing units at each region and at Central M&C. Exact capacity is TBD (based on the number of monitoring points), but probably ~10 servers (assuming each server is capable of processing about 1000-10000 monitoring points) at each region and ~20 servers at Central M&C (excluding operator and engineer workstations). This assumes that much of the monitoring data will be localised to each region.
Storage units at each region and at Central M&C. The units at each region must be large enough to hold at least several weeks of monitoring data (~100TB), while the Central M&C needs to hold years of monitoring data (at least tens of PbB depending on data reduction). One possibility to reduce storage requirements is to
WP2-005.065.020-TD-002 Revision : 0.2
Page 69 of 69
reduce sampling rates for archival – this is a tradeoff between storage costs and efficacy of troubleshooting / metadata drilldown).
6.6 Development Approach
A major challenge in the development of SKA M&C software is that the software may be developed by geographically distributed teams that are not even under common management, since they may belong to different work packages. While the Central M&C and Regional M&C software may be developed by the M&C team, Local M&C may be developed by provider organisations and be a part of different work packages. Domain M&C solutions may be acquired off-the-shelf or developed by the corresponding domain teams. M&C applications may be built by the Software & Computing domain. This widely distributed scope of development responsibilities creates a major integration challenge. The Software & Computing Domain serves a governance layer for all software development in SKA, and is identifying the development processes, practices and methodologies needed to address all of these challenges. M&C shall adopt these guidelines. This section identifies some additional technical approaches that can be used to reduce development effort and improve the likelihood of smooth integration:
Reuse: The M&C team is capturing pointers to potential opportunities for reuse, either at the knowledge or software level in an Asset Catalogue.
Development guidance: M&C needs to create guidance for Local M&C developers, in addition to the Standardised Component Interface. This would cover topics such as effective usage of platform features, design for security and safety, recommendations on choice of monitoring points, design of test suites etc. The objective is to bring uniformity and some baseline quality to the development process. If the number of Component types is relatively manageable (~20 or so), then it may be feasible to directly interface with each Local M&C and Domain M&C development team to ensure baseline quality.
Test harness: Unit testing of Local M&C should include checking its integration with Regional M&C. This can be facilitated by providing them a prototype Regional M&C to serve as a test harness. This will also ensure that initial prototypes of the Regional M&C software will get hardened through repeated use even before integration testing. M&C can also create a certification test suite for Local M&C developers to ensure that they have achieved their reliability target.
Generic M&C Software: Model-driven development technology can be used to create a generic M&C software platform that can be configured to control any target system. This technology has been developed on the ITER project and demonstrated by application to GMRT [25]. The advantage of this approach is that Central M&C, Regional M&C and Local M&C can all run the same software, with different specifications that provide the particular control logic, data acquisition and processing, alarm handling etc. This reduces the development effort to writing specifications (which are still quite complex and require tools support to avoid errors) and improves maintainability and agility (ease of adaptation to modified requirements).
7 Acknowledgements
Many of the design concepts in this document have been borrowed from precursor projects as well as other large scientific and industrial control systems. An attempt has been made to acknowledge sources, but in many cases these are proximate sources: immediate sources where we encountered an idea, though it may have originated elsewhere. Many of the architectural principles and concepts have been borrowed from the ITER project. Given that it was architected recently and has even higher complexity along many dimensions (though smaller geographic scale), it has been utilised as a powerful source of state-of-the-art architectural thinking, in addition to the precursor projects. Text and diagrams have also been borrowed freely from other SKA material.