www.gns.cri.nz Discuss whether or not you can tell how someone is feeling on the inside, by observing the outside. Pretend you are really angry. How can other people tell? You might go red in the face, feel like your pulse is racing, ‘huff and puff’ (heavy breathing or sighing), tremble, move around rapidly or go completely rigid and hold your breath. Some people feel as though their whole body is puffing up! Volcanoes do similar things when they are getting ready to erupt. When people begin to ‘erupt’ the results are not predictable, some may yell and scream loudly, some will cry quietly, others will lash out with hands and feet and many will bottle things up ready for a bigger ‘eruption’ at a later time. Volcanoes behave in equally unpredictable ways! If magma, or gases from magma, were moving inside a volcano how could you tell from the surface of the volcano? Brainstorm what you might see, hear, feel or smell before an eruption. Feel – small earthquakes as magma rises and breaks apart surrounding rocks See - as the magma moves up towards a vent the ground surface may swell. - changes in crater lake colour, height and temperature (Ruapehu) or fumerole activity (White Island) Smell – gases released from the rising magma through fumaroles or into crater lakes may vary in smell and temperature as the mixture and amount of gas changes. Scientists use three methods to try and find out what is happening inside a volcano. Each of the methods below is accompanied by an activity to show what scientists are looking for. A combination of these signs can help predict volcano behaviour. However volcanoes do not always behave as expected and there is no way of being certain of the time, duration or size of an eruption. 1. Seismic (earthquake) Activity Using the information on the worksheet, answer the questions by interpreting what the seismogram is showing 2. Earth Deformation Partially inflate a balloon, draw a few x marks in a random pattern around the • balloon. Fully inflate the balloon and observe what happens to the relative position and size • of the marks. They will be further apart and the marks will be stretched. Permanent survey marks and GPS instruments are used to measure this inflation (or deflation) on active volcanoes. You could also note what happens to the thickness of the balloon as it is expanded • and relate this to stretching and possible breaking of the ground surface. Stand a ruler against the side of the partially inflated balloon and look at the angle • it leans on. Check again when the balloon is fully inflated, the angle will change. This change in slope angle is also measured on our active volcanoes. 3. Gas Emissions All students will be familiar with burping and will be able to relate it to gases produced by digestion. This can be compared to the upward movement of gas as it escapes from magma. Another example of moving gases would be perfume spreading through the air as it is warmed and evaporated by bodyheat. Learning Intentions • Recognise that external signs can indicate internal events • Identify the signs that scientists are looking for when monitoring volcanoes and relate them to what is happening inside the volcano. Success Criteria Students can • Explain why scientists monitor volcanoes. • Name the three man types of volcano monitoring, what they are measuring and the equipment involved. Resources Seismometer activity sheet • Balloons • Rulers • Lesson Plan 11 Monitoring Volcanoes How and why are volcanoes monitored? Vocabulary seismogram, seismometer, deformation, inflate, predict, magnitude, emission, slope, duration, swell
Transcript
www.gns.cri.nz
Discuss whether or not you can tell how someone is feeling on the inside, by observing the outside.
Pretend you are really angry.
How can other people tell? You might go red in the face, feel like your pulse is racing, ‘huff and puff’ (heavy breathing or sighing), tremble, move around rapidly or go completely rigid and hold your breath. Some people feel as though their whole body is puffing up!Volcanoes do similar things when they are getting ready to erupt.When people begin to ‘erupt’ the results are not predictable, some may yell and scream loudly, some will cry quietly, others will lash out with hands and feet and many will bottle things up ready for a bigger ‘eruption’ at a later time.Volcanoes behave in equally unpredictable ways!
If magma, or gases from magma, were moving inside a volcano how could you tell from the surface of the volcano?
Brainstorm what you might see, hear, feel or smell before an eruption.
Feel – small earthquakes as magma rises and breaks apart surrounding rocksSee - as the magma moves up towards a vent the ground surface may swell. - changes in crater lake colour, height and temperature (Ruapehu) or fumerole activity (White Island)Smell – gases released from the rising magma through fumaroles or into crater lakes may vary in smell and temperature as the mixture and amount of gas changes.
Scientists use three methods to try and find out what is happening inside a volcano. Each of the methods below is accompanied by an activity to show what scientists are looking for. A combination of these signs can help predict volcano behaviour. However volcanoes do not always behave as expected and there is no way of being certain of the time, duration or size of an eruption.
1. Seismic (earthquake) ActivityUsing the information on the worksheet, answer the questions by interpreting what the seismogram is showing
2. Earth Deformation
Partially inflate a balloon, draw a few x marks in a random pattern around the •balloon.
Fully inflate the balloon and observe what happens to the relative position and size •of the marks. They will be further apart and the marks will be stretched. Permanent survey marks and GPS instruments are used to measure this inflation (or deflation) on active volcanoes.
You could also note what happens to the thickness of the balloon as it is expanded •and relate this to stretching and possible breaking of the ground surface.
Stand a ruler against the side of the partially inflated balloon and look at the angle •it leans on. Check again when the balloon is fully inflated, the angle will change. This change in slope angle is also measured on our active volcanoes.
3. Gas EmissionsAll students will be familiar with burping and will be able to relate it to gases produced by digestion. This can be compared to the upward movement of gas as it escapes from magma. Another example of moving gases would be perfume spreading through the air as it is warmed and evaporated by bodyheat.
NewZealandishighlyvulnerabletovolcaniceruptions.The1995/96Ruapehueruptions were small and nobody was harmed due to the early warning and disaster management systems that were activated. However there were significant economic losses and disruptions to daily life for those in affected areas.
The1997Ruapehulaharwasaneventthathadbeenpredictedandplannedfor,over a number of years, by a variety of agencies. Scientists were able to monitor the rise in the water level of the crater lake and predict to within weeks when the tephra dam holding back the water would collapse. Years before the event a stopbank (bund) had been created to prevent lahars overflowing the banks of the predicted channel(theWhangaehuRiver)andenteringtheTongariroRiver.Whenithappenedthe lahar behaved as predicted and all the automated, emergency warning systems activated successfully. The event was spectacular but not dangerous as coordinated emergency management systems kept people away from hazardous areas.
Unfortunately this level of predictability for volcanic events is rare. Although eruptions often show clear warning signals, or precursors, the exact time and style of a volcanic eruption is impossible to predict. Successive eruptions from the same volcano may not be similar in any way, even the type of magma involved may differ. The strength of the warning signs is not always related to the size and timing of an eruption. Despite increasingly sophisticated monitoring, eruption prediction will probably always be an inexact science. The volcanologist’s task is to realistically assess and communicate the level of risk to the public and agencies involved in disaster education, preparation and management.
Volcanoes are monitored in an effort to forecast eruptions and there are three main types of activity that are investigated.
Seismic activity- seismometers are used to measure earthquakes which can be caused by rocks breaking or by magma and gas causing vibrations as it moves up the ‘pipe’ towards the vent.
Ground deformation – as magma rises and pressure builds inside a volcano, the ground surface may bulge outwards. This can be measured by sensitive instruments that measure changes in the tilt and height of the ground surface. Satellites and webcam images are also used to track changes to the ground surface.
Gas emmissions – analysing the gases produced by a volcano gives scientists clues about the composition of the magma and how close it is to the surface. These factors give some indication of potential explosiveness.
In2001GNSScience,withfundingfromtheEarthquakeCommission,establishedtheGeonetProject.TheaimoftheprojectistogiveNZaworldclass,multi-hazardmonitoring and surveillance system. Satellite telemetry combined with a larger number of recording stations has enabled faster and more accurate pinpointing of thesize,causeandlocationofearthquakes.Around14,000eventsareanalyzedeachyearandinformationonthe200orsosignificantfeltearthquakesisavailabletothepublicthroughtheGeonetwebsiteinaround20minutes.SeismicnetworkshavebeenestablishedforallNZ’sactivevolcanoesandanyearthquakenearavolcanoislookedatintermsofit’spossibleconnectiontovolcanism.MostRuapehueruptions have been preceded by an increase in the size and frequency of volcanic earthquakes. This may happen days or minutes before an eruption but is usually possibletogivewarningsofimminentdanger.Itishopedthatthemoreexplosivecaldera volcanoes will give longer warning periods. The most worrying scenario would be earthquakes that got shallower over weeks or months as magma rose towards the surface.
Curriculum Links
Planet Earth and Beyond
Physical World
Science Concept
NOS
PE-Earth SystemsL3/4 –develop an understanding of what makes up our planetPW-Physics ConceptsL3/4 -explore physical phenomena such as movement, forces, sound and waves
Communicating in Science
Investigating in Science
Understanding about Science
Social ScienceL4-understand that events have causes and effectsMathematicsL4-Measurement-interpret and use scales and charts
TeacherNotes11
Monitoring VolcanoesHow and why are volcanoes monitored?
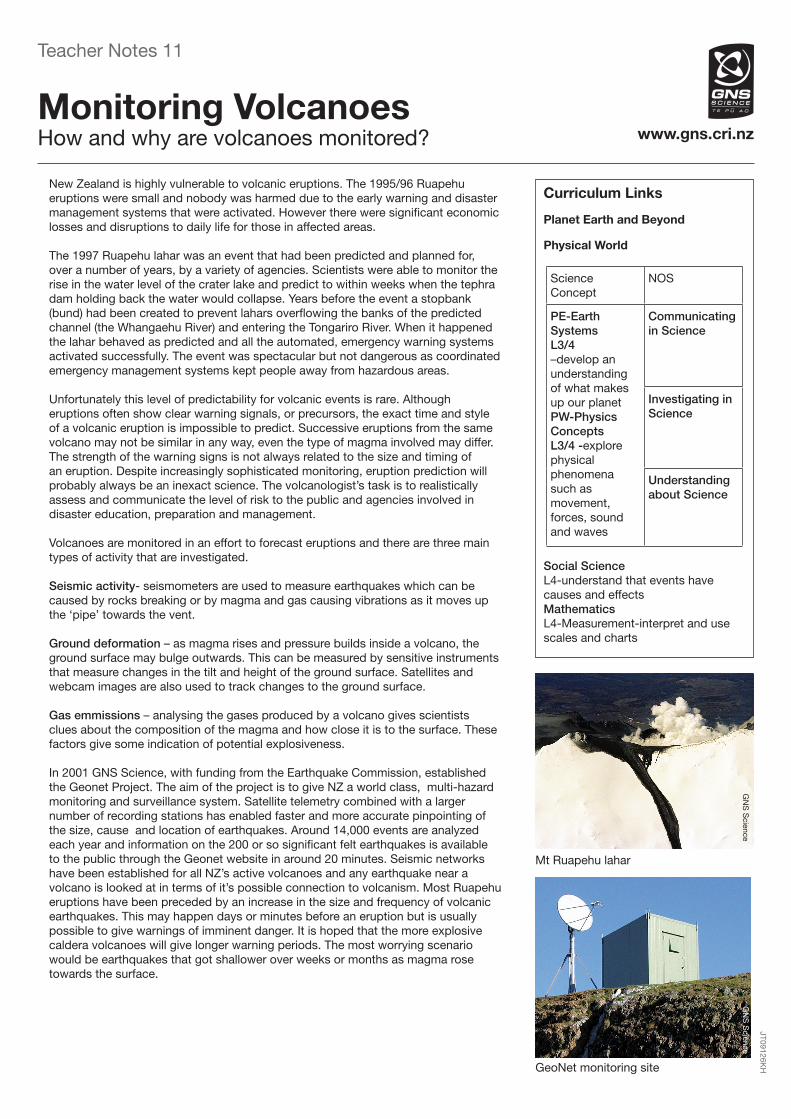
MtRuapehulahar
GeoNetmonitoringsite
GNSScience
GNSScience
www.gns.cri.nz
FAQs and links for further inquiry 11
Monitoring VolcanoesHow and why are volcanoes monitored?
Can eruptions be stopped?Natureismuchmorepowerfulthanmananderuptionscannotbe prevented, or stopped. However there have been cases of lava flows being slowed ordivertedawayfromsettledareas.ThishappenedinIcelandin1973.LavaflowsfromtheeruptionofEldfellVolcanoon the island of Heimaey destroyed part of the town of Vestmannaeyjar. The advancing lava threatened to destroy more of the town and block access to the only fishing port. Seawater was sprayed on the lava to cool it and divert it away from the town.
See:http://www.youtube.com/watch?v=1lIMpk5-2Oc
How do seismometers work?A seismometer is attached to the ground. When the ground movestheseismometermoves.Insidetheseismometerthereis a suspended weight which hangs freely and does not move withtheground.Itremainsstillduetoinertiawhilethecasearound it moves with the ground motion. The seismogram records how far the seismometer has moved compared with the stationary weight. Most modern seismometers work electromagnetically. A large magnet is used for the mass and the outside case contains numerous windings of fine wire. Movements of the case relative to the magnet generate small electric signals in the wire coil. These signals are then amplified electronically and stored digitally on a computer.
Why are there microphones on our active volcanoes?When an eruption occurs the microphone records the noise. Itisnotalwayspossibletoseeaneruptionbecauseitmaybedarkorweatherconditionsmayhidethevolcano.Itisdifficultto be sure from seismometers that an eruption has occured so a microphone can be used to confirm that there has been an explosion. Seismic waves (through the ground) travel about eight times faster than sound waves (through the air) so a seismometer will show the eruption earthquakes before the microphone records the noise.
What are volcanic earthquakes?When magma moves under a volcano, the stresses on the solid rock around the magma change. This stress is released by rock movement which is felt as an earthquake. Although these volcanic earthquakes are localised the jolts may shake houses, rattle windows and unsettle people near the volcano. The magma could be stressing the surrounding rock by moving into or out of the area so these earthquakes (called volcanic-tectonic earthquakes) are not always a sign that an eruption is likely. The rock movement can also result in landslides and ground cracking because rock may move to fill in areas where magma has retreated.
What is volcanic tremor?As magma (or gas rising from the magma) moves, it causes pressure changes in the surrounding rock which results in very small earthquakes called volcanic tremor. These feel like small, continuous, ground vibrations and may last for minutes or days. The vibrations are measured by seismometers but have a different frequency (wave pattern) to volcanic-tectonic earthquakes.Increasingvolcanictremorusuallyindicatesmagma is on the move and an eruption is likely. However somevolcanoessuchasRuapehuaredifficulttopredictbecause they have a background level of volcanic tremor most of the time. Despite increasingly sophisticated seismometer analysis techniques it is difficult for volcanologists to separate significant tremor events from normal background levels and other factors such as wind or traffic vibrations.When a volcano is erupting both volcanic tremor and volcanic tectonic earthquakes are likely to be at their largest.
ForthecurrentstateofNewZealand’svolcanoes,howtheyare monitored, the latest webcam pictures and seismograms see:http://www.geonet.org.nz/volcano/activity/index.html
Forfurtherinformationaboutthe2007Ruapehulahar(including links to video clips) see:http://csl.doc.govt.nz/about-doc/news/issues/mount-ruapehu-crater-lake/
www.gns.cri.nz
Activity sheet 11
Monitoring VolcanoesHow and why are volcanoes monitored?
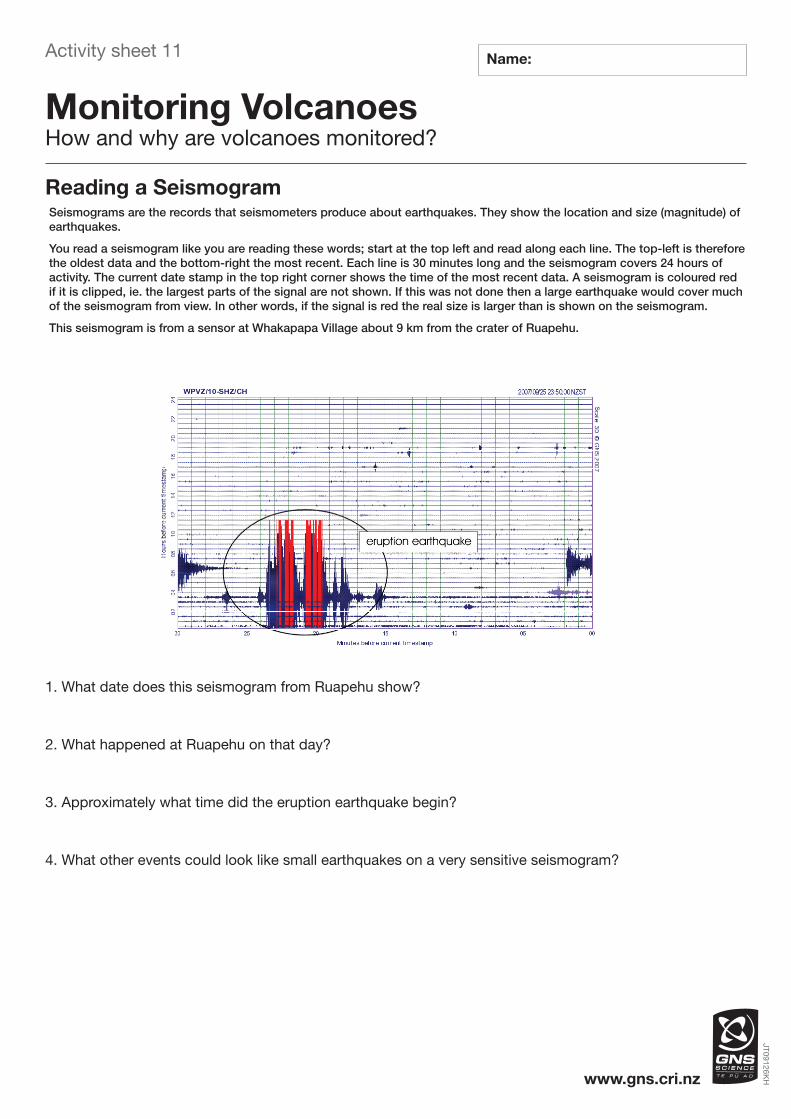
Reading a Seismogram Seismograms are the records that seismometers produce about earthquakes. They show the location and size (magnitude) of earthquakes.
You read a seismogram like you are reading these words; start at the top left and read along each line. The top-left is therefore the oldest data and the bottom-right the most recent. Each line is 30 minutes long and the seismogram covers 24 hours of activity. The current date stamp in the top right corner shows the time of the most recent data. A seismogram is coloured red if it is clipped, ie. the largest parts of the signal are not shown. If this was not done then a large earthquake would cover much of the seismogram from view. In other words, if the signal is red the real size is larger than is shown on the seismogram.
This seismogram is from a sensor at Whakapapa Village about 9 km from the crater of Ruapehu.