80
MONTGOMERY COUNTY RENTAL HOUSING STUDY NEIGHBORHOOD ASSESSMENT June 2016

MONTGOMERY COUNTY RENTAL HOUSING STUDY
NEIGHBORHOOD ASSESSMENT
June 2016

AGENDA
Model Neighborhood Presentation
Neighborhood Discussion
Timeline Discussion
Next Steps
2

WORK COMPLETED
Socioeconomic Analysis
Rental Housing Supply Analysis
Rental Housing Demand Analysis
Affordability Analysis
Model Neighborhood Assessment
3

TABLE OF CONTENTS
Introduction
Goal of Assessment
Data Utilized
Glossary of Terms
Existing Conditions
Methodology and Approach
Results of Assessment
Next Steps
4

• Understand factors influencing preservation or
development of affordable rental housing at
neighborhood level
• Identify needs and opportunities for preservation of or
introduction of new affordable rental units
• Set foundation for development of policy
recommendations that support addressing needs and
opportunities for preservation and/or introduction of
new affordable rental units
GOAL OF NEIGHBORHOOD ASSESSMENT
5
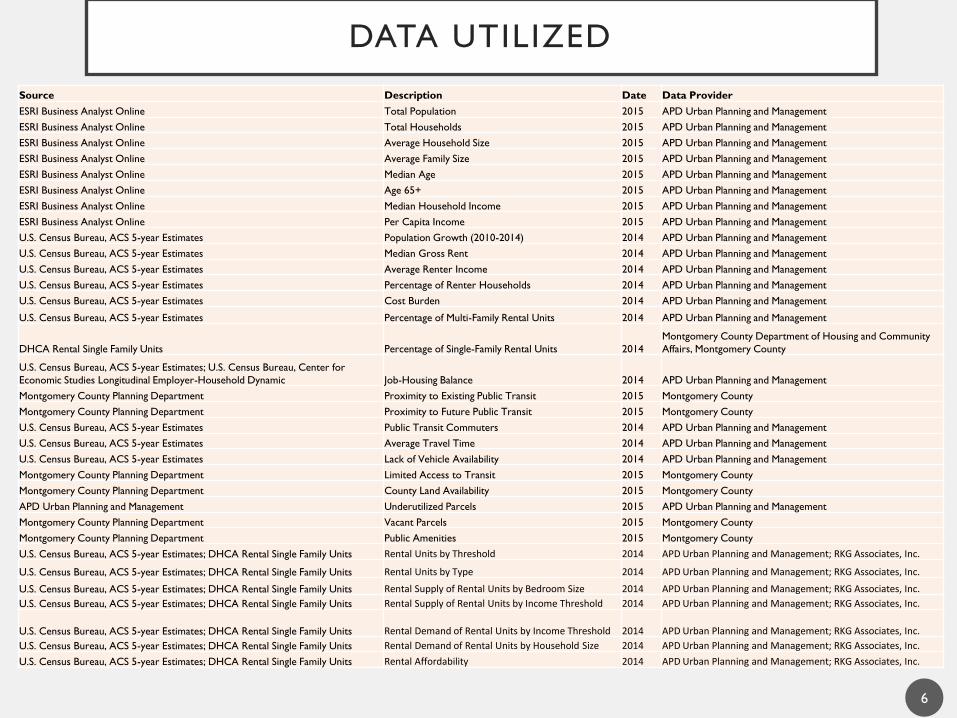
DATA UTILIZED
6
Source Description Date Data Provider
ESRI Business Analyst Online Total Population 2015 APD Urban Planning and Management
ESRI Business Analyst Online Total Households 2015 APD Urban Planning and Management
ESRI Business Analyst Online Average Household Size 2015 APD Urban Planning and Management
ESRI Business Analyst Online Average Family Size 2015 APD Urban Planning and Management
ESRI Business Analyst Online Median Age 2015 APD Urban Planning and Management
ESRI Business Analyst Online Age 65+ 2015 APD Urban Planning and Management
ESRI Business Analyst Online Median Household Income 2015 APD Urban Planning and Management
ESRI Business Analyst Online Per Capita Income 2015 APD Urban Planning and Management
U.S. Census Bureau, ACS 5-year Estimates Population Growth (2010-2014) 2014 APD Urban Planning and Management
U.S. Census Bureau, ACS 5-year Estimates Median Gross Rent 2014 APD Urban Planning and Management
U.S. Census Bureau, ACS 5-year Estimates Average Renter Income 2014 APD Urban Planning and Management
U.S. Census Bureau, ACS 5-year Estimates Percentage of Renter Households 2014 APD Urban Planning and Management
U.S. Census Bureau, ACS 5-year Estimates Cost Burden 2014 APD Urban Planning and Management
U.S. Census Bureau, ACS 5-year Estimates Percentage of Multi-Family Rental Units 2014 APD Urban Planning and Management
DHCA Rental Single Family Units Percentage of Single-Family Rental Units 2014
Montgomery County Department of Housing and Community
Affairs, Montgomery County
U.S. Census Bureau, ACS 5-year Estimates; U.S. Census Bureau, Center for
Economic Studies Longitudinal Employer-Household Dynamic Job-Housing Balance 2014 APD Urban Planning and Management
Montgomery County Planning Department Proximity to Existing Public Transit 2015 Montgomery County
Montgomery County Planning Department Proximity to Future Public Transit 2015 Montgomery County
U.S. Census Bureau, ACS 5-year Estimates Public Transit Commuters 2014 APD Urban Planning and Management
U.S. Census Bureau, ACS 5-year Estimates Average Travel Time 2014 APD Urban Planning and Management
U.S. Census Bureau, ACS 5-year Estimates Lack of Vehicle Availability 2014 APD Urban Planning and Management
Montgomery County Planning Department Limited Access to Transit 2015 Montgomery County
Montgomery County Planning Department County Land Availability 2015 Montgomery County
APD Urban Planning and Management Underutilized Parcels 2015 APD Urban Planning and Management
Montgomery County Planning Department Vacant Parcels 2015 Montgomery County
Montgomery County Planning Department Public Amenities 2015 Montgomery County
U.S. Census Bureau, ACS 5-year Estimates; DHCA Rental Single Family Units Rental Units by Threshold 2014 APD Urban Planning and Management; RKG Associates, Inc.
U.S. Census Bureau, ACS 5-year Estimates; DHCA Rental Single Family Units Rental Units by Type 2014 APD Urban Planning and Management; RKG Associates, Inc.
U.S. Census Bureau, ACS 5-year Estimates; DHCA Rental Single Family Units Rental Supply of Rental Units by Bedroom Size 2014 APD Urban Planning and Management; RKG Associates, Inc.
U.S. Census Bureau, ACS 5-year Estimates; DHCA Rental Single Family Units Rental Supply of Rental Units by Income Threshold 2014 APD Urban Planning and Management; RKG Associates, Inc.
U.S. Census Bureau, ACS 5-year Estimates; DHCA Rental Single Family Units Rental Demand of Rental Units by Income Threshold 2014 APD Urban Planning and Management; RKG Associates, Inc.
U.S. Census Bureau, ACS 5-year Estimates; DHCA Rental Single Family Units Rental Demand of Rental Units by Household Size 2014 APD Urban Planning and Management; RKG Associates, Inc.
U.S. Census Bureau, ACS 5-year Estimates; DHCA Rental Single Family Units Rental Affordability 2014 APD Urban Planning and Management; RKG Associates, Inc.

Affordability The relationship between a household’s ability
to pay for housing and the cost of housing; also called
‘price appropriateness’.
Character Area Typology Defined geography displaying unique characteristics that
lend towards preservation of existing affordable rental
units or development of new affordable rental units.
Cost Burdened Relationship between household income and
percent of that income being spent on housing – HUD
defines cost burdened as spending more than 30% of gross
income.
Neighborhood Geographically defined area with distinctive characteristics
GLOSSARY OF TERMS
7

METHODOLOGY AND APPROACH
8

• Define – Define four Character Area
Typologies that represent unique rental
housing markets in Montgomery County
• Identify – Identify criteria (influences) that
make up a Character Area Typology
• Select – Select model neighborhoods that best
characterize the four Typologies
• Analyze – Analyze data for representative
neighborhood selected
Define
Identify
Select
Analyze
APPROACH
9
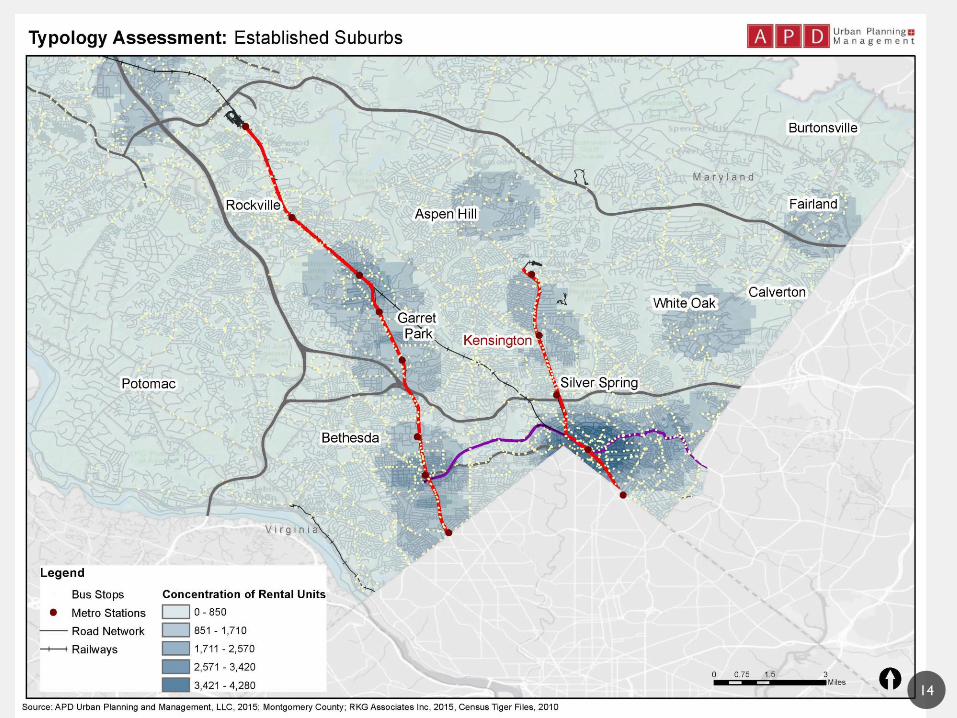
TYPOLOGY ASSESSMENT
DEFINE
IDENTIFY
SELECT
ANALYZE
10
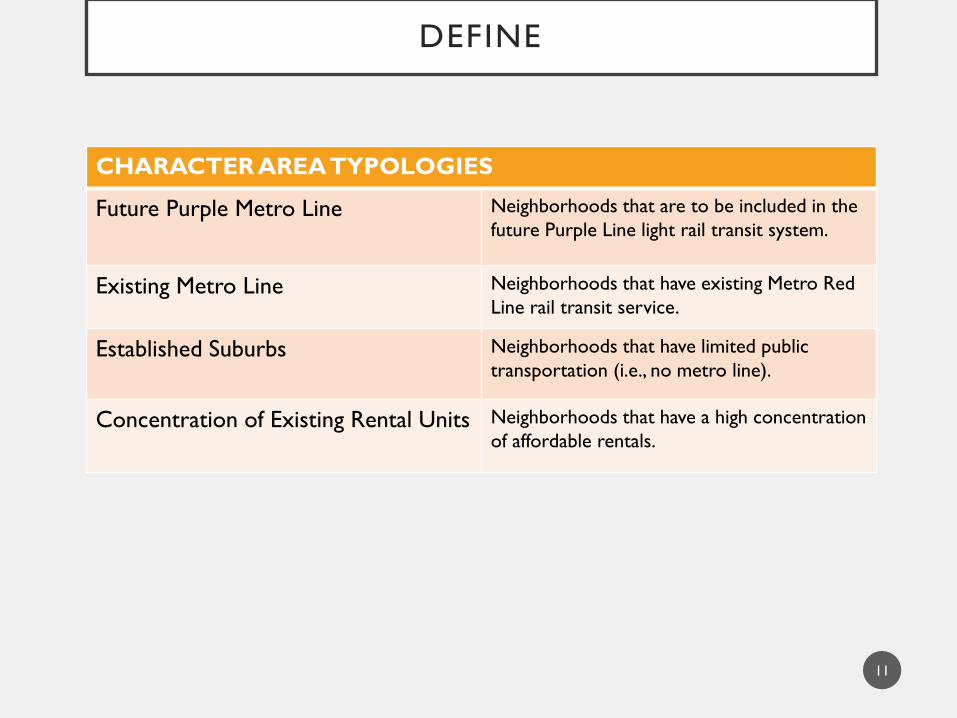
CHARACTER AREA TYPOLOGIES
Future Purple Metro Line Neighborhoods that are to be included in the
future Purple Line light rail transit system.
Existing Metro Line Neighborhoods that have existing Metro Red
Line rail transit service.
Established Suburbs Neighborhoods that have limited public
transportation (i.e., no metro line).
Concentration of Existing Rental Units Neighborhoods that have a high concentration
of affordable rentals.
DEFINE
11

12
13
14

15

INVESTMENT CRITERIA EXPLANATION
16
Criteria Rationale for selection
Population GrowthPopulation growth can be considered an indicator for the demand for both market rate and affordable rentals. A developer
would look at higher growth area as opposed to slow or no growth areas.
Average Gross RentA developer would look at a median gross rent to determine profit potential. A higher return on investment may allow a
developer an opportunity to set aside a higher number of affordable units.
Average Renter Income A developer would look at median renter income to determine if an area can absorb affordable or market rate units.
Percentage of Renter
HouseholdsA developer would target areas with a high percentage of renters for new development.
Cost Burden High cost burdened areas suggest a need for affordable housing.
Percentage of Multi-
Family Rental UnitsA developer would look at concentrations of rental units or housing to determine if an area demands rental housing.
Percentage of Single-
Family Rental UnitsAreas that have existing concentrations of non-owner occupied housing could be identified for affordable rental units.
Jobs-Housing Balance
Accessibility and proximity to employment is an important factor for households seeking affordable rental housing. Rents may
be lower the further you go into the suburbs, but higher transit costs can still make those areas more expensive places to live
for employed residents.
Proximity to Existing
Metro Red Line
A developer would consider walkability as a consideration in developing affordable rental housing near the existing Metro Red
Line.
Proximity to Future
Public TransitA developer would consider walkability as a consideration in developing affordable rental housing near the Future Purple Line.
Public Transit
Commuters
Areas in Montgomery County that see a high usage of public transit can be helpful in identifying areas that demand affordable
housing.
Average Travel Time Longer commute times may indicate a demand for affordable housing near job centers.
Lack of Vehicle
AvailabilityHouseholds without vehicles is one of many indicators of lower income households.
Limited Access to
TransitA renter seeking affordable housing would be more inclined to seek housing in communities that have transit options.
County Land
AvailabilityAvailability of non park County owned land as an asset to delivering affordable housing projects.
Underutilized or Vacant
Parcels
A developer seeking to build new housing would search a community for underutilized parcels that have potential for higher
density.
Public Amenities The presence of public amenities within the neighborhood (parks, schools, hospitals, libraries) is an important factor when
developing housing. Additionally, potential tenants would want to see these amenities near their homes.
16
17
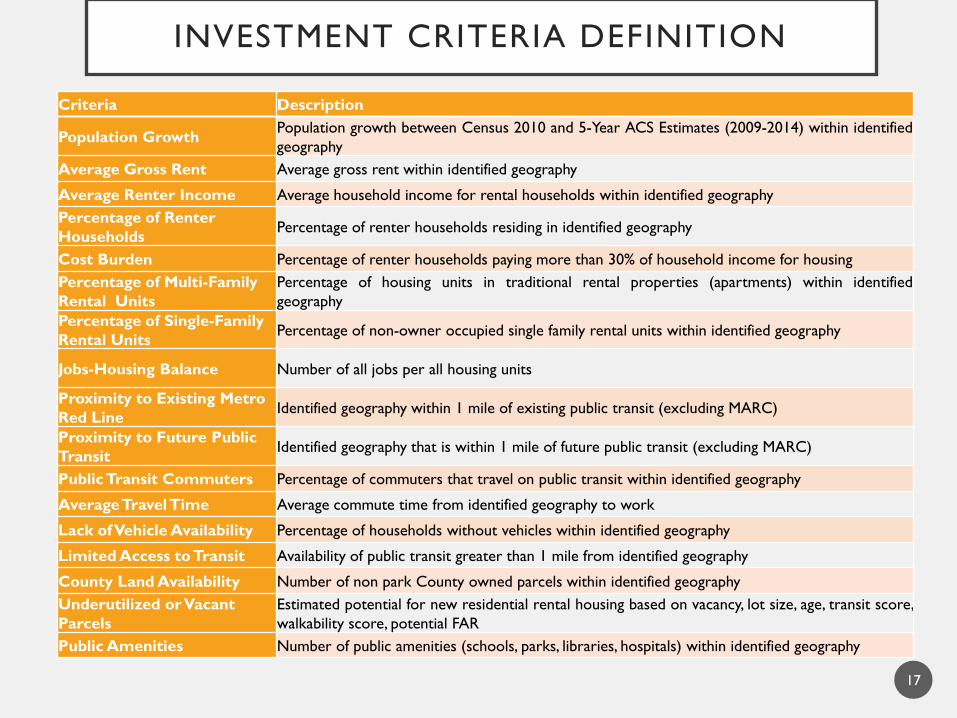
INVESTMENT CRITERIA DEFINITION
Criteria Description
Population GrowthPopulation growth between Census 2010 and 5-Year ACS Estimates (2009-2014) within identified
geography
Average Gross Rent Average gross rent within identified geography
Average Renter Income Average household income for rental households within identified geography
Percentage of Renter
HouseholdsPercentage of renter households residing in identified geography
Cost Burden Percentage of renter households paying more than 30% of household income for housing
Percentage of Multi-Family
Rental Units
Percentage of housing units in traditional rental properties (apartments) within identified
geography
Percentage of Single-Family
Rental UnitsPercentage of non-owner occupied single family rental units within identified geography
Jobs-Housing Balance Number of all jobs per all housing units
Proximity to Existing Metro
Red LineIdentified geography within 1 mile of existing public transit (excluding MARC)
Proximity to Future Public
TransitIdentified geography that is within 1 mile of future public transit (excluding MARC)
Public Transit Commuters Percentage of commuters that travel on public transit within identified geography
Average Travel Time Average commute time from identified geography to work
Lack of Vehicle Availability Percentage of households without vehicles within identified geography
Limited Access to Transit Availability of public transit greater than 1 mile from identified geography
County Land Availability Number of non park County owned parcels within identified geography
Underutilized or Vacant
Parcels
Estimated potential for new residential rental housing based on vacancy, lot size, age, transit score,
walkability score, potential FAR
Public Amenities Number of public amenities (schools, parks, libraries, hospitals) within identified geography

KEY TYPOLOGY FINDINGS
CONCENTRATION OF EXISTING
RENTAL FACILITIES
(GERMANTOWN)
• High number of commuters who use
public transit but low percentage
• Variety of rental unit facilities
• High percentage of single family rental
units
• Proximity to community amenities
ESTABLISHED SUBURBS
(KENSINGTON)
• Low percentage of renters, but high
percentage of cost burdened
households
• Likely to have 3-bedroom unit
availability
• Generally fewer underutilized parcels
(but larger acreage)
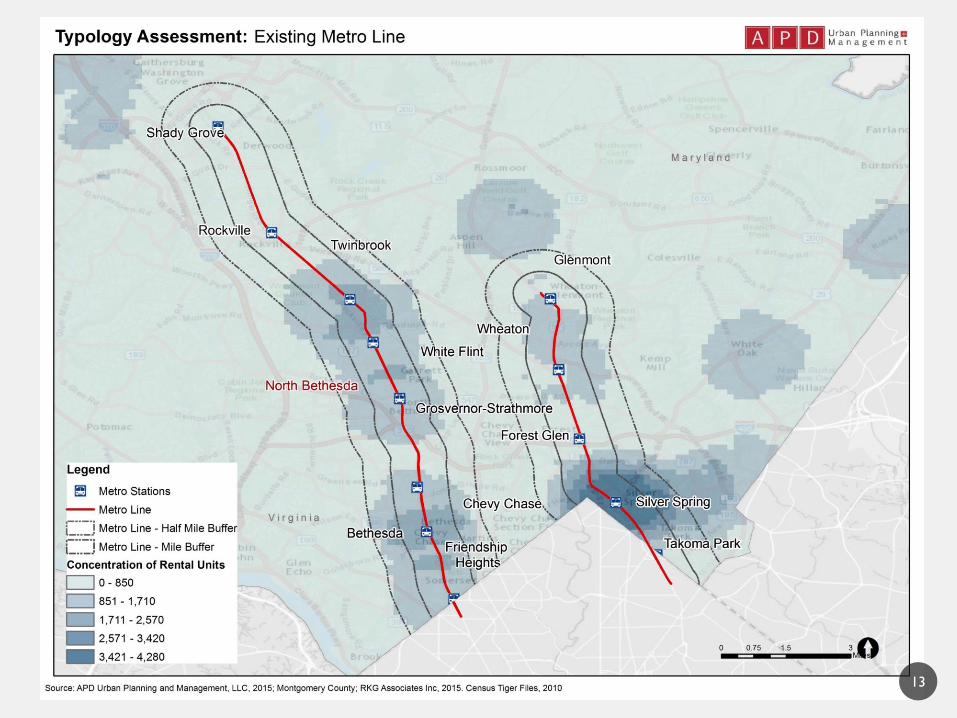
EXISTING METRO LINE
(NORTH BETHESDA)
• High percentage of communters who
use public transit
• Variety of rental unit types
• Proximity to community amenities
• Generally more underutilized parcels
near existing transit stops
FUTURE PURPLE LINE
(LONG BRANCH)
• Nearly half of renter households are
cost-burdened
• Typically higher commute times to
work
• Generally more underutilized parcels
near proposed transit stops
18

NEIGHBORHOOD ASSESSMENT
FUTURE PURPLE LINE – LONG BRANCH
EXISTING METRO LINE – NORTH BETHESDA
ESTABLISHED SUBURB – KENSINGTON
CONCENTRATION OF EXISTING RENTAL HOUSING - GERMANTOWN
19

LONG BRANCH(FUTURE PURPLE METRO LINE)
20
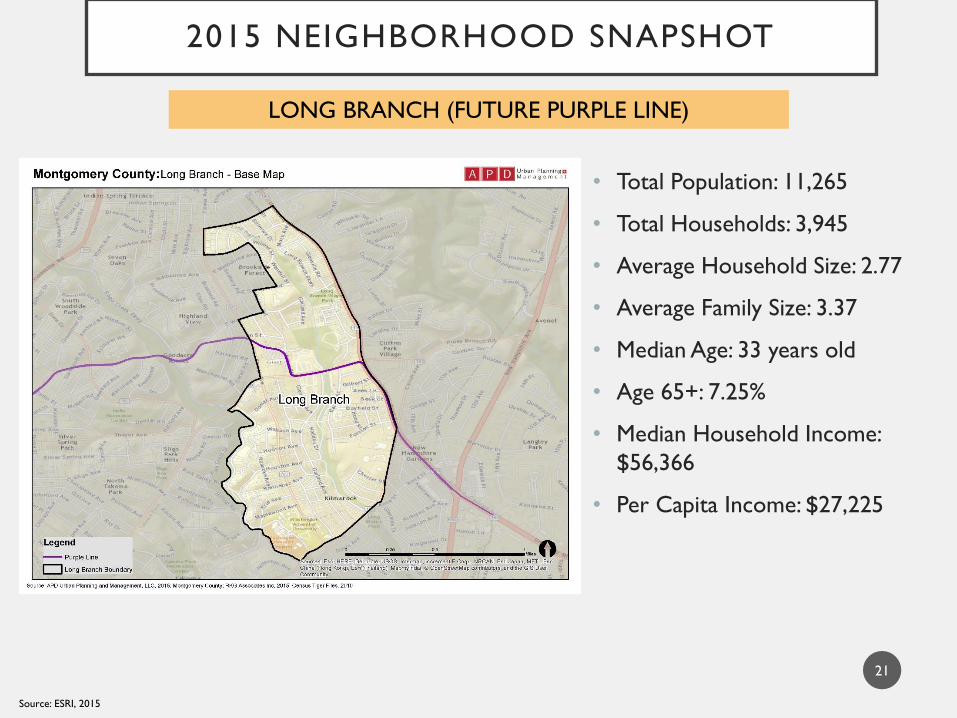
• Total Population: 11,265
• Total Households: 3,945
• Average Household Size: 2.77
• Average Family Size: 3.37
• Median Age: 33 years old
• Age 65+: 7.25%
• Median Household Income:
$56,366
• Per Capita Income: $27,225
2015 NEIGHBORHOOD SNAPSHOT
LONG BRANCH (FUTURE PURPLE LINE)
21
Source: ESRI, 2015

TYPOLOGY CRITERIA REVIEW
LONG BRANCH (FUTURE PURPLE LINE)
22
Sources: APD Urban Planning and Management LLC, 2015; Montgomery County, 2015; RKG Associates, 2015; ESRI, 2015; U.S. Census 2010; 2010-2014 ACS 5-Year Estimates
Typology Criteria Long Branch CountyPopulation Growth (2010-2014) 1.01% 3.43%Average Gross Rent $1,187 $1,611 Average Renter Income $53,088 $60,276Percentage of Renter Households 66.22% 33.36%Cost Burden 46.76% 51.54%Percentage of Multi-Family Rental Units 96.46% 79.53%Percentage of Single-Family Rental Units 3.39% 13.30%Jobs-Housing Balance 0.7 1.30Proximity to Existing Metro Red Line No N/AProximity to Future Public Transit Yes N/APublic Transit Commuters 25.76% 15.50%Average Travel Time 40.08 min 34.40 minLack of Vehicle Availability 25.17% 17.48%Limited Access to Transit Yes N/ACounty Land Availability 11 N/AUnderutilized Parcels 15 (19.48 acres) N/AVacant Parcels 32 (5.82 acres) N/APublic Amenities 17 1,079

RENTAL TYPOLOGY
LONG BRANCH (FUTURE PURPLE LINE)
23
RENTAL UNITS BY THRESHOLD
Income Threshold
Rent Threshold Total Supply
Share of Total
Extremely Low (30%) Income Limits $28,900 $723 99 3.9%
Very Low (50%) Income Limits $48,150 $1,204 1,700 66.1%
Low (80%) Income Limits $61,650 $1,541 630 24.5%
100% AMI $96,300 $2,408 111 4.3%
120% AMI $115,560 $2,889 24 0.9%
Above 120% AMI N/A N/A 6 0.2%
Total 2,570 100.0%
Sources: APD Urban Planning and Management LLC, 2015; Montgomery County, 2015; RKG Associates, 2015; ESRI, 2015; U.S. Census 2010; 2010-2014 ACS 5-Year Estimates

RENTAL SUPPLY - BEDROOM SIZE
24
LONG BRANCH (FUTURE PURPLE LINE)
Sources: APD Urban Planning and Management LLC, 2015; Montgomery County, 2015; RKG Associates, 2015; ESRI, 2015; U.S. Census 2010; 2010-2014 ACS 5-Year Estimates

RENTAL SUPPLY – RENTAL UNITS
25
LONG BRANCH (FUTURE PURPLE LINE)
Sources: APD Urban Planning and Management LLC, 2015; Montgomery County, 2015; RKG Associates, 2015; ESRI, 2015; U.S. Census 2010; 2010-2014 ACS 5-Year Estimates
Under 30% of AMI3.9%
30% to 50% of AMI66.1%
50% to 80% of AMI24.5%
80% to 100% of AMI4.3%
100% to 120% of AMI0.9%
Above 120% AMI0.2%
Under 30% of AMI 30% to 50% of AMI 50% to 80% of AMI
80% to 100% of AMI 100% to 120% of AMI Above 120% AMI

RENTAL DEMAND – RENTAL UNITS
Under 30% of AMI30.64%
30% to 50% of AMI21.05%
50% to 80% of AMI11.23%
80% to 100% of AMI22.69%
100% to 120% of AMI3.88% Above 120% AMI
10.51%
Under 30% of AMI 30% to 50% of AMI 50% to 80% of AMI
80% to 100% of AMI 100% to 120% of AMI Above 120% AMI 26
LONG BRANCH (FUTURE PURPLE LINE)
Sources: APD Urban Planning and Management LLC, 2015; Montgomery County, 2015; RKG Associates, 2015; ESRI, 2015; U.S. Census 2010; 2010-2014 ACS 5-Year Estimates
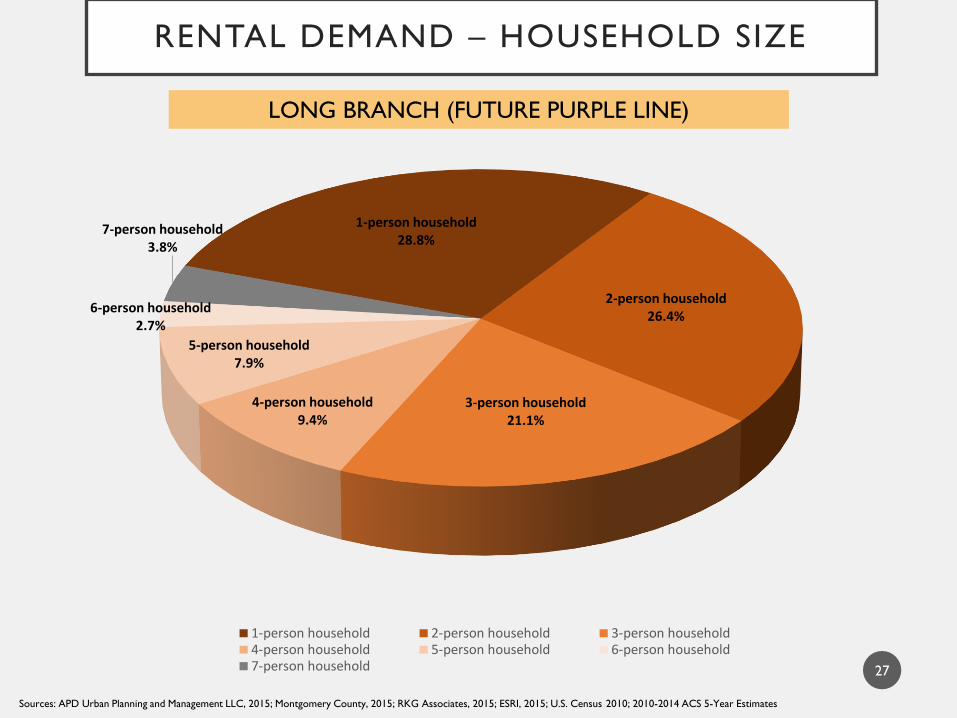
RENTAL DEMAND – HOUSEHOLD SIZE
1-person household28.8%
2-person household26.4%
3-person household21.1%
4-person household9.4%
5-person household7.9%
6-person household2.7%
7-person household3.8%
1-person household 2-person household 3-person household4-person household 5-person household 6-person household7-person household 27
LONG BRANCH (FUTURE PURPLE LINE)
Sources: APD Urban Planning and Management LLC, 2015; Montgomery County, 2015; RKG Associates, 2015; ESRI, 2015; U.S. Census 2010; 2010-2014 ACS 5-Year Estimates
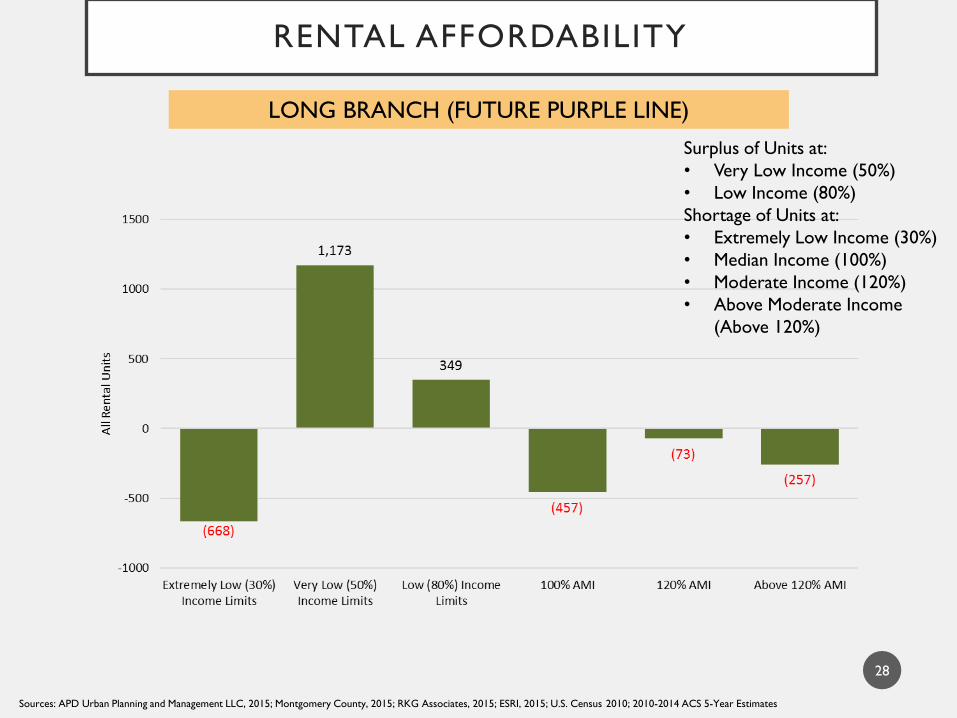
RENTAL AFFORDABILITY
28
LONG BRANCH (FUTURE PURPLE LINE)
Sources: APD Urban Planning and Management LLC, 2015; Montgomery County, 2015; RKG Associates, 2015; ESRI, 2015; U.S. Census 2010; 2010-2014 ACS 5-Year Estimates
Surplus of Units at:
• Very Low Income (50%)
• Low Income (80%)
Shortage of Units at:
• Extremely Low Income (30%)
• Median Income (100%)
• Moderate Income (120%)
• Above Moderate Income
(Above 120%)
KEY FINDINGS
29
• 50% of rental units are 1-2 bedroom units but generally are not affordable to
renter households earning below 50% AMI
• Older housing units observed to not be well maintained
• Most rental units are located on or near main thoroughfares (Piney Branch,
around Houston Avenue, and on or near Flower Avenue and Greenwood
Avenue)
• Vacant lots are typically small, and are often being used as side lots by
current residents (single family detached) in southeastern part of
neighborhood
• Commercial properties tend to be one story, suburban scale
• Underutilized parcels located primarily on Piney Branch
LONG BRANCH (FUTURE PURPLE LINE)

CONSIDERATIONS
• Densities do not match market opportunity
• Need for more 3+ bedroom units
• Shortage of units for households at or above 100% AMI
• Preservation of garden-style or small multi-family apartments may be more
financially feasible
• 37% of rental units are small multi-family apartments (5-8 unit buildings)
• 29% of rental units are garden apartments
• Public private partnerships for TOD redevelopment could boost affordability
• 25% of renters do not have vehicles
• Targeted infill development (accessory dwellings)
• Small vacant parcels scattered throughout neighborhood
30
LONG BRANCH (FUTURE PURPLE LINE)
NORTH BETHESDA(EXISTING METRO LINE)
31
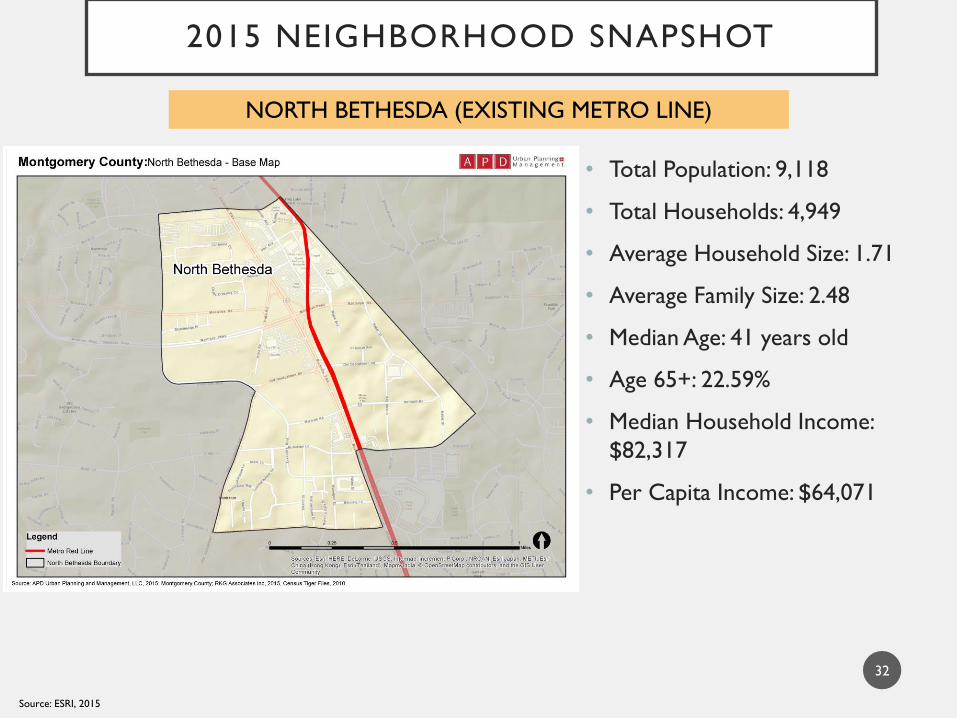
• Total Population: 9,118
• Total Households: 4,949
• Average Household Size: 1.71
• Average Family Size: 2.48
• Median Age: 41 years old
• Age 65+: 22.59%
• Median Household Income:
$82,317
• Per Capita Income: $64,071
2015 NEIGHBORHOOD SNAPSHOT
NORTH BETHESDA (EXISTING METRO LINE)
32
Source: ESRI, 2015

TYPOLOGY CRITERIA REVIEW
NORTH BETHESDA (EXISTING METRO LINE)
33
Typology Criteria North Bethesda CountyPopulation Growth (2010-2014) 10.23% 3.43%Average Gross Rent $1,792 $1,611 Average Renter Income $77,782 $60,276Percentage of Renter Households 61.60% 33.36%Cost Burden 44.12% 51.54%Percentage of Multi-Family Rental Units 82.98% 79.53%Percentage of Single-Family Rental Units 1.86% 13.30%Jobs-Housing Balance 3.47 1.30Proximity to Existing Metro Red Line Yes N/AProximity to Future Public Transit No N/APublic Transit Commuters 30.69% 15.50%Average Travel Time 33.90 min 34.40 minLack of Vehicle Availability 18.31% 17.48%Limited Access to Transit Yes N/ACounty Land Availability 31 N/AUnderutilized Parcels 25 (90.08 acres) N/AVacant Parcels 9 (16.82 acres) N/APublic Amenities 1 1,079
Sources: APD Urban Planning and Management LLC, 2015; Montgomery County, 2015; RKG Associates, 2015; ESRI, 2015; U.S. Census 2010; 2010-2014 ACS 5-Year Estimates
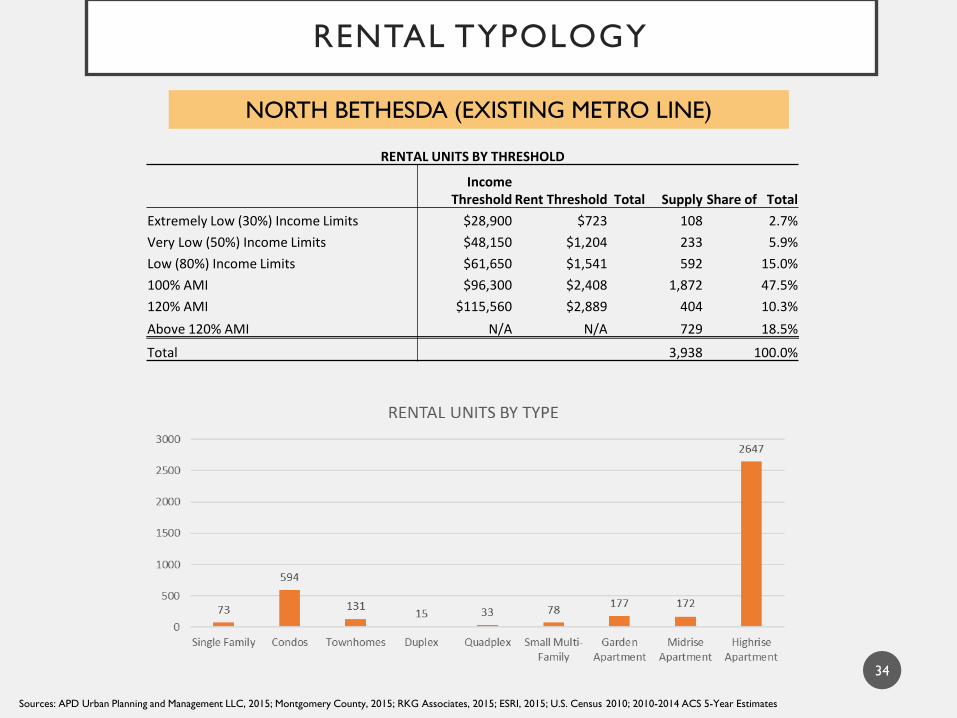
RENTAL TYPOLOGY
34
NORTH BETHESDA (EXISTING METRO LINE)
RENTAL UNITS BY THRESHOLD
Income Threshold Rent Threshold Total Supply Share of Total
Extremely Low (30%) Income Limits $28,900 $723 108 2.7%
Very Low (50%) Income Limits $48,150 $1,204 233 5.9%
Low (80%) Income Limits $61,650 $1,541 592 15.0%
100% AMI $96,300 $2,408 1,872 47.5%
120% AMI $115,560 $2,889 404 10.3%
Above 120% AMI N/A N/A 729 18.5%
Total 3,938 100.0%
Sources: APD Urban Planning and Management LLC, 2015; Montgomery County, 2015; RKG Associates, 2015; ESRI, 2015; U.S. Census 2010; 2010-2014 ACS 5-Year Estimates
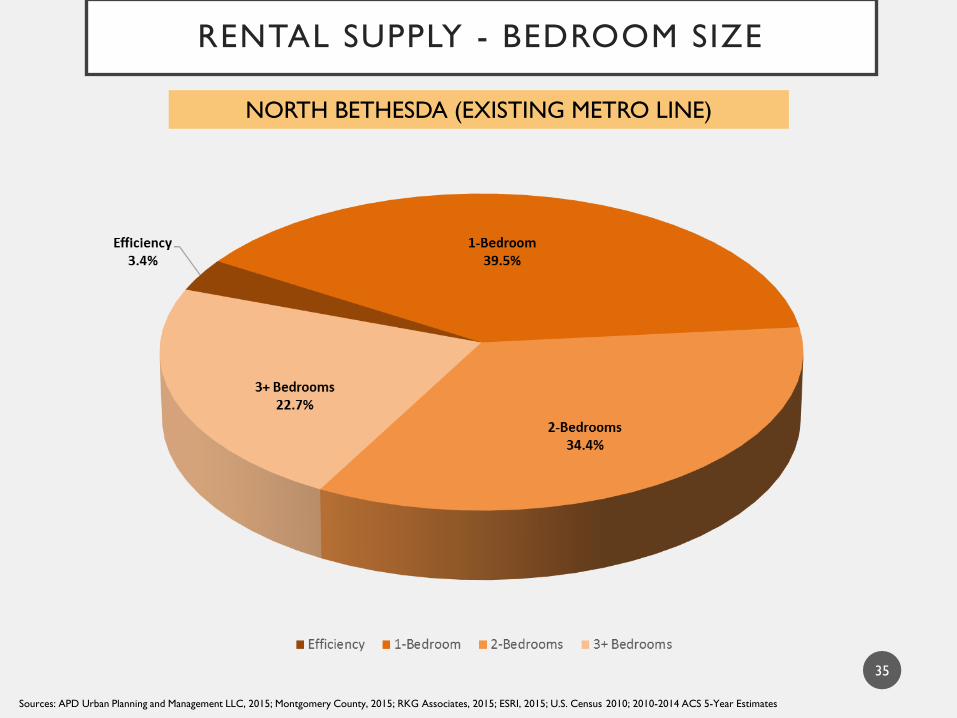
RENTAL SUPPLY - BEDROOM SIZE
35
NORTH BETHESDA (EXISTING METRO LINE)
Sources: APD Urban Planning and Management LLC, 2015; Montgomery County, 2015; RKG Associates, 2015; ESRI, 2015; U.S. Census 2010; 2010-2014 ACS 5-Year Estimates
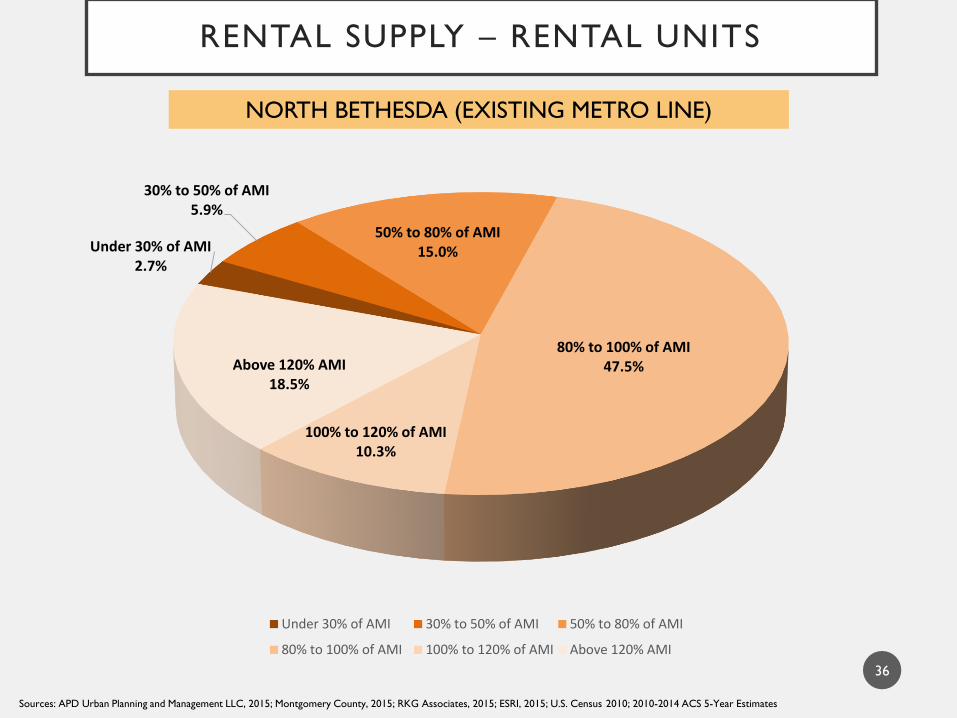
RENTAL SUPPLY – RENTAL UNITS
36
NORTH BETHESDA (EXISTING METRO LINE)
Sources: APD Urban Planning and Management LLC, 2015; Montgomery County, 2015; RKG Associates, 2015; ESRI, 2015; U.S. Census 2010; 2010-2014 ACS 5-Year Estimates
Under 30% of AMI2.7%
30% to 50% of AMI5.9%
50% to 80% of AMI15.0%
80% to 100% of AMI47.5%
100% to 120% of AMI10.3%
Above 120% AMI18.5%
Under 30% of AMI 30% to 50% of AMI 50% to 80% of AMI
80% to 100% of AMI 100% to 120% of AMI Above 120% AMI

RENTAL DEMAND – RENTAL UNITS
37
NORTH BETHESDA (EXISTING METRO LINE)
Sources: APD Urban Planning and Management LLC, 2015; Montgomery County, 2015; RKG Associates, 2015; ESRI, 2015; U.S. Census 2010; 2010-2014 ACS 5-Year Estimates

RENTAL DEMAND – HOUSEHOLD SIZE
38
NORTH BETHESDA (EXISTING METRO LINE)
Sources: APD Urban Planning and Management LLC, 2015; Montgomery County, 2015; RKG Associates, 2015; ESRI, 2015; U.S. Census 2010; 2010-2014 ACS 5-Year Estimates
1-person household45.94%
2-person household31.50%
3-person household17.57%
4-person household4.48%
5-person household0.52%
6-person household0.00%
7-person household0.00%
1-person household 2-person household 3-person household 4-person household
5-person household 6-person household 7-person household

RENTAL AFFORDABILITY
39
NORTH BETHESDA (EXISTING METRO LINE)
Sources: APD Urban Planning and Management LLC, 2015; Montgomery County, 2015; RKG Associates, 2015; ESRI, 2015; U.S. Census 2010; 2010-2014 ACS 5-Year Estimates
Surplus of Units at:
• Low Income (80%)
• Median Income (100%)
• Moderate Income (120%)
Shortage of Units at:
• Extremely Low Income (30%)
• Very Low Income (50%)
• Above Moderate Income
(Above 120%)

KEY FINDINGS
40
• High costs have kept households at or below 30% AMI from securing price
appropriate housing
• 63% of existing rental housing affordable to households between 50-100%
AMI; however these units are generally occupied by households with
incomes at or greater than 120% AMI
• Vacant parcels are opportunity for new high density rental development
(i.e. Citadel and Marinelli; near Montrose and Hoya)
• Recent/pending developments will continue to reshape the market
• Phase I of Pike and Rose has been completed; currently in Phase II
• Office building on Montrose and Hoya
NORTH BETHESDA (EXISTING METRO LINE)
CONSIDERATIONS
NORTH BETHESDA (EXISTING METRO LINE)
• Commercial corridor redevelopment – mixed use potential
• Availability of underutilized parcels adjacent to or within 1 mile of Metro
line either redeveloped or proposed redevelopment
• Focus MPDU requirements for fewer units, but highly subsidized
• 44% of renters are cost burdened even though 90% of renters have
household incomes at or above 80% AMI
• Take advantage of transportation infrastructure
• Creation of receiving area for off-site programming if appropriate, and if
so, where should this go?
41

KENSINGTON(ESTABLISHED SUBURB)
42

• Total Population: 4,651
• Total Households: 1,917
• Average Household Size: 2.42
• Average Family Size: 3.15
• Median Age: 44 years old
• Age 65+: 18.92%
• Median Household Income: $84,695
• Per Capita Income: $48,508
2015 NEIGHBORHOOD SNAPSHOT
KENSINGTON (ESTABLISHED SUBURB)
43
Source: ESRI, 2015
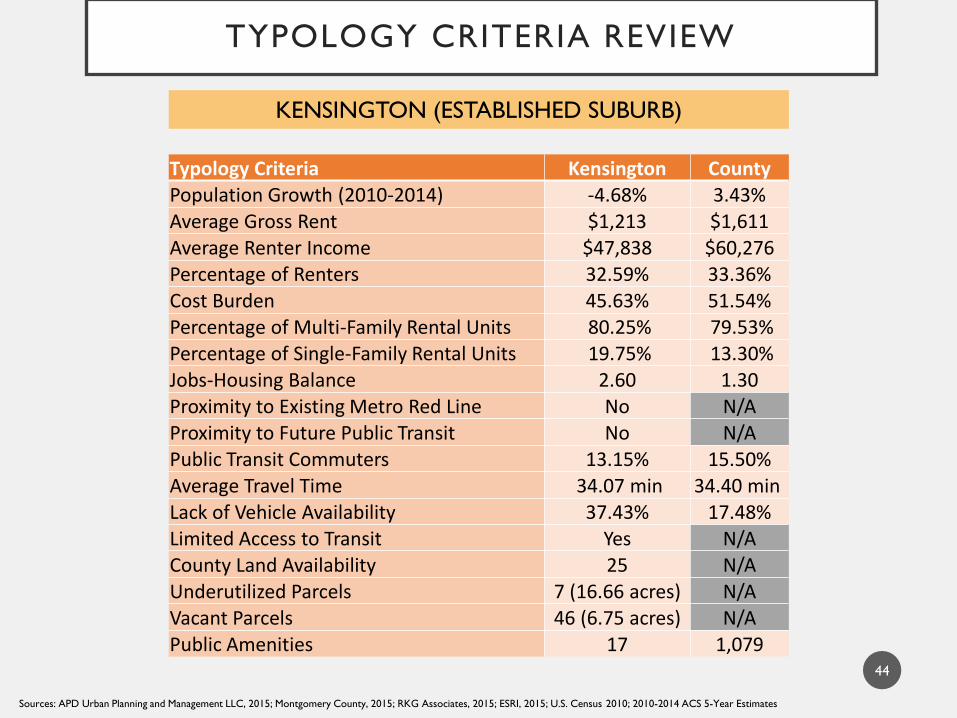
TYPOLOGY CRITERIA REVIEW
44
KENSINGTON (ESTABLISHED SUBURB)
Typology Criteria Kensington CountyPopulation Growth (2010-2014) -4.68% 3.43%Average Gross Rent $1,213 $1,611 Average Renter Income $47,838 $60,276Percentage of Renters 32.59% 33.36%Cost Burden 45.63% 51.54%Percentage of Multi-Family Rental Units 80.25% 79.53%Percentage of Single-Family Rental Units 19.75% 13.30%Jobs-Housing Balance 2.60 1.30Proximity to Existing Metro Red Line No N/AProximity to Future Public Transit No N/APublic Transit Commuters 13.15% 15.50%Average Travel Time 34.07 min 34.40 minLack of Vehicle Availability 37.43% 17.48%Limited Access to Transit Yes N/ACounty Land Availability 25 N/AUnderutilized Parcels 7 (16.66 acres) N/AVacant Parcels 46 (6.75 acres) N/APublic Amenities 17 1,079
Sources: APD Urban Planning and Management LLC, 2015; Montgomery County, 2015; RKG Associates, 2015; ESRI, 2015; U.S. Census 2010; 2010-2014 ACS 5-Year Estimates

RENTAL TYPOLOGY
45
KENSINGTON (ESTABLISHED SUBURB)
RENTAL UNITS BY THRESHOLD
Income Threshold
Rent Threshold Total Supply
Share of Total
Extremely Low (30%) Income Limits $28,900 $723 3 0.5%
Very Low (50%) Income Limits $48,150 $1,204 163 29.6%
Low (80%) Income Limits $61,650 $1,541 188 34.2%
100% AMI $96,300 $2,408 132 24.0%
120% AMI $115,560 $2,889 20 3.6%
Above 120% AMI N/A N/A 44 8.0%
Total 550 100.0%
Sources: APD Urban Planning and Management LLC, 2015; Montgomery County, 2015; RKG Associates, 2015; ESRI, 2015; U.S. Census 2010; 2010-2014 ACS 5-Year Estimates

RENTAL SUPPLY - BEDROOM SIZE
46
KENSINGTON (ESTABLISHED SUBURB)
Sources: APD Urban Planning and Management LLC, 2015; Montgomery County, 2015; RKG Associates, 2015; ESRI, 2015; U.S. Census 2010; 2010-2014 ACS 5-Year Estimates

RENTAL SUPPLY – RENTAL UNITS
47
KENSINGTON (ESTABLISHED SUBURB)
Sources: APD Urban Planning and Management LLC, 2015; Montgomery County, 2015; RKG Associates, 2015; ESRI, 2015; U.S. Census 2010; 2010-2014 ACS 5-Year Estimates

RENTAL DEMAND – RENTAL UNITS
48
KENSINGTON (ESTABLISHED SUBURB)
Sources: APD Urban Planning and Management LLC, 2015; Montgomery County, 2015; RKG Associates, 2015; ESRI, 2015; U.S. Census 2010; 2010-2014 ACS 5-Year Estimates

RENTAL DEMAND – HOUSEHOLD SIZE
49
KENSINGTON (ESTABLISHED SUBURB)
Sources: APD Urban Planning and Management LLC, 2015; Montgomery County, 2015; RKG Associates, 2015; ESRI, 2015; U.S. Census 2010; 2010-2014 ACS 5-Year Estimates

RENTAL AFFORDABILITY
50
KENSINGTON (ESTABLISHED SUBURB)
Sources: APD Urban Planning and Management LLC, 2015; Montgomery County, 2015; RKG Associates, 2015; ESRI, 2015; U.S. Census 2010; 2010-2014 ACS 5-Year Estimates
Surplus of Units at:
• Very Low Income (50%)
• Low Income (80%)
• Median Income (100%)
Shortage of Units at:
• Extremely Low Income (30%)
• Moderate Income (120%)
• Above Moderate Income
(Above 120%)

KEY FINDINGS
KENSINGTON (ESTABLISHED SUBURB)
51
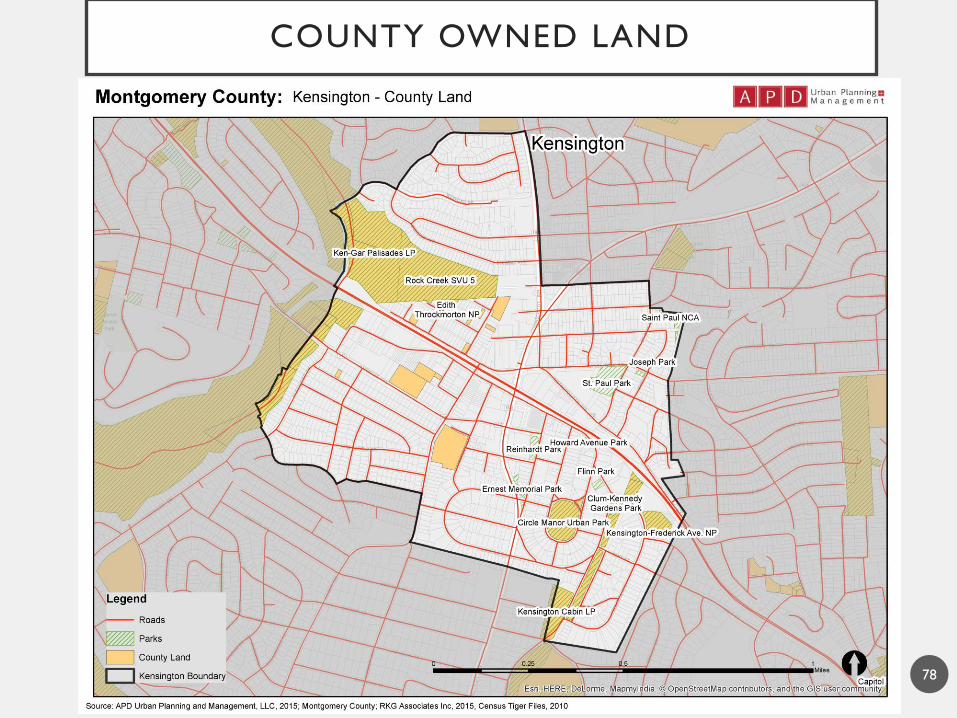
• Commercial sites in Kensington tend to be one story, partially vacant
• Nearly all underutilized parcels are located on the main corridors in the
neighborhood, also along the rail line
• Industrial businesses are located within the neighborhood due to their
historical proximity to the railroad
• Two vacant commercial properties available for development at key
intersections (Connecticut and Plyers Mill)
• 20% of rental housing is single family units, yet more than 40% of renters are
one person households
• Nearly 65% of rental housing is affordable for households between 30-80%
AMI, but not enough available units for households at or below 30% AMI
• Indication of single family conversions were evident by for-rent signs in the
neighborhood.
• New residential units appear to be out of scale with existing community

CONSIDERATIONS
KENSINGTON (ESTABLISHED SUBURB)
• Development character an important issue
• Restrict low density rentals to underutilized/vacant parcels near core of
neighborhood
• Provide more flexibility for development along major corridors
• Rental Assistance Program to make neighborhood more accessible
• 46% of renters are cost burdened
• Credit counseling program for income qualifying households
• Infill Development on low density rental communities to capture family
market
• 20% of rental units are single family rentals; less than 5% of rentals are
3+ bedrooms
• Renovation of older housing stock necessary to address aging in place
• 30% of renters are 65 or older
52
GERMANTOWN(CONCENTRATION OF
RENTAL UNITS)
53

• Total Population: 30,862
• Total Households: 11,850
• Average Household Size: 2.60
• Average Family Size: 3.23
• Median Age: 33 years old
• Age 65+: 6.26%
• Median Household Income:
$76,565
• Per Capita Income: $34,724
CONCENTRATION OF EXISTING RENTAL UNITS
54
GERMANTOWN (CONCENTRATION OF EXISTING RENTAL UNITS)
Sources: APD Urban Planning and Management LLC, 2015; Montgomery County, 2015; RKG Associates, 2015; ESRI, 2015; U.S. Census 2010; 2010-2014 ACS 5-Year Estimates

TYPOLOGY CRITERIA REVIEW
55
GERMANTOWN (CONCENTRATION OF EXISTING RENTAL UNITS)
Typology Criteria Germantown County
Population Growth (2010-2014) 3.49% 3.43%
Average Gross Rent $1,553 $1,611
Average Renter Income $62,698 $60,276
Percentage of Renter Households 46.44% 33.36%
Cost Burden 51.40% 51.54%
Percentage of Multi-Family Rental Units 81.29% 79.53%
Percentage of Single-Family Rental Units 12.61% 13.30%
Jobs-Housing Balance 1.39 1.30
Proximity to Existing Metro Red Line No N/A
Proximity to Future Public Transit No N/A
Public Transit Commuters 10.59% 15.50%
Average Travel Time 41.37 min 34.40 min
Lack of Vehicle Availability 11.15% 17.48%
Limited Access to Transit Yes N/A
County Land Availability 115 N/A
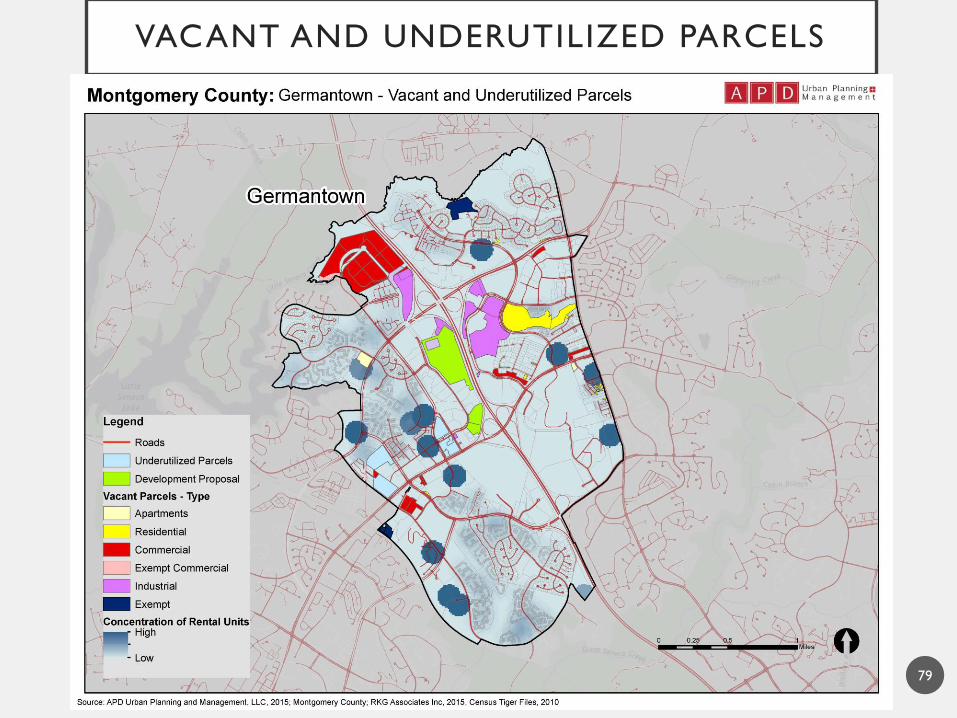
Underutilized Parcels 4 (38.53 acres) N/A
Vacant Parcels 60 (232.25 acres) N/A
Public Amenities 14 1,079
Sources: APD Urban Planning and Management LLC, 2015; Montgomery County, 2015; RKG Associates, 2015; ESRI, 2015; U.S. Census 2010; 2010-2014 ACS 5-Year Estimates

RENTAL TYPOLOGY
56
GERMANTOWN (CONCENTRATION OF EXISTING RENTAL UNITS)
RENTAL UNITS BY THRESHOLD
Income Threshold
Rent Threshold Total Supply
Share of Total
Extremely Low (30%) Income Limits $28,900 $723 239 3.1%
Very Low (50%) Income Limits $48,150 $1,204 1,114 14.6%
Low (80%) Income Limits $61,650 $1,541 3,260 42.8%
100% AMI $96,300 $2,408 2,861 37.6%
120% AMI $115,560 $2,889 98 1.3%
Above 120% AMI N/A N/A 46 0.6%
Total 7,618 100.0%
Sources: APD Urban Planning and Management LLC, 2015; Montgomery County, 2015; RKG Associates, 2015; ESRI, 2015; U.S. Census 2010; 2010-2014 ACS 5-Year Estimates
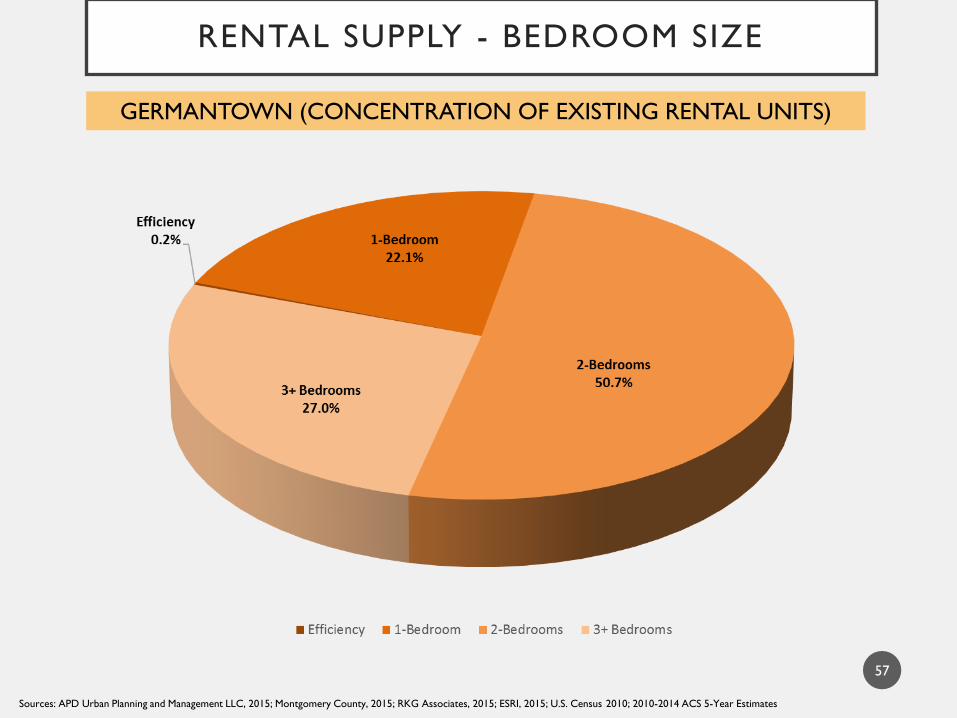
RENTAL SUPPLY - BEDROOM SIZE
57
GERMANTOWN (CONCENTRATION OF EXISTING RENTAL UNITS)
Sources: APD Urban Planning and Management LLC, 2015; Montgomery County, 2015; RKG Associates, 2015; ESRI, 2015; U.S. Census 2010; 2010-2014 ACS 5-Year Estimates

RENTAL SUPPLY – RENTAL UNITS
58
GERMANTOWN (CONCENTRATION OF EXISTING RENTAL UNITS)
Sources: APD Urban Planning and Management LLC, 2015; Montgomery County, 2015; RKG Associates, 2015; ESRI, 2015; U.S. Census 2010; 2010-2014 ACS 5-Year Estimates
Under 30% of AMI3.1%
30% to 50% of AMI14.6%
50% to 80% of AMI42.8%
80% to 100% of AMI37.6%
100% to 120% of AMI1.3%
Above 120% AMI0.6%
Under 30% of AMI 30% to 50% of AMI 50% to 80% of AMI
80% to 100% of AMI 100% to 120% of AMI Above 120% AMI

RENTAL DEMAND – RENTAL UNITS
59
GERMANTOWN (CONCENTRATION OF EXISTING RENTAL UNITS)
Sources: APD Urban Planning and Management LLC, 2015; Montgomery County, 2015; RKG Associates, 2015; ESRI, 2015; U.S. Census 2010; 2010-2014 ACS 5-Year Estimates

RENTAL DEMAND – HOUSEHOLD SIZE
60
GERMANTOWN (CONCENTRATION OF EXISTING RENTAL UNITS)
Sources: APD Urban Planning and Management LLC, 2015; Montgomery County, 2015; RKG Associates, 2015; ESRI, 2015; U.S. Census 2010; 2010-2014 ACS 5-Year Estimates

RENTAL AFFORDABILITY
61
GERMANTOWN (CONCENTRATION OF EXISTING RENTAL UNITS)
Sources: APD Urban Planning and Management LLC, 2015; Montgomery County, 2015; RKG Associates, 2015; ESRI, 2015; U.S. Census 2010; 2010-2014 ACS 5-Year Estimates
Surplus of Units at:
• Very Low Income (50%)
• Low Income (80%)
• Median Income (100%)
Shortage of Units at:
• Extremely Low Income (30%)
• Moderate Income (120%)
• Above Moderate Income
(Above 120%)

KEY FINDINGS
62
• New senior housing in development (Churchill Senior Living Facility Phase II)
• Recent/planned development will continue to affect the rental market• Century Technology Campus (office space)
• Infrastructure completed for Black Hill Development (mixed use development)
• Pricing structure of rental units does not match renters’ ability to pay
• Value alternative rather than destination location
• Need for rental units for households at or below 30% AMI and at or above
100% AMI is almost the same
• Scale of delivery should not be equal, though
GERMANTOWN (CONCENTRATION OF EXISTING RENTAL UNITS)

CONSIDERATIONS
• Colocation on publicly held land (i.e. emergency services)
• Limited access/proximity to community amenities
• Access to existing public transportation/services critical
• Limited MARC service available
• No Metro rail lines
• Potential for employer-based housing programs
• Several large employers are located in or within a mile of Germantown
neighborhood
• Fewer MPDU units with deeper subsidies
• 51% of renters are cost burdened
• Vacant industrial parcels could be rezoned as medium density for potential
redevelopment
63
GERMANTOWN (CONCENTRATION OF EXISTING RENTAL UNITS)
MODEL NEIGHBORHOOD SUMMARY
64
MODEL NEIGHBORHOOD SUMMARY
65
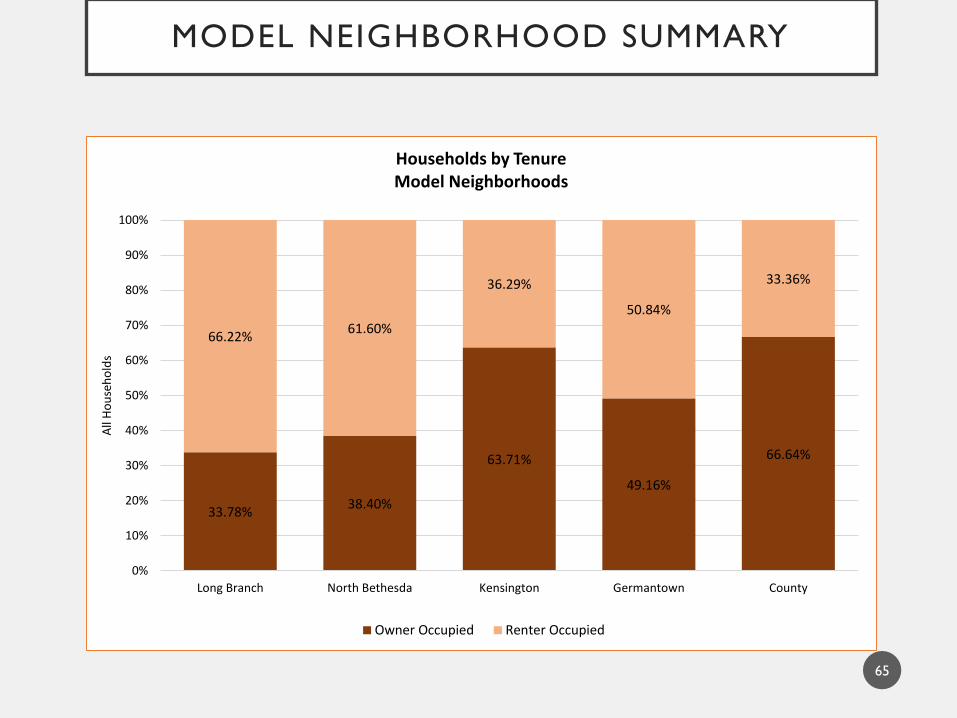
33.78%38.40%
63.71%
49.16%
66.64%
66.22%61.60%
36.29%
50.84%
33.36%
0%
10%
20%
30%
40%
50%
60%
70%
80%
90%
100%
Long Branch North Bethesda Kensington Germantown County
All
Ho
use
ho
lds
Households by TenureModel Neighborhoods
Owner Occupied Renter Occupied

MODEL NEIGHBORHOOD SUMMARY
66
96.5%
83.1% 80.3% 81.3% 79.2%
3.5%
16.9% 19.7% 18.7% 20.8%
0%
10%
20%
30%
40%
50%
60%
70%
80%
90%
100%
Long Branch North Bethesda Kensington Germantown County
All
Ren
tal U
nit
s
Rental Units by TypeModel Neighborhoods
Multifamily Conversion

MODEL NEIGHBORHOOD SUMMARY
67
10.9%
22.7% 20.7%27.0%
39.5%
46.2%
34.4% 36.4%
50.7%31.5%
41.9% 39.5%32.1%
22.1%25.8%
1.0% 3.4%10.9%
0.2% 3.2%
0%
10%
20%
30%
40%
50%
60%
70%
80%
90%
100%
Long Branch North Bethesda Kensington Germantown County
All
Ren
tal U
nit
s
Rental Units by Bedroom CountModel Neighborhoods
3+ Bedrooms 2-Bedrooms 1-Bedroom Efficiency

MODEL NEIGHBORHOOD SUMMARY
68
40.08
33.90 34.07
41.37
34.40
30
32
34
36
38
40
42
44
Long Branch North Bethesda Kensington Germantown County
Min
ute
s
Average Travel Time to Work (in Minutes)Model Neighborhoods
MODEL NEIGHBORHOOD SUMMARY
69
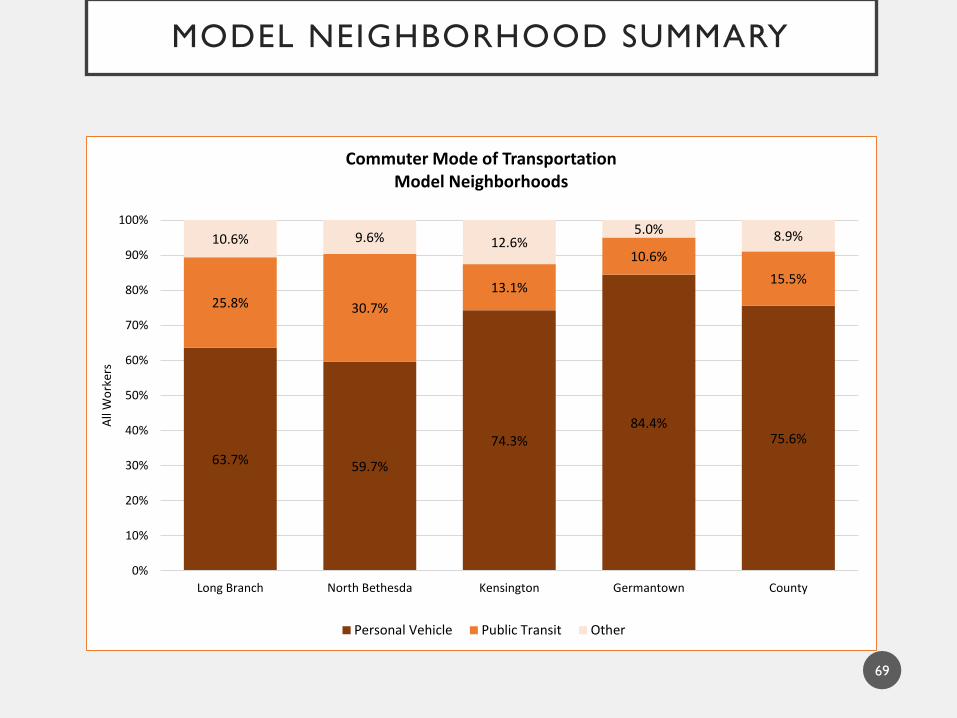
63.7% 59.7%
74.3%84.4%
75.6%
25.8% 30.7%
13.1%
10.6%
15.5%
10.6% 9.6% 12.6%5.0% 8.9%
0%
10%
20%
30%
40%
50%
60%
70%
80%
90%
100%
Long Branch North Bethesda Kensington Germantown County
All
Wo
rker
s
Commuter Mode of TransportationModel Neighborhoods
Personal Vehicle Public Transit Other

DISCUSSION
Q & A
70

NEXT STEPS
• Policy analysis (CHP) – Late July
• Financial feasibility model (RKG) – Late August
• Draft strategy presentation/discussion – Late September
• Policy refinement – Mid November
• Strategy completion –Year end
71

THANK YOU
72

VACANT AND UNDERUTILIZED PARCELS
73

COUNTY OWNED LAND
74

VACANT AND UNDERUTILIZED PARCELS
75

COUNTY OWNED LAND
76

VACANT AND UNDERUTILIZED PARCELS
77
COUNTY OWNED LAND
78
VACANT AND UNDERUTILIZED PARCELS
79

COUNTY OWNED LAND
80


