63
June 2017 Monthly Complaint Report Vol. 24

June 2017
Monthly Complaint Report Vol. 24


Message from Richard Cordray Director of the CFPB
The Consumer Financial Protection Bureau (CFPB) is the first federal agency solely focused on consumer finance markets. The mortgage market today is roughly $10 trillion. Student loan debt stands at about $1.4 trillion. Auto loan debt is over $1 trillion. And credit card debt is around $700 billion. We have our work cut out for us to ensure that these vast and complex financial markets work effectively. Consumer complaints play an integral part in our mission. Submitting a complaint gives consumers the opportunity to voice their own concerns and report on broader patterns of problems or abuse. Every complaint provides insight into real problems, experienced by real people, communicated in near real time. We handle more than 20,000 complaints every month. From coast to coast, from big cities to small towns, in suburban and rural areas, consumers just want to be treated fairly. Collectively, their complaints tell us a lot, and we are listening. They are our compass, and they guide the direction of our work. By sharing complaint data publicly, we empower consumers with information they can use to make decisions and give public officials insight into issues affecting our communities. Likewise, industry can see direct feedback from customers and review complaints made about others in the same markets. This helps them fix current problems, keep small problems from growing, and prevent future problems. All people must be treated honestly and fairly in the financial marketplace. It is not just the right thing to do. It is good for consumers, responsible businesses, and the economy as a whole. This Monthly Complaint Report provides a snapshot of what consumers in all fifty
MONTHLY COMPLAINT REPORT: JUNE 2017 1

states and the District of Columbia have told us and reinforces our view that every voice should be heard.
Sincerely,
Richard Cordray
2 MONTHLY COMPLAINT REPORT: JUNE 2017

Table of contents Table of contents .................................................................................................................. 3
1. Voices across America ................................................................................................... 4
2. Specialty Populations .................................................................................................... 6
3. 50 State Snapshots ........................................................................................................ 8
4. Definitions .................................................................................................................... 60
MONTHLY COMPLAINT REPORT: JUNE 2017 3

Voicesof consumers from across the nationEvery month the Consumer Financial Protection Bureau handles over20,000 complaints. Consumers submit a complaint when they have aproblem with a financial product or service.
Consumer story from Alaska Consumer story from Texas
I want to thank the CFPB for their help in resolvingmoney missing from my account. The immediateresponse from [the company] after filing acomplaint was astounding. I had tried to resolvethe issue on my own over a period of two months,making nine different phone calls and talking withnine different representatives at [the company].The day after I submitted a complaint with theCFPB I received a call from the company and themoney was restored within a week!
I'm a huge fan of the Consumer FinancialProtection Bureau. I've filed several complaintsand while not all resolved in a manner to myliking, there was resolution and a documentedtrail from which others can benefit in the future.I've made numerous attempts to resolve issueswith [the companies] in the past but nothing getstheir attention like a complaint with the CFPB.What could take months is reduced to days andsometimes hours in terms of response times. Thisis a huge win for the little guy!
4 MONTHLY COMPLAINT REPORT: JUNE 2017

Consumer story from California Consumer story from New York
I struggled to get through to [the company] abouta mistake they made … I had spent hours on thephone with them to try and straighten it out,speaking to at least FOUR different people ... All ittook was literally minutes to complete your supereasy form, and pressing "submit.” That's it!! I gota prompt response … and today, a bit over 2weeks later, I get a letter … they are removing allthe erroneous charges and correcting my credit!!
[The company] did not respond to ourcommunications to them for two months. As soonas we filed a complaint with the ConsumerFinancial Protection Bureau, [the company]started communicating with us. …This would nothave been resolved in our favor so quickly if wedid not have the assistance of the ConsumerFinancial Protection Bureau. Thank you CFPB!!!!
WY1,245
WV3,267
WI13,285
WA23,697
VT1,837
VA35,954
UT6,709
TX93,472
TN19,266
SD1,773
SC15,765
RI3,633
PA41,264
OR13,368
OK8,676
OH35,511
NY74,072
NV14,559
NM6,095
NJ43,462
NH4,983
NE3,974
ND1,184
NC32,335
MT2,093
MS6,297
MO16,133
MN13,211
MI29,210
ME3,782
MD34,905
MA21,101
LA12,982
KY9,229
KS6,309
IN13,794
IL41,273
ID4,241
IA5,466
HI4,042
GA50,751
FL111,559
DE5,889
DC6,690
CT12,903
CO19,574
CA159,158
AZ25,696
AR5,440
AL13,070
AK1,508
1,000 160,000Complaints
MONTHLY COMPLAINT REPORT: JUNE 2017 5

Non-serviceService
This report uses dynamic data as of April 1, 2017 and may differ slightly from other public reports. Servicemembers refers to self-identifiedservicemembers, veterans, and their dependents. Visit consumerfinance.gov/complaint to learn how we handle complaints.
TOP 5 PRODUCTS BY VOLUME
COMPLAINT VOLUME BY STATE
COMPLAINTS SUBMITTED BY
Servicemembers, veterans, and theirfamilies
74,784Complaints handled
since 2011
+8%Complaints handled in
2016 than 2015
96%Timely company
responses since 2011
Servicemembercomplaints
Service vs. non-service % of total Top issue reported byservicemembers by product
Debt collection 31,451
Mortgage 13,651
Credit reporting 8,007
Bank account orservice 5,536
Credit card 5,103
42%26%
18%24%
11%17%
10%7%
10%7%
Continued attempts to collectdebt not owed 44% (13,709)Problems when you are unable topay 45% (6,194)Incorrect information on creditreport 73% (5,854)Account management 46%(2,532)
Billing disputes 16% (816)
WY127
WV316
WI770
WA1,814
VT121
VA3,704
UT454
TX6,860
TN1,471
SD137
SC1,616
RI184
PA2,350
OR924
OK852
OH2,314
NY2,430
NV1,288
NM579
NJ1,710
NH272
NE279
ND116
NC2,757
MT192
MS640
MO1,188
MN900
MI1,738
ME296
MD2,488
MA949
LA997
KY813
KS498
IN877
IL1,752
ID322
IA348
HI453
GA3,803
FL6,730
DE319
DC351
CT530
CO1,429
CA7,974
AZ1,938
AR468
AL1,180
AK243
50 8,000Complaints
6 MONTHLY COMPLAINT REPORT: JUNE 2017

Under 62
This report uses dynamic data as of April 1, 2017 and may differ slightly from other public reports. Older consumers refers to individuals whoself-identified as age 62 and older. Visit consumerfinance.gov/complaint to learn how we handle complaints.
TOP 5 PRODUCTS BY VOLUME
COMPLAINT VOLUME BY STATE
Older vs. under 62 % of total Top issue reported by olderconsumers by product
COMPLAINTS SUBMITTED BY
Older consumers
Older consumer
103,052Complaints handled
since 2011
+6%Complaints handled in
2016 than 2015
98%Timely company
responses since 2011
Older consumercomplaints
Mortgage 26,452
Debt collection 25,561
Credit card 14,430
Credit reporting 13,798
Bank account orservice 12,380
26%16%
25%32%
14%9%
13%22%
12%7%
Problems when you are unable topay 40% (10,580)Continued attempts to collectdebt not owed 49% (12,539)
Billing disputes 19% (2,751)
Incorrect information on creditreport 69% (9,474)Account management 47%(5,782)
WY113
WV433
WI1,130
WA2,049
VT197
VA2,788
UT483
TX6,731
TN1,679
SD148
SC1,436
RI381
PA3,675
OR1,457
OK844
OH3,464
NY6,098
NV1,624
NM789
NJ3,378
NH418
NE341
ND59
NC2,974
MT192
MS521
MO1,500
MN1,026
MI2,509
ME397
MD2,790
MA2,104
LA1,116
KY759
KS582
IN1,073
IL3,077
ID425
IA443
HI429
GA3,981
FL11,673
DE570
DC515
CT1,073
CO1,726
CA14,933
AZ2,710
AR571
AL1,037
AK155
50 15,000Complaints
MONTHLY COMPLAINT REPORT: JUNE 2017 7

This report uses dynamic data as of April 1, 2017 and may differ slightly from other public reports. Servicemembers refers to individuals whoself-identified as servicemembers, veterans, or their dependents. Older consumers refers to individuals who self-identified as age 62 andolder. Visit consumerfinance.gov/complaint to learn how we handle complaints.
TOP 5 PRODUCTS BY VOLUME
Debt collection 435
Mortgage 218
Credit reporting 202
Credit card 124
Bank account or s.. 73
35%27%
18%
16%
10%
10%6%
TOP 5 PRODUCTS BY QUARTERLY PERCENT CHANGE2016 Q4complaints
2017 Q1complaints
% change vs.last quarter
% of total complaints
'12'13'14'15'16'17
Quarterly complainttrend
COMPLAINTS SUBMITTED BY
US consumers1,163,156Complaints handled
since 2011
74,784Servicemember
complaints since 2011
103,052Older consumer
complaints since 2011
+7%Complaints handled in2016 than 2015
97%Timely company
responses since 2011
52%Narratives published
since 2015
Debt collection 316,810
Mortgage 272,153
Credit reporting 195,826
Credit card 118,732
Bank account orservice 115,055
27%
23%
17%
10%
10%
Totalcomplaints
Continued attempts to collectdebt not owed 39% (123,218)Problems when you are unable topay 49% (132,701)Incorrect information on creditreport 76% (148,650)
Billing disputes 17% (19,744)
Account management 45%(51,599)
Top issue reported by consumersby product
Student loan
Prepaid
Credit reporting
Debt collection
Consumer loan
216%
17%
13%
11%
6%
3,121
563
12,984
21,535
4,438
9,852
657
14,733
23,968
4,703
8 MONTHLY COMPLAINT REPORT: JUNE 2017
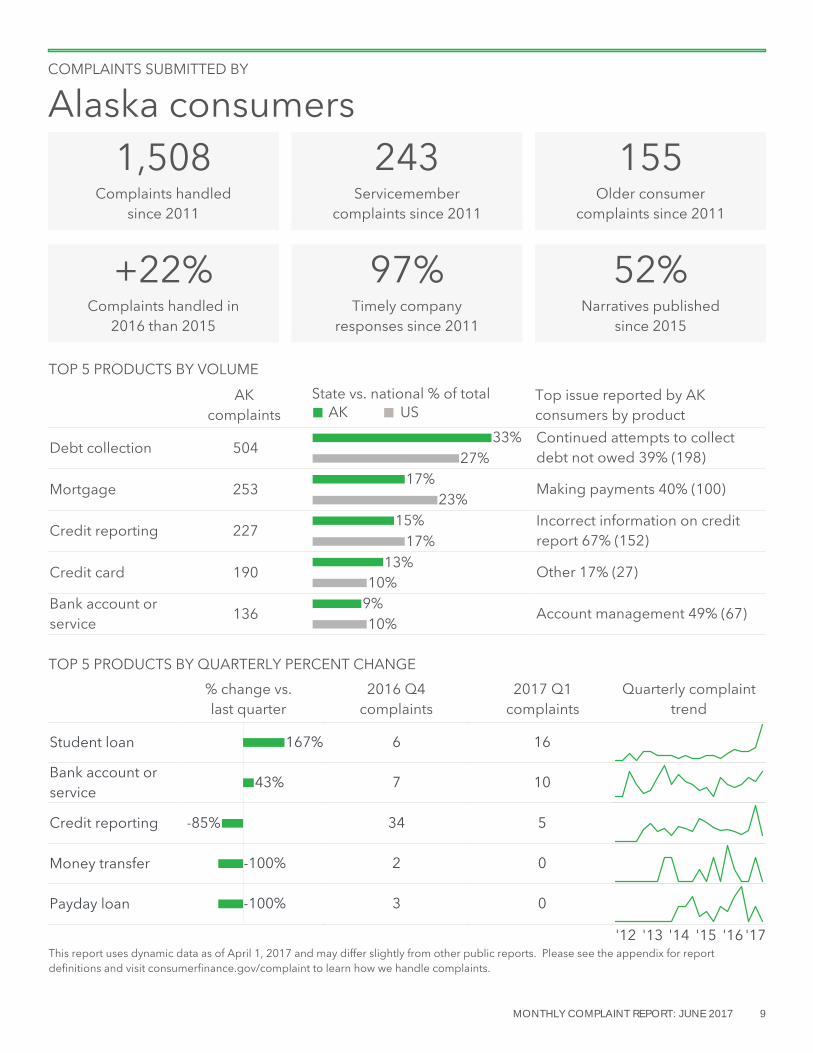
COMPLAINTS SUBMITTED BY
Alaska consumers1,508
Complaints handledsince 2011
+22%Complaints handled in2016 than 2015
97%Timely company
responses since 2011
243Servicemember
complaints since 2011
155Older consumer
complaints since 2011
52%Narratives published
since 2015
Continued attempts to collectdebt not owed 39% (198)
Making payments 40% (100)
Incorrect information on creditreport 67% (152)
Other 17% (27)
Account management 49% (67)
Student loan
Bank account orservice
Credit reporting
Money transfer
Payday loan
167%
43%
-85%
-100%
-100%
6
7
34
2
3
16
10
5
0
0
This report uses dynamic data as of April 1, 2017 and may differ slightly from other public reports. Please see the appendix for reportdefinitions and visit consumerfinance.gov/complaint to learn how we handle complaints.
TOP 5 PRODUCTS BY VOLUME
AK
Debt collection 504
Mortgage 253
Credit reporting 227
Credit card 190
Bank account orservice 136
33%27%
17%23%
15%17%
13%10%
10%9%
AKcomplaints US
Top issue reported by AKconsumers by product
TOP 5 PRODUCTS BY QUARTERLY PERCENT CHANGE2016 Q4complaints
2017 Q1complaints
% change vs.last quarter
State vs. national % of total
'12'13'14'15'16'17
Quarterly complainttrend
MONTHLY COMPLAINT REPORT: JUNE 2017 9

COMPLAINTS SUBMITTED BY
Alabama consumers13,070Complaints handled
since 2011
+3%Complaints handled in2016 than 2015
97%Timely company
responses since 2011
1,180Servicemember
complaints since 2011
1,037Older consumer
complaints since 2011
53%Narratives published
since 2015
Continued attempts to collectdebt not owed 37% (1,574)Incorrect information on creditreport 76% (1,885)Problems when you are unable topay 42% (889)
Account management 44% (505)
Billing disputes 15% (147)
Student loan
Money transfer
Consumer loan
Payday loan
Other financialservice
177%
50%
49%
-37%
-73%
48
2
59
19
11
133
3
88
12
3
This report uses dynamic data as of April 1, 2017 and may differ slightly from other public reports. Please see the appendix for reportdefinitions and visit consumerfinance.gov/complaint to learn how we handle complaints.
TOP 5 PRODUCTS BY VOLUME
AL
Debt collection 4,236
Credit reporting 2,470
Mortgage 2,128
Bank account orservice 1,145
Credit card 969
32%27%
19%17%16%
23%
10%9%
10%7%
ALcomplaints US
Top issue reported by ALconsumers by product
TOP 5 PRODUCTS BY QUARTERLY PERCENT CHANGE2016 Q4complaints
2017 Q1complaints
% change vs.last quarter
State vs. national % of total
'12'13'14'15'16'17
Quarterly complainttrend
10 MONTHLY COMPLAINT REPORT: JUNE 2017
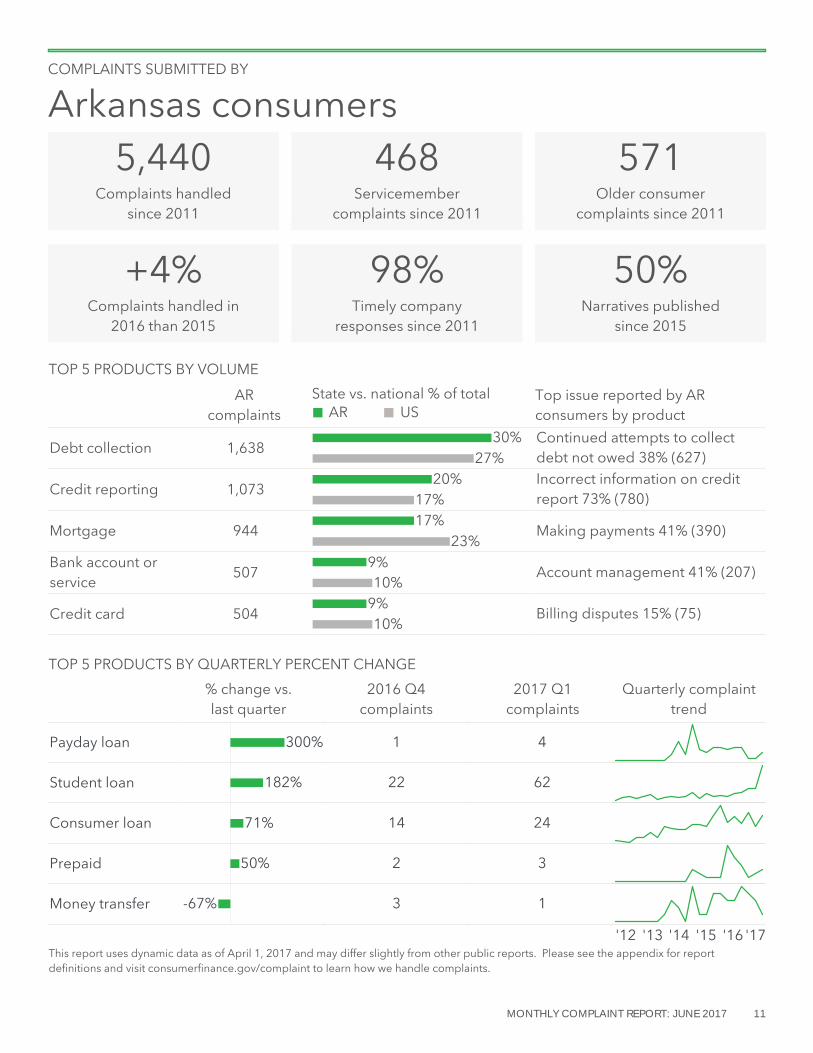
COMPLAINTS SUBMITTED BY
Arkansas consumers5,440
Complaints handledsince 2011
+4%Complaints handled in2016 than 2015
98%Timely company
responses since 2011
468Servicemember
complaints since 2011
571Older consumer
complaints since 2011
50%Narratives published
since 2015
Continued attempts to collectdebt not owed 38% (627)Incorrect information on creditreport 73% (780)
Making payments 41% (390)
Account management 41% (207)
Billing disputes 15% (75)
Payday loan
Student loan
Consumer loan
Prepaid
Money transfer
300%
182%
71%
50%
-67%
1
22
14
2
3
4
62
24
3
1
This report uses dynamic data as of April 1, 2017 and may differ slightly from other public reports. Please see the appendix for reportdefinitions and visit consumerfinance.gov/complaint to learn how we handle complaints.
TOP 5 PRODUCTS BY VOLUME
AR
Debt collection 1,638
Credit reporting 1,073
Mortgage 944
Bank account orservice 507
Credit card 504
30%27%
20%17%17%
23%
10%9%
10%9%
ARcomplaints US
Top issue reported by ARconsumers by product
TOP 5 PRODUCTS BY QUARTERLY PERCENT CHANGE2016 Q4complaints
2017 Q1complaints
% change vs.last quarter
State vs. national % of total
'12'13'14'15'16'17
Quarterly complainttrend
MONTHLY COMPLAINT REPORT: JUNE 2017 11

COMPLAINTS SUBMITTED BY
Arizona consumers25,696Complaints handled
since 2011
+13%Complaints handled in2016 than 2015
97%Timely company
responses since 2011
1,938Servicemember
complaints since 2011
2,710Older consumer
complaints since 2011
51%Narratives published
since 2015
Continued attempts to collectdebt not owed 39% (2,946)Problems when you are unable topay 48% (2,965)Incorrect information on creditreport 75% (2,870)
Billing disputes 16% (409)
Account management 48%(1,170)
Student loan
Payday loan
Money transfer
Other financialservice
Debt collection
181%
71%
50%
38%
23%
67
7
8
8
514
188
12
12
11
633
This report uses dynamic data as of April 1, 2017 and may differ slightly from other public reports. Please see the appendix for reportdefinitions and visit consumerfinance.gov/complaint to learn how we handle complaints.
TOP 5 PRODUCTS BY VOLUME
AZ
Debt collection 7,502
Mortgage 6,232
Credit reporting 3,852
Credit card 2,631
Bank account orservice 2,438
29%27%
24%23%
15%17%
10%10%
10%9%
AZcomplaints US
Top issue reported by AZconsumers by product
TOP 5 PRODUCTS BY QUARTERLY PERCENT CHANGE2016 Q4complaints
2017 Q1complaints
% change vs.last quarter
State vs. national % of total
'12'13'14'15'16'17
Quarterly complainttrend
12 MONTHLY COMPLAINT REPORT: JUNE 2017

COMPLAINTS SUBMITTED BY
California consumers159,158Complaints handled
since 2011
+7%Complaints handled in2016 than 2015
97%Timely company
responses since 2011
7,974Servicemember
complaints since 2011
14,933Older consumer
complaints since 2011
52%Narratives published
since 2015
Problems when you are unable topay 56% (25,907)Continued attempts to collectdebt not owed 41% (16,262)Incorrect information on creditreport 74% (18,364)
Billing disputes 16% (2,441)
Account management 48%(7,408)
Student loan
Credit reporting
Prepaid
Bank account orservice
Payday loan
150%
32%
27%
-14%
-16%
361
1,474
84
1,225
99
903
1,952
107
1,048
83
This report uses dynamic data as of April 1, 2017 and may differ slightly from other public reports. Please see the appendix for reportdefinitions and visit consumerfinance.gov/complaint to learn how we handle complaints.
TOP 5 PRODUCTS BY VOLUME
CA
Mortgage 46,412
Debt collection 40,038
Credit reporting 24,826
Credit card 15,742
Bank account orservice 15,411
29%23%25%27%
16%17%
10%10%10%10%
CAcomplaints US
Top issue reported by CAconsumers by product
TOP 5 PRODUCTS BY QUARTERLY PERCENT CHANGE2016 Q4complaints
2017 Q1complaints
% change vs.last quarter
State vs. national % of total
'12'13'14'15'16'17
Quarterly complainttrend
MONTHLY COMPLAINT REPORT: JUNE 2017 13

COMPLAINTS SUBMITTED BY
Colorado consumers19,574Complaints handled
since 2011
+19%Complaints handled in2016 than 2015
97%Timely company
responses since 2011
1,429Servicemember
complaints since 2011
1,726Older consumer
complaints since 2011
49%Narratives published
since 2015
Continued attempts to collectdebt not owed 38% (2,045)
Making payments 40% (1,890)
Incorrect information on creditreport 76% (2,422)
Billing disputes 16% (359)
Account management 47% (840)
Student loan
Debt collection
Bank account orserviceOther financialservice
Prepaid
184%
22%
-23%
-38%
-53%
57
360
162
8
15
162
439
125
5
7
This report uses dynamic data as of April 1, 2017 and may differ slightly from other public reports. Please see the appendix for reportdefinitions and visit consumerfinance.gov/complaint to learn how we handle complaints.
TOP 5 PRODUCTS BY VOLUME
CO
Debt collection 5,414
Mortgage 4,667
Credit reporting 3,201
Credit card 2,185
Bank account orservice 1,801
28%27%
24%23%
16%17%
11%10%
10%9%
COcomplaints US
Top issue reported by COconsumers by product
TOP 5 PRODUCTS BY QUARTERLY PERCENT CHANGE2016 Q4complaints
2017 Q1complaints
% change vs.last quarter
State vs. national % of total
'12'13'14'15'16'17
Quarterly complainttrend
14 MONTHLY COMPLAINT REPORT: JUNE 2017

COMPLAINTS SUBMITTED BY
Connecticut consumers12,903Complaints handled
since 2011
+13%Complaints handled in2016 than 2015
98%Timely company
responses since 2011
530Servicemember
complaints since 2011
1,073Older consumer
complaints since 2011
52%Narratives published
since 2015
Problems when you are unable topay 49% (1,552)Continued attempts to collectdebt not owed 40% (1,144)Incorrect information on creditreport 74% (1,373)
Billing disputes 20% (337)
Account management 43% (662)
Student loan
Payday loan
Other financialservice
Prepaid
Credit reporting
518%
117%
33%
33%
-37%
33
6
3
3
221
204
13
4
4
140
This report uses dynamic data as of April 1, 2017 and may differ slightly from other public reports. Please see the appendix for reportdefinitions and visit consumerfinance.gov/complaint to learn how we handle complaints.
TOP 5 PRODUCTS BY VOLUME
CT
Mortgage 3,168
Debt collection 2,884
Credit reporting 1,857
Credit card 1,707
Bank account orservice 1,533
25%23%22%
27%14%17%
13%10%12%10%
CTcomplaints US
Top issue reported by CTconsumers by product
TOP 5 PRODUCTS BY QUARTERLY PERCENT CHANGE2016 Q4complaints
2017 Q1complaints
% change vs.last quarter
State vs. national % of total
'12'13'14'15'16'17
Quarterly complainttrend
MONTHLY COMPLAINT REPORT: JUNE 2017 15

COMPLAINTS SUBMITTED BY
District of Columbia consumers6,690
Complaints handledsince 2011
+14%Complaints handled in2016 than 2015
97%Timely company
responses since 2011
351Servicemember
complaints since 2011
515Older consumer
complaints since 2011
51%Narratives published
since 2015
Continued attempts to collectdebt not owed 43% (685)Problems when you are unable topay 39% (538)Incorrect information on creditreport 77% (726)
Account management 43% (401)
Billing disputes 21% (164)
Student loan
Payday loan
Money transfer
Consumer loan
Other financialservice
146%
60%
-29%
-33%
-33%
28
5
7
21
3
69
8
5
14
2
This report uses dynamic data as of April 1, 2017 and may differ slightly from other public reports. Please see the appendix for reportdefinitions and visit consumerfinance.gov/complaint to learn how we handle complaints.
TOP 5 PRODUCTS BY VOLUME
DC
Debt collection 1,588
Mortgage 1,393
Credit reporting 944
Bank account orservice 922
Credit card 790
24%27%
21%23%
14%17%
14%10%12%10%
DCcomplaints US
Top issue reported by DCconsumers by product
TOP 5 PRODUCTS BY QUARTERLY PERCENT CHANGE2016 Q4complaints
2017 Q1complaints
% change vs.last quarter
State vs. national % of total
'12'13'14'15'16'17
Quarterly complainttrend
16 MONTHLY COMPLAINT REPORT: JUNE 2017

COMPLAINTS SUBMITTED BY
Delaware consumers5,889
Complaints handledsince 2011
-4%Complaints handled in2016 than 2015
97%Timely company
responses since 2011
319Servicemember
complaints since 2011
570Older consumer
complaints since 2011
51%Narratives published
since 2015
Continued attempts to collectdebt not owed 38% (623)Problems when you are unable topay 42% (534)Incorrect information on creditreport 81% (698)
Billing disputes 14% (102)
Account management 42% (291)
Prepaid
Student loan
Credit reporting
Money transfer
Credit card
200%
160%
155%
50%
45%
1
10
40
2
33
3
26
102
3
48
This report uses dynamic data as of April 1, 2017 and may differ slightly from other public reports. Please see the appendix for reportdefinitions and visit consumerfinance.gov/complaint to learn how we handle complaints.
TOP 5 PRODUCTS BY VOLUME
DE
Debt collection 1,627
Mortgage 1,268
Credit reporting 861
Credit card 722
Bank account orservice 694
28%27%
22%23%
15%17%
12%10%12%10%
DEcomplaints US
Top issue reported by DEconsumers by product
TOP 5 PRODUCTS BY QUARTERLY PERCENT CHANGE2016 Q4complaints
2017 Q1complaints
% change vs.last quarter
State vs. national % of total
'12'13'14'15'16'17
Quarterly complainttrend
MONTHLY COMPLAINT REPORT: JUNE 2017 17

COMPLAINTS SUBMITTED BY
Florida consumers111,559Complaints handled
since 2011
+6%Complaints handled in2016 than 2015
97%Timely company
responses since 2011
6,730Servicemember
complaints since 2011
11,673Older consumer
complaints since 2011
52%Narratives published
since 2015
Problems when you are unable topay 52% (15,296)Continued attempts to collectdebt not owed 41% (11,530)Incorrect information on creditreport 80% (17,995)
Billing disputes 20% (2,066)
Account management 44%(4,501)
Student loan
Credit reporting
Prepaid
Payday loan
Money transfer
224%
18%
15%
-18%
-30%
191
1,363
39
78
50
619
1,603
45
64
35
This report uses dynamic data as of April 1, 2017 and may differ slightly from other public reports. Please see the appendix for reportdefinitions and visit consumerfinance.gov/complaint to learn how we handle complaints.
TOP 5 PRODUCTS BY VOLUME
FL
Mortgage 29,346
Debt collection 28,457
Credit reporting 22,574
Credit card 10,251
Bank account orservice 10,189
26%23%26%27%
20%17%
10%9%
10%9%
FLcomplaints US
Top issue reported by FLconsumers by product
TOP 5 PRODUCTS BY QUARTERLY PERCENT CHANGE2016 Q4complaints
2017 Q1complaints
% change vs.last quarter
State vs. national % of total
'12'13'14'15'16'17
Quarterly complainttrend
18 MONTHLY COMPLAINT REPORT: JUNE 2017

COMPLAINTS SUBMITTED BY
Georgia consumers50,751Complaints handled
since 2011
+22%Complaints handled in2016 than 2015
97%Timely company
responses since 2011
3,803Servicemember
complaints since 2011
3,981Older consumer
complaints since 2011
53%Narratives published
since 2015
Problems when you are unable topay 51% (6,803)Continued attempts to collectdebt not owed 41% (5,251)Incorrect information on creditreport 76% (7,529)Account management 42%(1,927)
Billing disputes 15% (608)
Student loan
Prepaid
Other financialservice
Consumer loan
Payday loan
255%
72%
67%
20%
-50%
141
18
12
223
36
501
31
20
267
18
This report uses dynamic data as of April 1, 2017 and may differ slightly from other public reports. Please see the appendix for reportdefinitions and visit consumerfinance.gov/complaint to learn how we handle complaints.
TOP 5 PRODUCTS BY VOLUME
GA
Mortgage 13,446
Debt collection 12,833
Credit reporting 9,853
Bank account orservice 4,638
Credit card 3,951
26%23%25%27%
19%17%
10%9%
10%8%
GAcomplaints US
Top issue reported by GAconsumers by product
TOP 5 PRODUCTS BY QUARTERLY PERCENT CHANGE2016 Q4complaints
2017 Q1complaints
% change vs.last quarter
State vs. national % of total
'12'13'14'15'16'17
Quarterly complainttrend
MONTHLY COMPLAINT REPORT: JUNE 2017 19

COMPLAINTS SUBMITTED BY
Hawaii consumers4,042
Complaints handledsince 2011
-14%Complaints handled in2016 than 2015
97%Timely company
responses since 2011
453Servicemember
complaints since 2011
429Older consumer
complaints since 2011
58%Narratives published
since 2015
Problems when you are unable topay 45% (518)Continued attempts to collectdebt not owed 40% (420)Incorrect information on creditreport 73% (482)
Billing disputes 16% (76)
Account management 49% (149)
Student loan
Credit reporting
Consumer loan
Money transfer
Payday loan
188%
38%
33%
-50%
-100%
8
16
9
2
2
23
22
12
1
0
This report uses dynamic data as of April 1, 2017 and may differ slightly from other public reports. Please see the appendix for reportdefinitions and visit consumerfinance.gov/complaint to learn how we handle complaints.
TOP 5 PRODUCTS BY VOLUME
HI
Mortgage 1,159
Debt collection 1,052
Credit reporting 662
Credit card 473
Bank account orservice 306
29%23%26%27%
16%17%
12%10%
10%8%
HIcomplaints US
Top issue reported by HIconsumers by product
TOP 5 PRODUCTS BY QUARTERLY PERCENT CHANGE2016 Q4complaints
2017 Q1complaints
% change vs.last quarter
State vs. national % of total
'12'13'14'15'16'17
Quarterly complainttrend
20 MONTHLY COMPLAINT REPORT: JUNE 2017

COMPLAINTS SUBMITTED BY
Iowa consumers5,466
Complaints handledsince 2011
+19%Complaints handled in2016 than 2015
97%Timely company
responses since 2011
348Servicemember
complaints since 2011
443Older consumer
complaints since 2011
46%Narratives published
since 2015
Continued attempts to collectdebt not owed 37% (679)Incorrect information on creditreport 82% (773)
Making payments 42% (341)
Billing disputes 17% (107)
Account management 43% (174)
Student loan
Bank account orservice
Debt collection
Payday loan
Money transfer
100%
-20%
-23%
-25%
-100%
26
25
131
8
4
52
20
101
6
0
This report uses dynamic data as of April 1, 2017 and may differ slightly from other public reports. Please see the appendix for reportdefinitions and visit consumerfinance.gov/complaint to learn how we handle complaints.
TOP 5 PRODUCTS BY VOLUME
IA
Debt collection 1,827
Credit reporting 941
Mortgage 816
Credit card 634
Bank account orservice 405
33%27%
17%17%15%
23%12%10%
10%7%
IAcomplaints US
Top issue reported by IAconsumers by product
TOP 5 PRODUCTS BY QUARTERLY PERCENT CHANGE2016 Q4complaints
2017 Q1complaints
% change vs.last quarter
State vs. national % of total
'12'13'14'15'16'17
Quarterly complainttrend
MONTHLY COMPLAINT REPORT: JUNE 2017 21
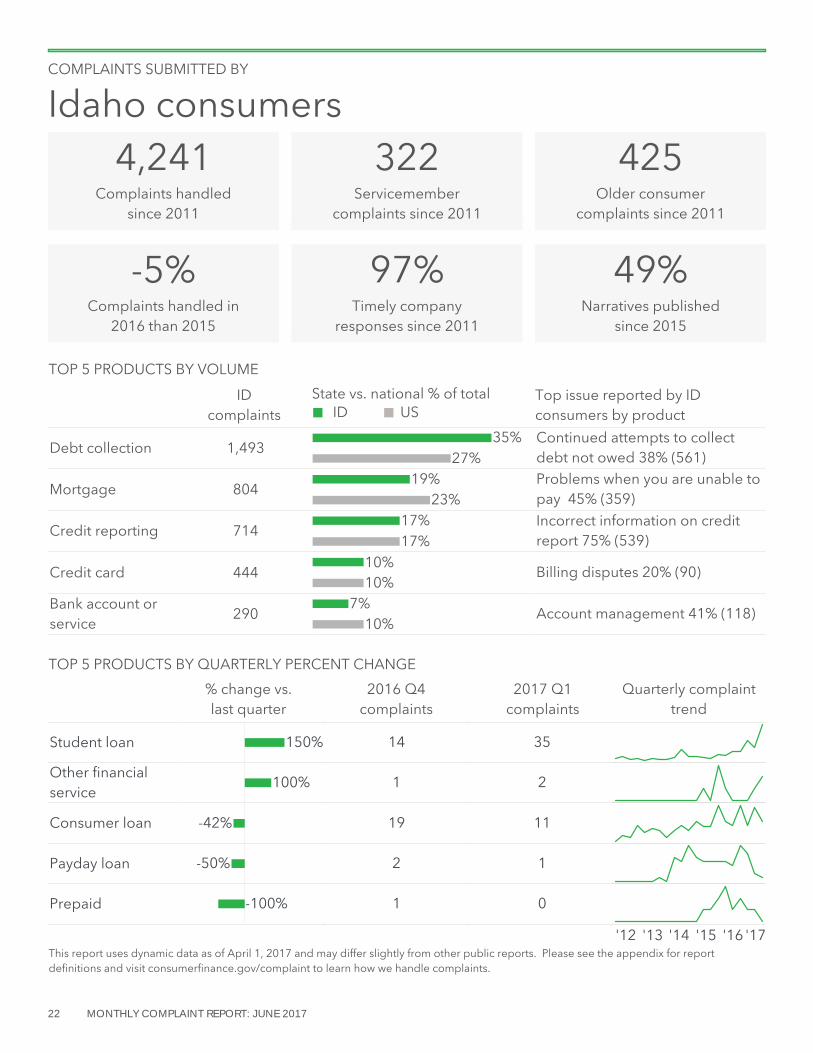
COMPLAINTS SUBMITTED BY
Idaho consumers4,241
Complaints handledsince 2011
-5%Complaints handled in2016 than 2015
97%Timely company
responses since 2011
322Servicemember
complaints since 2011
425Older consumer
complaints since 2011
49%Narratives published
since 2015
Continued attempts to collectdebt not owed 38% (561)Problems when you are unable topay 45% (359)Incorrect information on creditreport 75% (539)
Billing disputes 20% (90)
Account management 41% (118)
Student loan
Other financialservice
Consumer loan
Payday loan
Prepaid
150%
100%
-42%
-50%
-100%
14
1
19
2
1
35
2
11
1
0
This report uses dynamic data as of April 1, 2017 and may differ slightly from other public reports. Please see the appendix for reportdefinitions and visit consumerfinance.gov/complaint to learn how we handle complaints.
TOP 5 PRODUCTS BY VOLUME
ID
Debt collection 1,493
Mortgage 804
Credit reporting 714
Credit card 444
Bank account orservice 290
35%27%
19%23%
17%17%
10%10%
10%7%
IDcomplaints US
Top issue reported by IDconsumers by product
TOP 5 PRODUCTS BY QUARTERLY PERCENT CHANGE2016 Q4complaints
2017 Q1complaints
% change vs.last quarter
State vs. national % of total
'12'13'14'15'16'17
Quarterly complainttrend
22 MONTHLY COMPLAINT REPORT: JUNE 2017

COMPLAINTS SUBMITTED BY
Illinois consumers41,273Complaints handled
since 2011
+13%Complaints handled in2016 than 2015
98%Timely company
responses since 2011
1,752Servicemember
complaints since 2011
3,077Older consumer
complaints since 2011
51%Narratives published
since 2015
Continued attempts to collectdebt not owed 40% (4,346)Problems when you are unable topay 49% (4,534)Incorrect information on creditreport 77% (5,600)Account management 43%(2,012)
Billing disputes 14% (579)
Student loan
Other financialservice
Payday loan
Debt collection
Mortgage
287%
75%
36%
25%
-14%
84
8
25
698
501
325
14
34
875
430
This report uses dynamic data as of April 1, 2017 and may differ slightly from other public reports. Please see the appendix for reportdefinitions and visit consumerfinance.gov/complaint to learn how we handle complaints.
TOP 5 PRODUCTS BY VOLUME
IL
Debt collection 10,866
Mortgage 9,274
Credit reporting 7,298
Bank account orservice 4,633
Credit card 4,287
26%27%
22%23%
18%17%
11%10%10%10%
ILcomplaints US
Top issue reported by ILconsumers by product
TOP 5 PRODUCTS BY QUARTERLY PERCENT CHANGE2016 Q4complaints
2017 Q1complaints
% change vs.last quarter
State vs. national % of total
'12'13'14'15'16'17
Quarterly complainttrend
MONTHLY COMPLAINT REPORT: JUNE 2017 23

COMPLAINTS SUBMITTED BY
Indiana consumers13,794Complaints handled
since 2011
+10%Complaints handled in2016 than 2015
97%Timely company
responses since 2011
877Servicemember
complaints since 2011
1,073Older consumer
complaints since 2011
50%Narratives published
since 2015
Continued attempts to collectdebt not owed 37% (1,594)Problems when you are unable topay 42% (1,038)Incorrect information on creditreport 73% (1,568)
Billing disputes 14% (173)
Account management 41% (511)
Student loan
Money transfer
Debt collection
Credit reporting
Payday loan
280%
57%
45%
40%
-35%
54
7
240
124
26
205
11
349
173
17
This report uses dynamic data as of April 1, 2017 and may differ slightly from other public reports. Please see the appendix for reportdefinitions and visit consumerfinance.gov/complaint to learn how we handle complaints.
TOP 5 PRODUCTS BY VOLUME
IN
Debt collection 4,348
Mortgage 2,484
Credit reporting 2,158
Credit card 1,271
Bank account orservice 1,233
32%27%
18%23%
16%17%
10%9%
10%9%
INcomplaints US
Top issue reported by INconsumers by product
TOP 5 PRODUCTS BY QUARTERLY PERCENT CHANGE2016 Q4complaints
2017 Q1complaints
% change vs.last quarter
State vs. national % of total
'12'13'14'15'16'17
Quarterly complainttrend
24 MONTHLY COMPLAINT REPORT: JUNE 2017

COMPLAINTS SUBMITTED BY
Kansas consumers6,309
Complaints handledsince 2011
+11%Complaints handled in2016 than 2015
97%Timely company
responses since 2011
498Servicemember
complaints since 2011
582Older consumer
complaints since 2011
51%Narratives published
since 2015
Continued attempts to collectdebt not owed 35% (774)
Making payments 41% (417)
Incorrect information on creditreport 76% (699)
Billing disputes 15% (107)
Account management 50% (306)
Student loan
Other financialservice
Credit reporting
Prepaid
Money transfer
480%
100%
40%
-60%
-67%
15
1
50
5
6
87
2
70
2
2
This report uses dynamic data as of April 1, 2017 and may differ slightly from other public reports. Please see the appendix for reportdefinitions and visit consumerfinance.gov/complaint to learn how we handle complaints.
TOP 5 PRODUCTS BY VOLUME
KS
Debt collection 2,198
Mortgage 1,008
Credit reporting 917
Credit card 699
Bank account orservice 610
35%27%
16%23%
15%17%
11%10%10%10%
KScomplaints US
Top issue reported by KSconsumers by product
TOP 5 PRODUCTS BY QUARTERLY PERCENT CHANGE2016 Q4complaints
2017 Q1complaints
% change vs.last quarter
State vs. national % of total
'12'13'14'15'16'17
Quarterly complainttrend
MONTHLY COMPLAINT REPORT: JUNE 2017 25
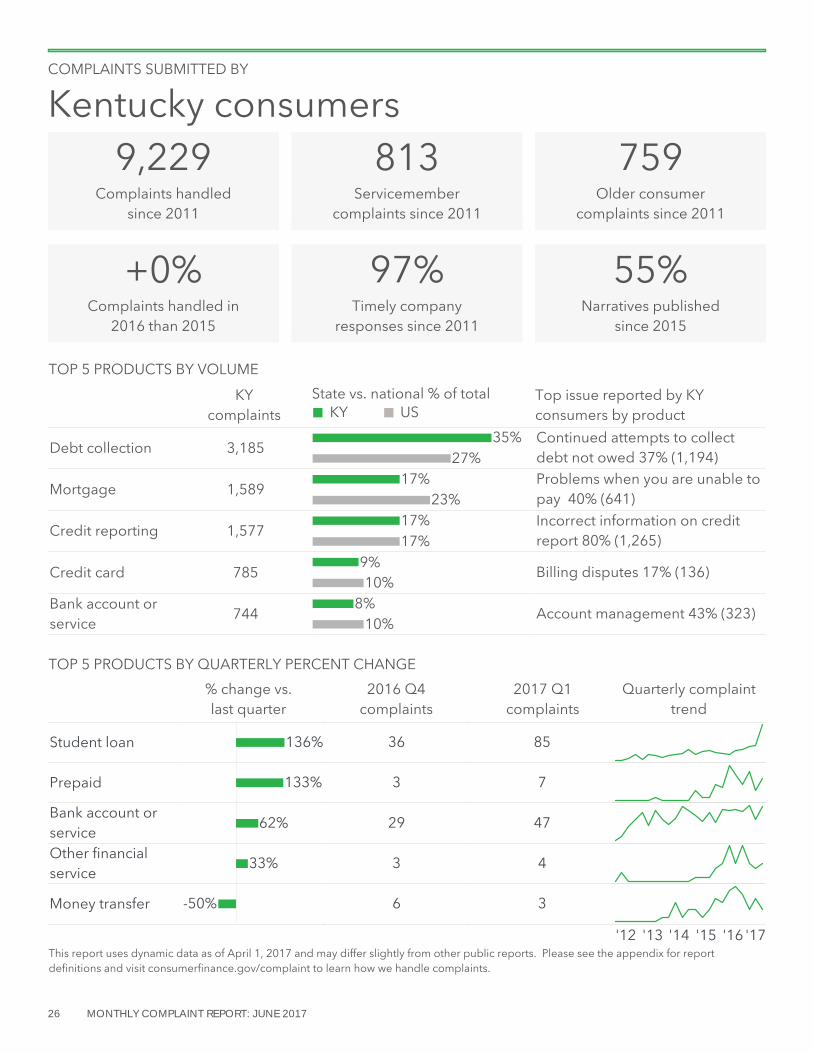
COMPLAINTS SUBMITTED BY
Kentucky consumers9,229
Complaints handledsince 2011
+0%Complaints handled in2016 than 2015
97%Timely company
responses since 2011
813Servicemember
complaints since 2011
759Older consumer
complaints since 2011
55%Narratives published
since 2015
Continued attempts to collectdebt not owed 37% (1,194)Problems when you are unable topay 40% (641)Incorrect information on creditreport 80% (1,265)
Billing disputes 17% (136)
Account management 43% (323)
Student loan
Prepaid
Bank account orserviceOther financialservice
Money transfer
136%
133%
62%
33%
-50%
36
3
29
3
6
85
7
47
4
3
This report uses dynamic data as of April 1, 2017 and may differ slightly from other public reports. Please see the appendix for reportdefinitions and visit consumerfinance.gov/complaint to learn how we handle complaints.
TOP 5 PRODUCTS BY VOLUME
KY
Debt collection 3,185
Mortgage 1,589
Credit reporting 1,577
Credit card 785
Bank account orservice 744
35%27%
17%23%
17%17%
10%9%
10%8%
KYcomplaints US
Top issue reported by KYconsumers by product
TOP 5 PRODUCTS BY QUARTERLY PERCENT CHANGE2016 Q4complaints
2017 Q1complaints
% change vs.last quarter
State vs. national % of total
'12'13'14'15'16'17
Quarterly complainttrend
26 MONTHLY COMPLAINT REPORT: JUNE 2017

COMPLAINTS SUBMITTED BY
Louisiana consumers12,982Complaints handled
since 2011
+16%Complaints handled in2016 than 2015
97%Timely company
responses since 2011
997Servicemember
complaints since 2011
1,116Older consumer
complaints since 2011
52%Narratives published
since 2015
Continued attempts to collectdebt not owed 37% (1,659)Incorrect information on creditreport 79% (1,959)Problems when you are unable topay 44% (1,014)
Account management 47% (471)
Billing disputes 14% (128)
Student loan
Consumer loan
Credit reporting
Other financialservice
Money transfer
373%
39%
-26%
-58%
-63%
26
56
239
12
8
123
78
178
5
3
This report uses dynamic data as of April 1, 2017 and may differ slightly from other public reports. Please see the appendix for reportdefinitions and visit consumerfinance.gov/complaint to learn how we handle complaints.
TOP 5 PRODUCTS BY VOLUME
LA
Debt collection 4,434
Credit reporting 2,495
Mortgage 2,316
Bank account orservice 1,003
Credit card 901
34%27%
19%17%18%23%
10%8%
10%7%
LAcomplaints US
Top issue reported by LAconsumers by product
TOP 5 PRODUCTS BY QUARTERLY PERCENT CHANGE2016 Q4complaints
2017 Q1complaints
% change vs.last quarter
State vs. national % of total
'12'13'14'15'16'17
Quarterly complainttrend
MONTHLY COMPLAINT REPORT: JUNE 2017 27

COMPLAINTS SUBMITTED BY
Massachusetts consumers21,101Complaints handled
since 2011
+5%Complaints handled in2016 than 2015
98%Timely company
responses since 2011
949Servicemember
complaints since 2011
2,104Older consumer
complaints since 2011
54%Narratives published
since 2015
Problems when you are unable topay 48% (2,578)Continued attempts to collectdebt not owed 40% (1,712)
Billing disputes 15% (441)
Account management 44%(1,278)Incorrect information on creditreport 72% (1,938)
Student loan
Other financialservice
Credit reporting
Debt collection
Prepaid
209%
100%
39%
35%
-47%
74
4
148
246
17
229
8
205
333
9
This report uses dynamic data as of April 1, 2017 and may differ slightly from other public reports. Please see the appendix for reportdefinitions and visit consumerfinance.gov/complaint to learn how we handle complaints.
TOP 5 PRODUCTS BY VOLUME
MA
Mortgage 5,416
Debt collection 4,317
Credit card 2,953
Bank account orservice 2,887
Credit reporting 2,675
26%23%
20%27%
14%10%14%
10%13%17%
MAcomplaints US
Top issue reported by MAconsumers by product
TOP 5 PRODUCTS BY QUARTERLY PERCENT CHANGE2016 Q4complaints
2017 Q1complaints
% change vs.last quarter
State vs. national % of total
'12'13'14'15'16'17
Quarterly complainttrend
28 MONTHLY COMPLAINT REPORT: JUNE 2017

COMPLAINTS SUBMITTED BY
Maryland consumers34,905Complaints handled
since 2011
+6%Complaints handled in2016 than 2015
97%Timely company
responses since 2011
2,488Servicemember
complaints since 2011
2,790Older consumer
complaints since 2011
52%Narratives published
since 2015
Problems when you are unable topay 50% (4,991)Continued attempts to collectdebt not owed 41% (3,406)Incorrect information on creditreport 74% (3,813)Account management 44%(1,567)
Billing disputes 16% (555)
Student loan
Money transfer
Prepaid
Payday loan
Other financialservice
164%
35%
-14%
-20%
-26%
101
17
22
35
19
267
23
19
28
14
This report uses dynamic data as of April 1, 2017 and may differ slightly from other public reports. Please see the appendix for reportdefinitions and visit consumerfinance.gov/complaint to learn how we handle complaints.
TOP 5 PRODUCTS BY VOLUME
MD
Mortgage 10,010
Debt collection 8,316
Credit reporting 5,132
Bank account orservice 3,576
Credit card 3,409
29%23%24%27%
15%17%
10%10%10%10%
MDcomplaints US
Top issue reported by MDconsumers by product
TOP 5 PRODUCTS BY QUARTERLY PERCENT CHANGE2016 Q4complaints
2017 Q1complaints
% change vs.last quarter
State vs. national % of total
'12'13'14'15'16'17
Quarterly complainttrend
MONTHLY COMPLAINT REPORT: JUNE 2017 29
COMPLAINTS SUBMITTED BY
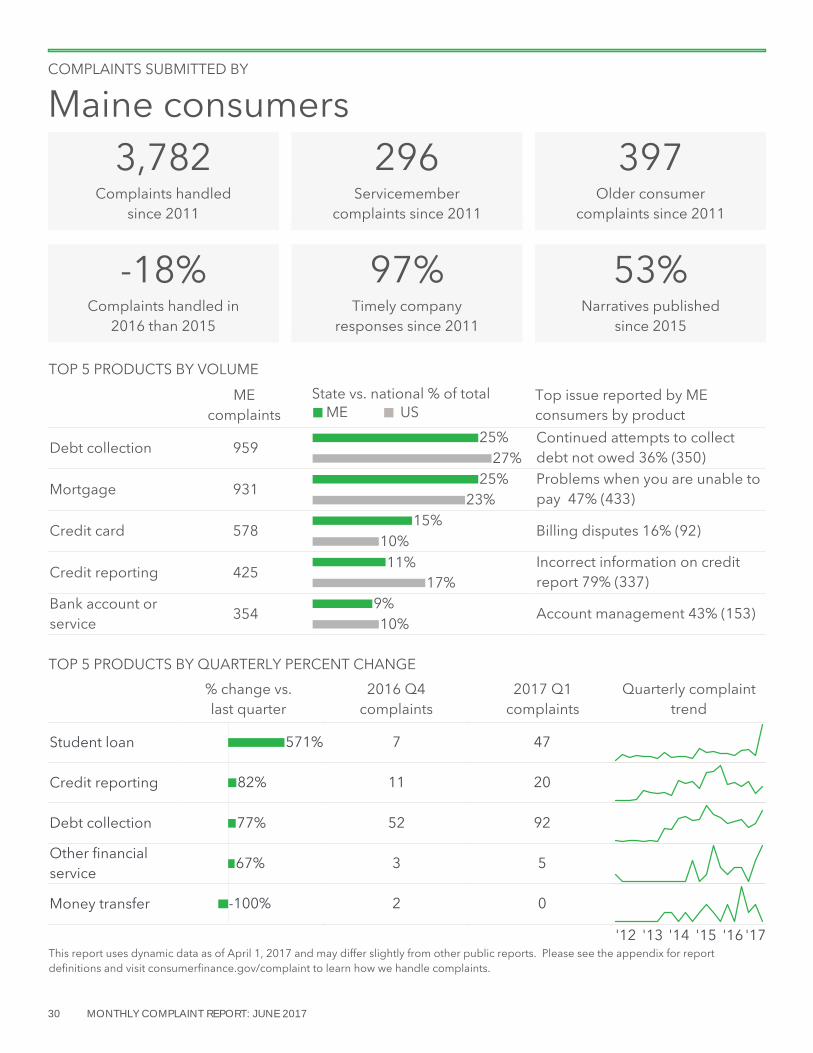
Maine consumers3,782
Complaints handledsince 2011
-18%Complaints handled in2016 than 2015
97%Timely company
responses since 2011
296Servicemember
complaints since 2011
397Older consumer
complaints since 2011
53%Narratives published
since 2015
Continued attempts to collectdebt not owed 36% (350)Problems when you are unable topay 47% (433)
Billing disputes 16% (92)
Incorrect information on creditreport 79% (337)
Account management 43% (153)
Student loan
Credit reporting
Debt collection
Other financialservice
Money transfer
571%
82%
77%
67%
-100%
7
11
52
3
2
47
20
92
5
0
This report uses dynamic data as of April 1, 2017 and may differ slightly from other public reports. Please see the appendix for reportdefinitions and visit consumerfinance.gov/complaint to learn how we handle complaints.
TOP 5 PRODUCTS BY VOLUME
ME
Debt collection 959
Mortgage 931
Credit card 578
Credit reporting 425
Bank account orservice 354
25%27%25%23%
15%10%11%
17%
10%9%
MEcomplaints US
Top issue reported by MEconsumers by product
TOP 5 PRODUCTS BY QUARTERLY PERCENT CHANGE2016 Q4complaints
2017 Q1complaints
% change vs.last quarter
State vs. national % of total
'12'13'14'15'16'17
Quarterly complainttrend
30 MONTHLY COMPLAINT REPORT: JUNE 2017

COMPLAINTS SUBMITTED BY
Michigan consumers29,210Complaints handled
since 2011
-2%Complaints handled in2016 than 2015
98%Timely company
responses since 2011
1,738Servicemember
complaints since 2011
2,509Older consumer
complaints since 2011
51%Narratives published
since 2015
Problems when you are unable topay 55% (4,278)Continued attempts to collectdebt not owed 38% (2,988)Incorrect information on creditreport 74% (3,162)Account management 44%(1,171)
Billing disputes 19% (497)
Student loan
Prepaid
Credit reporting
Debt collection
Consumer loan
185%
111%
42%
28%
26%
94
9
290
450
86
268
19
412
575
108
This report uses dynamic data as of April 1, 2017 and may differ slightly from other public reports. Please see the appendix for reportdefinitions and visit consumerfinance.gov/complaint to learn how we handle complaints.
TOP 5 PRODUCTS BY VOLUME
MI
Mortgage 7,804
Debt collection 7,790
Credit reporting 4,281
Bank account orservice 2,682
Credit card 2,627
27%23%27%27%
15%17%
10%9%
10%9%
MIcomplaints US
Top issue reported by MIconsumers by product
TOP 5 PRODUCTS BY QUARTERLY PERCENT CHANGE2016 Q4complaints
2017 Q1complaints
% change vs.last quarter
State vs. national % of total
'12'13'14'15'16'17
Quarterly complainttrend
MONTHLY COMPLAINT REPORT: JUNE 2017 31

COMPLAINTS SUBMITTED BY
Minnesota consumers13,211Complaints handled
since 2011
+13%Complaints handled in2016 than 2015
97%Timely company
responses since 2011
900Servicemember
complaints since 2011
1,026Older consumer
complaints since 2011
54%Narratives published
since 2015
Continued attempts to collectdebt not owed 39% (1,317)Problems when you are unable topay 50% (1,622)Incorrect information on creditreport 75% (1,318)
Billing disputes 18% (278)
Account management 46% (654)
Other financialservice
Student loan
Payday loan
Credit reporting
Money transfer
140%
90%
70%
50%
-55%
5
63
10
109
11
12
120
17
164
5
This report uses dynamic data as of April 1, 2017 and may differ slightly from other public reports. Please see the appendix for reportdefinitions and visit consumerfinance.gov/complaint to learn how we handle complaints.
TOP 5 PRODUCTS BY VOLUME
MN
Debt collection 3,361
Mortgage 3,263
Credit reporting 1,763
Credit card 1,586
Bank account orservice 1,408
25%27%25%23%
13%17%
12%10%11%10%
MNcomplaints US
Top issue reported by MNconsumers by product
TOP 5 PRODUCTS BY QUARTERLY PERCENT CHANGE2016 Q4complaints
2017 Q1complaints
% change vs.last quarter
State vs. national % of total
'12'13'14'15'16'17
Quarterly complainttrend
32 MONTHLY COMPLAINT REPORT: JUNE 2017

COMPLAINTS SUBMITTED BY
Missouri consumers16,133Complaints handled
since 2011
+11%Complaints handled in2016 than 2015
97%Timely company
responses since 2011
1,188Servicemember
complaints since 2011
1,500Older consumer
complaints since 2011
52%Narratives published
since 2015
Continued attempts to collectdebt not owed 34% (1,711)Problems when you are unable topay 47% (1,609)Incorrect information on creditreport 76% (1,870)
Billing disputes 15% (217)
Account management 43% (581)
Student loan
Prepaid
Credit reporting
Consumer loan
Credit card
280%
75%
49%
45%
43%
46
8
160
71
63
175
14
238
103
90
This report uses dynamic data as of April 1, 2017 and may differ slightly from other public reports. Please see the appendix for reportdefinitions and visit consumerfinance.gov/complaint to learn how we handle complaints.
TOP 5 PRODUCTS BY VOLUME
MO
Debt collection 5,033
Mortgage 3,405
Credit reporting 2,459
Credit card 1,407
Bank account orservice 1,352
31%27%
21%23%
15%17%
10%9%
10%8%
MOcomplaints US
Top issue reported by MOconsumers by product
TOP 5 PRODUCTS BY QUARTERLY PERCENT CHANGE2016 Q4complaints
2017 Q1complaints
% change vs.last quarter
State vs. national % of total
'12'13'14'15'16'17
Quarterly complainttrend
MONTHLY COMPLAINT REPORT: JUNE 2017 33

COMPLAINTS SUBMITTED BY
Mississippi consumers6,297
Complaints handledsince 2011
+3%Complaints handled in2016 than 2015
96%Timely company
responses since 2011
640Servicemember
complaints since 2011
521Older consumer
complaints since 2011
51%Narratives published
since 2015
Continued attempts to collectdebt not owed 35% (744)Incorrect information on creditreport 78% (892)Problems when you are unable topay 44% (465)
Account management 41% (223)
Managing the loan, lease or lineof credit 36% (161)
Student loan
Consumer loan
Payday loan
Money transfer
Other financialservice
107%
96%
-54%
-75%
-75%
30
24
13
4
4
62
47
6
1
1
This report uses dynamic data as of April 1, 2017 and may differ slightly from other public reports. Please see the appendix for reportdefinitions and visit consumerfinance.gov/complaint to learn how we handle complaints.
TOP 5 PRODUCTS BY VOLUME
MS
Debt collection 2,114
Credit reporting 1,142
Mortgage 1,047
Bank account orservice 539
Consumer loan 448
34%27%
18%17%17%
23%
10%9%
7%5%
MScomplaints US
Top issue reported by MSconsumers by product
TOP 5 PRODUCTS BY QUARTERLY PERCENT CHANGE2016 Q4complaints
2017 Q1complaints
% change vs.last quarter
State vs. national % of total
'12'13'14'15'16'17
Quarterly complainttrend
34 MONTHLY COMPLAINT REPORT: JUNE 2017

COMPLAINTS SUBMITTED BY
Montana consumers2,093
Complaints handledsince 2011
+4%Complaints handled in2016 than 2015
96%Timely company
responses since 2011
192Servicemember
complaints since 2011
192Older consumer
complaints since 2011
55%Narratives published
since 2015
Continued attempts to collectdebt not owed 39% (307)
Making payments 42% (149)
Incorrect information on creditreport 73% (226)
Billing disputes 17% (41)
Account management 47% (63)
Consumer loan
Student loan
Debt collection
Credit card
Mortgage
200%
150%
18%
-26%
-33%
2
8
65
19
27
6
20
77
14
18
This report uses dynamic data as of April 1, 2017 and may differ slightly from other public reports. Please see the appendix for reportdefinitions and visit consumerfinance.gov/complaint to learn how we handle complaints.
TOP 5 PRODUCTS BY VOLUME
MT
Debt collection 791
Mortgage 351
Credit reporting 308
Credit card 242
Bank account orservice 134
38%27%
17%23%
15%17%
12%10%
10%6%
MTcomplaints US
Top issue reported by MTconsumers by product
TOP 5 PRODUCTS BY QUARTERLY PERCENT CHANGE2016 Q4complaints
2017 Q1complaints
% change vs.last quarter
State vs. national % of total
'12'13'14'15'16'17
Quarterly complainttrend
MONTHLY COMPLAINT REPORT: JUNE 2017 35

COMPLAINTS SUBMITTED BY
North Carolina consumers32,335Complaints handled
since 2011
+6%Complaints handled in2016 than 2015
97%Timely company
responses since 2011
2,757Servicemember
complaints since 2011
2,974Older consumer
complaints since 2011
53%Narratives published
since 2015
Continued attempts to collectdebt not owed 39% (3,284)Problems when you are unable topay 50% (3,911)Incorrect information on creditreport 72% (4,051)
Billing disputes 16% (514)
Account management 43%(1,324)
Student loan
Money transfer
Consumer loan
Other financialservice
Payday loan
230%
33%
21%
-38%
-45%
104
6
151
16
31
343
8
182
10
17
This report uses dynamic data as of April 1, 2017 and may differ slightly from other public reports. Please see the appendix for reportdefinitions and visit consumerfinance.gov/complaint to learn how we handle complaints.
TOP 5 PRODUCTS BY VOLUME
NC
Debt collection 8,322
Mortgage 7,803
Credit reporting 5,630
Credit card 3,237
Bank account orservice 3,085
26%27%
24%23%
17%17%
10%10%10%10%
NCcomplaints US
Top issue reported by NCconsumers by product
TOP 5 PRODUCTS BY QUARTERLY PERCENT CHANGE2016 Q4complaints
2017 Q1complaints
% change vs.last quarter
State vs. national % of total
'12'13'14'15'16'17
Quarterly complainttrend
36 MONTHLY COMPLAINT REPORT: JUNE 2017

COMPLAINTS SUBMITTED BY
North Dakota consumers1,184
Complaints handledsince 2011
+6%Complaints handled in2016 than 2015
97%Timely company
responses since 2011
116Servicemember
complaints since 2011
59Older consumer
complaints since 2011
55%Narratives published
since 2015
Continued attempts to collectdebt not owed 30% (134)Incorrect information on creditreport 70% (168)Problems when you are unable topay 41% (60)
Billing disputes 22% (26)
Account management 45% (40)
Student loan
Credit reporting
Bank account orservice
Consumer loan
Payday loan
500%
256%
40%
-33%
-100%
1
9
5
6
1
6
32
7
4
0
This report uses dynamic data as of April 1, 2017 and may differ slightly from other public reports. Please see the appendix for reportdefinitions and visit consumerfinance.gov/complaint to learn how we handle complaints.
TOP 5 PRODUCTS BY VOLUME
ND
Debt collection 442
Credit reporting 240
Mortgage 148
Credit card 118
Bank account orservice 89
37%27%
20%17%
13%23%
10%10%
10%8%
NDcomplaints US
Top issue reported by NDconsumers by product
TOP 5 PRODUCTS BY QUARTERLY PERCENT CHANGE2016 Q4complaints
2017 Q1complaints
% change vs.last quarter
State vs. national % of total
'12'13'14'15'16'17
Quarterly complainttrend
MONTHLY COMPLAINT REPORT: JUNE 2017 37

COMPLAINTS SUBMITTED BY
Nebraska consumers3,974
Complaints handledsince 2011
-2%Complaints handled in2016 than 2015
96%Timely company
responses since 2011
279Servicemember
complaints since 2011
341Older consumer
complaints since 2011
52%Narratives published
since 2015
Continued attempts to collectdebt not owed 37% (526)
Making payments 45% (295)
Incorrect information on creditreport 77% (360)
Billing disputes 13% (61)
Account management 42% (163)
Prepaid
Student loan
Credit reporting
Bank account orserviceOther financialservice
400%
215%
40%
-53%
-100%
1
13
20
34
2
5
41
28
16
0
This report uses dynamic data as of April 1, 2017 and may differ slightly from other public reports. Please see the appendix for reportdefinitions and visit consumerfinance.gov/complaint to learn how we handle complaints.
TOP 5 PRODUCTS BY VOLUME
NE
Debt collection 1,412
Mortgage 661
Credit reporting 465
Credit card 457
Bank account orservice 392
36%27%
17%23%
12%17%
11%10%10%10%
NEcomplaints US
Top issue reported by NEconsumers by product
TOP 5 PRODUCTS BY QUARTERLY PERCENT CHANGE2016 Q4complaints
2017 Q1complaints
% change vs.last quarter
State vs. national % of total
'12'13'14'15'16'17
Quarterly complainttrend
38 MONTHLY COMPLAINT REPORT: JUNE 2017

COMPLAINTS SUBMITTED BY
New Hampshire consumers4,983
Complaints handledsince 2011
+1%Complaints handled in2016 than 2015
97%Timely company
responses since 2011
272Servicemember
complaints since 2011
418Older consumer
complaints since 2011
54%Narratives published
since 2015
Problems when you are unable topay 60% (991)Continued attempts to collectdebt not owed 36% (419)Incorrect information on creditreport 75% (433)
Billing disputes 14% (72)
Account management 41% (176)
Money transfer
Prepaid
Student loan
Credit reporting
Payday loan
200%
200%
125%
50%
50%
1
2
20
22
2
3
6
45
33
3
This report uses dynamic data as of April 1, 2017 and may differ slightly from other public reports. Please see the appendix for reportdefinitions and visit consumerfinance.gov/complaint to learn how we handle complaints.
TOP 5 PRODUCTS BY VOLUME
NH
Mortgage 1,644
Debt collection 1,178
Credit reporting 580
Credit card 520
Bank account orservice 430
33%23%24%27%
12%17%
10%10%
10%9%
NHcomplaints US
Top issue reported by NHconsumers by product
TOP 5 PRODUCTS BY QUARTERLY PERCENT CHANGE2016 Q4complaints
2017 Q1complaints
% change vs.last quarter
State vs. national % of total
'12'13'14'15'16'17
Quarterly complainttrend
MONTHLY COMPLAINT REPORT: JUNE 2017 39

COMPLAINTS SUBMITTED BY
New Jersey consumers43,462Complaints handled
since 2011
+8%Complaints handled in2016 than 2015
98%Timely company
responses since 2011
1,710Servicemember
complaints since 2011
3,378Older consumer
complaints since 2011
53%Narratives published
since 2015
Problems when you are unable topay 49% (6,030)Continued attempts to collectdebt not owed 40% (3,837)Incorrect information on creditreport 78% (4,938)
Billing disputes 19% (961)
Account management 44%(2,150)
Student loan
Money transfer
Payday loan
Other financialservice
Debt collection
220%
71%
50%
31%
11%
108
17
20
13
621
346
29
30
17
691
This report uses dynamic data as of April 1, 2017 and may differ slightly from other public reports. Please see the appendix for reportdefinitions and visit consumerfinance.gov/complaint to learn how we handle complaints.
TOP 5 PRODUCTS BY VOLUME
NJ
Mortgage 12,257
Debt collection 9,705
Credit reporting 6,350
Credit card 4,957
Bank account orservice 4,923
28%23%22%
27%15%17%
11%10%11%10%
NJcomplaints US
Top issue reported by NJconsumers by product
TOP 5 PRODUCTS BY QUARTERLY PERCENT CHANGE2016 Q4complaints
2017 Q1complaints
% change vs.last quarter
State vs. national % of total
'12'13'14'15'16'17
Quarterly complainttrend
40 MONTHLY COMPLAINT REPORT: JUNE 2017

COMPLAINTS SUBMITTED BY
New Mexico consumers6,095
Complaints handledsince 2011
+18%Complaints handled in2016 than 2015
96%Timely company
responses since 2011
579Servicemember
complaints since 2011
789Older consumer
complaints since 2011
61%Narratives published
since 2015
Continued attempts to collectdebt not owed 39% (753)Incorrect information on creditreport 78% (908)
Making payments 40% (447)
Account management 43% (234)
Billing disputes 16% (85)
Money transfer
Credit card
Payday loan
Other financialservice
Prepaid
100%
89%
40%
-75%
-100%
1
19
5
4
3
2
36
7
1
0
This report uses dynamic data as of April 1, 2017 and may differ slightly from other public reports. Please see the appendix for reportdefinitions and visit consumerfinance.gov/complaint to learn how we handle complaints.
TOP 5 PRODUCTS BY VOLUME
NM
Debt collection 1,925
Credit reporting 1,161
Mortgage 1,105
Bank account orservice 544
Credit card 534
32%27%
19%17%18%23%
10%9%
10%9%
NMcomplaints US
Top issue reported by NMconsumers by product
TOP 5 PRODUCTS BY QUARTERLY PERCENT CHANGE2016 Q4complaints
2017 Q1complaints
% change vs.last quarter
State vs. national % of total
'12'13'14'15'16'17
Quarterly complainttrend
MONTHLY COMPLAINT REPORT: JUNE 2017 41

COMPLAINTS SUBMITTED BY
Nevada consumers14,559Complaints handled
since 2011
+8%Complaints handled in2016 than 2015
97%Timely company
responses since 2011
1,288Servicemember
complaints since 2011
1,624Older consumer
complaints since 2011
56%Narratives published
since 2015
Continued attempts to collectdebt not owed 39% (1,639)Problems when you are unable topay 44% (1,490)Incorrect information on creditreport 71% (1,823)
Account management 47% (654)
Billing disputes 16% (208)
Student loan
Prepaid
Payday loan
Money transfer
Consumer loan
163%
83%
38%
33%
-40%
24
6
8
6
92
63
11
11
8
55
This report uses dynamic data as of April 1, 2017 and may differ slightly from other public reports. Please see the appendix for reportdefinitions and visit consumerfinance.gov/complaint to learn how we handle complaints.
TOP 5 PRODUCTS BY VOLUME
NV
Debt collection 4,159
Mortgage 3,413
Credit reporting 2,585
Bank account orservice 1,389
Credit card 1,296
29%27%
23%23%
18%17%
10%10%
10%9%
NVcomplaints US
Top issue reported by NVconsumers by product
TOP 5 PRODUCTS BY QUARTERLY PERCENT CHANGE2016 Q4complaints
2017 Q1complaints
% change vs.last quarter
State vs. national % of total
'12'13'14'15'16'17
Quarterly complainttrend
42 MONTHLY COMPLAINT REPORT: JUNE 2017

COMPLAINTS SUBMITTED BY
New York consumers74,072Complaints handled
since 2011
+8%Complaints handled in2016 than 2015
98%Timely company
responses since 2011
2,430Servicemember
complaints since 2011
6,098Older consumer
complaints since 2011
47%Narratives published
since 2015
Problems when you are unable topay 49% (8,449)Continued attempts to collectdebt not owed 40% (6,363)Incorrect information on creditreport 76% (9,557)
Billing disputes 19% (1,934)
Account management 45%(4,207)
Student loan
Prepaid
Other financialservice
Mortgage
Payday loan
205%
80%
29%
-14%
-33%
214
30
41
972
12
652
54
53
835
8
This report uses dynamic data as of April 1, 2017 and may differ slightly from other public reports. Please see the appendix for reportdefinitions and visit consumerfinance.gov/complaint to learn how we handle complaints.
TOP 5 PRODUCTS BY VOLUME
NY
Mortgage 17,207
Debt collection 16,083
Credit reporting 12,586
Credit card 10,445
Bank account orservice 9,414
23%23%22%
27%17%17%
14%10%13%
10%
NYcomplaints US
Top issue reported by NYconsumers by product
TOP 5 PRODUCTS BY QUARTERLY PERCENT CHANGE2016 Q4complaints
2017 Q1complaints
% change vs.last quarter
State vs. national % of total
'12'13'14'15'16'17
Quarterly complainttrend
MONTHLY COMPLAINT REPORT: JUNE 2017 43

COMPLAINTS SUBMITTED BY
Ohio consumers35,511Complaints handled
since 2011
+0%Complaints handled in2016 than 2015
97%Timely company
responses since 2011
2,314Servicemember
complaints since 2011
3,464Older consumer
complaints since 2011
54%Narratives published
since 2015
Continued attempts to collectdebt not owed 34% (3,638)Problems when you are unable topay 44% (3,224)Incorrect information on creditreport 75% (3,699)
Billing disputes 18% (698)
Account management 44%(1,520)
Student loan
Money transfer
Bank account orservice
Credit reporting
Other financialservice
236%
57%
23%
19%
-30%
121
7
184
345
20
406
11
226
410
14
This report uses dynamic data as of April 1, 2017 and may differ slightly from other public reports. Please see the appendix for reportdefinitions and visit consumerfinance.gov/complaint to learn how we handle complaints.
TOP 5 PRODUCTS BY VOLUME
OH
Debt collection 10,611
Mortgage 7,282
Credit reporting 4,904
Credit card 3,982
Bank account orservice 3,420
30%27%
21%23%
14%17%
11%10%10%10%
OHcomplaints US
Top issue reported by OHconsumers by product
TOP 5 PRODUCTS BY QUARTERLY PERCENT CHANGE2016 Q4complaints
2017 Q1complaints
% change vs.last quarter
State vs. national % of total
'12'13'14'15'16'17
Quarterly complainttrend
44 MONTHLY COMPLAINT REPORT: JUNE 2017

COMPLAINTS SUBMITTED BY
Oklahoma consumers8,676
Complaints handledsince 2011
+11%Complaints handled in2016 than 2015
97%Timely company
responses since 2011
852Servicemember
complaints since 2011
844Older consumer
complaints since 2011
52%Narratives published
since 2015
Continued attempts to collectdebt not owed 40% (1,234)Incorrect information on creditreport 73% (1,029)
Making payments 44% (616)
Billing disputes 16% (114)
Account management 45% (279)
Student loan
Other financialservice
Credit card
Payday loan
Money transfer
154%
67%
44%
-42%
-50%
26
3
32
24
6
66
5
46
14
3
This report uses dynamic data as of April 1, 2017 and may differ slightly from other public reports. Please see the appendix for reportdefinitions and visit consumerfinance.gov/complaint to learn how we handle complaints.
TOP 5 PRODUCTS BY VOLUME
OK
Debt collection 3,102
Credit reporting 1,415
Mortgage 1,401
Credit card 729
Bank account orservice 615
36%27%
16%17%16%
23%
10%8%
10%7%
OKcomplaints US
Top issue reported by OKconsumers by product
TOP 5 PRODUCTS BY QUARTERLY PERCENT CHANGE2016 Q4complaints
2017 Q1complaints
% change vs.last quarter
State vs. national % of total
'12'13'14'15'16'17
Quarterly complainttrend
MONTHLY COMPLAINT REPORT: JUNE 2017 45

COMPLAINTS SUBMITTED BY
Oregon consumers13,368Complaints handled
since 2011
+5%Complaints handled in2016 than 2015
97%Timely company
responses since 2011
924Servicemember
complaints since 2011
1,457Older consumer
complaints since 2011
54%Narratives published
since 2015
Continued attempts to collectdebt not owed 41% (1,572)Problems when you are unable topay 46% (1,510)Incorrect information on creditreport 70% (1,241)
Billing disputes 16% (230)
Account management 46% (628)
Student loan
Payday loan
Credit reporting
Consumer loan
Money transfer
238%
133%
74%
-48%
-71%
40
6
88
63
7
135
14
153
33
2
This report uses dynamic data as of April 1, 2017 and may differ slightly from other public reports. Please see the appendix for reportdefinitions and visit consumerfinance.gov/complaint to learn how we handle complaints.
TOP 5 PRODUCTS BY VOLUME
OR
Debt collection 3,844
Mortgage 3,274
Credit reporting 1,776
Credit card 1,459
Bank account orservice 1,367
29%27%
24%23%
13%17%
11%10%10%10%
ORcomplaints US
Top issue reported by ORconsumers by product
TOP 5 PRODUCTS BY QUARTERLY PERCENT CHANGE2016 Q4complaints
2017 Q1complaints
% change vs.last quarter
State vs. national % of total
'12'13'14'15'16'17
Quarterly complainttrend
46 MONTHLY COMPLAINT REPORT: JUNE 2017

COMPLAINTS SUBMITTED BY
Pennsylvania consumers41,264Complaints handled
since 2011
+3%Complaints handled in2016 than 2015
97%Timely company
responses since 2011
2,350Servicemember
complaints since 2011
3,675Older consumer
complaints since 2011
52%Narratives published
since 2015
Continued attempts to collectdebt not owed 40% (4,359)Problems when you are unable topay 42% (3,771)Incorrect information on creditreport 76% (4,789)Account management 41%(1,982)
Billing disputes 16% (730)
Student loan
Credit reporting
Payday loan
Prepaid
Other financialservice
229%
40%
24%
17%
-39%
158
336
25
23
31
520
470
31
27
19
This report uses dynamic data as of April 1, 2017 and may differ slightly from other public reports. Please see the appendix for reportdefinitions and visit consumerfinance.gov/complaint to learn how we handle complaints.
TOP 5 PRODUCTS BY VOLUME
PA
Debt collection 10,851
Mortgage 8,897
Credit reporting 6,306
Bank account orservice 4,870
Credit card 4,514
26%27%
22%23%
15%17%
12%10%11%10%
PAcomplaints US
Top issue reported by PAconsumers by product
TOP 5 PRODUCTS BY QUARTERLY PERCENT CHANGE2016 Q4complaints
2017 Q1complaints
% change vs.last quarter
State vs. national % of total
'12'13'14'15'16'17
Quarterly complainttrend
MONTHLY COMPLAINT REPORT: JUNE 2017 47

COMPLAINTS SUBMITTED BY
Rhode Island consumers3,633
Complaints handledsince 2011
-8%Complaints handled in2016 than 2015
98%Timely company
responses since 2011
184Servicemember
complaints since 2011
381Older consumer
complaints since 2011
49%Narratives published
since 2015
Continued attempts to collectdebt not owed 38% (373)
Making payments 43% (341)
Account management 34% (162)
Billing disputes 17% (77)
Incorrect information on creditreport 74% (321)
Payday loan
Credit reporting
Student loan
Mortgage
Other financialservice
700%
85%
77%
54%
50%
1
13
13
35
2
8
24
23
54
3
This report uses dynamic data as of April 1, 2017 and may differ slightly from other public reports. Please see the appendix for reportdefinitions and visit consumerfinance.gov/complaint to learn how we handle complaints.
TOP 5 PRODUCTS BY VOLUME
RI
Debt collection 970
Mortgage 802
Bank account orservice 477
Credit card 449
Credit reporting 433
27%27%
22%23%
13%10%12%10%12%
17%
RIcomplaints US
Top issue reported by RIconsumers by product
TOP 5 PRODUCTS BY QUARTERLY PERCENT CHANGE2016 Q4complaints
2017 Q1complaints
% change vs.last quarter
State vs. national % of total
'12'13'14'15'16'17
Quarterly complainttrend
48 MONTHLY COMPLAINT REPORT: JUNE 2017

COMPLAINTS SUBMITTED BY
South Carolina consumers15,765Complaints handled
since 2011
+2%Complaints handled in2016 than 2015
97%Timely company
responses since 2011
1,616Servicemember
complaints since 2011
1,436Older consumer
complaints since 2011
51%Narratives published
since 2015
Continued attempts to collectdebt not owed 38% (1,842)Problems when you are unable topay 45% (1,410)Incorrect information on creditreport 76% (2,242)
Billing disputes 16% (192)
Account management 46% (563)
Student loan
Money transfer
Other financialservice
Credit reporting
Bank account orservice
340%
67%
50%
48%
-35%
45
3
6
190
101
198
5
9
282
66
This report uses dynamic data as of April 1, 2017 and may differ slightly from other public reports. Please see the appendix for reportdefinitions and visit consumerfinance.gov/complaint to learn how we handle complaints.
TOP 5 PRODUCTS BY VOLUME
SC
Debt collection 4,910
Mortgage 3,155
Credit reporting 2,947
Credit card 1,217
Bank account orservice 1,212
31%27%
20%23%
19%17%
10%8%
10%8%
SCcomplaints US
Top issue reported by SCconsumers by product
TOP 5 PRODUCTS BY QUARTERLY PERCENT CHANGE2016 Q4complaints
2017 Q1complaints
% change vs.last quarter
State vs. national % of total
'12'13'14'15'16'17
Quarterly complainttrend
MONTHLY COMPLAINT REPORT: JUNE 2017 49

COMPLAINTS SUBMITTED BY
South Dakota consumers1,773
Complaints handledsince 2011
-4%Complaints handled in2016 than 2015
95%Timely company
responses since 2011
137Servicemember
complaints since 2011
148Older consumer
complaints since 2011
50%Narratives published
since 2015
Continued attempts to collectdebt not owed 30% (192)
Making payments 43% (102)
Incorrect information on creditreport 74% (171)
Billing disputes 16% (36)
Account management 48% (72)
Student loan
Credit card
Payday loan
Prepaid
Consumer loan
350%
333%
200%
200%
-33%
4
6
1
1
12
18
26
3
3
8
This report uses dynamic data as of April 1, 2017 and may differ slightly from other public reports. Please see the appendix for reportdefinitions and visit consumerfinance.gov/complaint to learn how we handle complaints.
TOP 5 PRODUCTS BY VOLUME
SD
Debt collection 638
Mortgage 239
Credit reporting 232
Credit card 231
Bank account orservice 151
36%27%
13%23%
13%17%
13%10%
10%9%
SDcomplaints US
Top issue reported by SDconsumers by product
TOP 5 PRODUCTS BY QUARTERLY PERCENT CHANGE2016 Q4complaints
2017 Q1complaints
% change vs.last quarter
State vs. national % of total
'12'13'14'15'16'17
Quarterly complainttrend
50 MONTHLY COMPLAINT REPORT: JUNE 2017

COMPLAINTS SUBMITTED BY
Tennessee consumers19,266Complaints handled
since 2011
+10%Complaints handled in2016 than 2015
97%Timely company
responses since 2011
1,471Servicemember
complaints since 2011
1,679Older consumer
complaints since 2011
54%Narratives published
since 2015
Continued attempts to collectdebt not owed 40% (2,643)Problems when you are unable topay 43% (1,520)Incorrect information on creditreport 76% (2,246)
Account management 44% (742)
Billing disputes 16% (255)
Student loan
Prepaid
Mortgage
Credit reporting
Money transfer
213%
50%
24%
22%
-33%
56
4
147
205
9
175
6
183
251
6
This report uses dynamic data as of April 1, 2017 and may differ slightly from other public reports. Please see the appendix for reportdefinitions and visit consumerfinance.gov/complaint to learn how we handle complaints.
TOP 5 PRODUCTS BY VOLUME
TN
Debt collection 6,624
Mortgage 3,500
Credit reporting 2,964
Bank account orservice 1,691
Credit card 1,624
34%27%
18%23%
15%17%
10%9%
10%8%
TNcomplaints US
Top issue reported by TNconsumers by product
TOP 5 PRODUCTS BY QUARTERLY PERCENT CHANGE2016 Q4complaints
2017 Q1complaints
% change vs.last quarter
State vs. national % of total
'12'13'14'15'16'17
Quarterly complainttrend
MONTHLY COMPLAINT REPORT: JUNE 2017 51
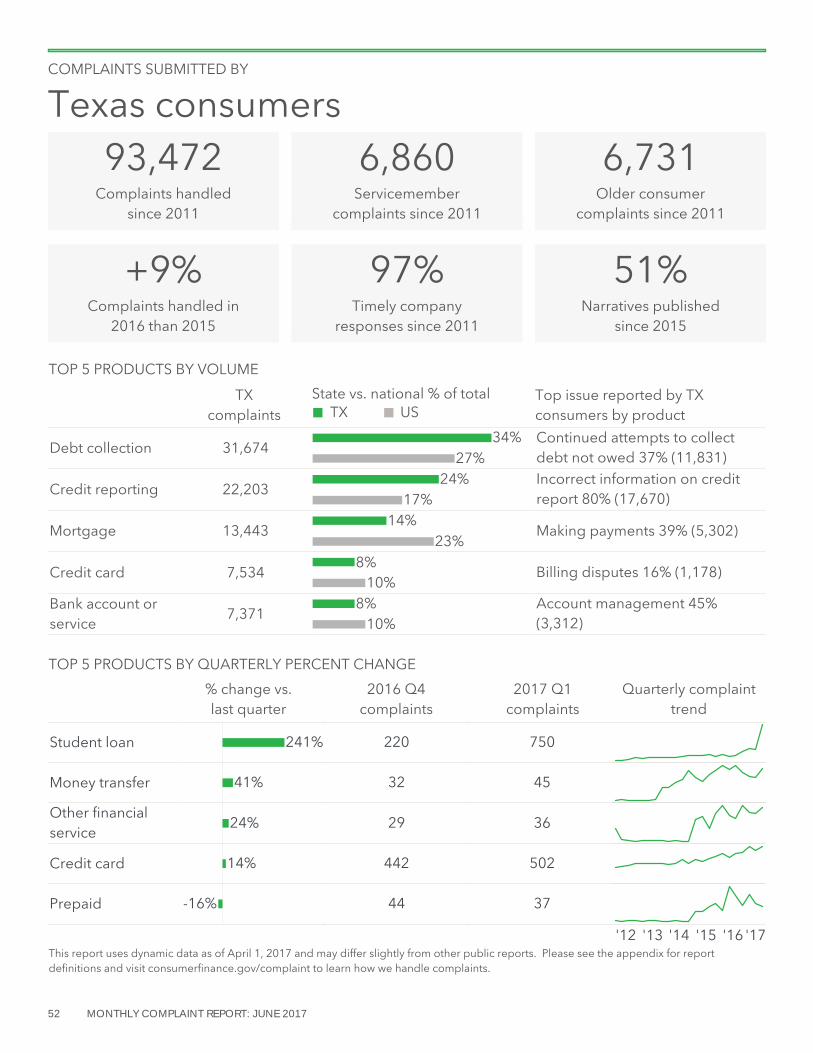
COMPLAINTS SUBMITTED BY
Texas consumers93,472Complaints handled
since 2011
+9%Complaints handled in2016 than 2015
97%Timely company
responses since 2011
6,860Servicemember
complaints since 2011
6,731Older consumer
complaints since 2011
51%Narratives published
since 2015
Continued attempts to collectdebt not owed 37% (11,831)Incorrect information on creditreport 80% (17,670)
Making payments 39% (5,302)
Billing disputes 16% (1,178)
Account management 45%(3,312)
Student loan
Money transfer
Other financialservice
Credit card
Prepaid
241%
41%
24%
14%
-16%
220
32
29
442
44
750
45
36
502
37
This report uses dynamic data as of April 1, 2017 and may differ slightly from other public reports. Please see the appendix for reportdefinitions and visit consumerfinance.gov/complaint to learn how we handle complaints.
TOP 5 PRODUCTS BY VOLUME
TX
Debt collection 31,674
Credit reporting 22,203
Mortgage 13,443
Credit card 7,534
Bank account orservice 7,371
34%27%
24%17%
14%23%
10%8%
10%8%
TXcomplaints US
Top issue reported by TXconsumers by product
TOP 5 PRODUCTS BY QUARTERLY PERCENT CHANGE2016 Q4complaints
2017 Q1complaints
% change vs.last quarter
State vs. national % of total
'12'13'14'15'16'17
Quarterly complainttrend
52 MONTHLY COMPLAINT REPORT: JUNE 2017

COMPLAINTS SUBMITTED BY
Utah consumers6,709
Complaints handledsince 2011
+6%Complaints handled in2016 than 2015
97%Timely company
responses since 2011
454Servicemember
complaints since 2011
483Older consumer
complaints since 2011
60%Narratives published
since 2015
Continued attempts to collectdebt not owed 40% (880)Problems when you are unable topay 43% (645)Incorrect information on creditreport 65% (649)
Billing disputes 15% (102)
Account management 49% (236)
Money transfer
Student loan
Bank account orservice
Prepaid
Other financialservice
50%
50%
-41%
-67%
-100%
2
24
39
3
3
3
36
23
1
0
This report uses dynamic data as of April 1, 2017 and may differ slightly from other public reports. Please see the appendix for reportdefinitions and visit consumerfinance.gov/complaint to learn how we handle complaints.
TOP 5 PRODUCTS BY VOLUME
UT
Debt collection 2,218
Mortgage 1,494
Credit reporting 1,002
Credit card 683
Bank account orservice 484
33%27%
22%23%
15%17%
10%10%
10%7%
UTcomplaints US
Top issue reported by UTconsumers by product
TOP 5 PRODUCTS BY QUARTERLY PERCENT CHANGE2016 Q4complaints
2017 Q1complaints
% change vs.last quarter
State vs. national % of total
'12'13'14'15'16'17
Quarterly complainttrend
MONTHLY COMPLAINT REPORT: JUNE 2017 53

COMPLAINTS SUBMITTED BY
Virginia consumers35,954Complaints handled
since 2011
+7%Complaints handled in2016 than 2015
97%Timely company
responses since 2011
3,704Servicemember
complaints since 2011
2,788Older consumer
complaints since 2011
52%Narratives published
since 2015
Continued attempts to collectdebt not owed 40% (3,739)Problems when you are unable topay 44% (3,683)Incorrect information on creditreport 73% (4,645)
Billing disputes 15% (581)
Account management 44%(1,481)
Student loan
Other financialservice
Payday loan
Credit reporting
Bank account orservice
213%
47%
13%
12%
-10%
89
15
38
337
227
279
22
43
377
205
This report uses dynamic data as of April 1, 2017 and may differ slightly from other public reports. Please see the appendix for reportdefinitions and visit consumerfinance.gov/complaint to learn how we handle complaints.
TOP 5 PRODUCTS BY VOLUME
VA
Debt collection 9,462
Mortgage 8,299
Credit reporting 6,332
Credit card 3,846
Bank account orservice 3,358
26%27%
23%23%
18%17%
11%10%
10%9%
VAcomplaints US
Top issue reported by VAconsumers by product
TOP 5 PRODUCTS BY QUARTERLY PERCENT CHANGE2016 Q4complaints
2017 Q1complaints
% change vs.last quarter
State vs. national % of total
'12'13'14'15'16'17
Quarterly complainttrend
54 MONTHLY COMPLAINT REPORT: JUNE 2017

COMPLAINTS SUBMITTED BY
Vermont consumers1,837
Complaints handledsince 2011
-13%Complaints handled in2016 than 2015
97%Timely company
responses since 2011
121Servicemember
complaints since 2011
197Older consumer
complaints since 2011
50%Narratives published
since 2015
Problems when you are unable topay 46% (198)Continued attempts to collectdebt not owed 36% (138)
Billing disputes 19% (52)
Incorrect information on creditreport 68% (170)
Account management 45% (100)
Credit reporting
Student loan
Mortgage
Bank account orservice
Prepaid
100%
78%
58%
-31%
-100%
6
9
12
13
1
12
16
19
9
0
This report uses dynamic data as of April 1, 2017 and may differ slightly from other public reports. Please see the appendix for reportdefinitions and visit consumerfinance.gov/complaint to learn how we handle complaints.
TOP 5 PRODUCTS BY VOLUME
VT
Mortgage 428
Debt collection 387
Credit card 275
Credit reporting 249
Bank account orservice 220
23%23%21%
27%15%
10%14%17%
12%10%
VTcomplaints US
Top issue reported by VTconsumers by product
TOP 5 PRODUCTS BY QUARTERLY PERCENT CHANGE2016 Q4complaints
2017 Q1complaints
% change vs.last quarter
State vs. national % of total
'12'13'14'15'16'17
Quarterly complainttrend
MONTHLY COMPLAINT REPORT: JUNE 2017 55

COMPLAINTS SUBMITTED BY
Washington consumers23,697Complaints handled
since 2011
+7%Complaints handled in2016 than 2015
97%Timely company
responses since 2011
1,814Servicemember
complaints since 2011
2,049Older consumer
complaints since 2011
53%Narratives published
since 2015
Continued attempts to collectdebt not owed 38% (2,469)Problems when you are unable topay 50% (3,145)Incorrect information on creditreport 68% (2,380)
Billing disputes 16% (380)
Account management 47% (982)
Student loan
Other financialservice
Prepaid
Money transfer
Payday loan
530%
100%
64%
-20%
-48%
70
4
11
10
25
441
8
18
8
13
This report uses dynamic data as of April 1, 2017 and may differ slightly from other public reports. Please see the appendix for reportdefinitions and visit consumerfinance.gov/complaint to learn how we handle complaints.
TOP 5 PRODUCTS BY VOLUME
WA
Debt collection 6,564
Mortgage 6,288
Credit reporting 3,491
Credit card 2,326
Bank account orservice 2,105
28%27%27%
23%15%17%
10%10%
10%9%
WAcomplaints US
Top issue reported by WAconsumers by product
TOP 5 PRODUCTS BY QUARTERLY PERCENT CHANGE2016 Q4complaints
2017 Q1complaints
% change vs.last quarter
State vs. national % of total
'12'13'14'15'16'17
Quarterly complainttrend
56 MONTHLY COMPLAINT REPORT: JUNE 2017

COMPLAINTS SUBMITTED BY
Wisconsin consumers13,285Complaints handled
since 2011
-2%Complaints handled in2016 than 2015
97%Timely company
responses since 2011
770Servicemember
complaints since 2011
1,130Older consumer
complaints since 2011
51%Narratives published
since 2015
Continued attempts to collectdebt not owed 36% (1,436)Problems when you are unable topay 44% (1,247)
Billing disputes 16% (278)
Incorrect information on creditreport 73% (1,171)
Account management 45% (564)
Student loan
Credit reporting
Mortgage
Money transfer
Debt collection
160%
91%
39%
33%
22%
40
69
97
6
215
104
132
135
8
262
This report uses dynamic data as of April 1, 2017 and may differ slightly from other public reports. Please see the appendix for reportdefinitions and visit consumerfinance.gov/complaint to learn how we handle complaints.
TOP 5 PRODUCTS BY VOLUME
WI
Debt collection 4,006
Mortgage 2,833
Credit card 1,709
Credit reporting 1,597
Bank account orservice 1,246
30%27%
21%23%
13%10%12%
17%
10%9%
WIcomplaints US
Top issue reported by WIconsumers by product
TOP 5 PRODUCTS BY QUARTERLY PERCENT CHANGE2016 Q4complaints
2017 Q1complaints
% change vs.last quarter
State vs. national % of total
'12'13'14'15'16'17
Quarterly complainttrend
MONTHLY COMPLAINT REPORT: JUNE 2017 57

COMPLAINTS SUBMITTED BY
West Virginia consumers3,267
Complaints handledsince 2011
-2%Complaints handled in2016 than 2015
97%Timely company
responses since 2011
316Servicemember
complaints since 2011
433Older consumer
complaints since 2011
55%Narratives published
since 2015
Continued attempts to collectdebt not owed 42% (385)Incorrect information on creditreport 72% (474)Problems when you are unable topay 43% (219)
Billing disputes 14% (47)
Account management 41% (127)
Student loan
Prepaid
Payday loan
Credit card
Debt collection
575%
300%
200%
56%
-25%
8
1
1
16
64
54
4
3
25
48
This report uses dynamic data as of April 1, 2017 and may differ slightly from other public reports. Please see the appendix for reportdefinitions and visit consumerfinance.gov/complaint to learn how we handle complaints.
TOP 5 PRODUCTS BY VOLUME
WV
Debt collection 926
Credit reporting 659
Mortgage 505
Credit card 341
Bank account orservice 308
28%27%
20%17%15%
23%10%10%
10%9%
WVcomplaints US
Top issue reported by WVconsumers by product
TOP 5 PRODUCTS BY QUARTERLY PERCENT CHANGE2016 Q4complaints
2017 Q1complaints
% change vs.last quarter
State vs. national % of total
'12'13'14'15'16'17
Quarterly complainttrend
58 MONTHLY COMPLAINT REPORT: JUNE 2017

COMPLAINTS SUBMITTED BY
Wyoming consumers1,245
Complaints handledsince 2011
+6%Complaints handled in2016 than 2015
94%Timely company
responses since 2011
127Servicemember
complaints since 2011
113Older consumer
complaints since 2011
52%Narratives published
since 2015
Continued attempts to collectdebt not owed 34% (150)Problems when you are unable topay 43% (93)Incorrect information on creditreport 74% (149)
Other 30% (36)
Account management 44% (32)
Credit card
Credit reporting
Debt collection
Consumer loan
Payday loan
150%
67%
54%
-75%
-100%
4
9
24
4
1
10
15
37
1
0
This report uses dynamic data as of April 1, 2017 and may differ slightly from other public reports. Please see the appendix for reportdefinitions and visit consumerfinance.gov/complaint to learn how we handle complaints.
TOP 5 PRODUCTS BY VOLUME
WY
Debt collection 435
Mortgage 218
Credit reporting 202
Credit card 124
Bank account orservice 73
35%27%
18%23%
16%17%
10%10%
10%6%
WYcomplaints US
Top issue reported by WYconsumers by product
TOP 5 PRODUCTS BY QUARTERLY PERCENT CHANGE2016 Q4complaints
2017 Q1complaints
% change vs.last quarter
State vs. national % of total
'12'13'14'15'16'17
Quarterly complainttrend
MONTHLY COMPLAINT REPORT: JUNE 2017 59

4. Definitions The Consumer Financial Protection Bureau (CFPB) is the first federal agency solely focused on consumer financial protection,1 and consumer complaints2 are an integral part of that work. The CFPB helps connect consumers with financial companies to make their voices heard. When consumers submit a complaint, we work with companies to get the consumer a response, generally within 15 days. We also publish basic information about complaints in our public Consumer Complaint Database to empower consumers, inform consumer advocates and companies, and improve the functioning of the marketplace.
The CFPB has used a phased-in approach to expand its complaint handling over time to include multiple products and services under its authority. Complaint-handling capacity was expanded as follows: credit card complaints on July 21, 2011, mortgage complaints on December 1, 2011, bank accounts and services, private student loans, and consumer loans on March 1, 2012, credit reporting on October 22, 2012, money transfers on April 4, 2013, debt collection on July 10, 2013, payday loans on November 6, 2013, prepaid cards, credit repair, debt settlement, and pawn and title loans on July 19, 2014, virtual currency on August 11, 2014, and Federal student loan servicing on February 26, 2016. As of April 1, 2017, the CFPB has handled approximately 1,163,200 complaints.
Servicemembers and older consumers are both self-identified. Servicemembers refers to servicemembers, veterans, and their dependents. Older consumers are defined as consumers who voluntarily reported their age as 62 or older. Consumers have voluntarily reported their age in 54 percent of complaints.
State specific complaint counts are based on consumer-provided ZIP codes and reflect cumulative complaint data since July 21, 2011.
1 The Dodd-Frank Wall Street Reform and Consumer Protection Act of 2010, Pub. L. No. 111-203 (“Dodd-Frank Act”) created the CFPB to protect consumers of financial products or services and to encourage the fair and competitive operation of consumer financial markets.
2 Consumer complaints are submissions that express dissatisfaction with, or communicate suspicion of wrongful conduct by, an identifiable entity related to a consumer’s personal experience with a financial product or service.
60 MONTHLY COMPLAINT REPORT: JUNE 2017
A consumer complaint narrative is the consumer-submitted description of "what happened" from the complaint. Consumers' descriptions of “what happened” are included in the Consumer Complaint Database if consumers consent to publishing the description and after we take steps to remove personal information.
A timely company response means the company provided a timely response to the consumer and the CFPB.
Visit consumerfinance.gov/complaint to learn about how we handle complaints or to submit a complaint. Visit our Consumer Complaint Database at consumerfinance.gov/complaintdatabase to search, sort, filter, and export complaints.
MONTHLY COMPLAINT REPORT: JUNE 2017 61


