25
August 2015 Monthly Complaint Report Vol. 2
August 2015
Monthly Complaint Report Vol. 2
1 MONTHLY COMPLAINT REPORT: AUGUST 2015
Table of contents Table of contents ......................................................................................................... 1
1. Complaint volume ................................................................................................. 2
1.1 Complaint volume by product .................................................................. 3
1.2 Complaint volume by state ....................................................................... 7
1.3 Complaint volume by company ................................................................ 9
2. Product spotlight: Credit reporting ................................................................... 11
2.1 Credit reporting complaints by type ........................................................ 11
2.2 Credit reporting complaints by state ...................................................... 12
2.3 Credit reporting complaints by company ............................................... 14
3. Geographic spotlight: Los Angeles, California ............................................... 16
3.1 Los Angeles complaints by product ......................................................... 17
3.2 Los Angeles complaints over time .......................................................... 18
3.3 Los Angeles complaints by company ...................................................... 19
Appendix A: ............................................................................................................... 20
2 MONTHLY COMPLAINT REPORT: AUGUST 2015
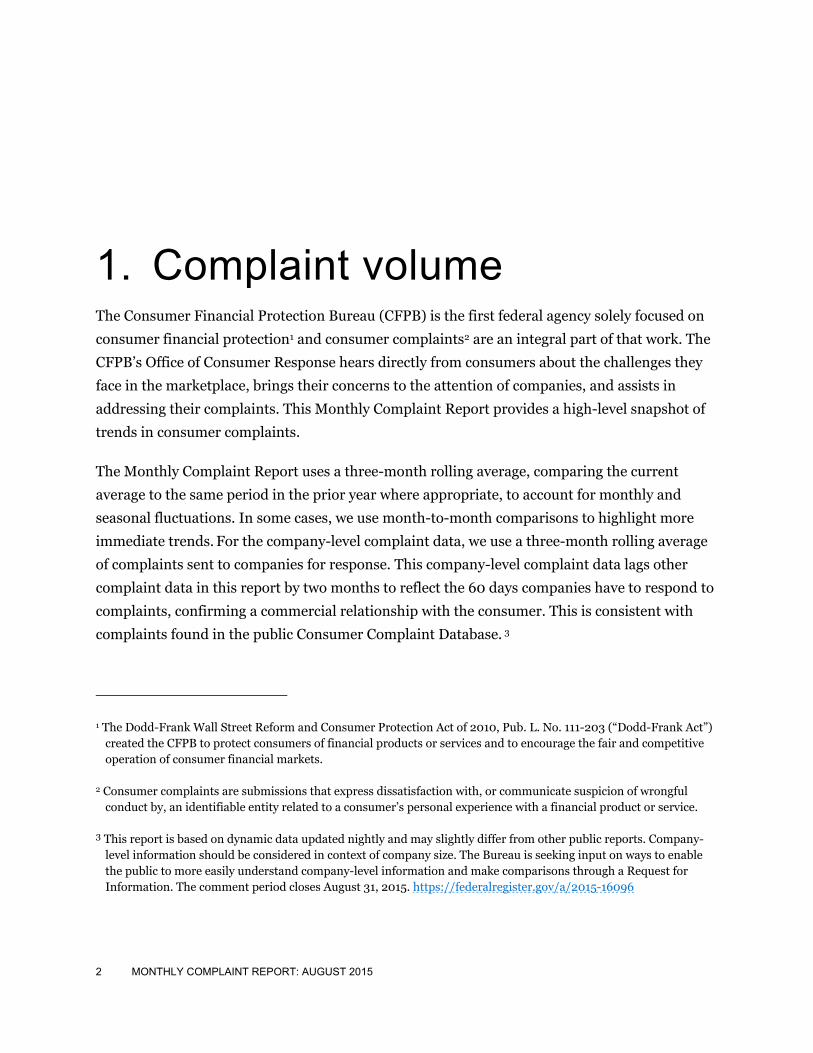
1. Complaint volume The Consumer Financial Protection Bureau (CFPB) is the first federal agency solely focused on
consumer financial protection1 and consumer complaints2 are an integral part of that work. The
CFPB’s Office of Consumer Response hears directly from consumers about the challenges they
face in the marketplace, brings their concerns to the attention of companies, and assists in
addressing their complaints. This Monthly Complaint Report provides a high-level snapshot of
trends in consumer complaints.
The Monthly Complaint Report uses a three-month rolling average, comparing the current
average to the same period in the prior year where appropriate, to account for monthly and
seasonal fluctuations. In some cases, we use month-to-month comparisons to highlight more
immediate trends. For the company-level complaint data, we use a three-month rolling average
of complaints sent to companies for response. This company-level complaint data lags other
complaint data in this report by two months to reflect the 60 days companies have to respond to
complaints, confirming a commercial relationship with the consumer. This is consistent with
complaints found in the public Consumer Complaint Database. 3
1 The Dodd-Frank Wall Street Reform and Consumer Protection Act of 2010, Pub. L. No. 111-203 (“Dodd-Frank Act”) created the CFPB to protect consumers of financial products or services and to encourage the fair and competitive operation of consumer financial markets.
2 Consumer complaints are submissions that express dissatisfaction with, or communicate suspicion of wrongful conduct by, an identifiable entity related to a consumer’s personal experience with a financial product or service.
3 This report is based on dynamic data updated nightly and may slightly differ from other public reports. Company-level information should be considered in context of company size. The Bureau is seeking input on ways to enable the public to more easily understand company-level information and make comparisons through a Request for Information. The comment period closes August 31, 2015. https://federalregister.gov/a/2015-16096
3 MONTHLY COMPLAINT REPORT: AUGUST 2015
Visit consumerfinance.gov/complaint to learn about how we handle complaints or to submit a
complaint. Visit our Consumer Complaint Database at consumerfinance.gov/complaintdatabase
to search, sort, filter, and export complaints.
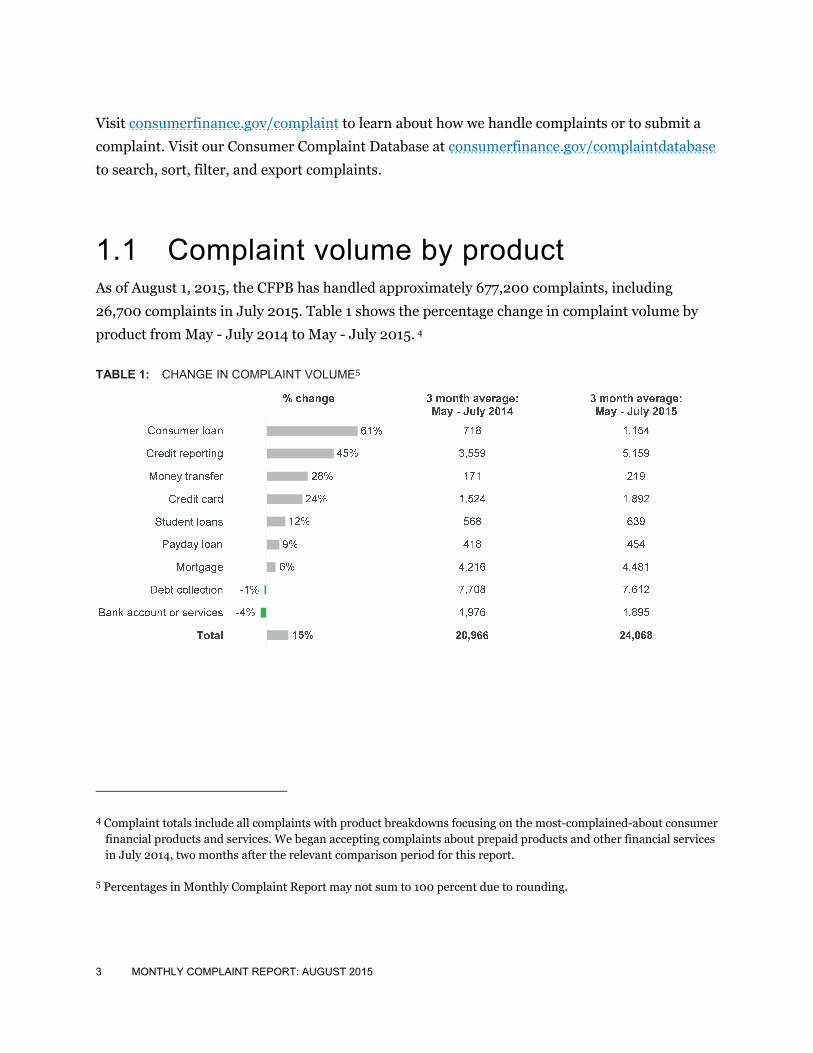
1.1 Complaint volume by product As of August 1, 2015, the CFPB has handled approximately 677,200 complaints, including
26,700 complaints in July 2015. Table 1 shows the percentage change in complaint volume by
product from May - July 2014 to May - July 2015. 4
TABLE 1: CHANGE IN COMPLAINT VOLUME5
4 Complaint totals include all complaints with product breakdowns focusing on the most-complained-about consumer financial products and services. We began accepting complaints about prepaid products and other financial services in July 2014, two months after the relevant comparison period for this report.
5 Percentages in Monthly Complaint Report may not sum to 100 percent due to rounding.
4 MONTHLY COMPLAINT REPORT: AUGUST 2015
Consumer loan complaints showed the greatest percentage increase from May - July
2014 (718 complaints) to May - July 2015 (1,154 complaints), representing about a 61
percent increase.
Bank account or services complaints showed the greatest percentage decrease from May
- July 2014 (1,976 complaints) to May - July 2015 (1,895 complaints), representing about
a 4 percent decline.
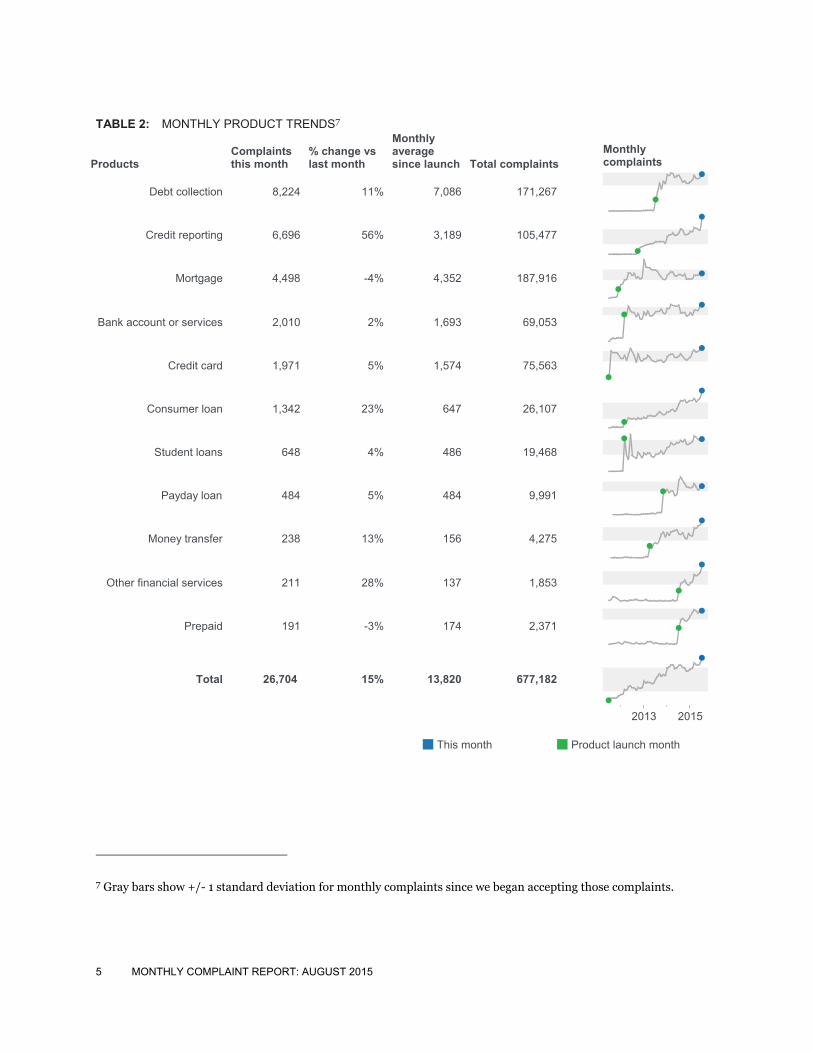
Table 2 shows the complaint volume this month by product. The graphic at the end of each row
shows the volume trend from when the CFPB began accepting complaints about that product
(green dot) to the current month (blue dot). The monthly average reflects complaints handled
per month since we began accepting those complaints.6
6 The CFPB has used a phased-in approach to expand its complaint handling over time to include multiple products and services under its authority. Complaint-handling capacity was expanded as follows: credit card complaints on July 21, 2011, mortgage complaints on December 1, 2011, bank accounts and services, private student loans, and consumer loans on March 1, 2012, credit reporting on October 22, 2012, money transfers on April 4, 2013, debt collection on July 10, 2013, payday loans on November 6, 2013, prepaid cards, credit repair, debt settlement, and pawn and title loans on July 19, 2014, and virtual currency on August 11, 2014. See Table 2.
5 MONTHLY COMPLAINT REPORT: AUGUST 2015
TABLE 2: MONTHLY PRODUCT TRENDS7
7 Gray bars show +/- 1 standard deviation for monthly complaints since we began accepting those complaints.
ProductsComplaintsthis month
% change vslast month
Monthlyaveragesince launch Total complaints .
Debt collection 8,224 11% 7,086 171,267
Credit reporting 6,696 56% 3,189 105,477
Mortgage 4,498 -4% 4,352 187,916
Bank account or services 2,010 2% 1,693 69,053
Credit card 1,971 5% 1,574 75,563
Consumer loan 1,342 23% 647 26,107
Student loans 648 4% 486 19,468
Payday loan 484 5% 484 9,991
Money transfer 238 13% 156 4,275
Other financial services 211 28% 137 1,853
Prepaid 191 -3% 174 2,371
2013 2015
Total 26,704 15% 13,820 677,182
This month Product launch month
Monthlycomplaints
6 MONTHLY COMPLAINT REPORT: AUGUST 2015
Credit reporting complaints showed the greatest month-over-month percentage increase
(56 percent).
Mortgage complaints showed the greatest month-over-month percentage decrease (-4
percent).
For the 23rd consecutive month, we handled more complaints about debt collection than
any other type of complaint. Debt collection complaints represented about 31 percent of
complaints submitted in July 2015.
Debt collection, credit reporting, and mortgage complaints continue to be the top three
most-complained-about consumer financial products and services, collectively
representing about 73 percent of complaints submitted in July 2015.
7 MONTHLY COMPLAINT REPORT: AUGUST 2015
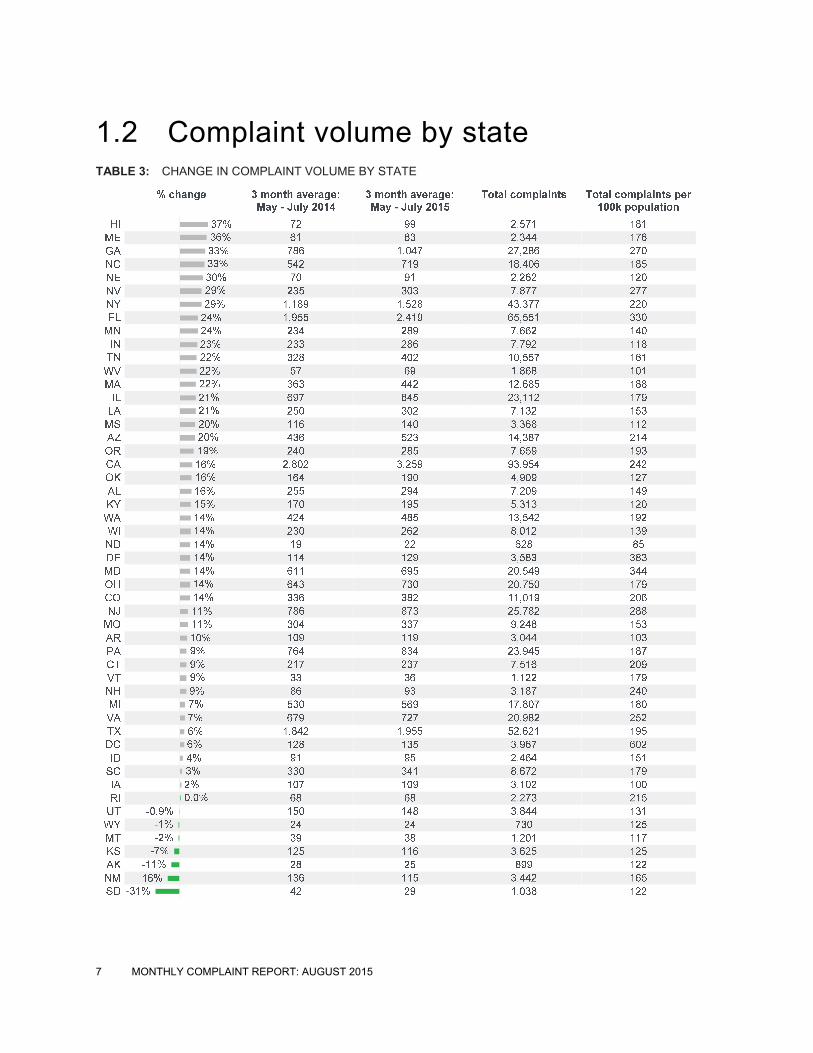
1.2 Complaint volume by state TABLE 3: CHANGE IN COMPLAINT VOLUME BY STATE
8 MONTHLY COMPLAINT REPORT: AUGUST 2015
Hawaii (37 percent), Maine (36 percent), and Georgia (33 percent) experienced the
greatest complaint volume percentage increase from May - July 2014 to May - July 2015.
South Dakota (-31 percent), New Mexico (-16 percent), and Alaska (-11 percent)
experienced the greatest complaint volume percentage decrease from May - July 2014 to
May - July 2015.8
Of the five most populated states, New York (29 percent) experienced the greatest
complaint volume percentage increase and Texas (6 percent) experienced the smallest
complaint volume percentage increase from May - July 2014 to May - July 2015.
8 Complaints per 100k population are defined as cumulative complaints divided by Census estimated 2014 population.
Census population data source: http://www.census.gov/popest/data/state/totals/2014/index.html
9 MONTHLY COMPLAINT REPORT: AUGUST 2015
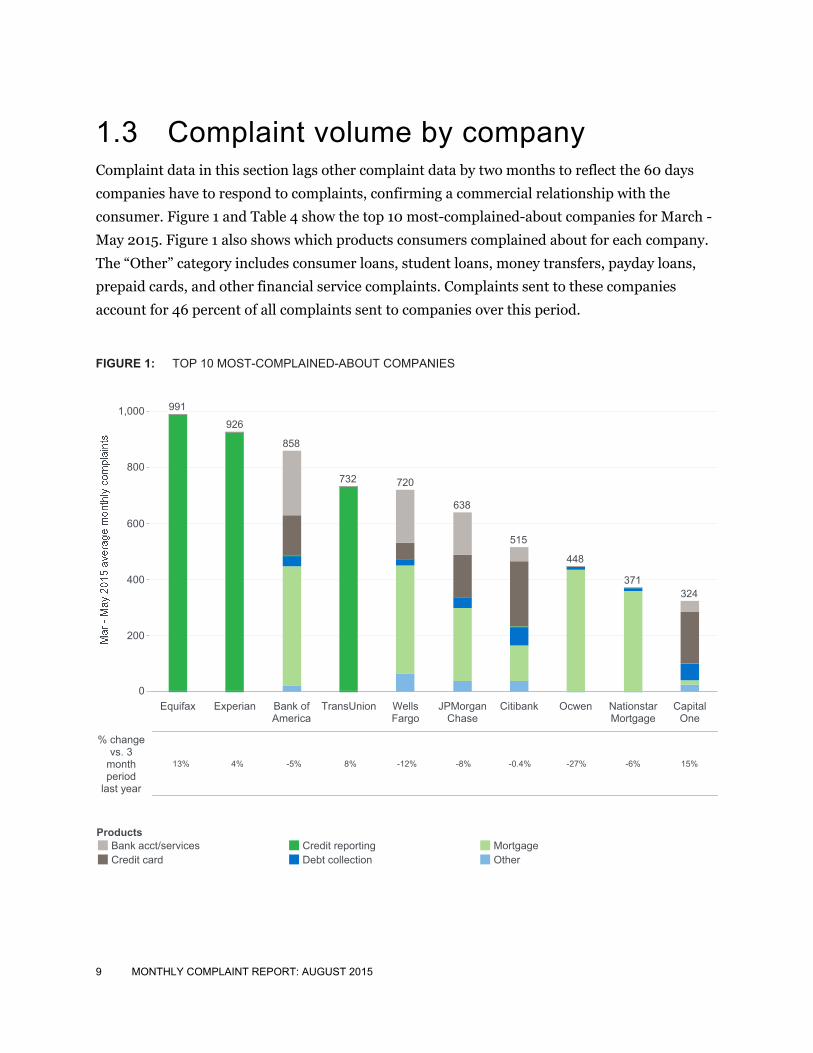
1.3 Complaint volume by company Complaint data in this section lags other complaint data by two months to reflect the 60 days
companies have to respond to complaints, confirming a commercial relationship with the
consumer. Figure 1 and Table 4 show the top 10 most-complained-about companies for March -
May 2015. Figure 1 also shows which products consumers complained about for each company.
The “Other” category includes consumer loans, student loans, money transfers, payday loans,
prepaid cards, and other financial service complaints. Complaints sent to these companies
account for 46 percent of all complaints sent to companies over this period.
FIGURE 1: TOP 10 MOST-COMPLAINED-ABOUT COMPANIES
% changevs. 3
monthperiod
last year
Equifax Experian Bank ofAmerica
TransUnion WellsFargo
JPMorganChase
Citibank Ocwen NationstarMortgage
CapitalOne
0
200
400
600
800
1,000 991
926
858
732 720
638
515
448
371324
15%-6%-27%-0.4%-8%-12%8%-5%4%13%
ProductsBank acct/servicesCredit card
Credit reportingDebt collection
MortgageOther
10 MONTHLY COMPLAINT REPORT: AUGUST 2015
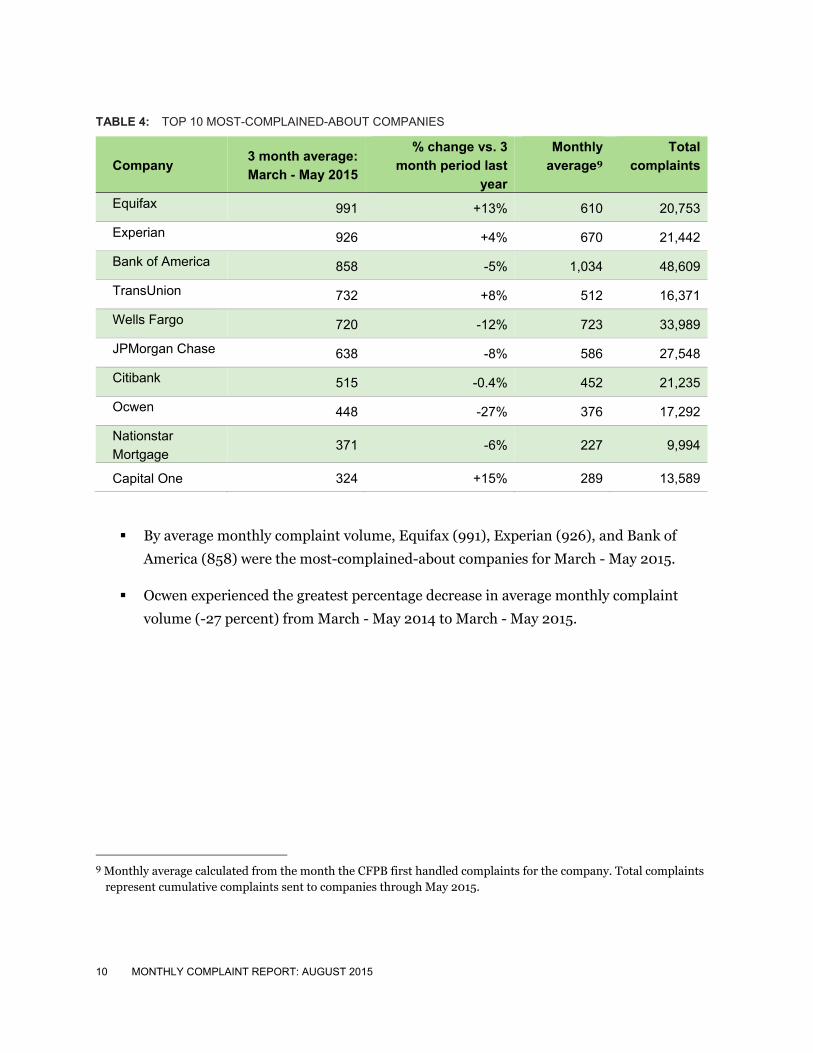
TABLE 4: TOP 10 MOST-COMPLAINED-ABOUT COMPANIES
Company 3 month average:
March - May 2015
% change vs. 3
month period last
year
Monthly
average9
Total
complaints
Equifax 991 +13% 610 20,753
Experian 926 +4% 670 21,442
Bank of America 858 -5% 1,034 48,609
TransUnion 732 +8% 512 16,371
Wells Fargo 720 -12% 723 33,989
JPMorgan Chase 638 -8% 586 27,548
Citibank 515 -0.4% 452 21,235
Ocwen 448 -27% 376 17,292
Nationstar
Mortgage 371 -6% 227 9,994
Capital One 324 +15% 289 13,589
By average monthly complaint volume, Equifax (991), Experian (926), and Bank of
America (858) were the most-complained-about companies for March - May 2015.
Ocwen experienced the greatest percentage decrease in average monthly complaint
volume (-27 percent) from March - May 2014 to March - May 2015.
9 Monthly average calculated from the month the CFPB first handled complaints for the company. Total complaints
represent cumulative complaints sent to companies through May 2015.
11 MONTHLY COMPLAINT REPORT: AUGUST 2015
2. Product spotlight: Credit reporting The CFPB has handled approximately 105,500 credit reporting complaints, making credit
reporting the third most-complained-about product. In July 2015, credit reporting complaints
showed the greatest month-over-month percentage increase (56 percent), and we handled more
this month (6,696) than any other month since we began accepting credit reporting complaints.
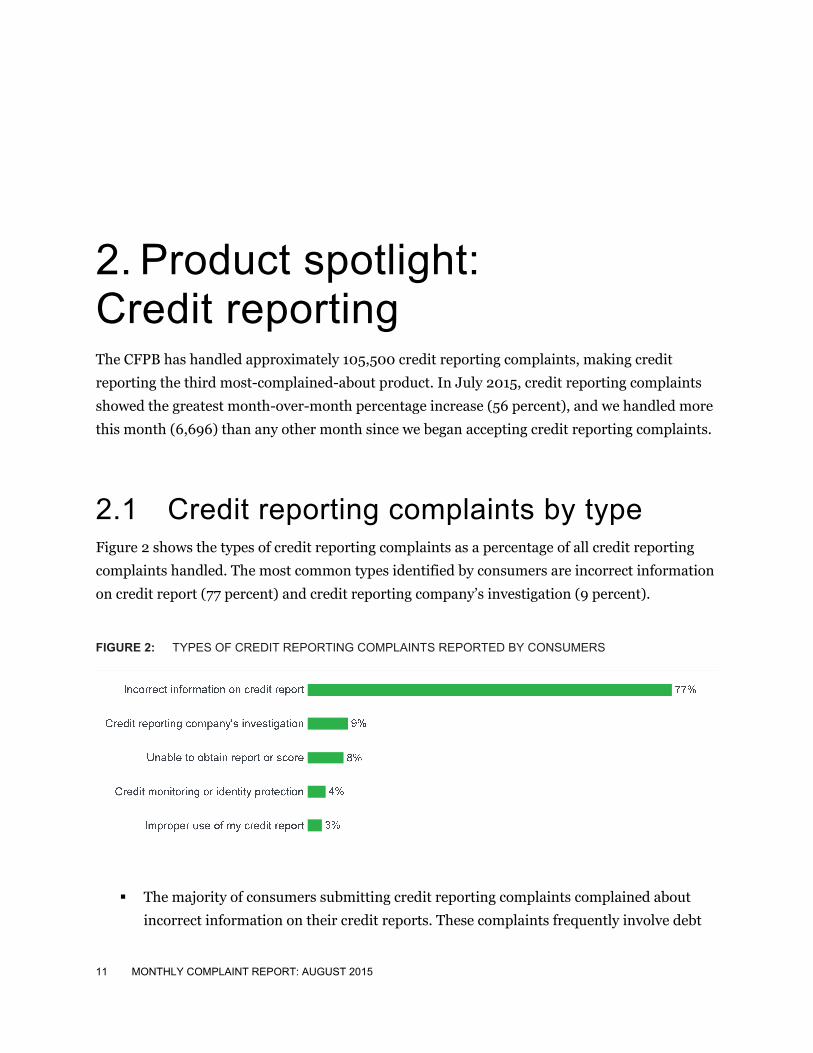
2.1 Credit reporting complaints by type Figure 2 shows the types of credit reporting complaints as a percentage of all credit reporting
complaints handled. The most common types identified by consumers are incorrect information
on credit report (77 percent) and credit reporting company’s investigation (9 percent).
FIGURE 2: TYPES OF CREDIT REPORTING COMPLAINTS REPORTED BY CONSUMERS
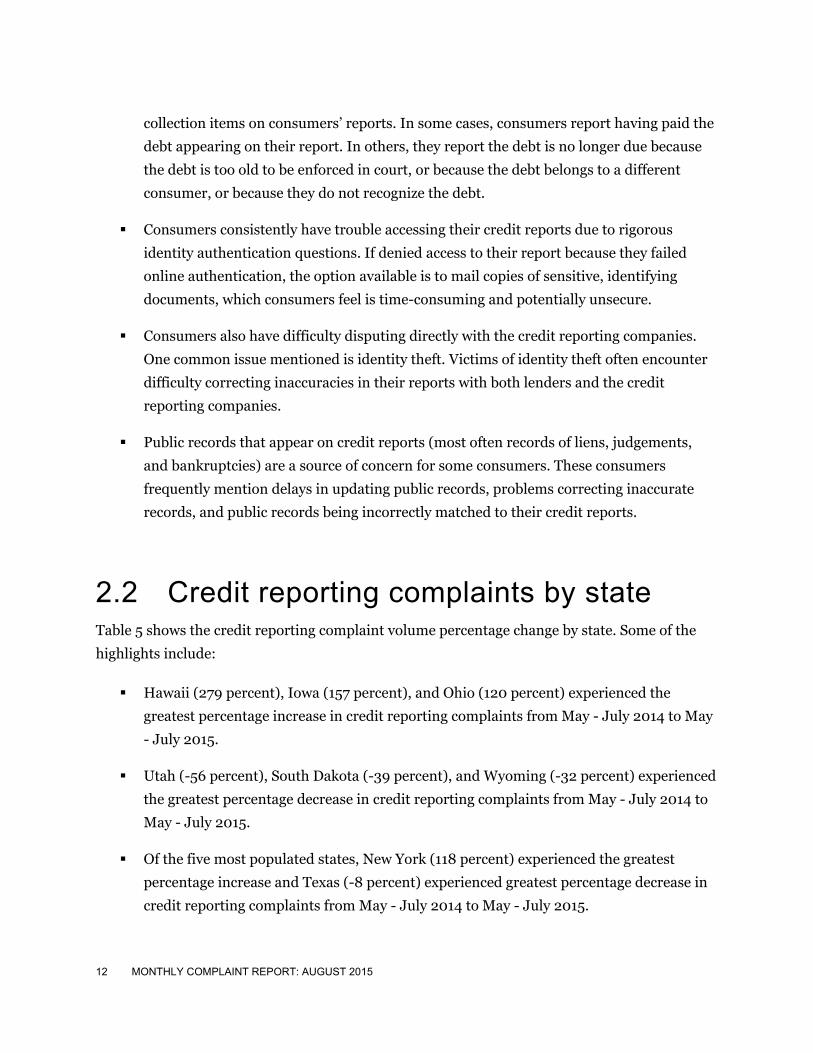
The majority of consumers submitting credit reporting complaints complained about
incorrect information on their credit reports. These complaints frequently involve debt
12 MONTHLY COMPLAINT REPORT: AUGUST 2015
collection items on consumers’ reports. In some cases, consumers report having paid the
debt appearing on their report. In others, they report the debt is no longer due because
the debt is too old to be enforced in court, or because the debt belongs to a different
consumer, or because they do not recognize the debt.
Consumers consistently have trouble accessing their credit reports due to rigorous
identity authentication questions. If denied access to their report because they failed
online authentication, the option available is to mail copies of sensitive, identifying
documents, which consumers feel is time-consuming and potentially unsecure.
Consumers also have difficulty disputing directly with the credit reporting companies.
One common issue mentioned is identity theft. Victims of identity theft often encounter
difficulty correcting inaccuracies in their reports with both lenders and the credit
reporting companies.
Public records that appear on credit reports (most often records of liens, judgements,
and bankruptcies) are a source of concern for some consumers. These consumers
frequently mention delays in updating public records, problems correcting inaccurate
records, and public records being incorrectly matched to their credit reports.
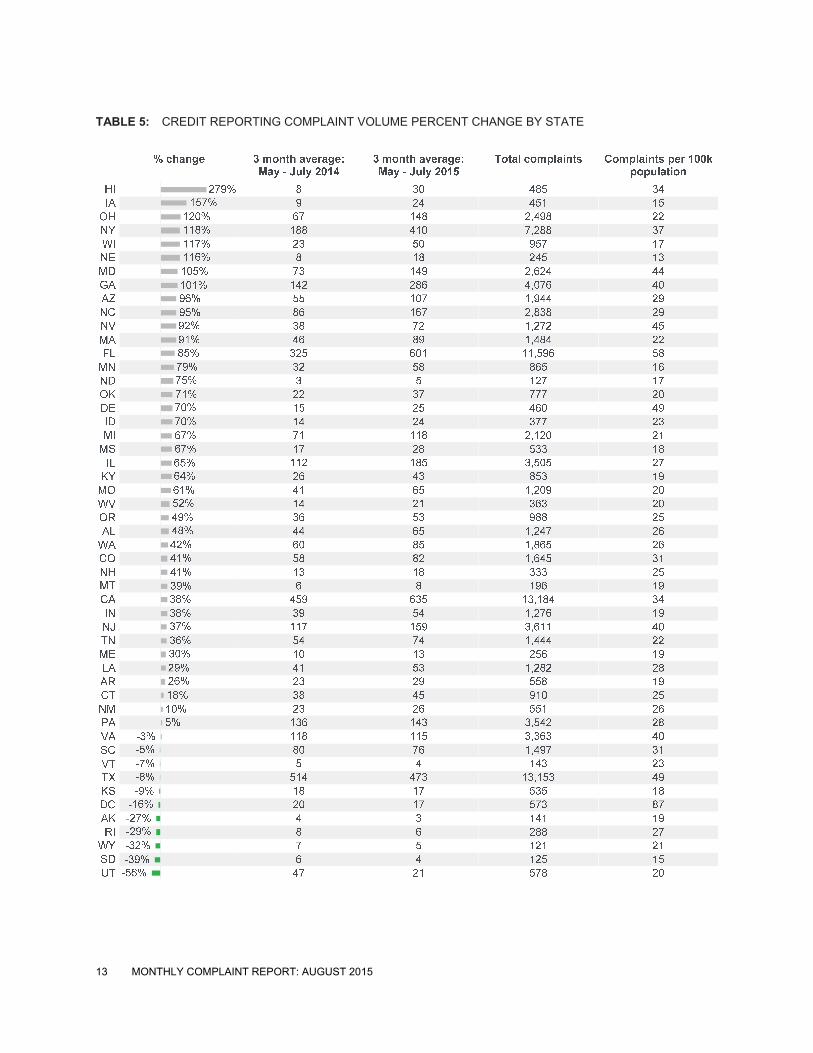
2.2 Credit reporting complaints by state Table 5 shows the credit reporting complaint volume percentage change by state. Some of the
highlights include:
Hawaii (279 percent), Iowa (157 percent), and Ohio (120 percent) experienced the
greatest percentage increase in credit reporting complaints from May - July 2014 to May
- July 2015.
Utah (-56 percent), South Dakota (-39 percent), and Wyoming (-32 percent) experienced
the greatest percentage decrease in credit reporting complaints from May - July 2014 to
May - July 2015.
Of the five most populated states, New York (118 percent) experienced the greatest
percentage increase and Texas (-8 percent) experienced greatest percentage decrease in
credit reporting complaints from May - July 2014 to May - July 2015.
13 MONTHLY COMPLAINT REPORT: AUGUST 2015
TABLE 5: CREDIT REPORTING COMPLAINT VOLUME PERCENT CHANGE BY STATE
14 MONTHLY COMPLAINT REPORT: AUGUST 2015
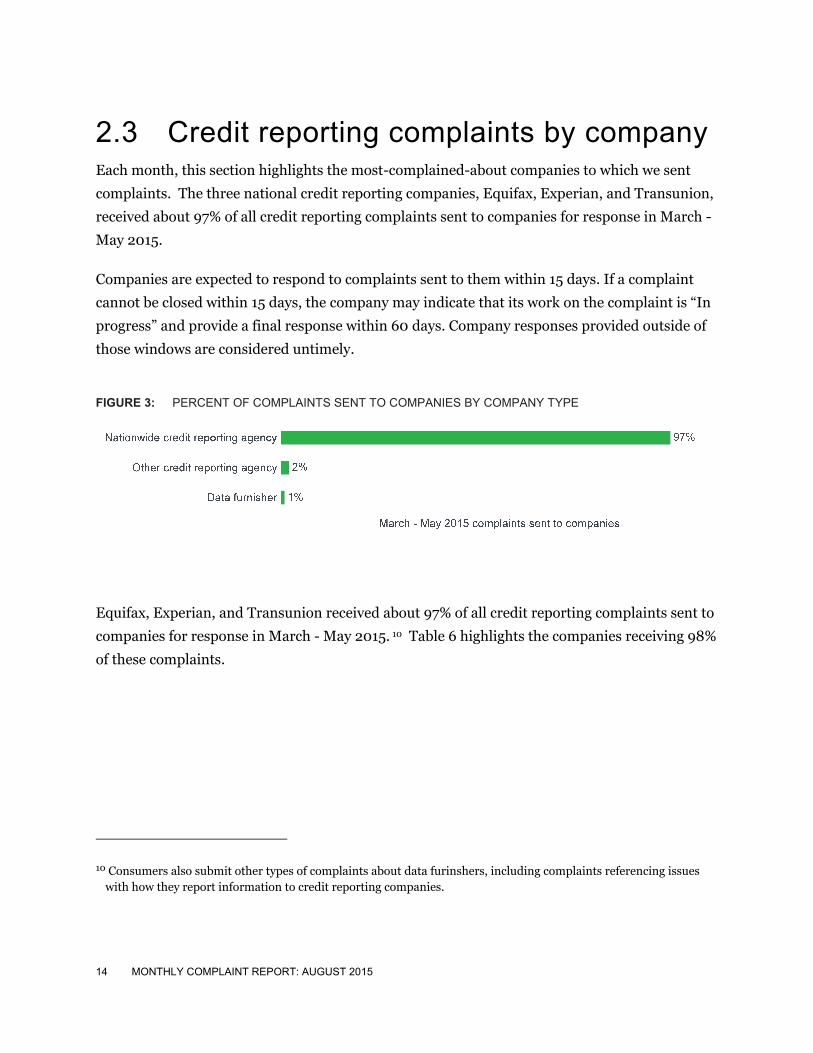
2.3 Credit reporting complaints by company Each month, this section highlights the most-complained-about companies to which we sent
complaints. The three national credit reporting companies, Equifax, Experian, and Transunion,
received about 97% of all credit reporting complaints sent to companies for response in March -
May 2015.
Companies are expected to respond to complaints sent to them within 15 days. If a complaint
cannot be closed within 15 days, the company may indicate that its work on the complaint is “In
progress” and provide a final response within 60 days. Company responses provided outside of
those windows are considered untimely.
FIGURE 3: PERCENT OF COMPLAINTS SENT TO COMPANIES BY COMPANY TYPE
Equifax, Experian, and Transunion received about 97% of all credit reporting complaints sent to
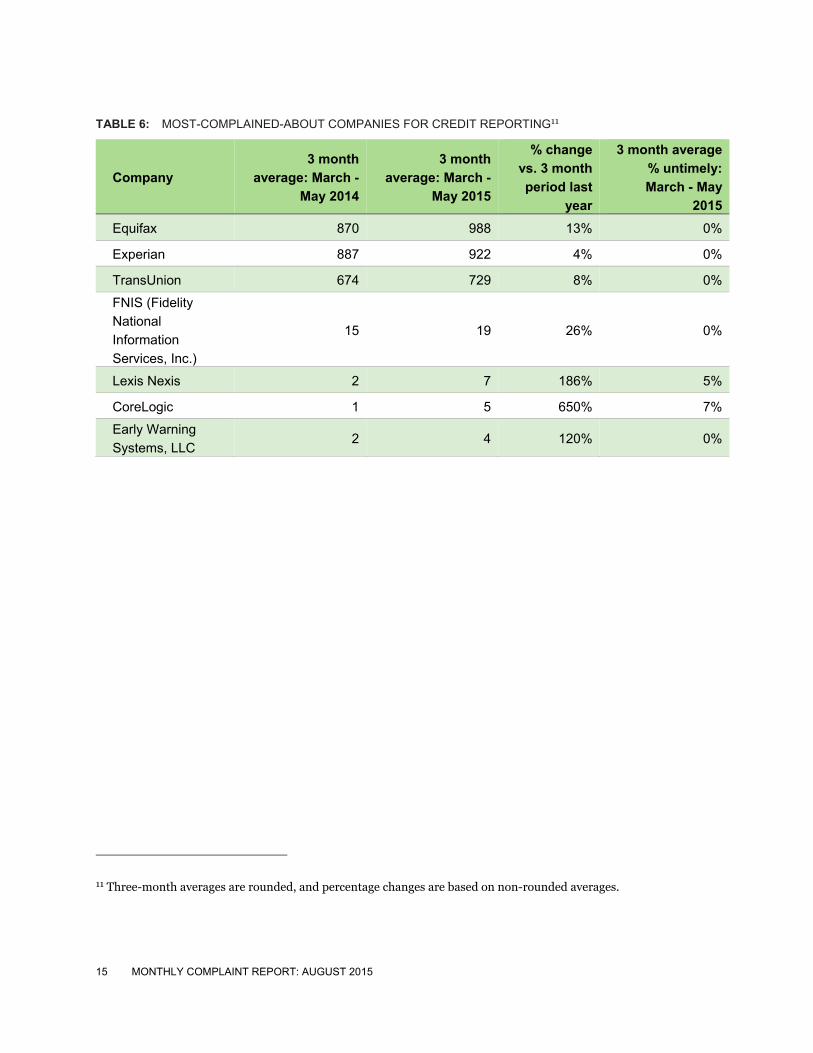
companies for response in March - May 2015. 10 Table 6 highlights the companies receiving 98%
of these complaints.
10 Consumers also submit other types of complaints about data furinshers, including complaints referencing issues with how they report information to credit reporting companies.
15 MONTHLY COMPLAINT REPORT: AUGUST 2015
TABLE 6: MOST-COMPLAINED-ABOUT COMPANIES FOR CREDIT REPORTING11
Company
3 month
average: March -
May 2014
3 month
average: March -
May 2015
% change
vs. 3 month
period last
year
3 month average
% untimely:
March - May
2015
Equifax 870 988 13% 0%
Experian 887 922 4% 0%
TransUnion 674 729 8% 0%
FNIS (Fidelity
National
Information
Services, Inc.)
15 19 26% 0%
Lexis Nexis 2 7 186% 5%
CoreLogic 1 5 650% 7%
Early Warning
Systems, LLC 2 4 120% 0%
11 Three-month averages are rounded, and percentage changes are based on non-rounded averages.
16 MONTHLY COMPLAINT REPORT: AUGUST 2015
3. Geographic spotlight: Los Angeles, California Each month we spotlight the complaints from one part of the country. This month we are
spotlighting Los Angeles. As of August 1, 2015, about 94,000 complaints (14 percent) of the
677,200 complaints we have handled have been from consumers in California. Of complaints
from consumers in California, 33,700 (36 percent) are from the Los Angeles, California metro
area.12
12 The Los Angeles metro area is defined as zip codes from the Los Angeles-Long Beach-Santa Ana, CA Core-Based Statistical Area (CBSA). http://www.census.gov/population/metro/files/zip07_cbsa06.zip. Complaint counts are based on consumer-provided ZIP code and unless otherwise noted the geographic spotlight section reflects cumulative complaint data since July 21, 2011.
17 MONTHLY COMPLAINT REPORT: AUGUST 2015
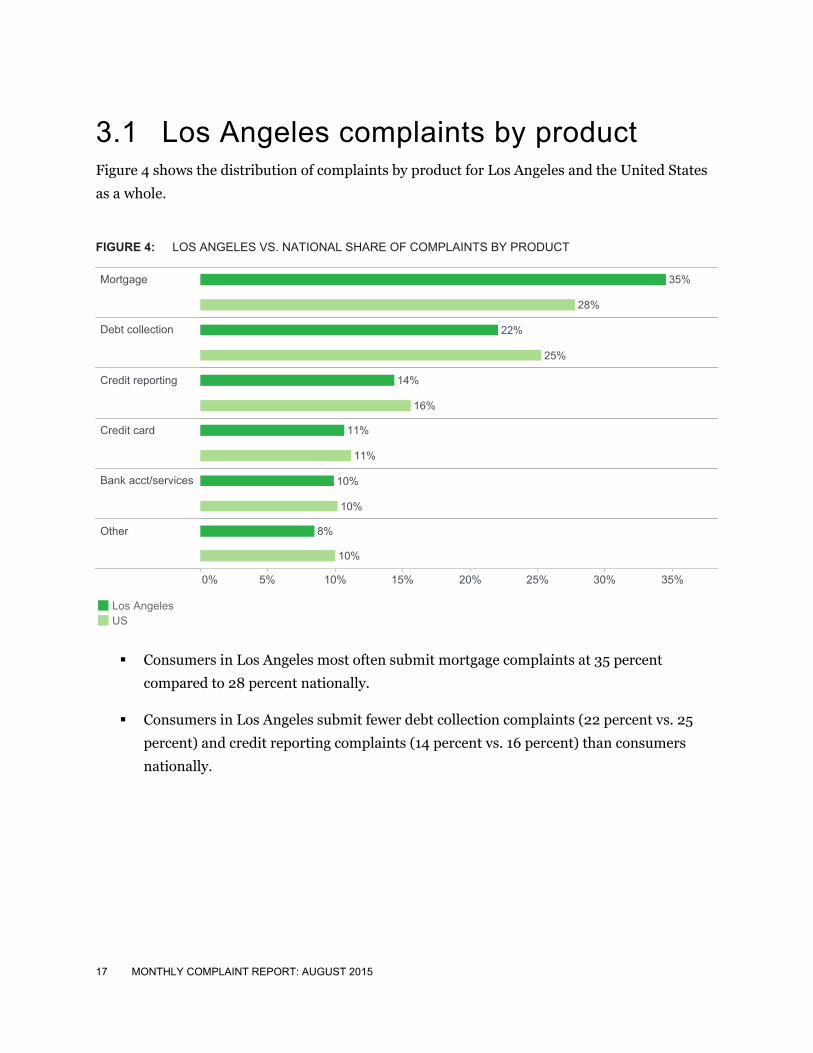
3.1 Los Angeles complaints by product Figure 4 shows the distribution of complaints by product for Los Angeles and the United States
as a whole.
FIGURE 4: LOS ANGELES VS. NATIONAL SHARE OF COMPLAINTS BY PRODUCT
Consumers in Los Angeles most often submit mortgage complaints at 35 percent
compared to 28 percent nationally.
Consumers in Los Angeles submit fewer debt collection complaints (22 percent vs. 25
percent) and credit reporting complaints (14 percent vs. 16 percent) than consumers
nationally.
0% 5% 10% 15% 20% 25% 30% 35%
Mortgage
Debt collection
Credit reporting
Credit card
Bank acct/services
Other
35%
28%
22%
25%
14%
16%
11%
11%
10%
10%
10%
8%
Los AngelesUS
18 MONTHLY COMPLAINT REPORT: AUGUST 2015
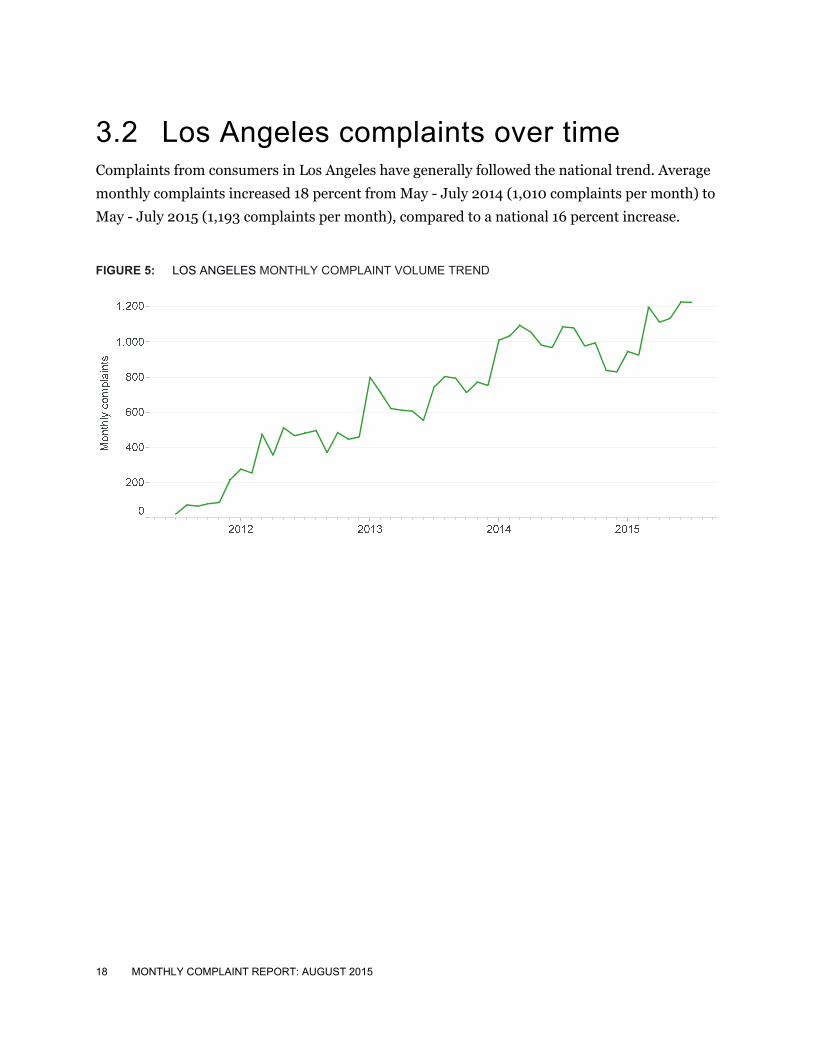
3.2 Los Angeles complaints over time Complaints from consumers in Los Angeles have generally followed the national trend. Average
monthly complaints increased 18 percent from May - July 2014 (1,010 complaints per month) to
May - July 2015 (1,193 complaints per month), compared to a national 16 percent increase.
FIGURE 5: LOS ANGELES MONTHLY COMPLAINT VOLUME TREND
19 MONTHLY COMPLAINT REPORT: AUGUST 2015
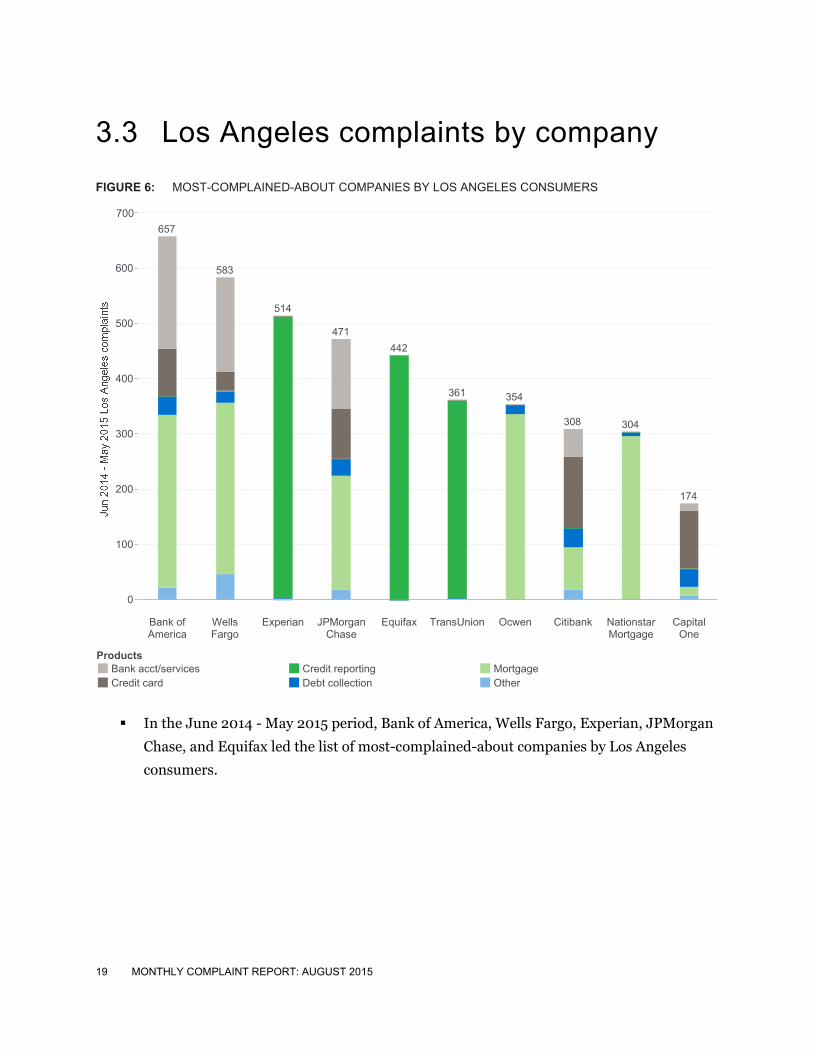
3.3 Los Angeles complaints by company
FIGURE 6: MOST-COMPLAINED-ABOUT COMPANIES BY LOS ANGELES CONSUMERS
In the June 2014 - May 2015 period, Bank of America, Wells Fargo, Experian, JPMorgan
Chase, and Equifax led the list of most-complained-about companies by Los Angeles
consumers.
Bank ofAmerica
WellsFargo
Experian JPMorganChase
Equifax TransUnion Ocwen Citibank NationstarMortgage
CapitalOne
0
100
200
300
400
500
600
700
657
583
514
471
442
361 354
308 304
174
ProductsBank acct/servicesCredit card
Credit reportingDebt collection
MortgageOther
20 MONTHLY COMPLAINT REPORT: AUGUST 2015
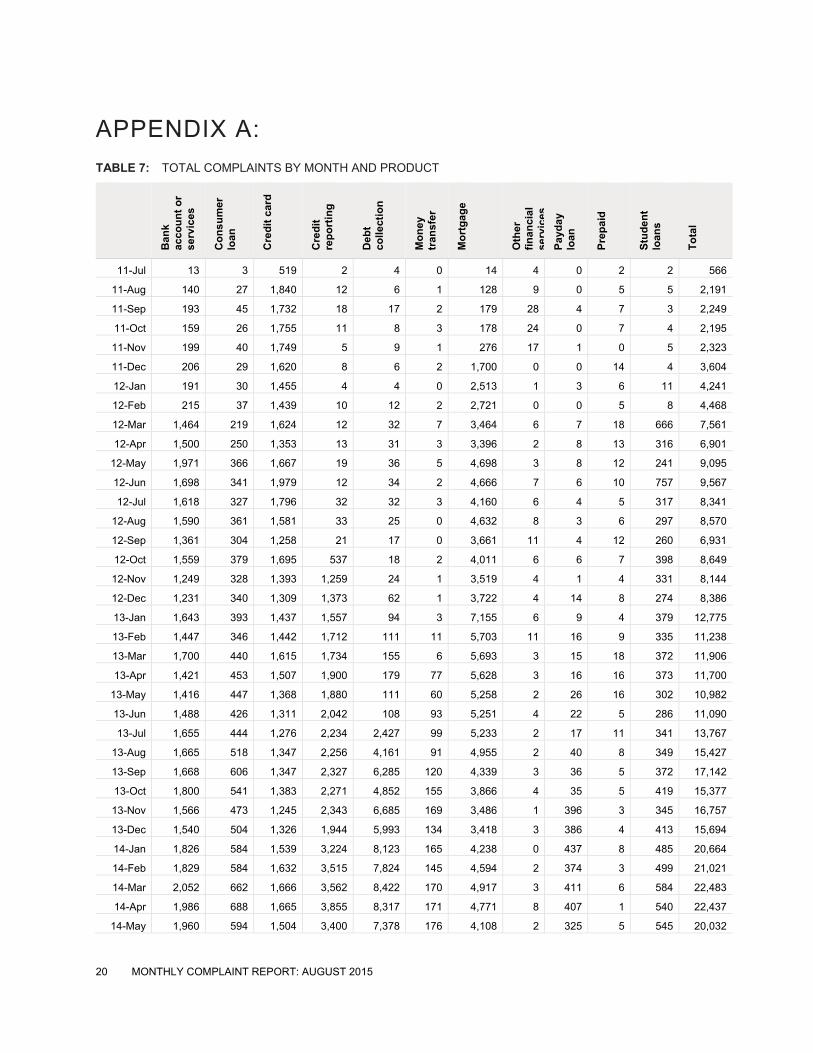
APPENDIX A:
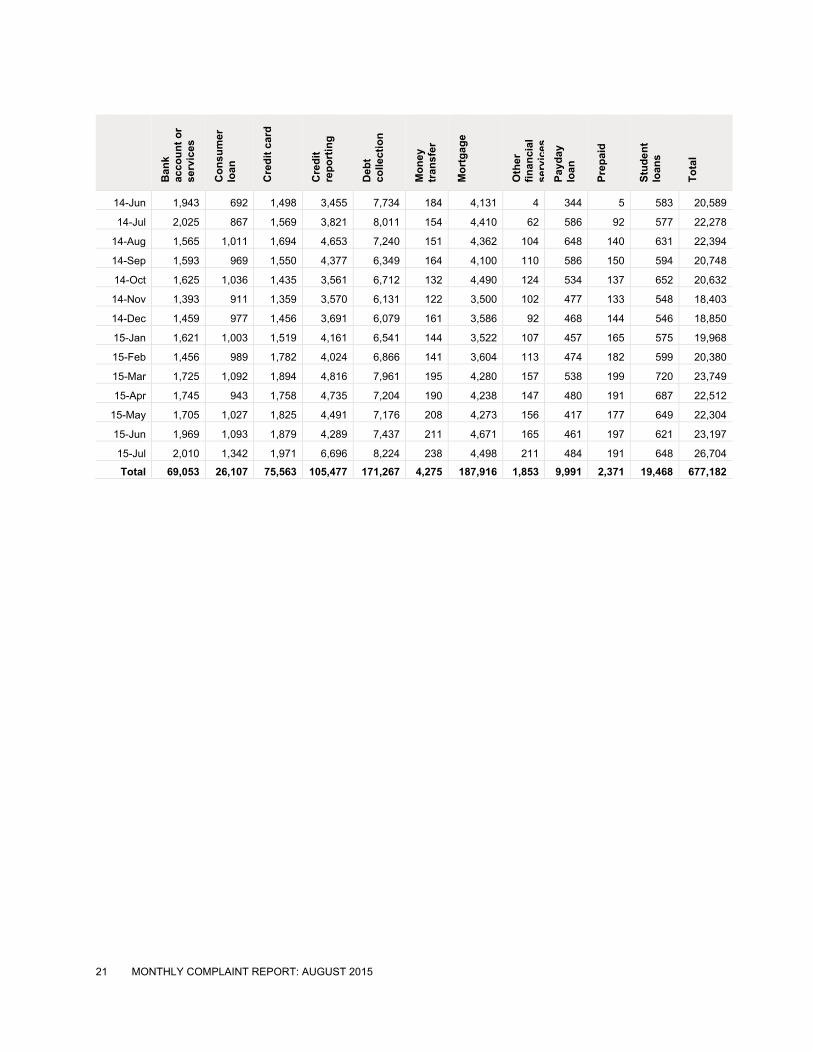
TABLE 7: TOTAL COMPLAINTS BY MONTH AND PRODUCT
Ban
k ac
cou
nt
or
serv
ices
Co
ns
um
er
loan
Cre
dit
car
d
Cre
dit
re
po
rtin
g
Deb
t co
llect
ion
Mo
ney
tr
ansf
er
Mo
rtg
ag
e
Oth
er
fin
anci
al
serv
ices
Pay
day
lo
an
Pre
pai
d
Stu
de
nt
loan
s
To
tal
11-Jul 13 3 519 2 4 0 14 4 0 2 2 566
11-Aug 140 27 1,840 12 6 1 128 9 0 5 5 2,191
11-Sep 193 45 1,732 18 17 2 179 28 4 7 3 2,249
11-Oct 159 26 1,755 11 8 3 178 24 0 7 4 2,195
11-Nov 199 40 1,749 5 9 1 276 17 1 0 5 2,323
11-Dec 206 29 1,620 8 6 2 1,700 0 0 14 4 3,604
12-Jan 191 30 1,455 4 4 0 2,513 1 3 6 11 4,241
12-Feb 215 37 1,439 10 12 2 2,721 0 0 5 8 4,468
12-Mar 1,464 219 1,624 12 32 7 3,464 6 7 18 666 7,561
12-Apr 1,500 250 1,353 13 31 3 3,396 2 8 13 316 6,901
12-May 1,971 366 1,667 19 36 5 4,698 3 8 12 241 9,095
12-Jun 1,698 341 1,979 12 34 2 4,666 7 6 10 757 9,567
12-Jul 1,618 327 1,796 32 32 3 4,160 6 4 5 317 8,341
12-Aug 1,590 361 1,581 33 25 0 4,632 8 3 6 297 8,570
12-Sep 1,361 304 1,258 21 17 0 3,661 11 4 12 260 6,931
12-Oct 1,559 379 1,695 537 18 2 4,011 6 6 7 398 8,649
12-Nov 1,249 328 1,393 1,259 24 1 3,519 4 1 4 331 8,144
12-Dec 1,231 340 1,309 1,373 62 1 3,722 4 14 8 274 8,386
13-Jan 1,643 393 1,437 1,557 94 3 7,155 6 9 4 379 12,775
13-Feb 1,447 346 1,442 1,712 111 11 5,703 11 16 9 335 11,238
13-Mar 1,700 440 1,615 1,734 155 6 5,693 3 15 18 372 11,906
13-Apr 1,421 453 1,507 1,900 179 77 5,628 3 16 16 373 11,700
13-May 1,416 447 1,368 1,880 111 60 5,258 2 26 16 302 10,982
13-Jun 1,488 426 1,311 2,042 108 93 5,251 4 22 5 286 11,090
13-Jul 1,655 444 1,276 2,234 2,427 99 5,233 2 17 11 341 13,767
13-Aug 1,665 518 1,347 2,256 4,161 91 4,955 2 40 8 349 15,427
13-Sep 1,668 606 1,347 2,327 6,285 120 4,339 3 36 5 372 17,142
13-Oct 1,800 541 1,383 2,271 4,852 155 3,866 4 35 5 419 15,377
13-Nov 1,566 473 1,245 2,343 6,685 169 3,486 1 396 3 345 16,757
13-Dec 1,540 504 1,326 1,944 5,993 134 3,418 3 386 4 413 15,694
14-Jan 1,826 584 1,539 3,224 8,123 165 4,238 0 437 8 485 20,664
14-Feb 1,829 584 1,632 3,515 7,824 145 4,594 2 374 3 499 21,021
14-Mar 2,052 662 1,666 3,562 8,422 170 4,917 3 411 6 584 22,483
14-Apr 1,986 688 1,665 3,855 8,317 171 4,771 8 407 1 540 22,437
14-May 1,960 594 1,504 3,400 7,378 176 4,108 2 325 5 545 20,032
21 MONTHLY COMPLAINT REPORT: AUGUST 2015
Ban
k ac
cou
nt
or
serv
ices
Co
ns
um
er
loan
Cre
dit
car
d
Cre
dit
re
po
rtin
g
Deb
t co
llect
ion
Mo
ney
tr
ansf
er
Mo
rtg
ag
e
Oth
er
fin
anci
al
serv
ices
Pay
day
lo
an
Pre
pai
d
Stu
de
nt
loan
s
To
tal
14-Jun 1,943 692 1,498 3,455 7,734 184 4,131 4 344 5 583 20,589
14-Jul 2,025 867 1,569 3,821 8,011 154 4,410 62 586 92 577 22,278
14-Aug 1,565 1,011 1,694 4,653 7,240 151 4,362 104 648 140 631 22,394
14-Sep 1,593 969 1,550 4,377 6,349 164 4,100 110 586 150 594 20,748
14-Oct 1,625 1,036 1,435 3,561 6,712 132 4,490 124 534 137 652 20,632
14-Nov 1,393 911 1,359 3,570 6,131 122 3,500 102 477 133 548 18,403
14-Dec 1,459 977 1,456 3,691 6,079 161 3,586 92 468 144 546 18,850
15-Jan 1,621 1,003 1,519 4,161 6,541 144 3,522 107 457 165 575 19,968
15-Feb 1,456 989 1,782 4,024 6,866 141 3,604 113 474 182 599 20,380
15-Mar 1,725 1,092 1,894 4,816 7,961 195 4,280 157 538 199 720 23,749
15-Apr 1,745 943 1,758 4,735 7,204 190 4,238 147 480 191 687 22,512
15-May 1,705 1,027 1,825 4,491 7,176 208 4,273 156 417 177 649 22,304
15-Jun 1,969 1,093 1,879 4,289 7,437 211 4,671 165 461 197 621 23,197
15-Jul 2,010 1,342 1,971 6,696 8,224 238 4,498 211 484 191 648 26,704
Total 69,053 26,107 75,563 105,477 171,267 4,275 187,916 1,853 9,991 2,371 19,468 677,182
22 MONTHLY COMPLAINT REPORT: AUGUST 2015
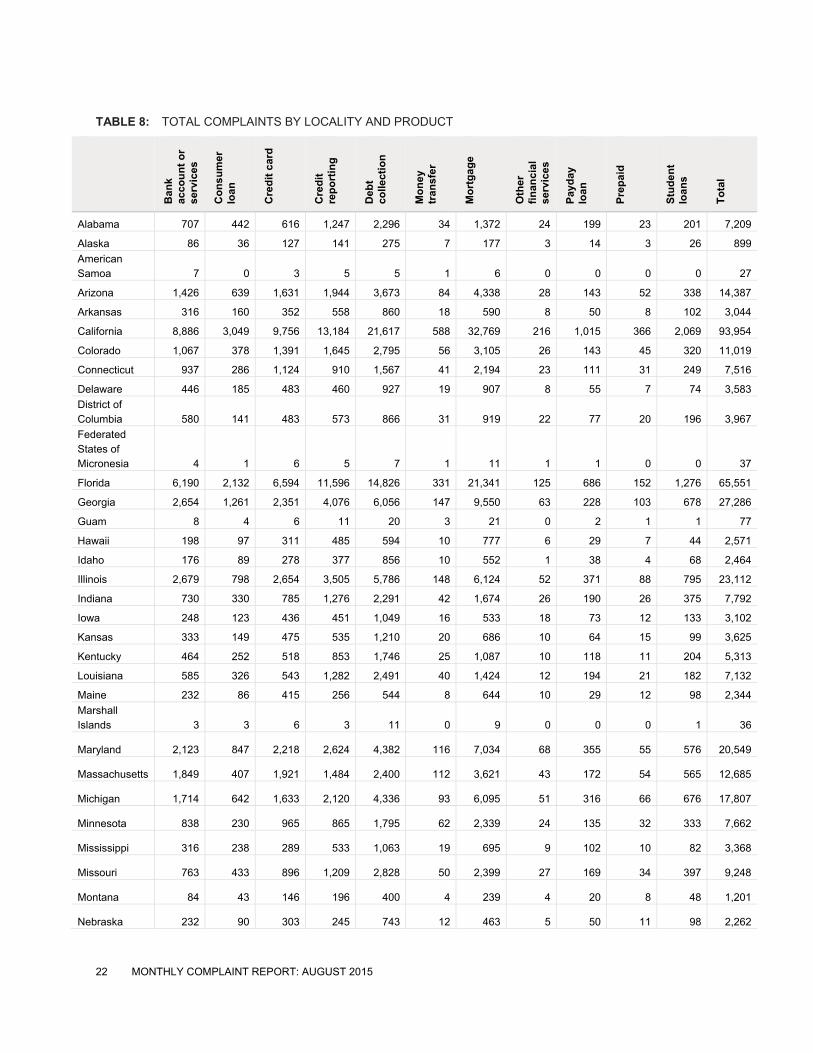
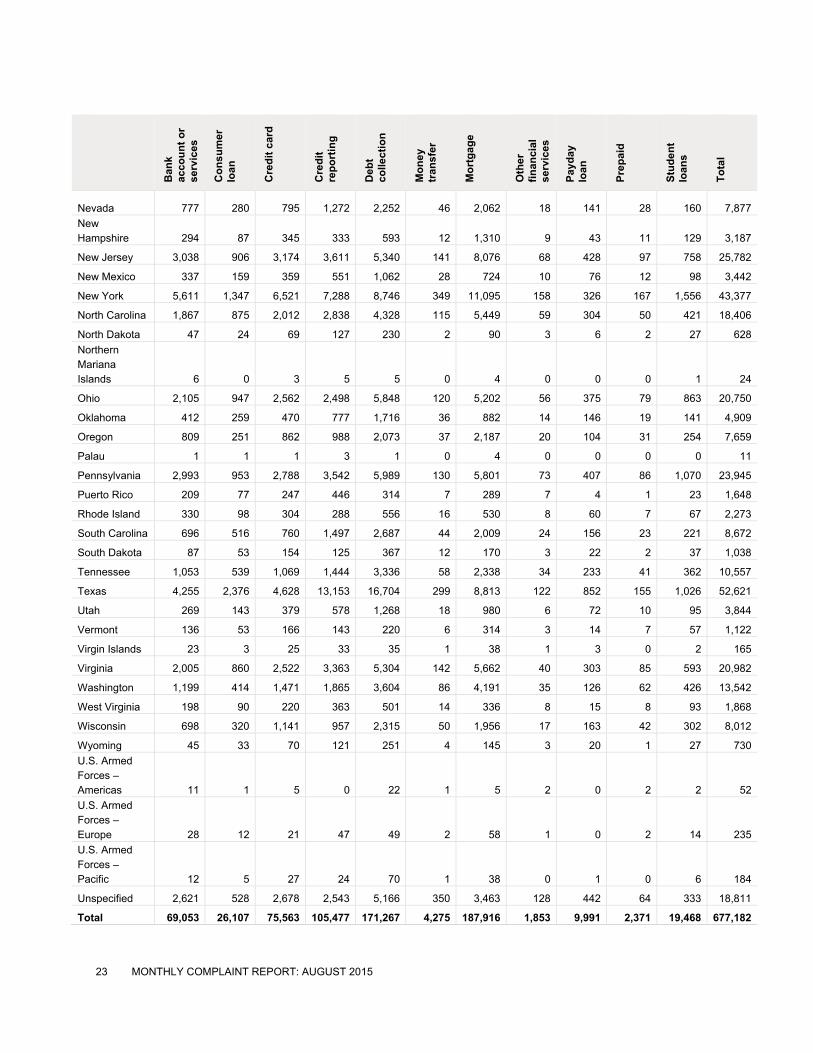
TABLE 8: TOTAL COMPLAINTS BY LOCALITY AND PRODUCT
Ban
k ac
cou
nt
or
serv
ices
Co
ns
um
er
loan
Cre
dit
car
d
Cre
dit
re
po
rtin
g
Deb
t co
llect
ion
Mo
ney
tr
ansf
er
Mo
rtg
ag
e
Oth
er
fin
anci
al
serv
ices
Pay
day
lo
an
Pre
pai
d
Stu
de
nt
loan
s
To
tal
Alabama 707 442 616 1,247 2,296 34 1,372 24 199 23 201 7,209
Alaska 86 36 127 141 275 7 177 3 14 3 26 899
American Samoa 7 0 3 5 5 1 6 0 0 0 0 27
Arizona 1,426 639 1,631 1,944 3,673 84 4,338 28 143 52 338 14,387
Arkansas 316 160 352 558 860 18 590 8 50 8 102 3,044
California 8,886 3,049 9,756 13,184 21,617 588 32,769 216 1,015 366 2,069 93,954
Colorado 1,067 378 1,391 1,645 2,795 56 3,105 26 143 45 320 11,019
Connecticut 937 286 1,124 910 1,567 41 2,194 23 111 31 249 7,516
Delaware 446 185 483 460 927 19 907 8 55 7 74 3,583
District of Columbia 580 141 483 573 866 31 919 22 77 20 196 3,967
Federated States of Micronesia 4 1 6 5 7 1 11 1 1 0 0 37
Florida 6,190 2,132 6,594 11,596 14,826 331 21,341 125 686 152 1,276 65,551
Georgia 2,654 1,261 2,351 4,076 6,056 147 9,550 63 228 103 678 27,286
Guam 8 4 6 11 20 3 21 0 2 1 1 77
Hawaii 198 97 311 485 594 10 777 6 29 7 44 2,571
Idaho 176 89 278 377 856 10 552 1 38 4 68 2,464
Illinois 2,679 798 2,654 3,505 5,786 148 6,124 52 371 88 795 23,112
Indiana 730 330 785 1,276 2,291 42 1,674 26 190 26 375 7,792
Iowa 248 123 436 451 1,049 16 533 18 73 12 133 3,102
Kansas 333 149 475 535 1,210 20 686 10 64 15 99 3,625
Kentucky 464 252 518 853 1,746 25 1,087 10 118 11 204 5,313
Louisiana 585 326 543 1,282 2,491 40 1,424 12 194 21 182 7,132
Maine 232 86 415 256 544 8 644 10 29 12 98 2,344
Marshall Islands 3 3 6 3 11 0 9 0 0 0 1 36
Maryland 2,123 847 2,218 2,624 4,382 116 7,034 68 355 55 576 20,549
Massachusetts 1,849 407 1,921 1,484 2,400 112 3,621 43 172 54 565 12,685
Michigan 1,714 642 1,633 2,120 4,336 93 6,095 51 316 66 676 17,807
Minnesota 838 230 965 865 1,795 62 2,339 24 135 32 333 7,662
Mississippi 316 238 289 533 1,063 19 695 9 102 10 82 3,368
Missouri 763 433 896 1,209 2,828 50 2,399 27 169 34 397 9,248
Montana 84 43 146 196 400 4 239 4 20 8 48 1,201
Nebraska 232 90 303 245 743 12 463 5 50 11 98 2,262
23 MONTHLY COMPLAINT REPORT: AUGUST 2015
Ban
k ac
cou
nt
or
serv
ices
Co
ns
um
er
loan
Cre
dit
car
d
Cre
dit
re
po
rtin
g
Deb
t co
llect
ion
Mo
ney
tr
ansf
er
Mo
rtg
ag
e
Oth
er
fin
anci
al
serv
ices
Pay
day
lo
an
Pre
pai
d
Stu
de
nt
loan
s
To
tal
Nevada 777 280 795 1,272 2,252 46 2,062 18 141 28 160 7,877
New Hampshire 294 87 345 333 593 12 1,310 9 43 11 129 3,187
New Jersey 3,038 906 3,174 3,611 5,340 141 8,076 68 428 97 758 25,782
New Mexico 337 159 359 551 1,062 28 724 10 76 12 98 3,442
New York 5,611 1,347 6,521 7,288 8,746 349 11,095 158 326 167 1,556 43,377
North Carolina 1,867 875 2,012 2,838 4,328 115 5,449 59 304 50 421 18,406
North Dakota 47 24 69 127 230 2 90 3 6 2 27 628
Northern Mariana Islands 6 0 3 5 5 0 4 0 0 0 1 24
Ohio 2,105 947 2,562 2,498 5,848 120 5,202 56 375 79 863 20,750
Oklahoma 412 259 470 777 1,716 36 882 14 146 19 141 4,909
Oregon 809 251 862 988 2,073 37 2,187 20 104 31 254 7,659
Palau 1 1 1 3 1 0 4 0 0 0 0 11
Pennsylvania 2,993 953 2,788 3,542 5,989 130 5,801 73 407 86 1,070 23,945
Puerto Rico 209 77 247 446 314 7 289 7 4 1 23 1,648
Rhode Island 330 98 304 288 556 16 530 8 60 7 67 2,273
South Carolina 696 516 760 1,497 2,687 44 2,009 24 156 23 221 8,672
South Dakota 87 53 154 125 367 12 170 3 22 2 37 1,038
Tennessee 1,053 539 1,069 1,444 3,336 58 2,338 34 233 41 362 10,557
Texas 4,255 2,376 4,628 13,153 16,704 299 8,813 122 852 155 1,026 52,621
Utah 269 143 379 578 1,268 18 980 6 72 10 95 3,844
Vermont 136 53 166 143 220 6 314 3 14 7 57 1,122
Virgin Islands 23 3 25 33 35 1 38 1 3 0 2 165
Virginia 2,005 860 2,522 3,363 5,304 142 5,662 40 303 85 593 20,982
Washington 1,199 414 1,471 1,865 3,604 86 4,191 35 126 62 426 13,542
West Virginia 198 90 220 363 501 14 336 8 15 8 93 1,868
Wisconsin 698 320 1,141 957 2,315 50 1,956 17 163 42 302 8,012
Wyoming 45 33 70 121 251 4 145 3 20 1 27 730
U.S. Armed Forces – Americas 11 1 5 0 22 1 5 2 0 2 2 52
U.S. Armed Forces – Europe 28 12 21 47 49 2 58 1 0 2 14 235
U.S. Armed Forces – Pacific 12 5 27 24 70 1 38 0 1 0 6 184
Unspecified 2,621 528 2,678 2,543 5,166 350 3,463 128 442 64 333 18,811
Total 69,053 26,107 75,563 105,477 171,267 4,275 187,916 1,853 9,991 2,371 19,468 677,182
24 MONTHLY COMPLAINT REPORT: AUGUST 2015
Visit our Consumer Complaint Database at consumerfinance.gov/complaintdatabase to search,
sort, filter, and export complaints.
Visit consumerfinance.gov/complaint to learn about how we handle complaints or to submit a
complaint.


